Earnings calls continued this past week, including from companies such as Cummins, TFI International, BP Amoco PLC, DuPont De Nemours Inc., The Walt Disney Company & more.
There was also a lot of activity coming from Federal Reserve speakers all week, which challenged the recent dovish interpretations of their announcements so far this year.
SPY, the SPDR S&P 500 ETF declined -1.05% during a volatile week for stocks, which compared to the other indexes shows large cap stocks were the most favorable losers.
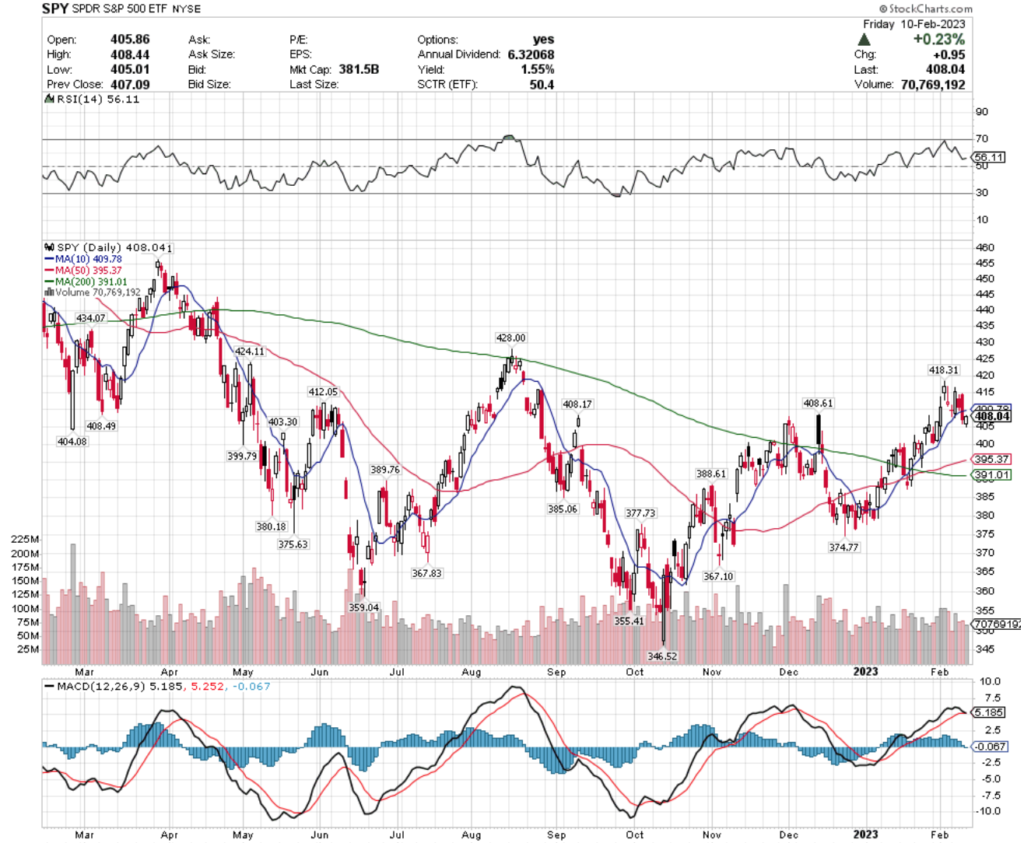
SPY will test their $404.08 & $403.30/share support levels this week, with a last chance effort to stay in the $400’s coming from their $399.79 support.
The $408-9 price zone is acting as a strong resistance zone, which looks difficult to break through in the near-term.
QQQ, the Invesco QQQ Trust ETF declined -2.12% last week, due to data from the earnings calls of the week, as well as for newly revived fears in the Fed’s rate hiking’s impact on technology stocks.
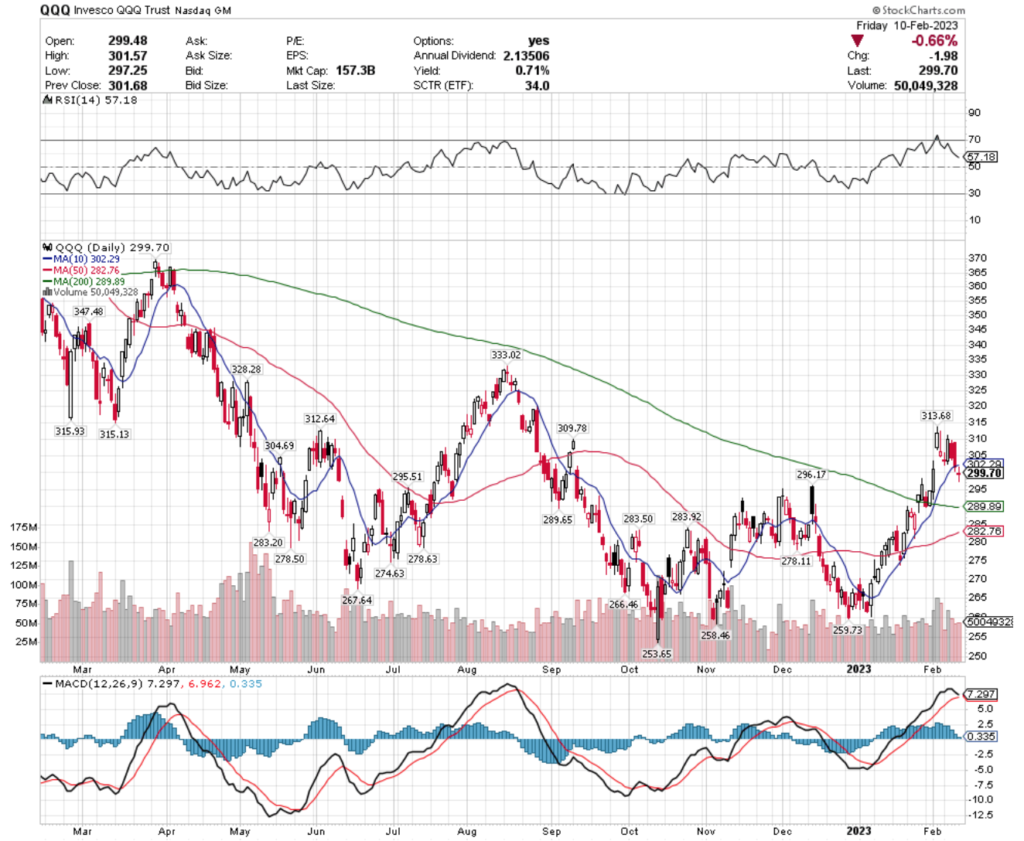
Their near-term support levels include $296.17, $295.51, $289.89, $289.65 & a support zone in the $283-4 range, while they have resistance at the $302.29 & $304.69/share level.
IWM, the iShares Russell 2000 ETF fell -3.39% this past week, showing the weakest performing names in the week were smaller cap stocks.
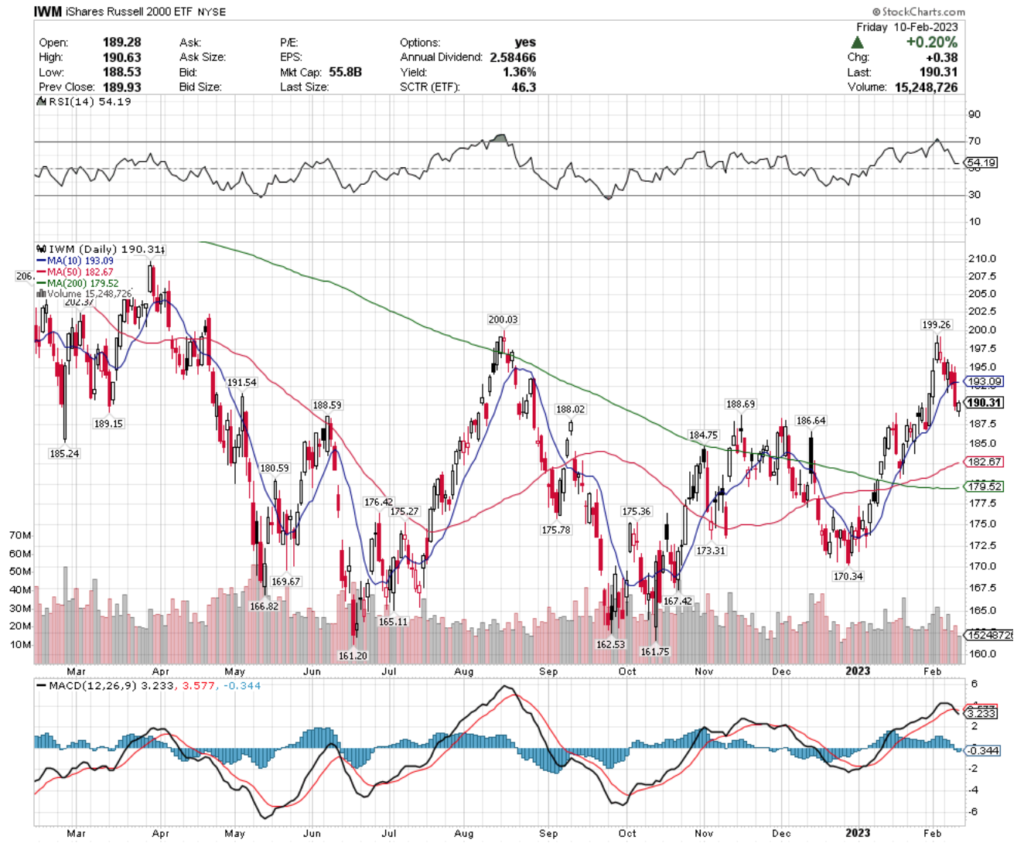
Their resistance levels of $191.54 & $193.09 will be tested this week, with support at the $189.15 & multiple touch-points in the $188-9 zone.
Let’s dive into some of the best & worst performing sectors & geo-locations by ETF.
Aerospace & Defense (DFEN), U.S. Oil Equipment & Services (IEZ), Gaming (BJK) & Semiconductors (SOXX) All Bullishly Leading The Market
DFEN, the Direxion Daily Aerospace & Defense Bull 3X Shares ETF has climbed 8.83% over the past year, with a remarkable 90.12% of gains since their low in September 2022.
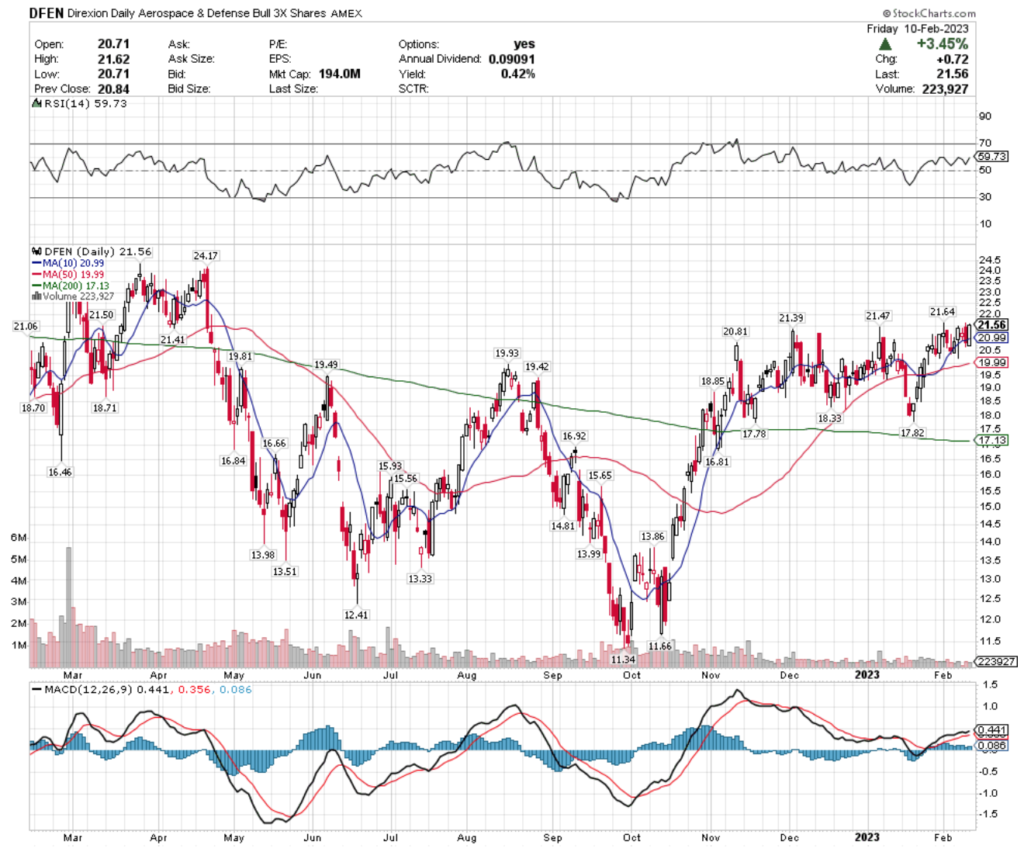
They’ve spent the last couple of months consolidating, with the $21.64 resistance level looking set to be tested this week.
Their MACD & RSI are both signaling near-term declines, with all eyes set to look at how they behave when meeting the $21.50 & $21.47/share support levels.
With such a low yield, it appears best in the near-term to wait for an entry into this name.
IEZ, the iShares U.S. Oil Equipment & Services ETF has gained 44.17% over the past year, gaining 70.62% from their low in July of 2022.
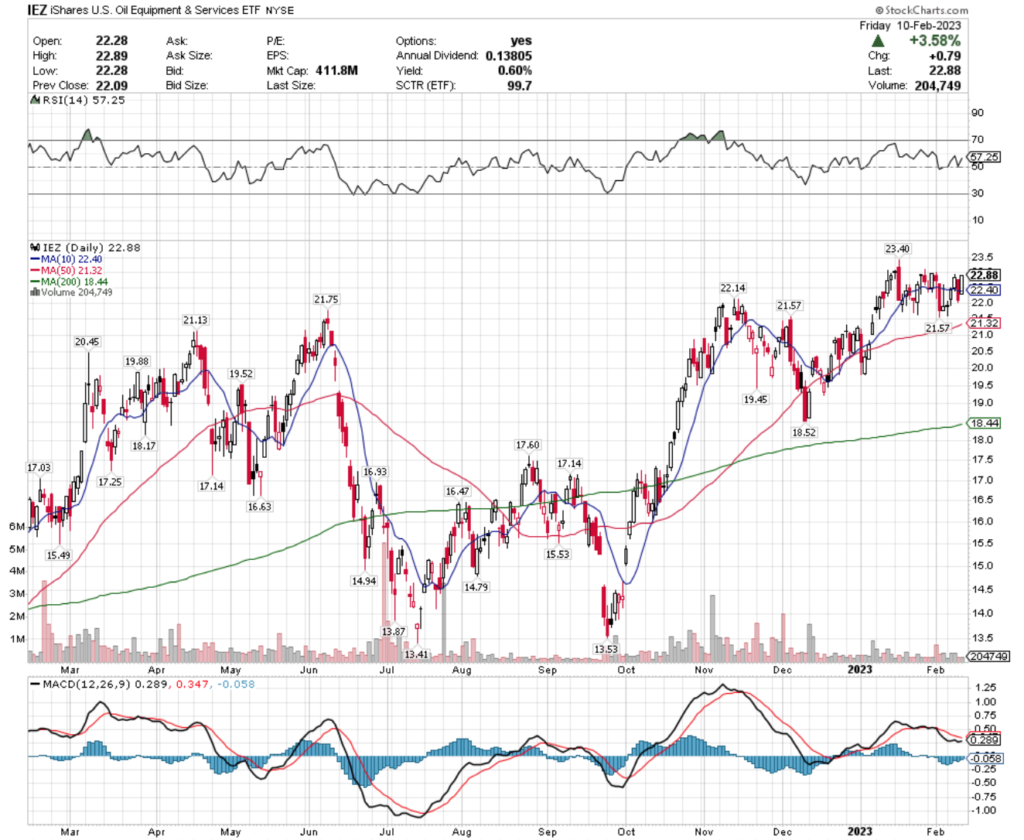
Their MACD has been bearish for the last few weeks, as they have also been in a consolidation period.
IEZ’s dividend is not much in terms of providing a cushion for investors & their only resistance for the last 52 weeks is $23.40, signaling that they are primed to cool down in the near-term.
Before entering or adding to a position, it would be best to see how their support levels of $22.40 & $22.14 hold up.
BJK, the VanEck Vectors Gaming ETF has declined ~1% over the past year, but has staged a 37.88% rebound from their lows of September 2022.
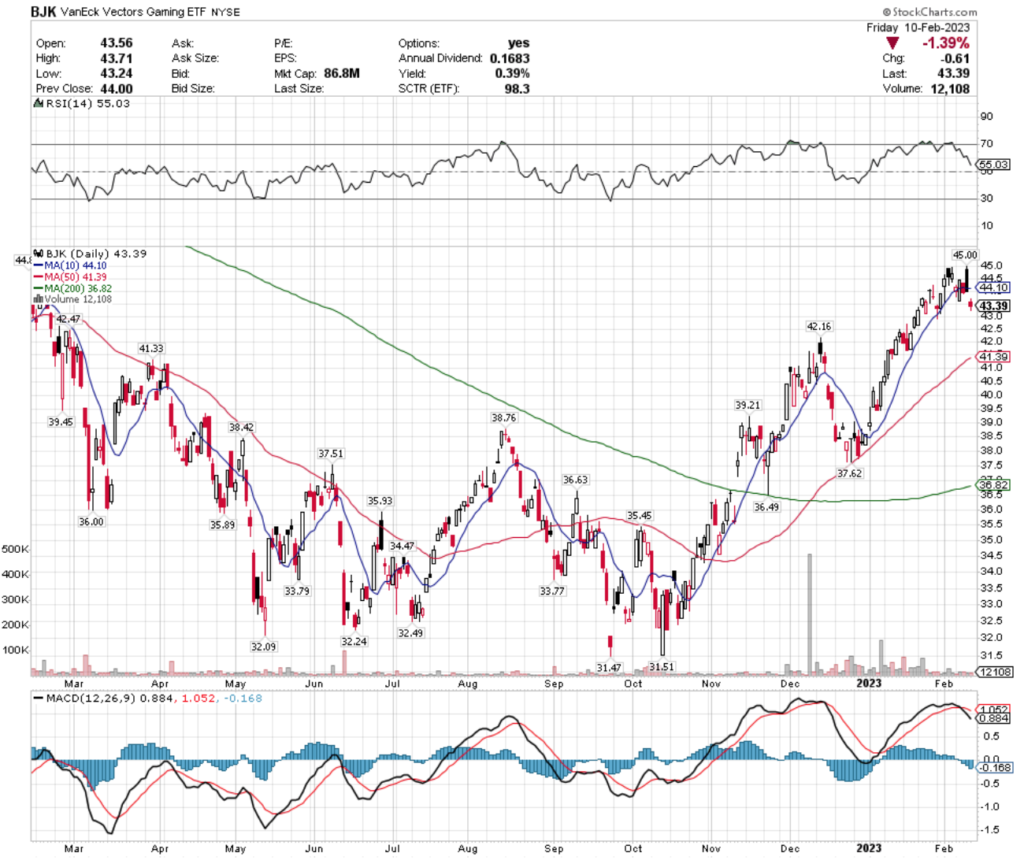
They too have limited resistance overhead from the past year, with only the $44.10 & $45 price levels for resistance.
However, BJK’s MACD & RSI have been in bearish decline, and their most recent gap down day looks to be adding more downward momentum.
BJK’s dividend is quite low, making it imperative to wait to see how they behave at their $42.47, $42.16 & $41.39 support levels before entering or adding to a positon.
SOXX, the iShares Semiconductor ETF has declined -13.75% over the past year, but has gained 45.47% since hitting their low of October 2022.
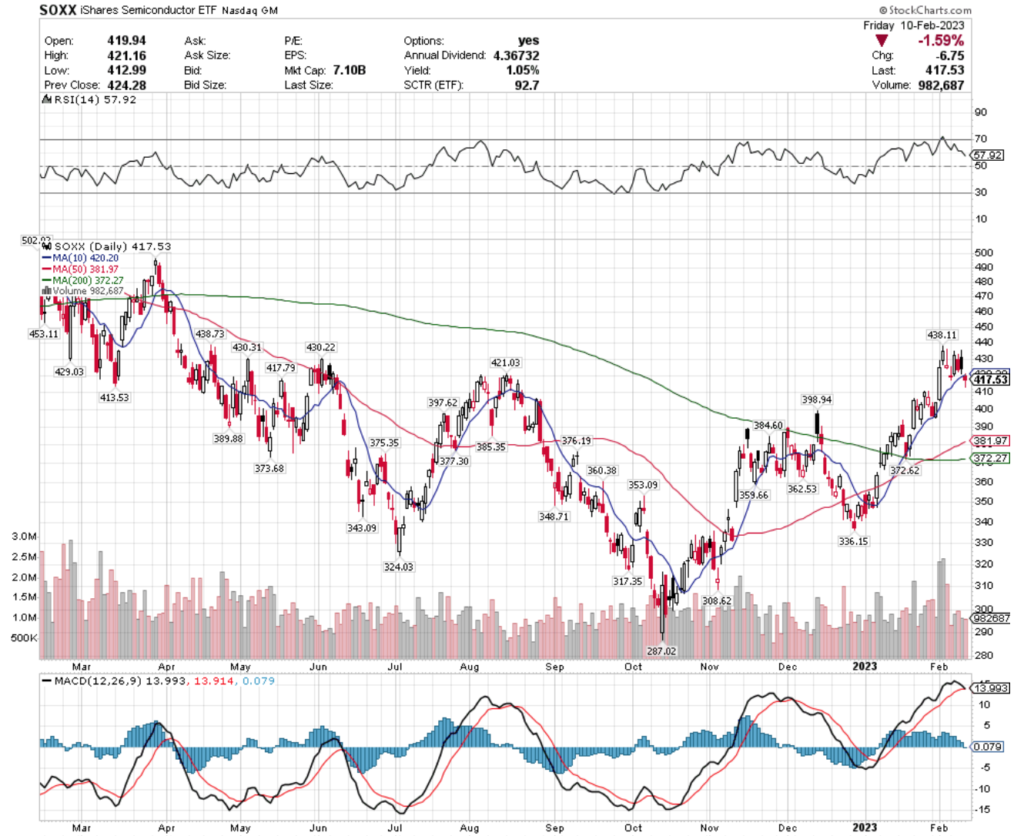
Their MACD just completed a bearish crossover, and their RSI is still above 50 (neutral), signaling that this may have a lot of room to run downward in the coming weeks.
With only a 1% cushion in form of a dividend & resistance at $417.79 & the 10 day moving average $420.20, it would be wisest to make options trades around SOXX, while waiting to see how their $413.53 support holds up in the near-term.
Real Estate (DRN), Short Emerging Markets (EUM), TIPS Bonds (TIP) & Latin America 40 (ILF) Are All Bearishly Lagging The Market
DRN, the Direxion Daily Real Estate Bull 3X Shares ETF has declined -43.39% over the past year, although they have managed to gain 67% from their low in October 2022.
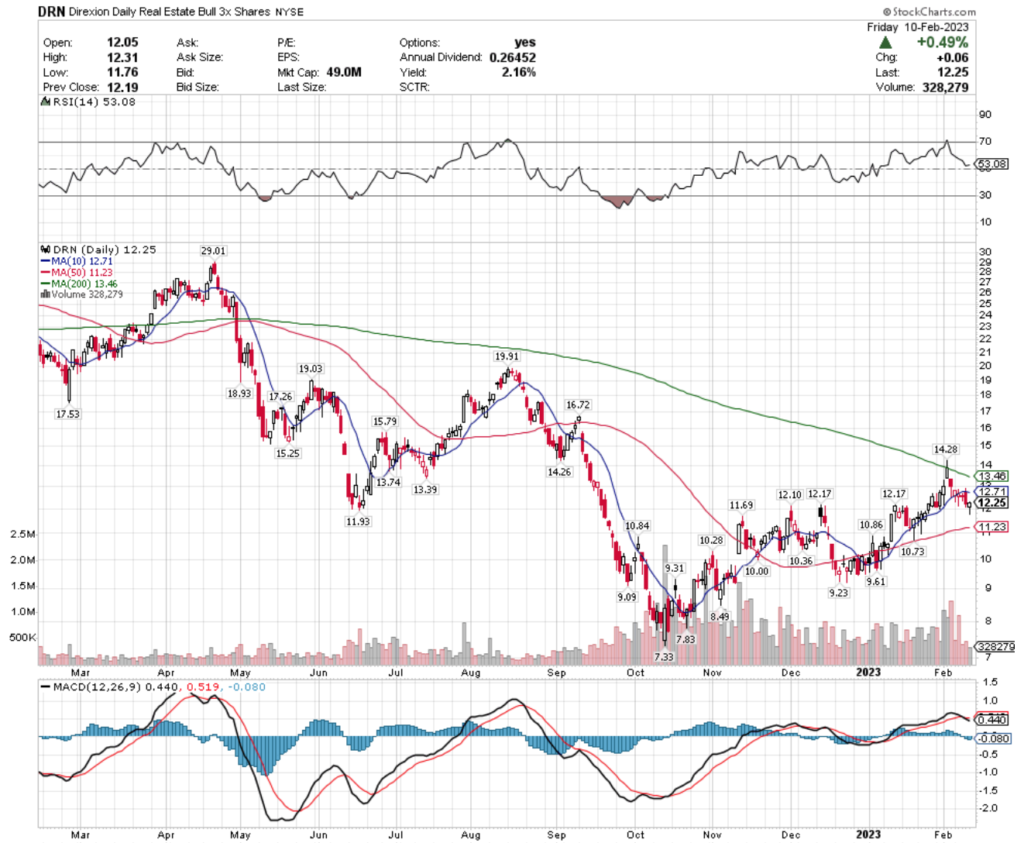
Last week’s bearish MACD crossover signals more near-term declines, however they do offer a 2% yield to cushion holders of the ETF for a year by 2.16%.
There are multiple touch-points at the $12.17 support level, as well as support at $12.10, which is what investors & traders should be eyeing to see how DRN behaves at these levels.
EUM, the ProShares Short Emerging Markets ETF has gained 16% over the past year, but has fallen -17.5% from their high in October 2022.
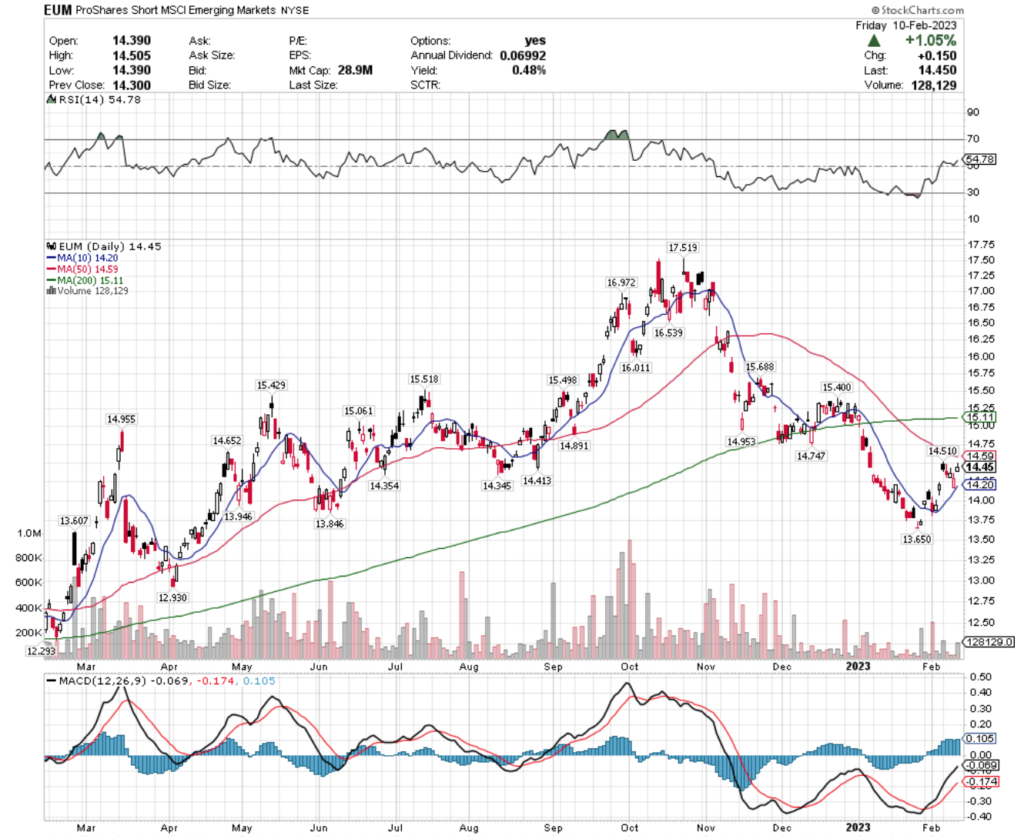
Their RSI is still neutral, but their MACD is beginning to roll over bearishly.
EUM has support at $14.41, as well as multiple touch-points at the $14.35/4 price level, which should be tested in the coming week.
TIP, the iShares TIPS Bond ETF has fallen -7.56% over the last year, with a -11.9% decline from their high in March of 2022.
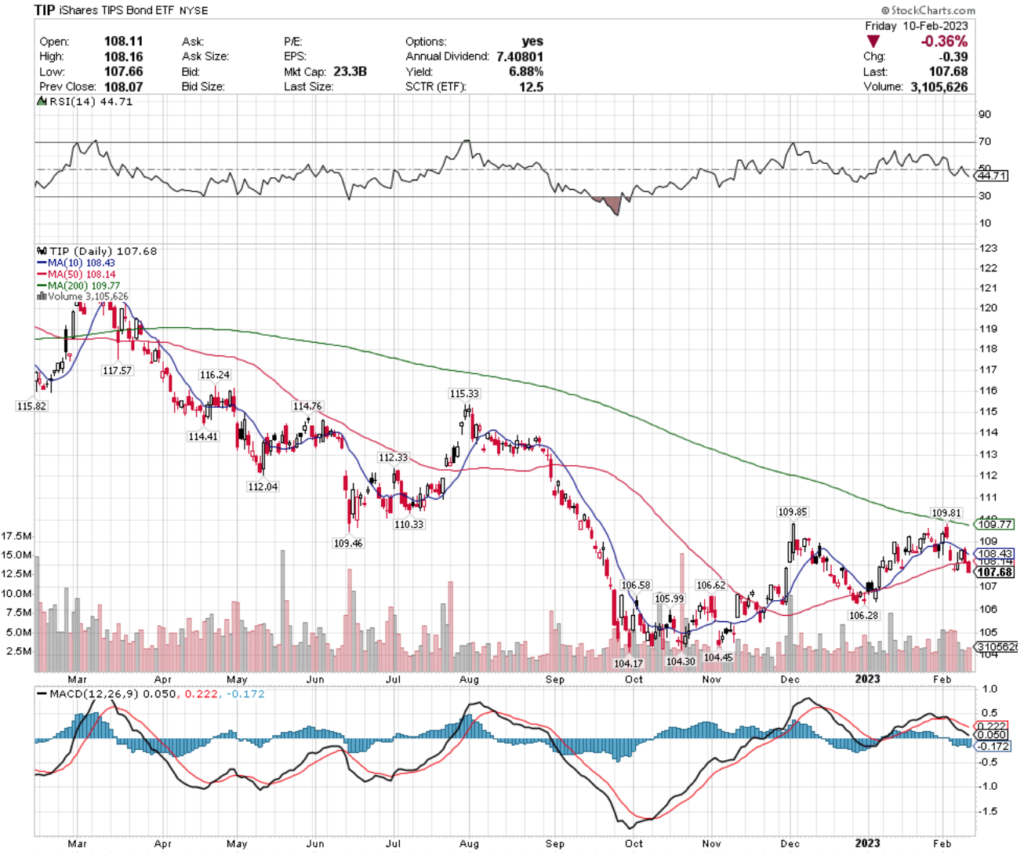
Their MACD has been bearish for over a week, and they offer a 6.88% dividend as a cushion for investors who hold their shares for a year or longer.
TIP’s $106.62, $106.58 & $106.28/share support levels will be in focus in the coming weeks.
ILF, the iShares Latin America 40 ETF has gained 2.27% over the past year, but has fallen -13.44% since their high in March 2022.
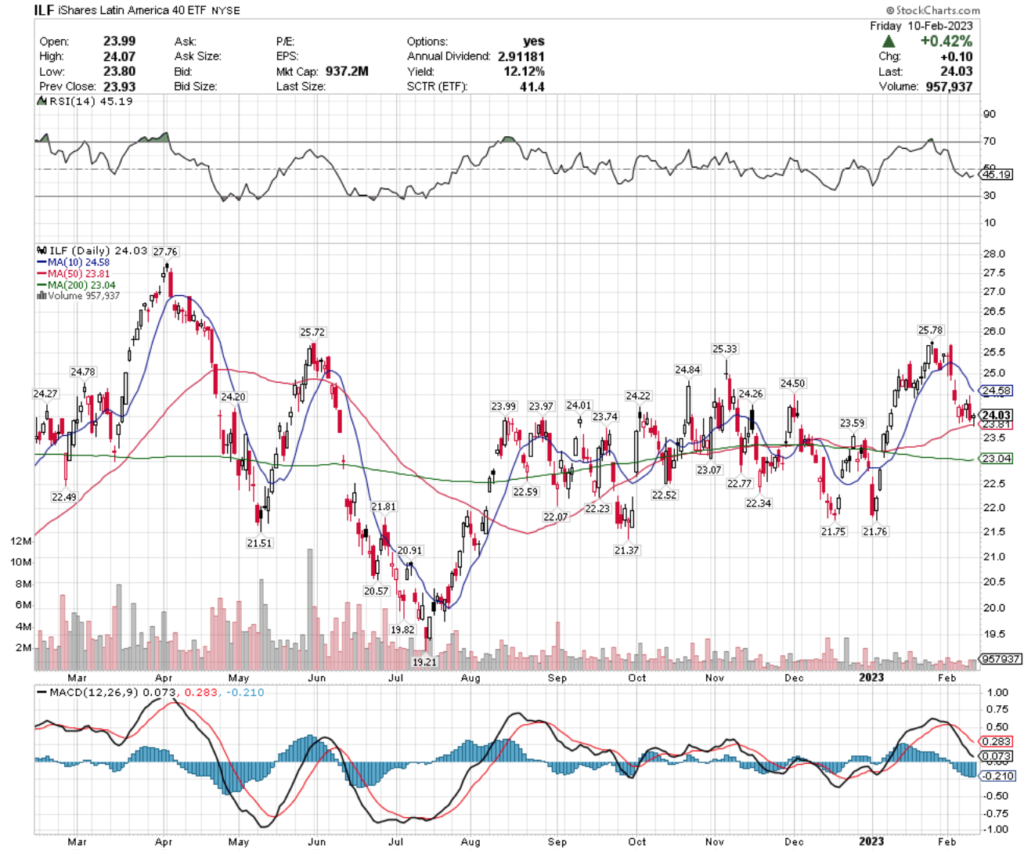
Their dividend of 12% offers a supportive cushion for long-term holders, but their near-term indicators all signal more near-term declines are in store.
ILF has support at the $24.01, $23.81 &$23.74/share price levels, which are where traders & investors should be watching in the coming weeks.
Tying It All Together
This week we will continue to hear more earnings calls from companies, including Marriott, CocaCola, Cisco, Kraft Heinz, Ryder, Shake Shack & John Deere.
Tuesday we will hear the CPI numbers, followed Wednesday by the Retail Sales numbers, Empire State Manufacturing Index, Industrial Production Index, Capacity Utilization Rate, NAHB Home Builder’s Index & Business Inventories numbers.
Thursday brings additional housing numbers, including Building Permits & Housing Starts, as well as the Philadelphia Fed Manufacturing Survey, Household Debt (SAAR), Producer Price Index Final Demand & the usual jobless numbers.
Friday will show the Import Price Index & Index of Leading Economic Indicators numbers, to conclude a busy week in data.
Last week set the stage for slowing momentum in markets, let’s see what this week brings!
*** I DO NOT OWN SHARES OF OR OPTIONS CONTRACTS FOR SPY, QQQ, IWM, DFEN, IEZ, BJK, SOXX, DRN, EUM, TIP or ILF AT THE TIME OF PUBLISHING THIS ARTICLE ***