SPY, the SPDR S&P 500 ETF gained +1.06% over the past week, as a week dominated by bank crisis headlines & data points provided a volatile trading week for stocks.
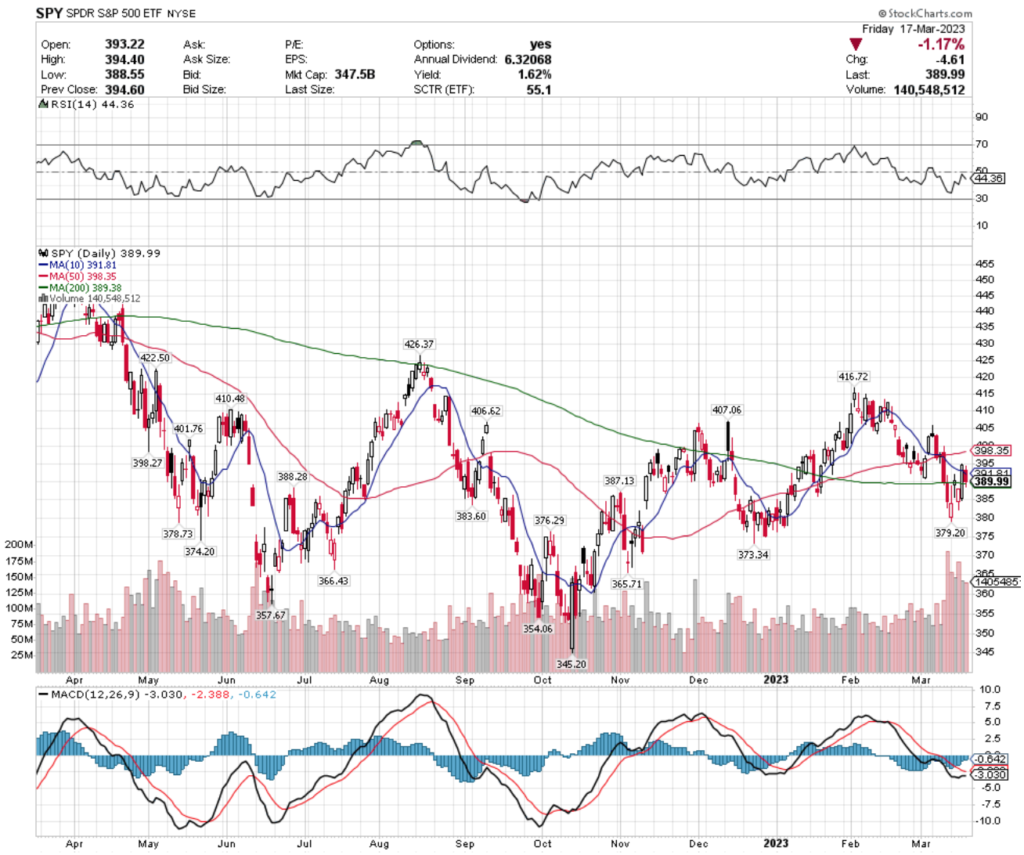
The individual candlesticks of the week look as though the market spent much of the week expecting a dovish Federal Reserve announcement this upcoming week, only to be brought back to reality Friday where Thursday’s high’s were not touched.
SPY’s RSI is between neutral & oversold at 44, and all eyes will be on their MACD, as it has flattened out & looks ready to cross over bullishly next week, after a week of heavier than average trading volume.
SPY has support at the $389.38 (200 day moving average),$388.28, $387.13 & $383.60/share price levels, which will be important to watch this week.
Their nearest resistance levels are at the $391.81 (10 day moving average), $398.27, $398.35 (50 day moving average) & $401.76/share price levels.
QQQ, the Invesco QQQ Trust ETF that tracks that NASDAQ gained +6.26%, as traders & investors adopted a more dovish Federal reserve sentiment which would benefit the technology heavy NASDAQ, while others piled in to add additional momentum leading to its outperformance of the other index ETFs this week.
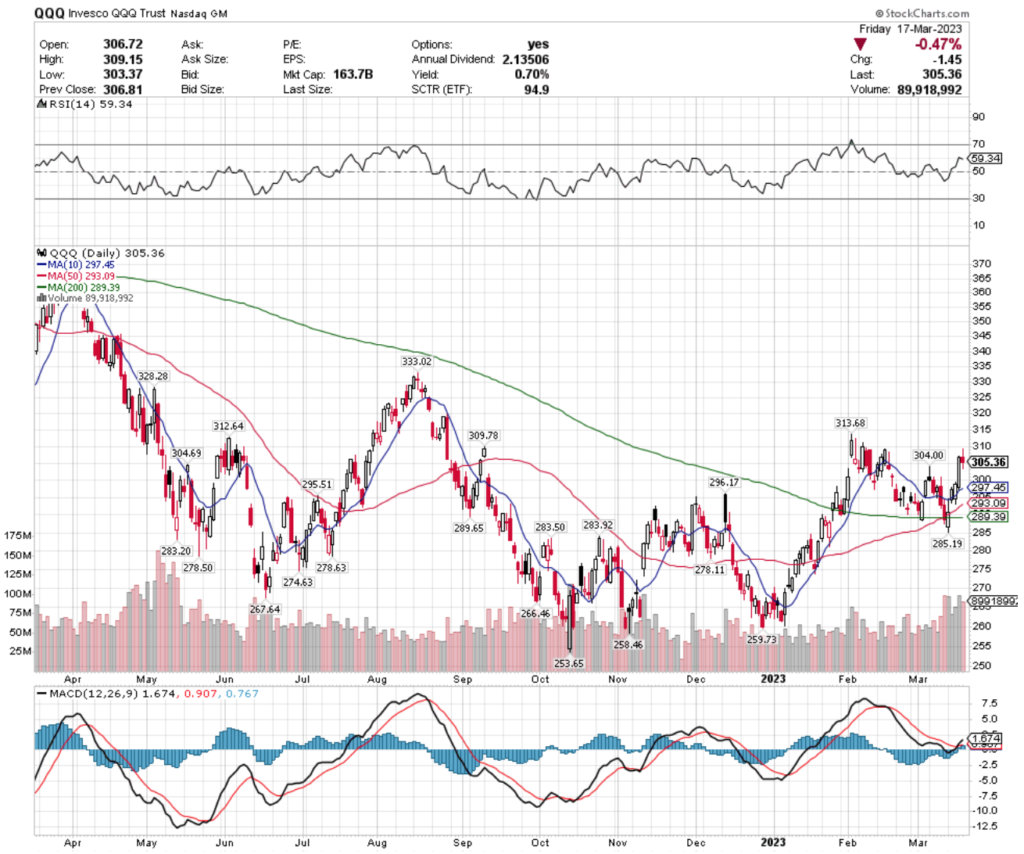
While Friday’s candlestick’s shadow went above Thursday’s high, it does not show much strength & conviction behind the week’s movement.
QQQ’s RSI is between neutral & overbought at 59, and their MACD bullishly crossed over during the past week, trading on above average volume compared to the year prior.
QQQ has support at $304.69, $304, $297.45 (10 day moving average) & $296.17/share, with resistance at $309.78, $312.64 & $313.68/share.
IWM, the iShares Russell 2000 ETF lost -2.81%, as small caps were outperformed by larger cap stocks.
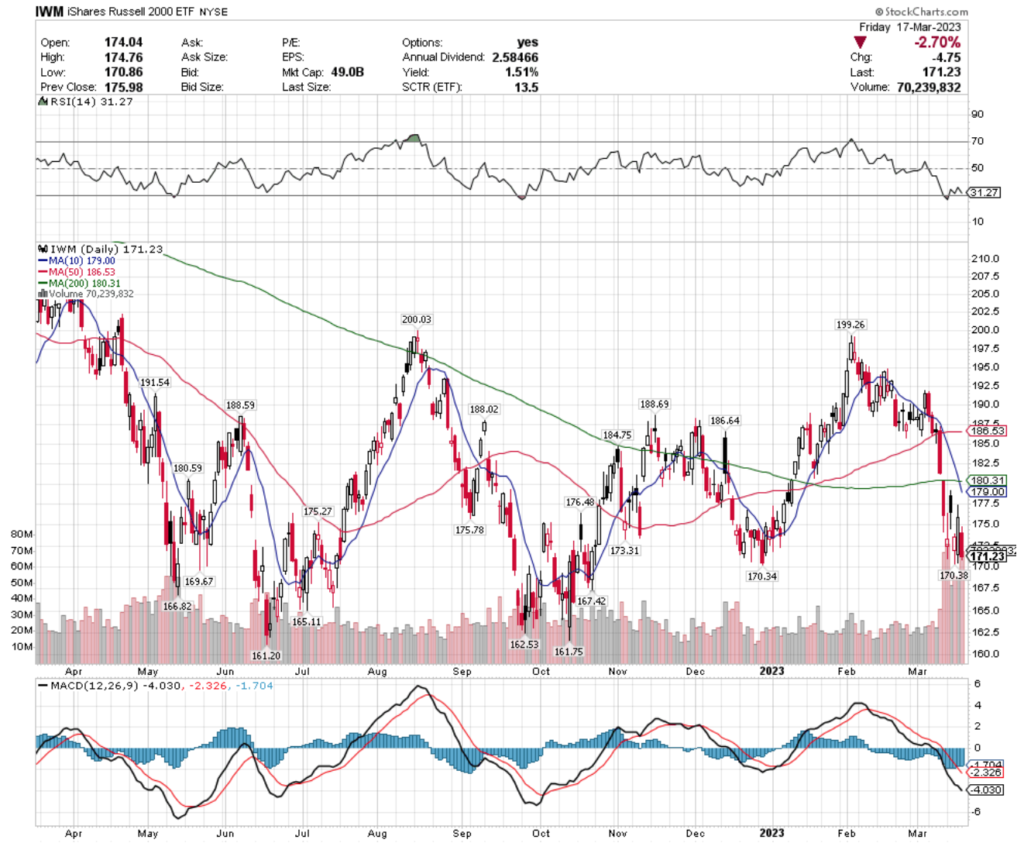
Their trading volumes were higher than average compared to the year prior, and their RSI is about to slip into oversold territory at 31 as their MACD is in freefall downward.
IWM’s support levels of $170.38, $170.34, $169.67 & $167.42 will be important to watch this upcoming week & their resistance levels overhead are the $173.31, $175.27, $175.78 & $176.48/share price levels.
Let’s dive into some of the top & bottom performing sectors & geo-locations based on this week’s technical rating data!
Turkey (TUR), Technology (XLK), Video Games & eSports (ESPO) & Spain (EWP) Are All Bullishly Leading The Market
TUR, the iShares MSCI Turkey ETF has gained +85.74% over the past year (ex-distributions), and is +98.25% from their low in July 2022.
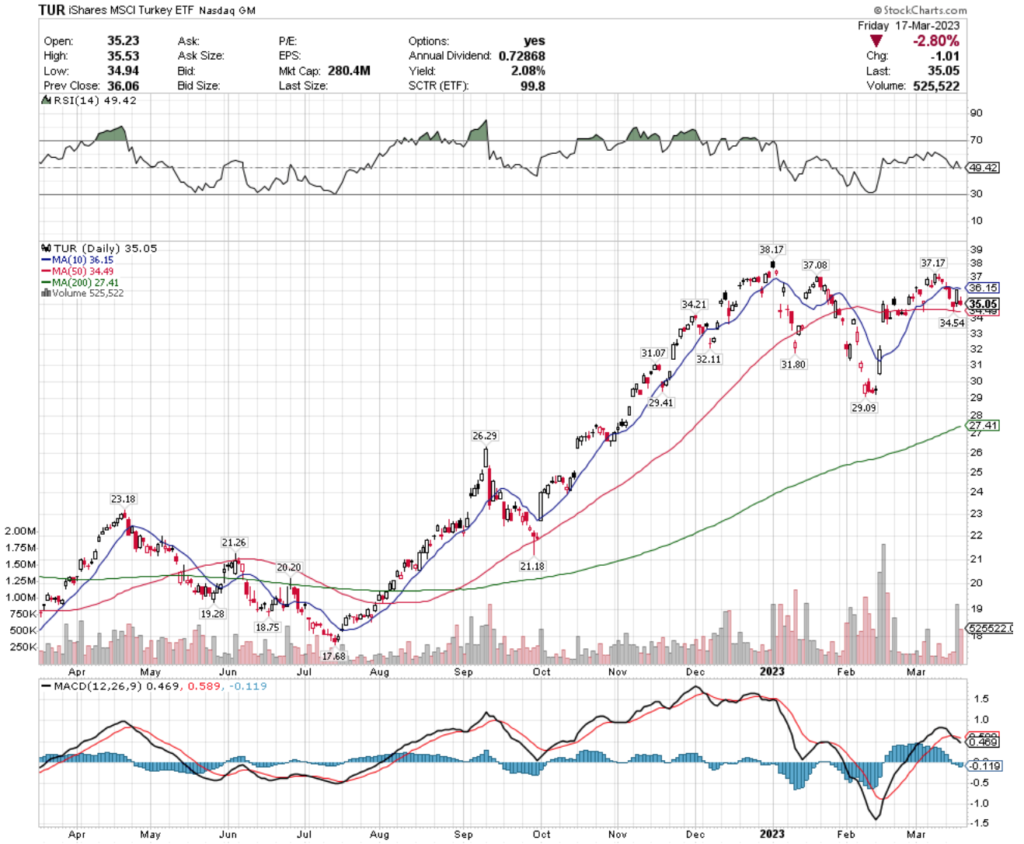
Long-term holders receive an extra 2.08% as additional distribution yield if they hold the ETF for one year.
Recent trading volumes for TUR have been volatile, after experiencing two gap ups in February 2023 & fluttering around in consolidation for most of the time since & their RSI is neutral.
Their recent bearish MACD crossover signals that there will be further consolidation in the near-term, which provides opportunities for long-entries or for options traders to profit from volatility in their price.
TUR has support at the $34.54, $34.49 (50 day moving average), $34.21 & $32.11/share price levels, with overhead resistance at the $36.15, $37.08, $37.17 & $38.17 (52 week high)/share price levels.
XLK, the Technology Select Sector SPDR Fund ETF has lost -4.33% from one year ago, but has rebounded +27.35% since their low of October 2022 (ex-distributions).
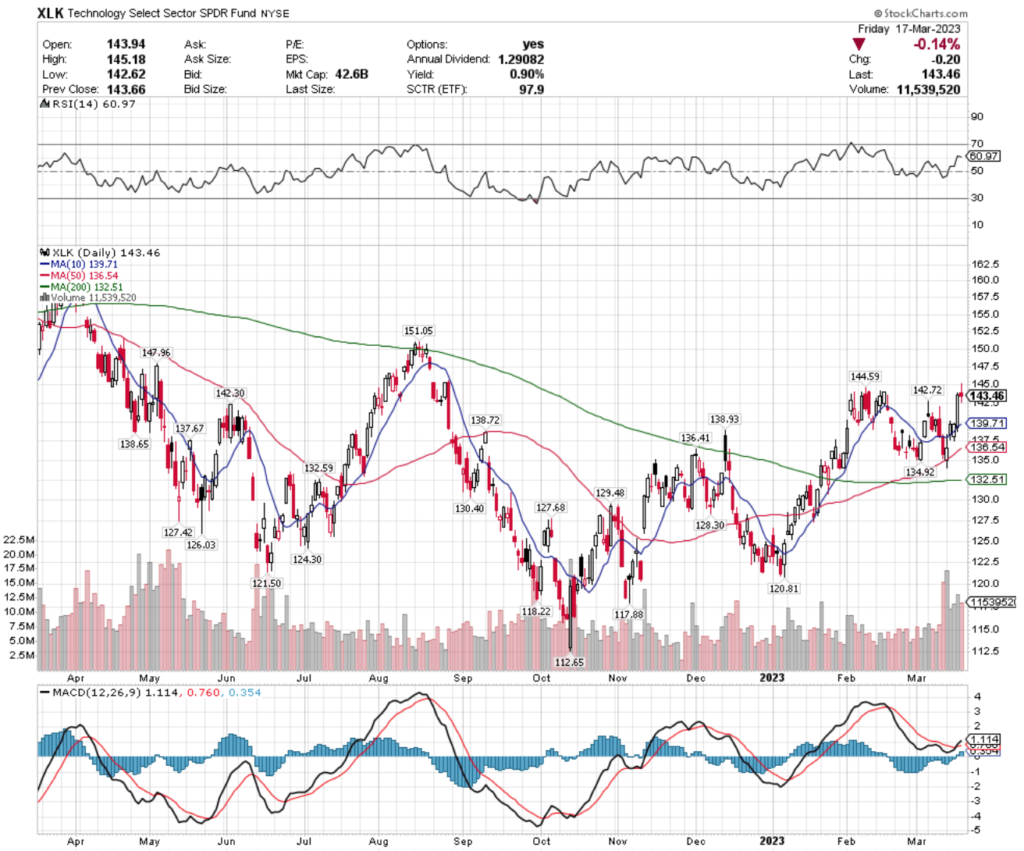
Their recent trading volumes have been above average compared to the year prior, but their RSI is approaching overbought territory as it draws nearer to 70.
XLK recently had a bullish MACD crossover, but investors & traders would be wise to wait to see how they react to the $144.59 resistance level before entering a position, as their 0.9% annual distribution yield does not provide much cushion for support.
There are opportunities for options traders to profit from the price movements in XLK during this time.
XLK has support at the $142.72, $142.30, $139.71 (10 day moving average) & $138.93/share price levels, with resistance at the $144.59, $147.96 & $151.05/share levels.
ESPO, the VanEck Vectors Video Gaming & eSports ETF has lost -13.18% over the past year, but has bounced back +30.82% since their low in October 2022 (ex-distributions).
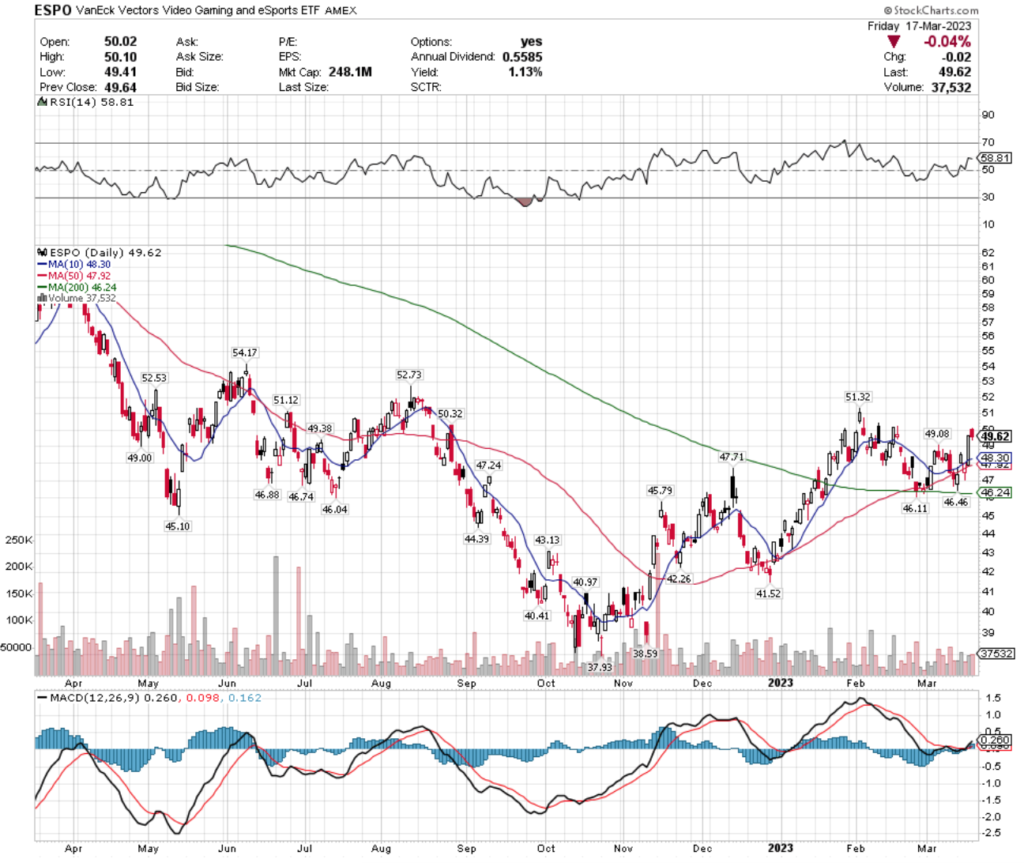
Their RSI is neutral & recent trading volumes have been below average compared to the previous year, but they have had a bullish MACD crossover within the past week.
With a 1.13% distribution yield as a cushion, long positions may be best to wait on establishing until we see how they react to their resistance levels, but options traders have opportunities for near-term profits.
ESPO has support at the $49.38, $49.08, $49.00 & $48.30 (10 day moving average) price levels, with resistance overhead at the $50.32, $51.12, $51.32 & $52.53/share price levels.
EWP, the iShares MSCI Spain Capped ETF has gained +5.96% over the past year, gaining +35.83% from their low in October 2022 (ex-distributions).
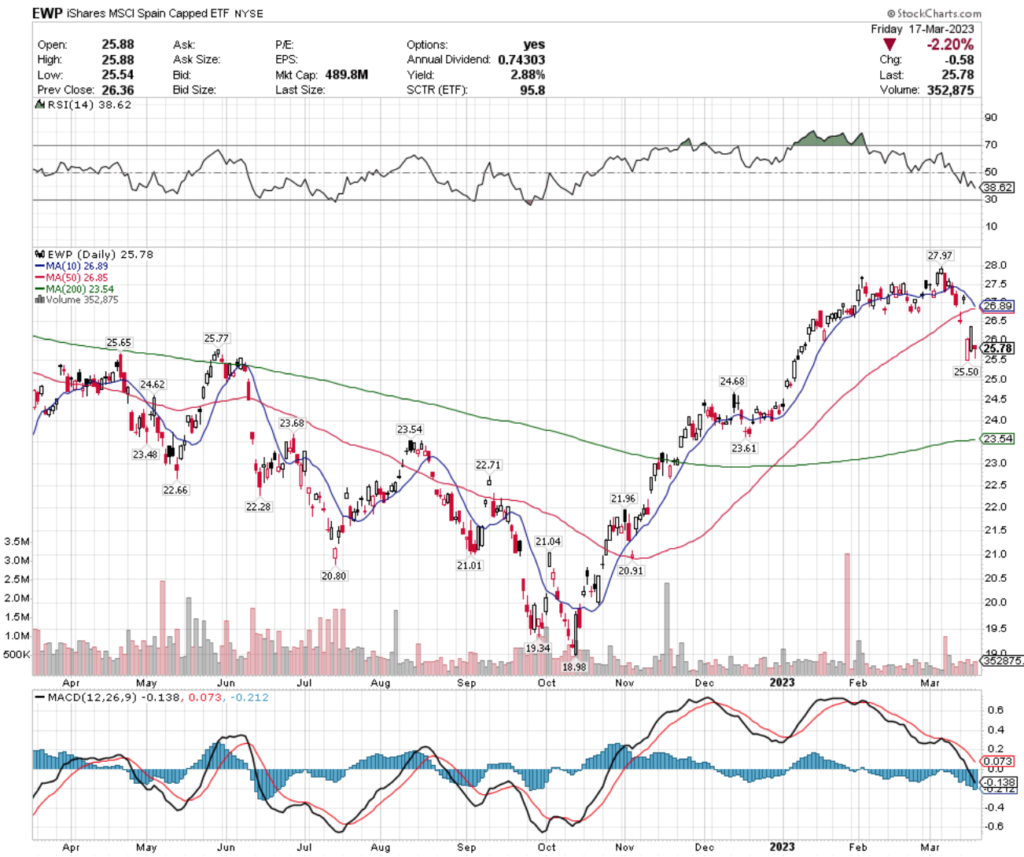
After a gap down earlier this past week their RSI is dove down to nearing oversold territory (<30 level) & their MACD has turned bearish, all on lighter than average trading volumes.
EWP offers a 2.88% distribution yield for long-term holders annually, but unless trading options, it appears best to wait & see how they behave around their other, older gaps & support levels in wake of this recent decline.
EWP has support at the $25.77, $25.65, $25.50 & $24.68/share price levels, with resistance at the $26.85 (50 day moving average), $26.89 (10 day moving average) & $27.97/share price levels.
Real Estate (DRN), Cannabis (POTX), Energy (ERX) & South Korea (KORU) Are All Bearishly Lagging The Market
DRN, the Direxion Daily Real Estate Bull 3x Shares ETF has dropped -61.31% over the past year, falling -67.97% from their 52 week high in April of 2022 (ex-distributions).
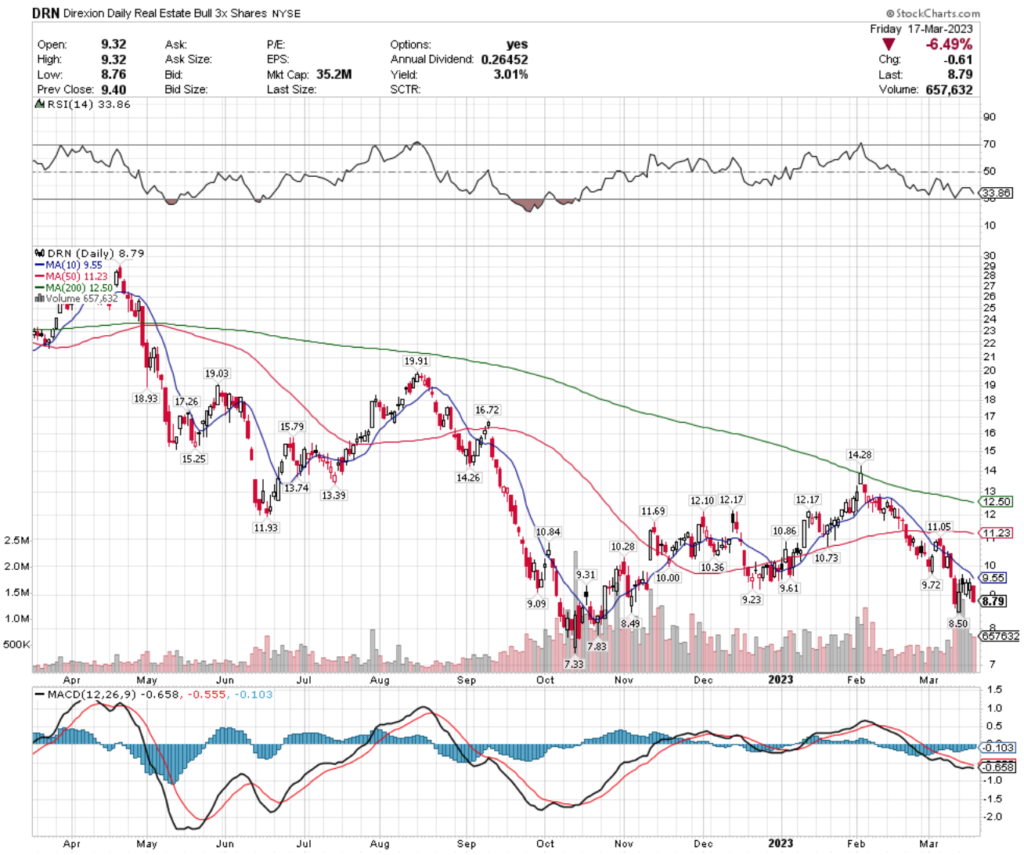
Their recent trading volumes have been above average & their RSI is approaching oversold territory.
DRN’s MACD is beginning to flatten out due to a week of consolidation after their most recent move downwards, and they offer a 3.01% distribution yield for long-term holders.
However, some addition protection from put options may be wise to have in the near-term.
DRN has support at the $8.50, $8.49, $7.83 & $7.33/share price levels, with overhead resistance at the $9.09, $9.23, $9.31 & $9.55 (10 day moving average).
POTX, the Global X Cannabis ETF has lost -67.26% over the past year, including a -74.57% from their 52 week high in March of 2022 (ex-distributions).
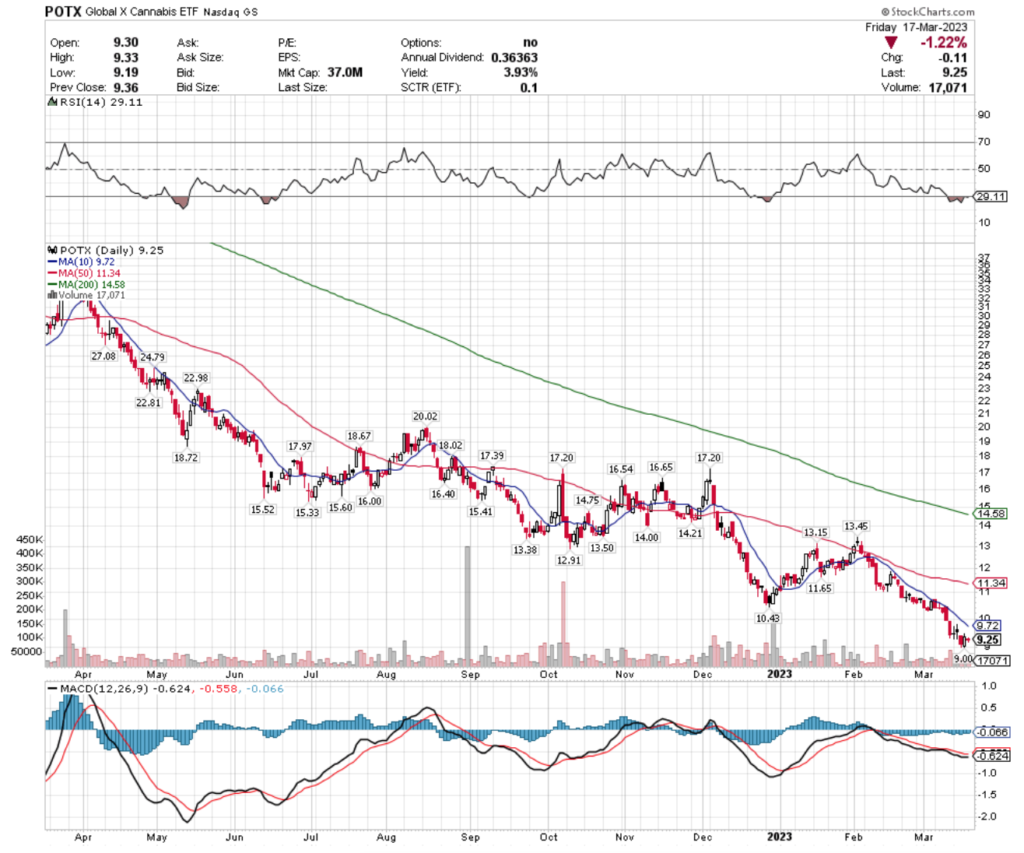
They’ve seen a steady decline over the past year & as a result their RSI is in oversold territory.
Their MACD has also been in a smooth downtrend since the beginning of February, with trading volumes being relatively average compared to the year prior.
POTX only has support at the $9.00 price level for the past 52 weeks, and while they offer a 3.93% distribution yield as a cushion to long-term holders of 1 year+, it would be wisest to trade options until there is more price stability, using the profits to enter a long-term position once they’ve stabilized more.
POTX has resistance at the $9.72 (10 day moving average), $10.43, $11.34 (50 day moving average) & $11.65/share price levels.
ERX, the Direxion Daily Energy Bull 2x Shares ETF has lost -0.46% over the past year, dropping -36.55% from their 52 week high in June 2022 (ex-distributions).
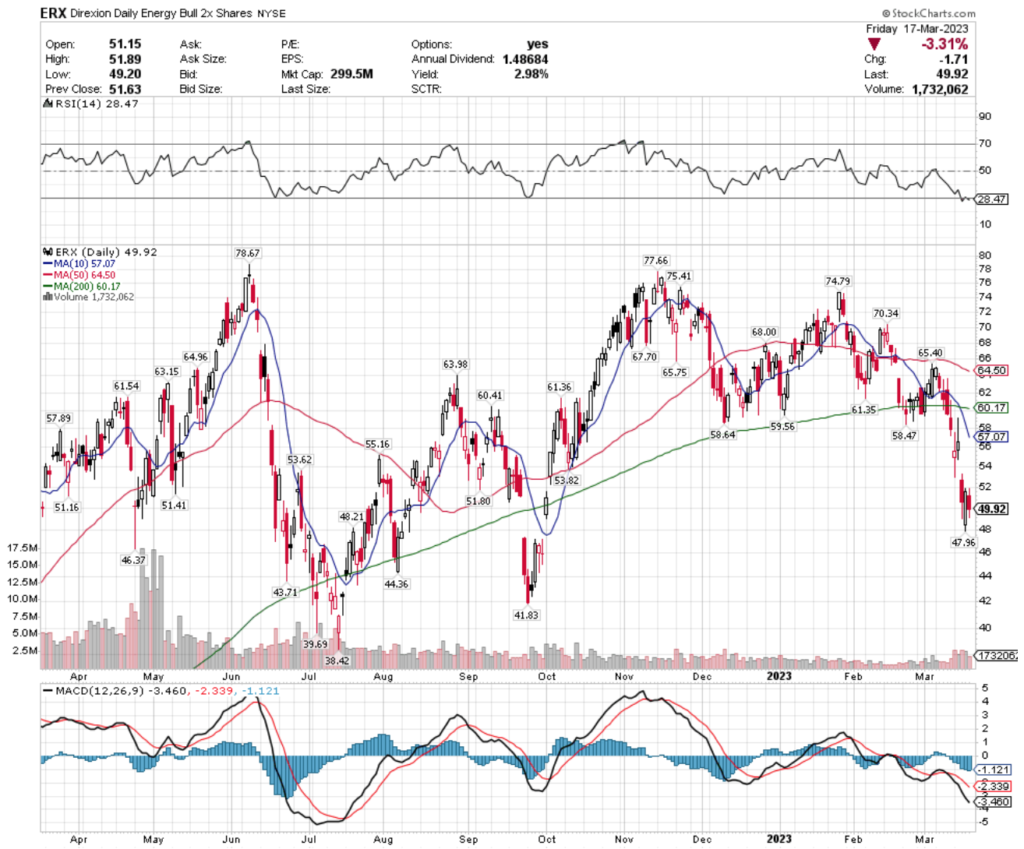
A decline throughout March 2023 has led their RSI into oversold territory, with their MACD also being in a downtrend.
Recent trading volumes have been below average, signaling that there is still uncertainty around their value & there will likely be more near-term volatility to come.
ERX’s 2.98% distribution yield provides some downside protection for long-term holders, but given where their support levels are in relation to gaps that need to be filled on the way down, the best approach to this name in the near-term is using an options strategy.
ERX has support at the $48.21, $47.96, $46.37 & $44.36/share price levels, with resistance at the $51.16, $51.41, $51.80& $53.62/share price levels.
KORU, the Direxion Daily South Korea Bull 3x Shares ETF has lost -56.47% over the past year, dropping -59.73% since their 52 week high in March of 2022.
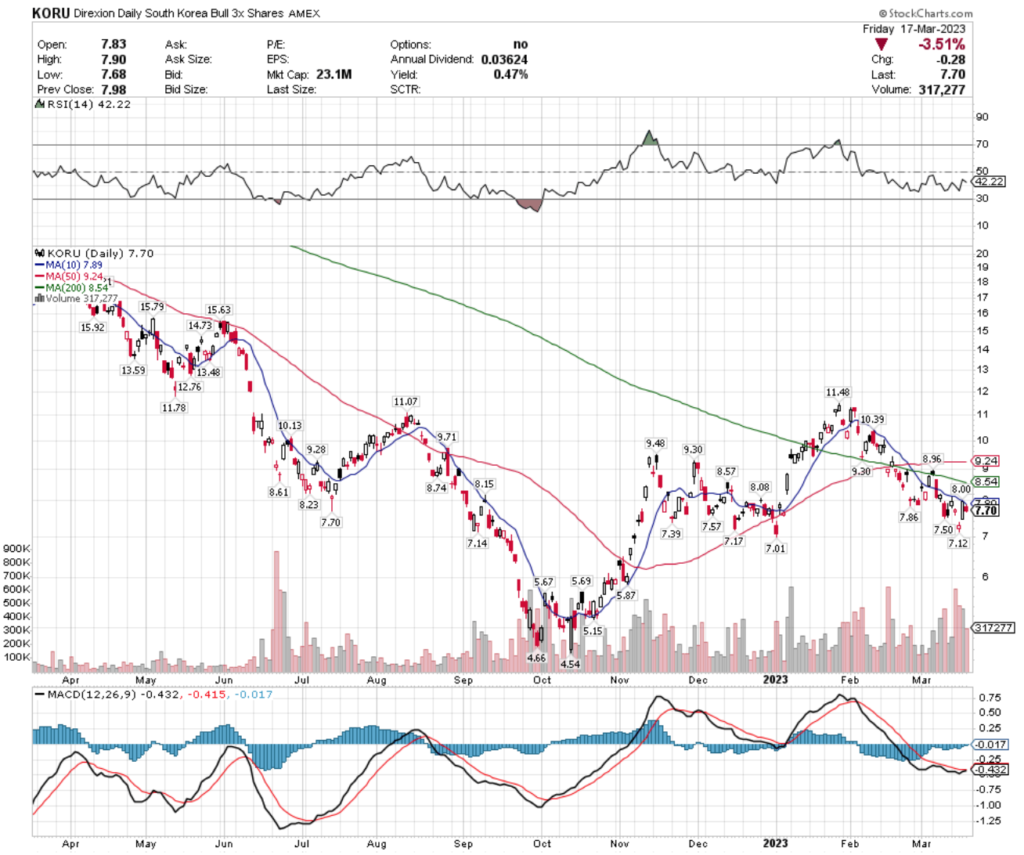
They’ve been declining for the better part of Q1 2023 on higher than average volumes compared to the year prior.
KORU’s RSI is midway between neutral & oversold, with their MACD about to make a bullish crossover, but resistance overhead signals that this may not be a sustainable upside move.
With limited cushion from their 0.47% distribution yield, waiting for a more solid entry time or using options to navigate the volatility would be the best strategy here.
KORU has support at the $7.70 (also their price level), $7.57, $7.50, $7.39 & $7.17/share price levels, with resistance at the $7.86, $7.89 (10 day moving average), $8.00 & $8.08/share price levels.
Tying It All Together
The week ahead promises to be interesting, mostly due to the Federal Reserve’s Interest-Rate Decision on Wednesday at 2pm.
Monday has no major data points to be reported, followed by Existing Home Sales at 10 am on Tuesday.
Wednesday we also get Fed Chairman Powell’s Press Conference after the interest-rate decision announcement.
Thursday we will head U.S. Current Account Data, as well as Initial Jobless Claims & Continuing Jobless Claims at 8:30 am, followed by New Home Sales data at 10 am.
Friday wraps up the week with Durable Goods data at 8:30 am, as well as S&P Global Flash U.S. Services & Manufacturing PMI data at 9:45 am.
We’ll still be dealing with the fallout of the SVB collapse, as well as how it is impacting other smaller banks, as well as getting more insight into the Credit Suisse situation.
It all promises to be nothing short of interesting.
See you back here next week!
*** I DO NOT OWN SHARES OR OPTIONS CONTRACT POSITIONS IN SPY, QQQ, IWM, TUR, XLK, ESPO, EWP, DRN, POTX, ERX or KORU AT THE TIME OF PUBLISHING THIS ARTICLE ***