I am still on vacation, so this week’s post will be more brief than previous weeks’ posts.
SPY, the SPDR S&P 500 ETF gained +1.97% this past week, mostly due to a gap up on Friday’s session.
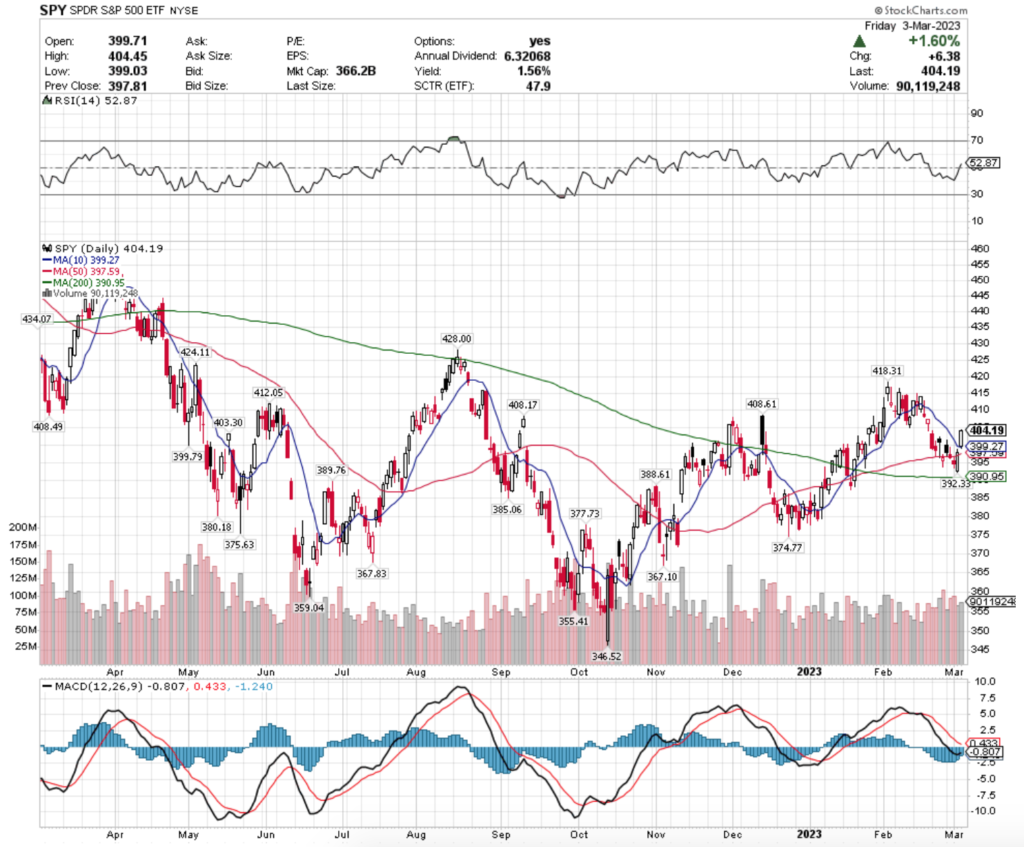
Their RSI is still neutral at ~53 & their MACD is beginning to curl in a bullish direction & recent volumes have improved, but remains about average.
It will be interesting to see how they hold up with support at $399.79, $399.27 (10 day moving average), $397.59 (50 day moving average), but it looks to be a volatile week ahead.
SPY has a lot of resistance in the $408 price-level zone ($408.17, $408.49 & $408.61), before jumping to $412.05.
QQQ, the Invesco QQQ Trust ET gained +2.68% this past week, gapping up stronger than SPY did on Friday’s session, although their volume has been more average than SPY’s recently.
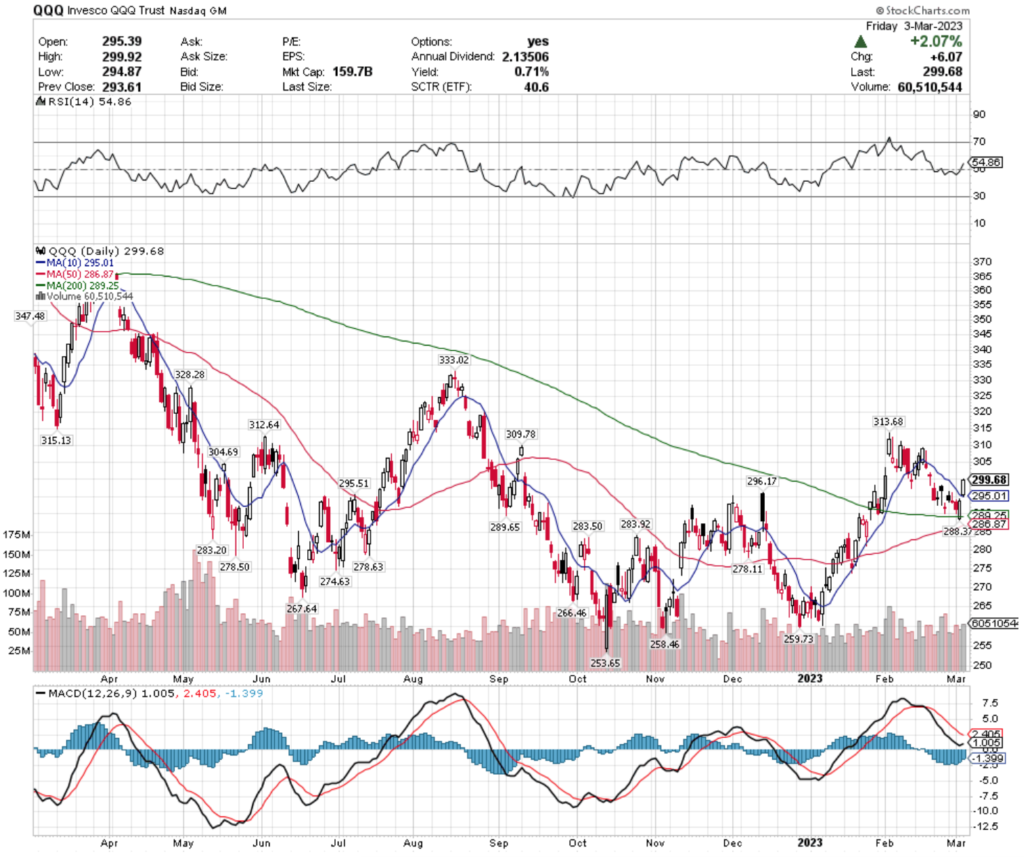
Their next level of resistance is $304.69, followed by $309.78, $312.64 & $313.68.
QQQ’s support will likely be tested in the coming days, with the levels to watch being $296.17, $295.51, $295.01 (10 day moving average), before falling to $289.65.
IWM, the iShares Russell 2000 ETF gained +2.13% this week, with similarly “near-average” volume compared to the rest of the year prior.
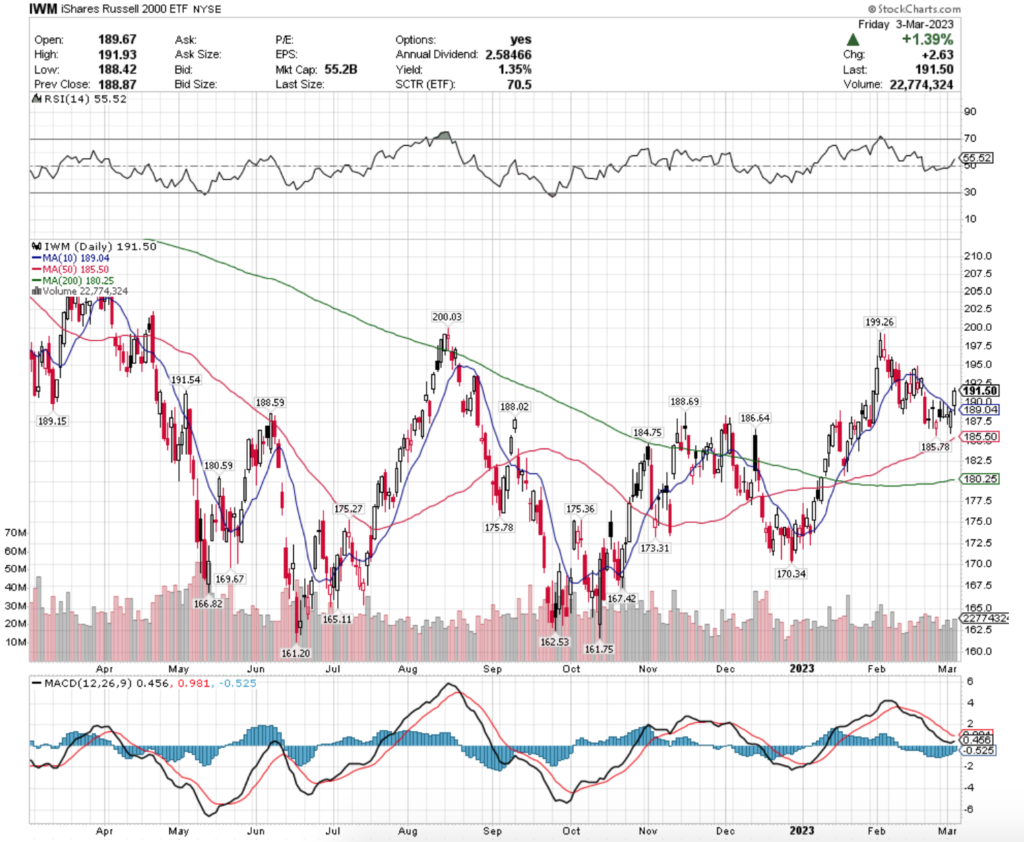
Like SPY & QQQ, Friday’s gap up moved IWM’s RSI to look bullish & their MACD is beginning to signal an attempt at a bullish crossover.
Let’s dive into the best & worst performing sectors/geo-locations!
Aerospace & Defense (DFEN), Industrials (DUSL), Germany (EWG) & Small Caps (UAA) Are All Bullishly Leading The Market
DFEN, the Direxion Daily Aerospace & Defense Bull 3x Shares ETF has gained 4.44% over the past year, but has rebounded 99.29% from its low in September of 2022.
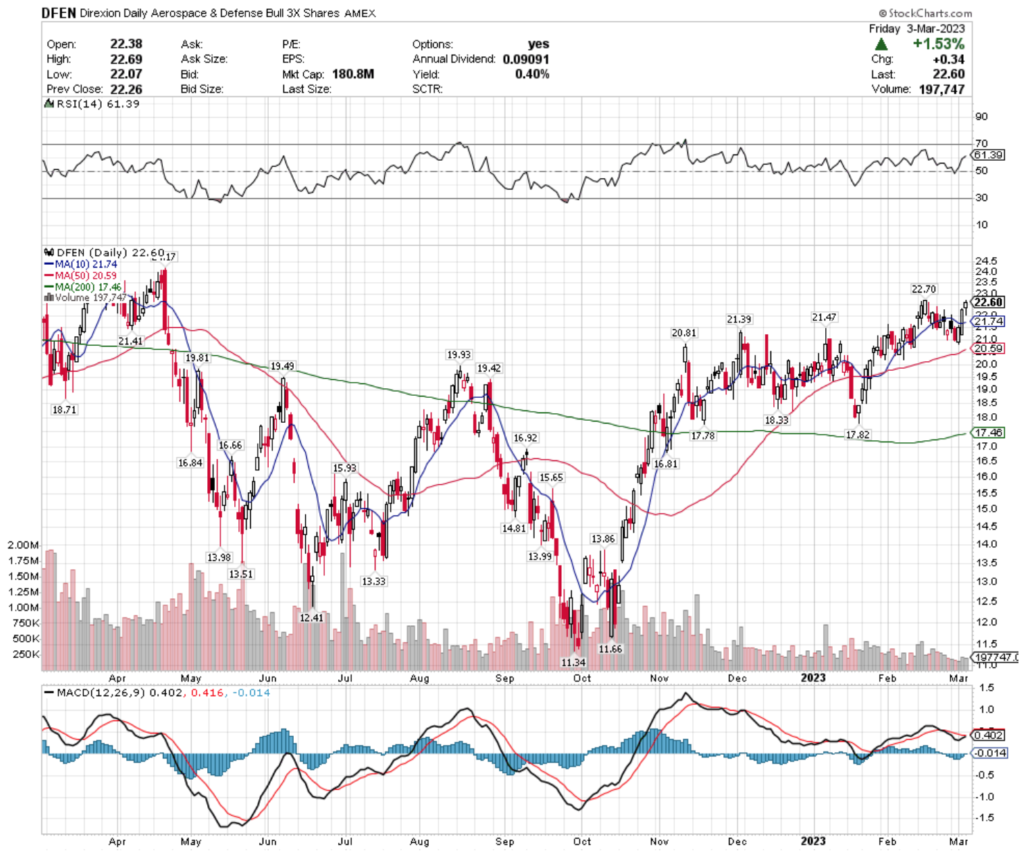
While their distribution will not provide much cushion at 0.40% annually (0.1% payout/quarter), they have support at $21.74 (10 day moving average), $21.47, $21.41 & $21.39.
Given where they are at currently it would be wisest to wait on any moves or use options strategies around these levels, as their next overhead resistance level is $22.70, followed by $22.80 & $23.14.
DUSL, the Direxion Daily Industrials Bull 3x Shares ETF has lost 3% this past year (excluding dividends, which still only provide a 0.58% cushion for loss), but has gained 83.12% from the lows of October 2022.
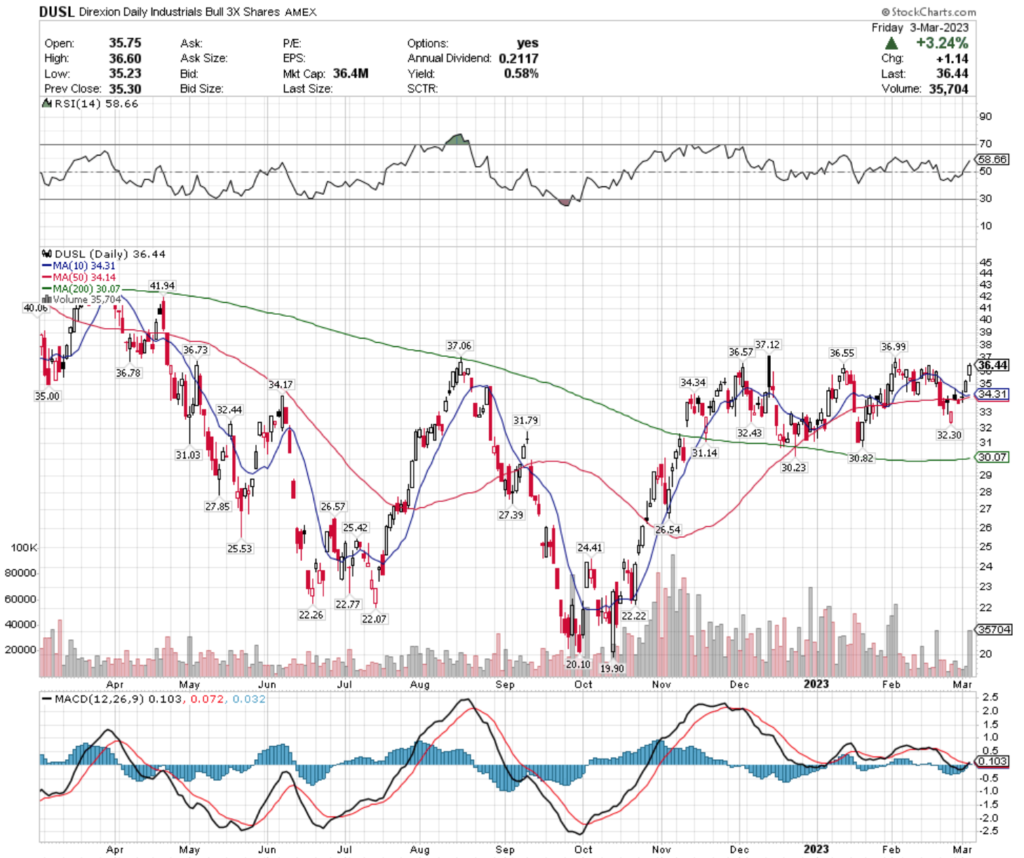
Their next resistance levels are $36.55, $36.57 & $36.73.
Support levels are a bit lower, signaling investors who aren’t trading options around DUSL should wait until they test these levels again before entering.
Support levels currently are $35.00, $34.34 & $34.31 (10 day moving average), and there is a consolidation around the area of the 10 & 50 day moving averages.
EWG, the iShares MSCI Germany ETF has gained 10% (in addition to their 2.87% distribution for long-term holders), while gaining 44.47% since their low in September 2022.
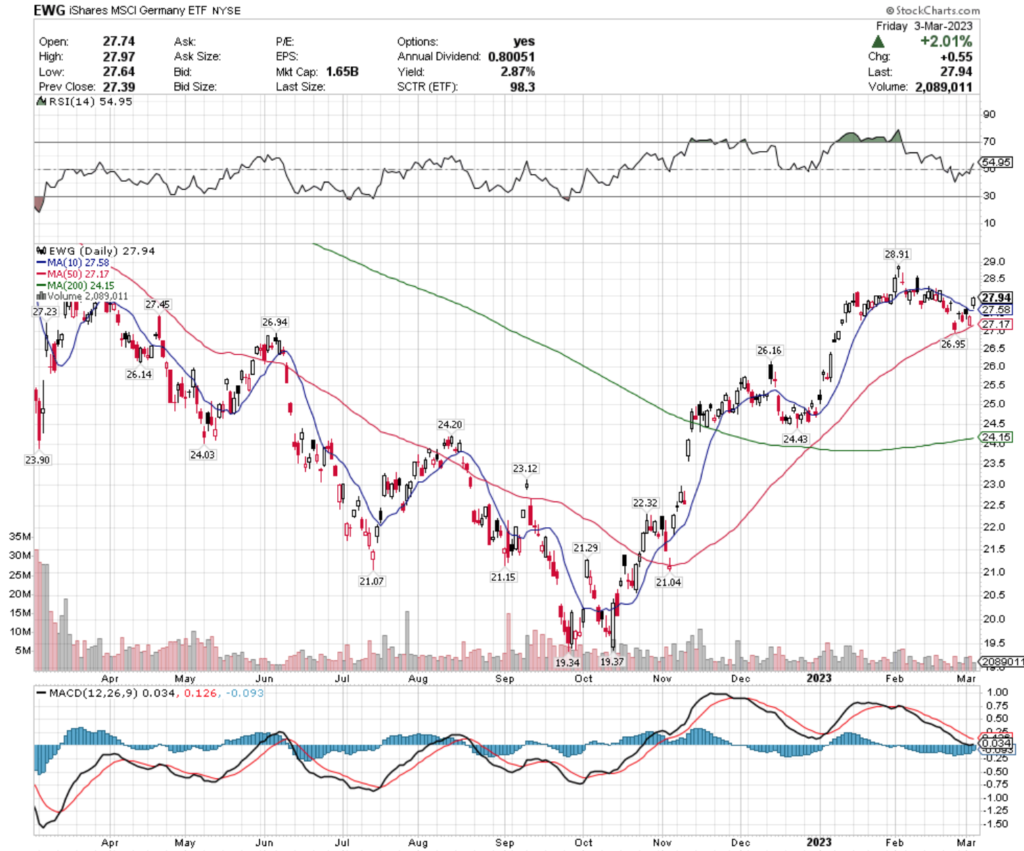
Long-term holders will be rewarded the 2.85% in distributions, but this is currently too overheated for an entry, with overhead resistance at $28.91, $28.95 & $29.86.
Unless using options, it is best for long-only readers to wait to see how EWG performs against their support levels of $27.57 (10 day moving average), $27.45 & $27.24 (50 day moving average) before making an entry.
SAA, the ProShares Ultra Small Cap 600 ETF has lost -11.18% over the past year (with minimal cushion from their 0.39% distribution), but they have recovered +39.37% from their lows in September 2022.
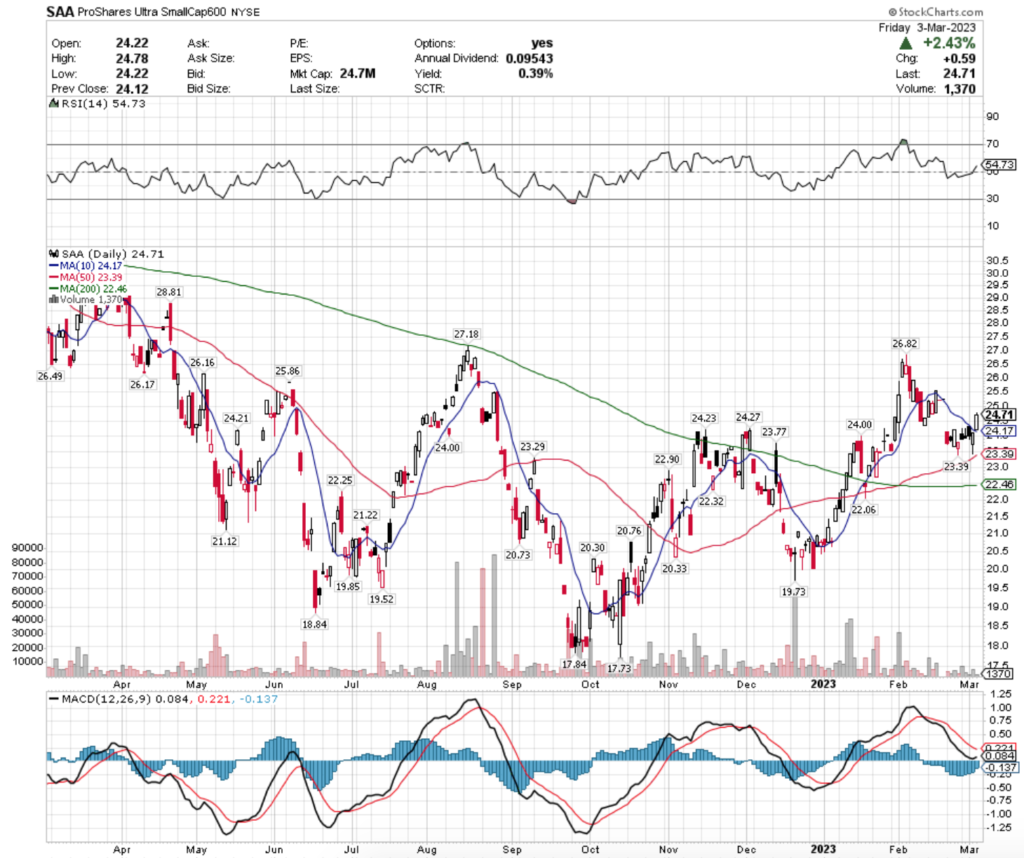
While they’ve begun to fill their most recent gap down, this one also is worth taking a wait & see approach for entering a position.
With resistance at $25.86, $26.16, $26.17 & $26.49, it will be important to see how they behave at their support levels of $24.27, $24.23 & $24.21.
Colombia (GXG), Mortgage Real Estate (REM), U.S. Telecommunications (IYZ) & Clean Energy (PBW) Are All Bearishly Lagging The Market
GXG, the Global X MSCI Colombia ETF has lost 32.13% (not including their 12.75% distribution paid to long-term holders), and is -38.73% from their high in April 2022.
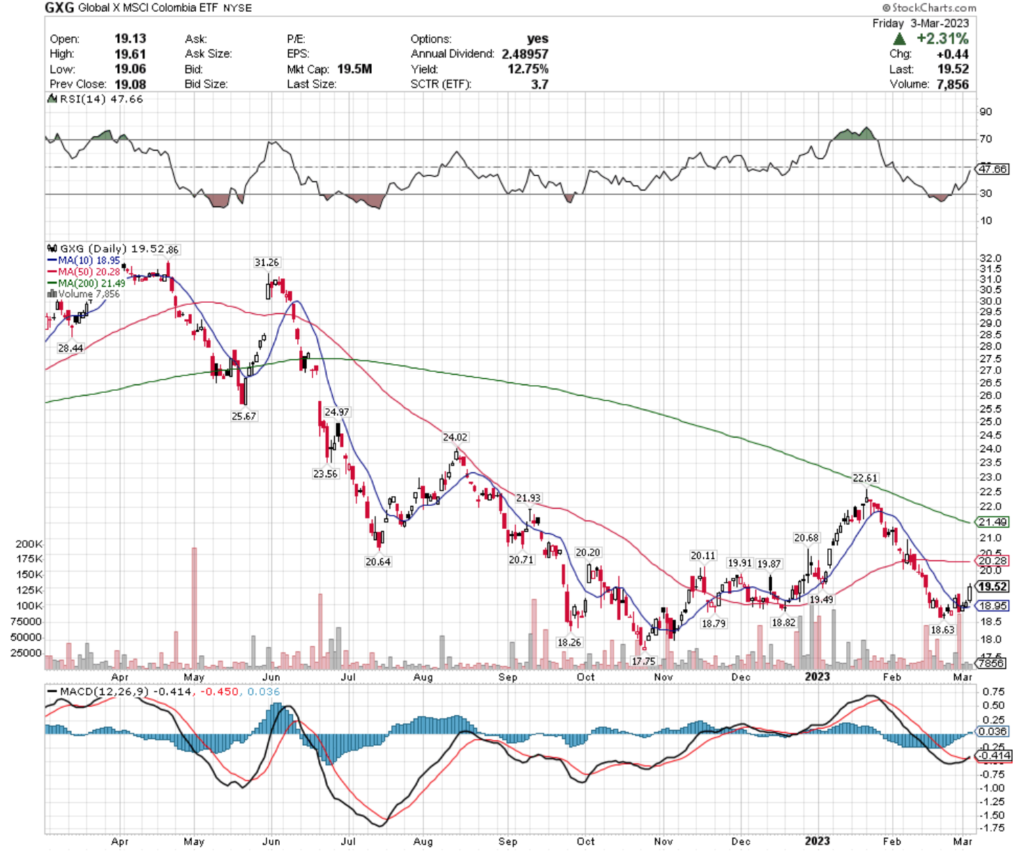
While their last week went well, resistance tests at $19.87, $19.91 & $20.11 will be imperative to see how much upward momentum they can gain, while they have support at $18.95, $18.82 & $18.79/share.
REM, the iShares Mortgage Real Estate Capped ETF has lost -17% over the past year (although their distribution of 10.58% to long-term holders helped cushion the fall), and has lost -22% since their high in March 2022.
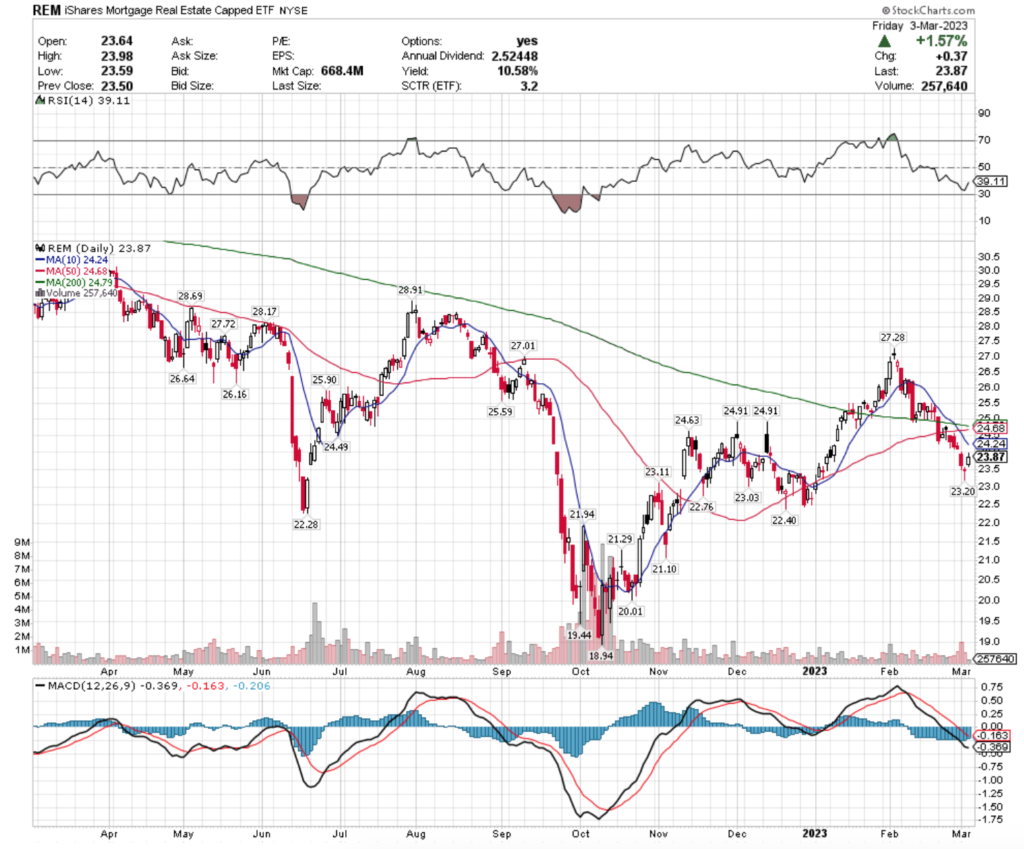
They have pivoted off of the low last Wednesday to recover for 2 days, but need to face tests at $24.49, $24.63 & $24.71 (50 day moving average) & have a long ways down to go upon failing, as support levels are $24.14 (10 day moving average), $23.20 & $23.11.
IYZ, the iShares U.S. Telecommunications ETF has lost 20.94% over the past year (excluding the 2.49% distribution they pay to long-term holders), down -23.23% from their high in March 2022.
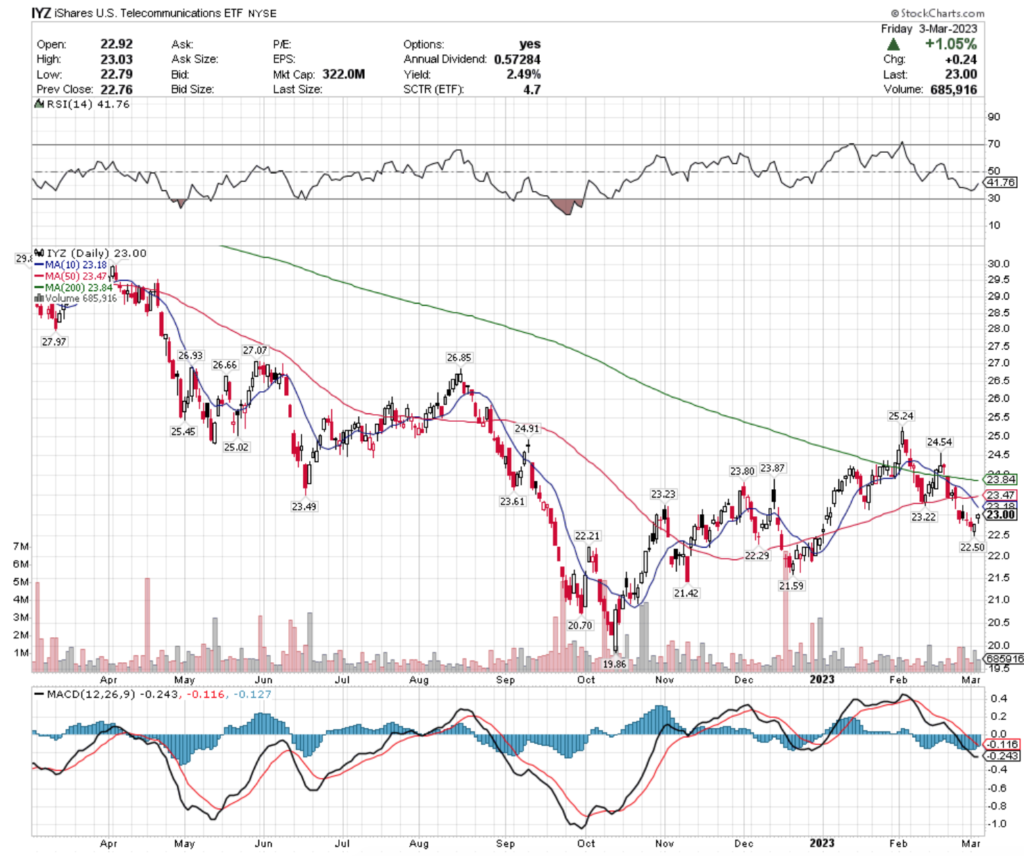
The gaps up of last week don’t look strong here, with overhead resistance at $23.22, $23.23, $23.50 (50 day moving average) & $23.61.
Support levels of $23.07 (10 day moving average), $22.50 & $22.29 are going to be what to watch for to see how they hold up upon retest.
PBW, the Invesco Wilder Hill Clean Energy ETF has lost -20.48% over the past year (excluding their 3.69% distribution paid to long-term holders), losing -34.78% since their high in April 2022.
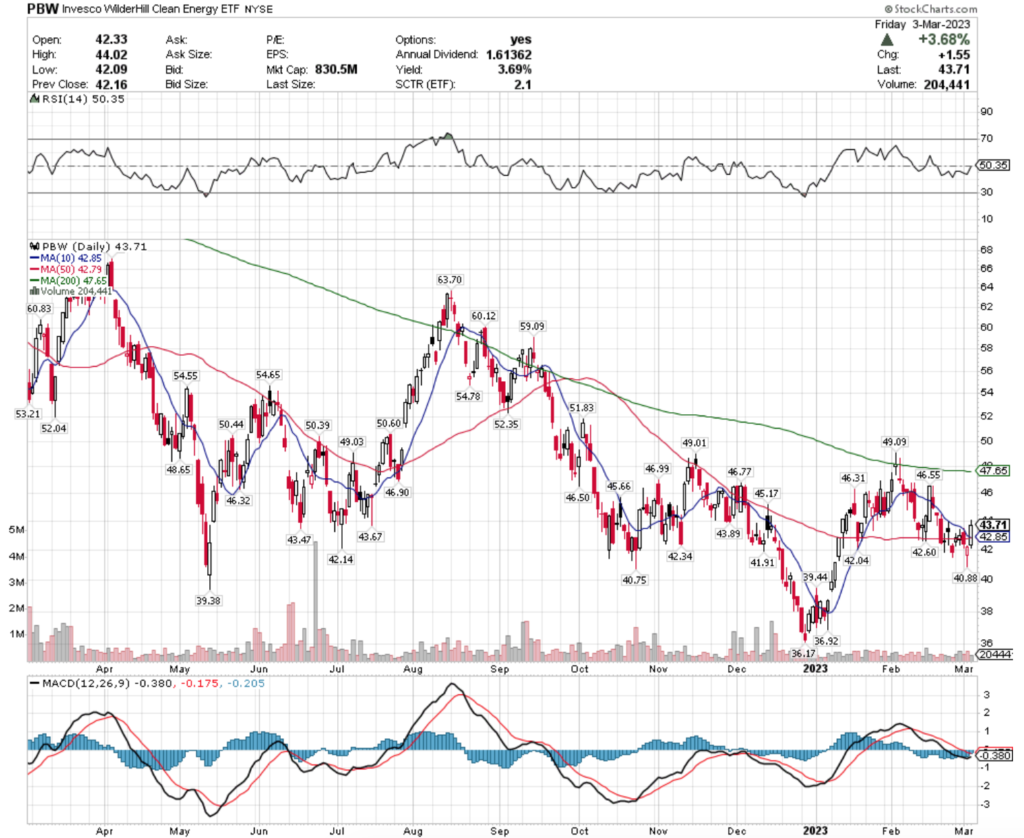
Their next tests of resistance will be at the $45.17, $45.66 & $46.31/share level.
Support levels to watch are at $43.89, $43.67 & $43.47.
Tying It All Together
Monday will bring us Factory Orders data, followed by Fed Chairman Powell testifying to the Senate Tuesday, when Wholesale Inventories & Consumer Credit data will also be reported.
Wednesday will provide us with ADP Employment, U.S. Trade Balance, Fed Chairman Powell testifying to the House, JOLTs Job Openings data & Beige Book information.
On Thursday Jobless Claims data will be reported & Fed Governor Waller is scheduled to speak & Friday wraps the week up with Employment Report, U.S. Unemployment Rate & Federal Budget Data.
See you back here next week!
*** I DO NOT OWN SHARES OR OPTIONS CONTRACTS OF DFEN, DUSL, EWG, SAA, GXG, REM, IYZ or PBW AT THE TIME OF PUBLISHING THIS ARTICLE ***