SPY, the SPDR S&P 500 ETF fell -3.07% last week, while the VIX closed out at 23.37, indicating an implied one day move of +/-1.47% & an implied one month move of +/-6.75%.
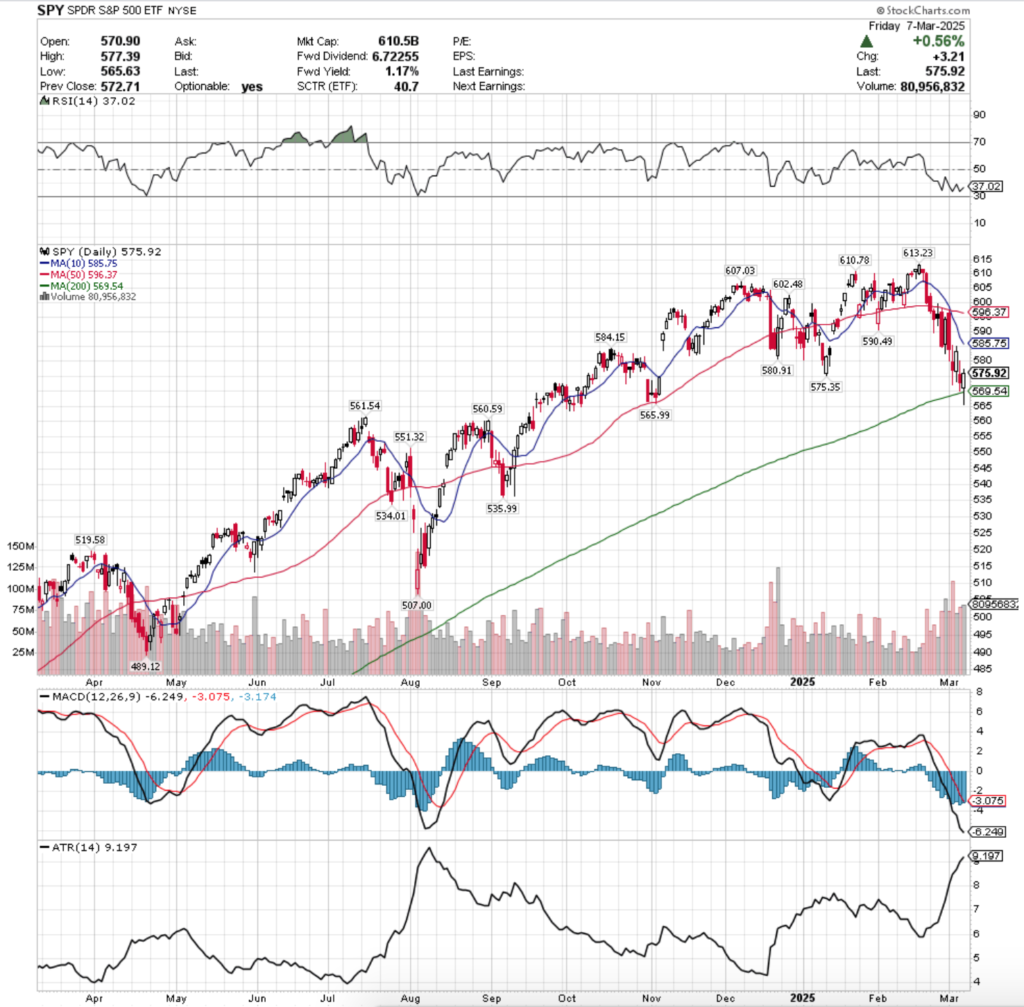
Their RSI is currently at 37.02, while their MACD is still in bearish decline, which will make for an interest week as their 200 day moving average is just -1.11% below Friday’s closing price.
Volumes were +54.34% above the previous year’s average level (82,276,000 vs. 53,307,400), indicating that there is a bit of nervous energy & bearishness as people are jumping out of the pool in droves.
It’s worth noting that on 3/17/2024 SPY’s prior year’s average volume was 78,989,814, so this week’s average volume for the prior year eclipses that by +4.16%, which is an incredibly bearish signal given how the current average prior year’s volume for this week is -32.51% lower than from 51-weeks ago (note here).
Monday the week kicked off with a rather bearish set up, as SPY opened higher, tested the 10 & 50 day moving average’s resistance, which were crossing over bearishly, before dropping to form a bearish engulfing pattern with Friday’s candle, setting the stage for further declines into the week.
Tuesday opened on a gap down, tested higher to above Monday’s close, before puking lower to close the day red & based on the high wave candle’s lower shadow exposed a good deal of downside appetite, breaking below the $575/share mark.
There was a large tug of war going on that day, as the session had the week’s & 2025’s highest volume to date, but in the end the bears won.
Wednesday opened lower & again broke the $575/share mark temporarily, but was able to claw back higher to temporarily break above the $585/share mark, which proved unsustainable, but the session ended as a bullish engulfing pattern.
It’s worth noting that this came on the week’s lowest volume, which indicated that there was limited staying power & that it was likely just a head-fake to lure folks back into the markets after all of the selling of the prior 2-3 weeks.
Thursday opened on a gap lower, tested above the $580/share mark, but proved that the ship was still sinking as it proved unsustainable & the declines continued, briefly flirting with the support of the 200 day moving average, but recovering slightly to still close on a down day on the week’s third highest volume, signaling that the bulls were nowhere to be found.
Friday the week wound down on a bullish engulfing candle with the week’s second highest volume, but it again looked to be a head-fake, as the long-term trend line was broken through to the downside & the $565/share mark was approached, but not tested.
Per last week’s note, we saw the $575.35/share support line temporarily break down, which set the stage for the aforementioned trend test & the fact that it succeeded briefly indicates that there is questionable-to-shattered confidence in the market currently.
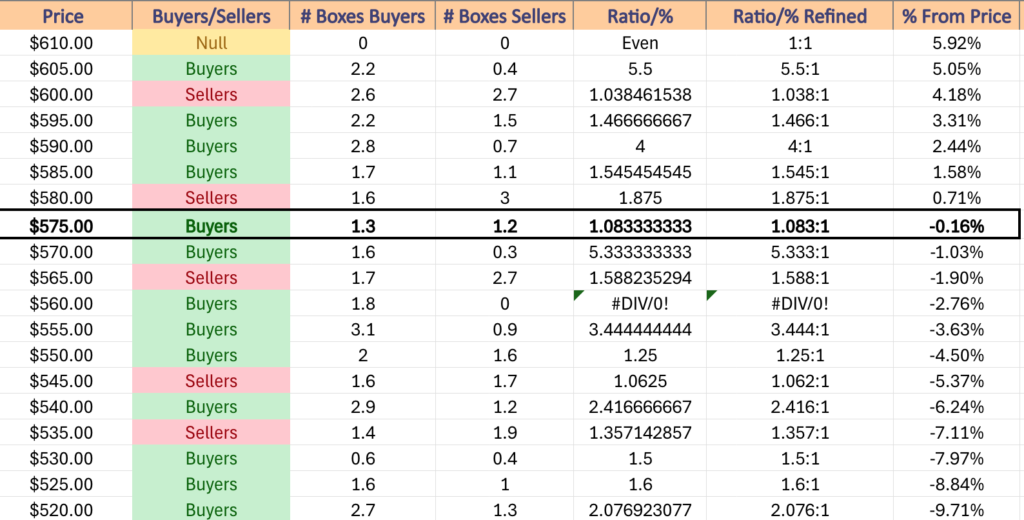
Another area of note is that the $570-574.99/share zone has been dominated by Buyers at a rate of 5.33:1 over the past ~2-3 years & yet the bulls were unable to defend the zone & it broke down temporarily.
As I am writing this (Monday morning as I was just OOO last week) the declines have continued per the open, and the high of the first 32 minutes of trading has not been able to break above the 200 DMA’s resistance.
The $565-$569.99/share zone has been dominated by Sellers at a rate of 1.59:1 in recent history, indicating that without some strong earnings results or a miracle from Wednesday’s CPI print or Thursday’s PPI print we will likely see further declines.
This is especially true given that the $560-564.99/share zone has seen limited downside tests & has been a Buyer zone at a rate of 1.8:0* & there has been a bit of momentum to the downside building up over the past few weeks.
The bullish case rests on SPY being able to break above the 200 DMA’s resistance & the $575.35/share mark, which will require a major catalyst & a large influx in advancing volume if it is to be sustainable, as currently there is a rather pessimistic outlook from the volume sentiment of SPY.
What is more likely to happen is that we either see a consolidation range established based around today’s close that will straddle & oscillate around the 200 DMA, or we see further breakdowns until their RSI crosses into oversold territory & a brief consolidation range forms as sellers take a breather.
Should that $560/share zone break down SPY will see a bit more trouble brewing, as despite there being 3.44:1 Buyers:Sellers for the $560.59/share support level, that breakdown leads to an elevator ride down with only one stop at $551.32/share to $535.99/share (an additional -2.78% decline) based on a lack of support levels in between, paired with weak Buyer sentiment along the way down.
The table below highlights the volume sentiments for SPY over the past ~2-3 years & is useful for assessing the strength/weakness of support/resistance levels in the coming weeks as they’re tested.
SPY has support at the $575.35 (Volume Sentiment: Buyers 1.08:1), $569.54 (200 Day Moving Average, Volume Sentiment: Sellers, 1.59:1), $565.99 (Volume Sentiment: Sellers, 1.59:1) & $561.54/share (Volume Sentiment: Buyers, 1.8:0*) price levels, with resistance at the $580.91 (Volume Sentiment: Sellers, 1.88:1), $584.15 (Volume Sentiment: Sellers, 1.88:1), $585.75 (10 Day Moving Average, Volume Sentiment: Buyers, 1.55:1) & $590.49/share (Volume Sentiment: Buyers, 4:1) price levels.
QQQ, the Invesco QQQ Trust ETF dropped -3.22% last week, as the tech-heavy index fell out of favor among investors as well.
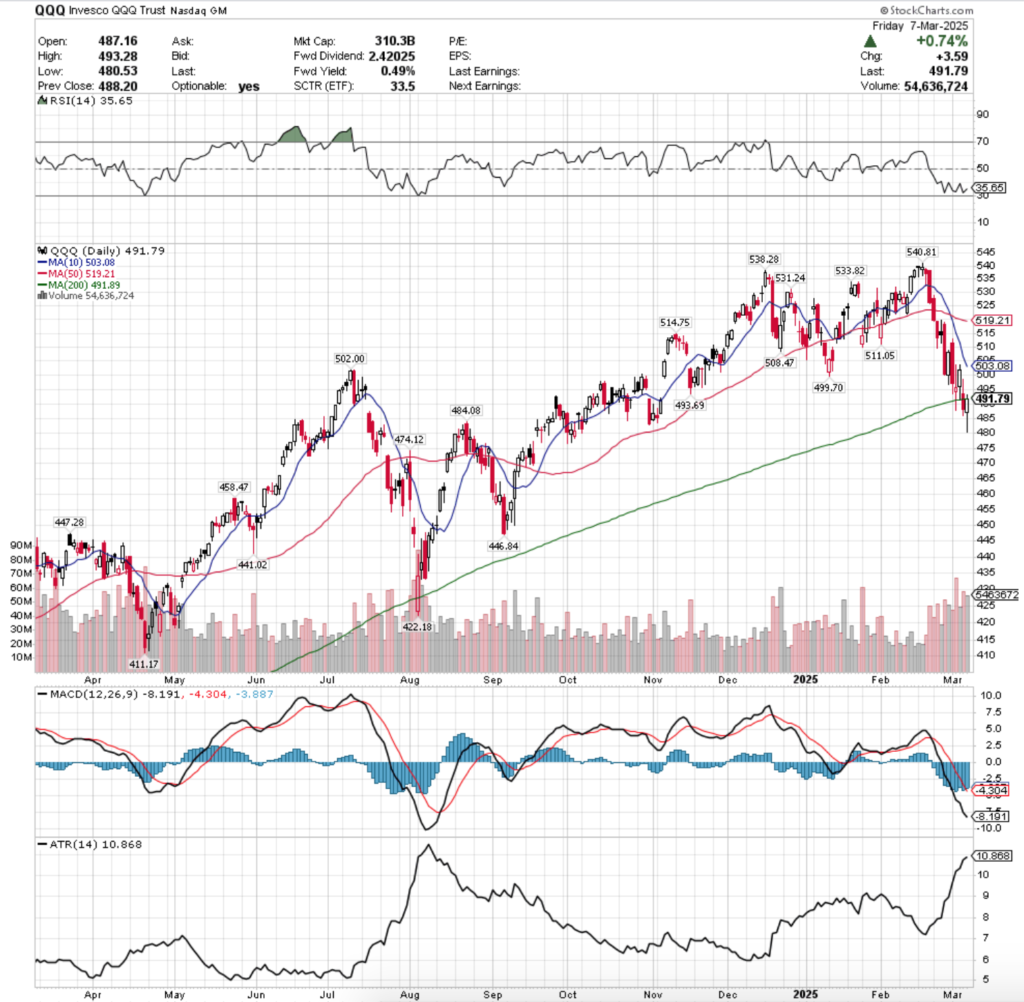
Their RSI is just above the oversold 30-mark & sits currently at 35.65, while their MACD is still in bearish decline with a histogram that isn’t painting a picture of it changing in the near-term.
Volumes were +52.34% above the prior year’s average level (53,728,000 vs. 35,269,360), which when compared to last year’s average level paints a similar eerie picture as SPY’s, given that this year’s average prior year’s volume is -29.86% lower than a year ago’s level of 50,281,257.
Monday opened similarly to SPY, as QQQ set a bearish engulfing pattern on Friday’s candle, with the $495/share mark being temporarily broken through to the downside.
Tuesday continued the bearish theme, as QQQ opened on a gap down, broke down through the 200 DMA’s support briefly, continued lower to break down the $490/share price level, before climbing back to close above it’s open, but still lower than Monday’s close.
The high wave candle also showed some temporary upside appetite too, but in the end the week’s highest volume session went to the bears after a long tug-of-war.
Wednesday opened on a gap up, but not without testing lower down to the 200 DMA’s support, but QQQ managed to bounce north from it to close above the $500/share mark.
It’s worth noting that this occurred on the week’s second lowest volume, so the upside move lacked strength behind it.
QQQ opened Thursday on a gap lower, briefly attempting to break higher above the $495/share mark, but did not reach the $450 level, and came crashing down below the 200 day moving average’s support to close below the $490/share level.
Thursday’s lower shadow also signaled that the $485/share level became in play & the week’s second highest volume session painted a dismal picture for the coming week.
Friday opened on a gap lower, broke down below the $485/share level & almost reached the $480/share mark, before rallying higher to briefly break above the 200 DMA’s resistance & closed the week out just below the long-term trend line.
Like SPY, there will need to be a significant shift in advancing volume in order for any upside near-term moves to be sustainable & as such all should be viewed skeptically in the coming week(s).
In the event of a consolidation range forming, it will likely oscillate around the 200 DMA once the long-term trendline & QQQ’s price meet again, but per Monday’s open there were further declines away from the slow moving average.
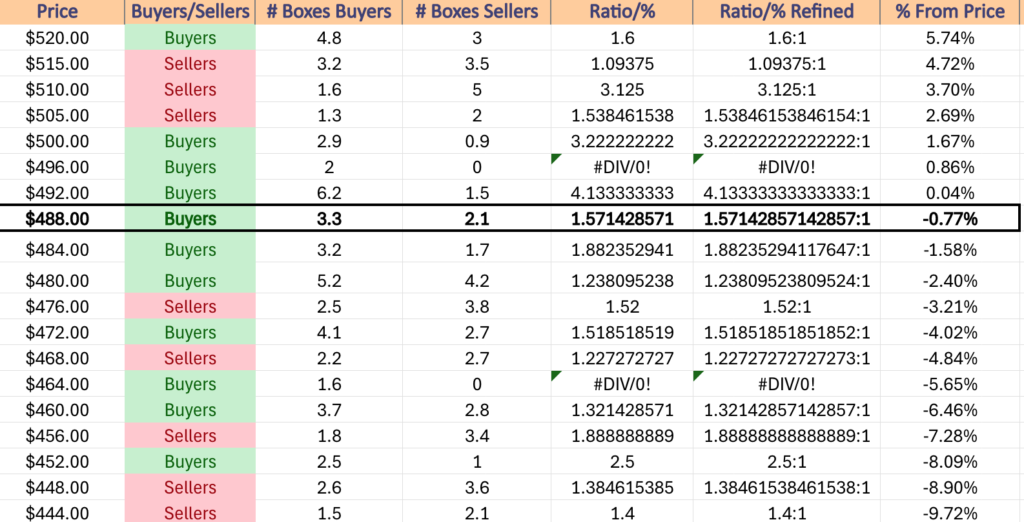
An area of concern for QQQ which can be seen in the table below is that their next four support levels from Friday’s close extend to declines of ~-9% in terms where their fourth support level to find footing on occurs & there is a lot of Seller pressure along the way there, lumped in with only one strong Buyer pressure zone ($452-455.99/share @ a rate of 2.5:1).
Any downside movements are worth referencing against the table below to see where there may be relief, but with so few local support levels QQQ looks ready for a difficult week(s) ahead in the near-term.
QQQ has support at the $484.08 (Volume Sentiment: Buyers, 1.88:1), $474.12 (Volume Sentiment: Buyers, 1.52:1), $458.47 (Volume Sentiment: Sellers, 1.89:1) & $447.28/share (Volume Sentiment: Sellers, 1.4:1) price levels, with resistance at the $491.89 (200 Day Moving Average, Volume Sentiment: Buyers, 1.57:1), $493.69 (Volume Sentiment: Buyers, 4.13:1), $499.70 (Volume Sentiment: Buyers, 2:0*) & $502/share (Volume Sentiment: Buyers, 3.22:1) price levels.
IWM, the iShares Russell 2000 ETF declined -4.05%, as the small cap index took the brunt of the week’s beatings in terms of the major index ETFs.
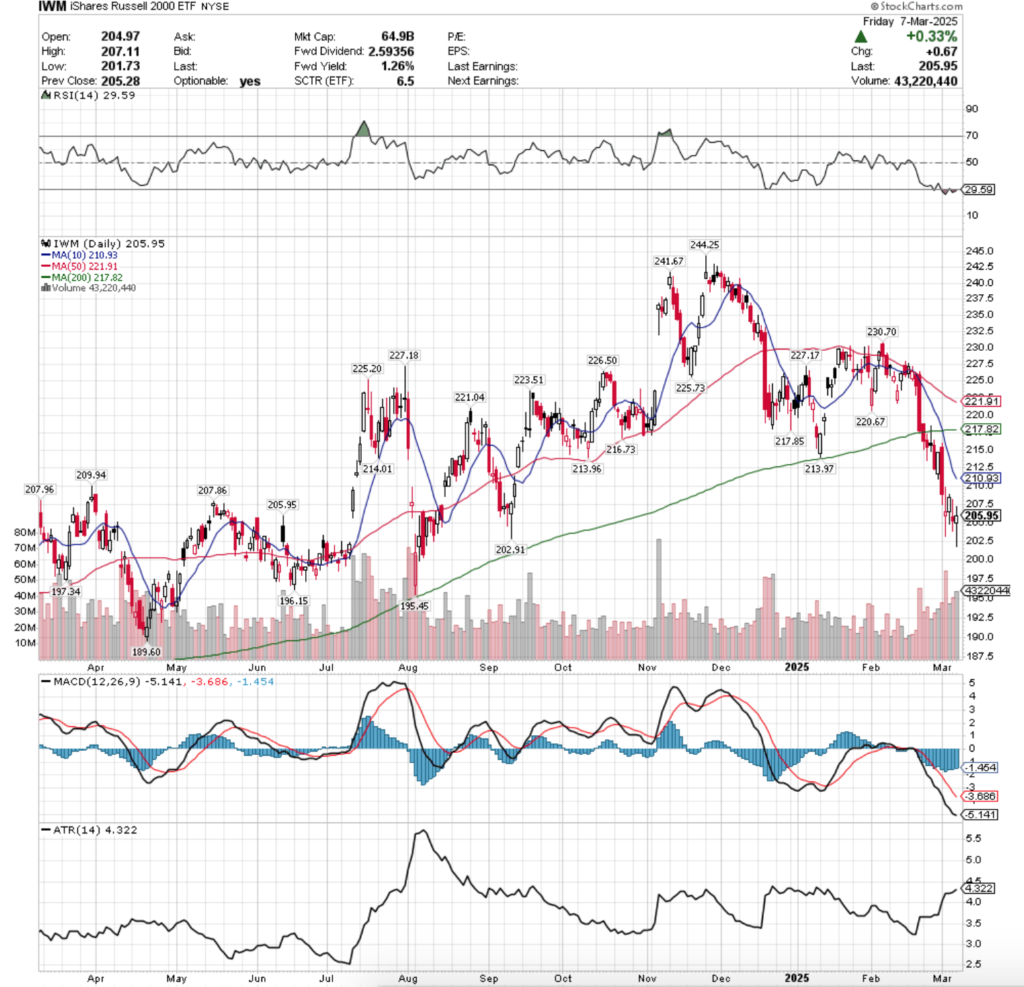
Their RSI is in oversold territory, sitting at 29.59, while their MACD is bearish with a steady histogram reading, which doesn’t signal that there is an immediate recovery on the horizon.
Volumes were +44.59% above the previous year’s average levels (41,838,000 vs. 28,934,640), which should sound alarm bells given that IWM’s current previous year’s average volume is -16.67% lower than that level one year ago (34,724,721).
IWM’s week opened on a bearish engulfing candle as well, after they’d already broken down through their 200 day moving average’s support the week prior & the resistance of the 10 DMA was unable to be tested despite the gap up opening price level.
Tuesday opened on a gap down, tested lower to break down through the $205/share level to the downside, but heavy volume pushed IWM higher to flirt with the $210/share mark, before closing above its opening price, but still lower on the day.
Tuesday’s high wave doji candle showed that while there was some uncertainty surrounding where IWM was to be valued, it was definitively viewed as lower given the candle’s real body & the highest volume of the week showed that despite the tug-of-war, there was conviction that it certainly belonged lower.
Wednesday opened on a gap higher, tested lower to <$205/share mark, but ultimately was able to break out & close above the $207/share level; it should be noted that this occurred on weak volume, indicating that there was limited strength behind the move higher & that it should be viewed skeptically.
Thursday confirmed this, as IWM opened on a gap lower & closed the day as a high wave doji that signaled that there was some appetite to above $207/share still, but sellers came out to force the session below $205/share briefly before it settled down for the day just above that level.
Friday resulted in the week’s second highest volume on another high wave candle, but the high was unable to reach the $207/share level & the low broke down below the $202/share mark.
While the day resulted in a bearish engulfing candle, the lower shadow speaks volumes about investor sentiment towards IWM in the near-term & it’s a bleak outlook.
The bullish case for IWM revolves around their RSI being in oversold territory & a brief bounce, but like with SPY & QQQ, without a meaningful increase in consistent advancing volume there’s little reason to believe any such move will be sustainable.
Any upward movement would also likely be thwarted by the 10 day moving average’s resistance, as it bears down on IWM’s price.
The more neutral look at IWM would be for a consolidation range to form around Friday/today’s price ranges that would likely oscillate around their 10 day moving average, but given that this is the small cap index this would only happen as a result of a temporary breather after their past few months of declines while their RSI heads back towards the neutral level, as they will continue to be punished if their larger counterpart indexes head lower.
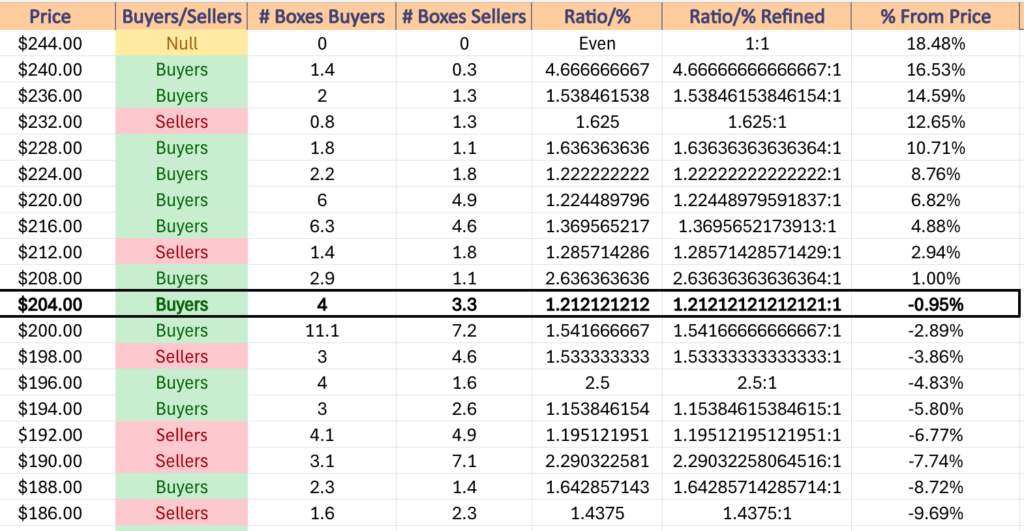
The $196-197.99/share zone will be a place of interest in the event of further declines for IWM, as it is the strongest level of Buyer:Seller sentiment over the past ~2-3 years (2.5:1) within -9.69% of Friday’s closing price & it houses two support levels.
Should these break down the next support level has less historic Buyer sentiment (1.15:1) before we re-enter Seller dominated zones without support levels, which will make it difficult to find stable footing on.
The following support level is $189.60, which occurs in a Buyers zone (1.64:1), which if that breaks down is the last one-year support level & prices enter a Seller dominated zone at a rate of 1.44:1, which would prove poor for IWM.
The $188/share mark is -8.72% from Friday’s close, so if prices break down through it & then slide through the next zone, the $186/share level is -9.69% from Friday’s closing level.
As with the indexes above, it is worth reviewing IWM’s price action against the table below in the coming weeks.
IWM is at a support/resistance point of $205.95 & has support at the $202.91 (Volume Sentiment: Buyers, 1.54:1), $197.34 (Volume Sentiment: Buyers, 2.5:1), $196.15 (Volume Sentiment: Buyers, 2.5:1) & $195.45/share (Volume Sentiment: Buyers, 1.15:1) price levels, with resistance at the $207.86 (Volume Sentiment: Buyers, 2.64:1), $207.96 (Volume Sentiment: Buyers, 2.64:1), $209.94 (Volume Sentiment: Buyers, 2.64:1) & $210.93/share (10 Day Moving Average, Volume Sentiment: Buyers, 2.64:1) price levels.
DIA, the SPDR Dow Jones Industrial Average ETF dipped -2.31% last week, as the blue chip names still remained the most resilient of the major indexes.
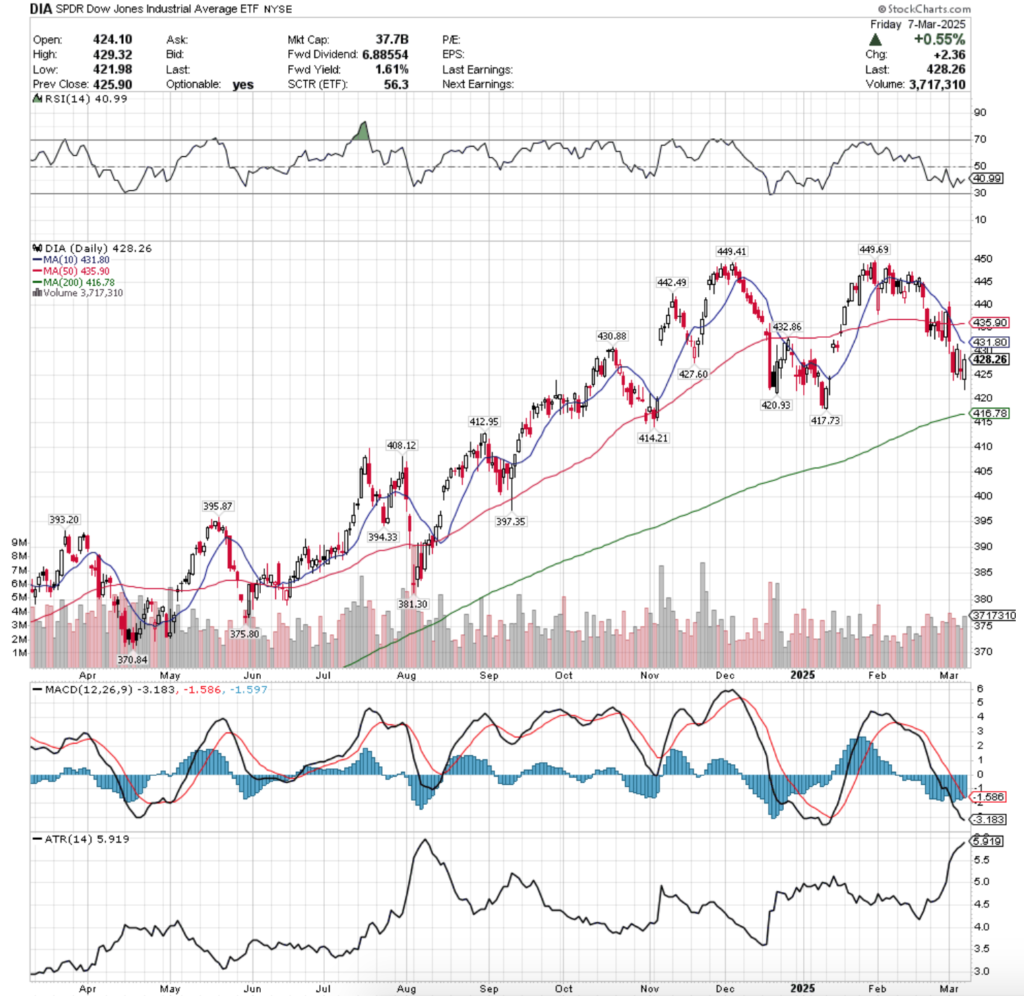
Their RSI is currently at 40.99, while their MACD is bearish & its histogram is not indicating that the slide is over in the near-term.
Volumes were +4.14% above the prior year’s average (3,384,000 vs. 3,249,250), which is less troubling than the aforementioned indexes, but given that DIA is home to the blue chips this should be expected.
Their current prior year’s average volume level is -5.53% lower than DIA’s average volume level one year ago (3,439,304), so even some of the investors who value the safety of the blue chip names are beginning to head towards the exit.
Monday opened the week up on a gap higher above the 10 day moving average’s resistance, broke above the $440/share mark, before sliding below the support of both the 10 & 50 DMAs to cross below the $430/share level temporarily to close forming a bearish engulfing candle with Friday’s session.
One thing of note here was that while Monday had DIA’s widest range of the week, it also contained the highest volume, setting the stage for further declines & likely signaling a larger trend shift for the blue chip names.
Tuesday followed suit & opened on a gap lower, attempted to break above the $430/share level but was unable to remain above it for long & ultimately closed lower, with the day’s low price touching below $425/share, signaling that there was more downside interest on the horizon.
Wednesday opened on a gap lower & again the $425/share level was broken through bearishly temporarily, before DIA rallied to close above the $430/share level; however this occurred on the second lowest volume of the week, signaling that there was not much conviction behind the bullish engulfing candle, particularly given the day’s wide range of prices covered.
Thursday resulted in an interesting day for DIA, as the week’s lowest volume session resulted in a high wave doji candle for a decline, causing a bearish harami pattern, where the upper shadow tested & was rejected by the $430/share level, while the day’s low crossed below the $425/share level.
The low volume on a high wave candle does not indicate that there was much tug-of-war & as a result the taller upper shadow comes with less meaning given the result of the day’s close.
Friday threw an interesting head-fake to the upside, as the day opened on a gap lower below the $425/share level, tested & bounced off of the $421.98/share level, before advancing for the day to close+0.55% & form a bullish engulfing pattern.
While it was on the week’s second highest volume, it indicates that at best DIA will consolidate in a range between the real body of Friday’s candle.
DIA will need significant increases in advancing volume for any near-term gains to be sustainable like the other three indexes & has the resistance of the 10 day moving average bearing down on it.
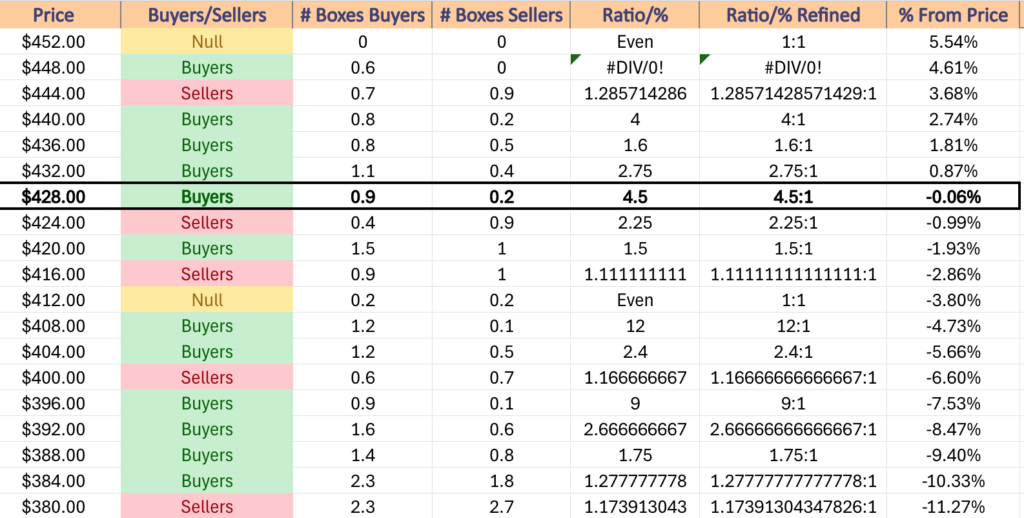
In the event of a downside move the 200 DMA’s support will be a key area to watch, as it resides in a zone that Sellers have bested Buyers 1.11:1 over the past ~4-5 years & should it break down the next zone ($412-415.99/share) has been Even (1:1) between the bulls & bears in terms of volume, which will likely become advantage Sellers unless the price oscillates around the 200 DMA favoring the downside.
The $408.12/share support level will become a key area to watch should those events unfold, as the $408-411.99/share has historically been won by Buyers at a rate of 12:1, which means it has been relatively untested by Sellers.
If that level breaks down there isn’t another support level to gain footing on for another -2.64% & a Seller:Buyer 1.17:1 zone sits atop it, which will likely lead prices lower to test it.
The table below will be beneficial to reference in the coming weeks in relation to DIA’s price movements.
DIA has support at the $427.60 (Volume Sentiment: Sellers, 2.25:1), $420.93 (Volume Sentiment: Buyers, 1.5:1), $417.73 (Volume Sentiment: Sellers, 1.11:1) & $416.78/share (200 Day Moving Average, Volume Sentiment: Sellers, 1.11:1) price levels, with resistance at the $430.88 (Volume Sentiment: Buyers, 4.5:1), $431.80 (10 Day Moving Average, Volume Sentiment: Buyers, 4.5:1), $432.86 (Volume Sentiment: Buyers, 2.75:1) & $435.90/share (50 Day Moving Average, Volume Sentiment: Buyers, 2.5:1) price levels.
The Week Ahead
There is no major economic data due for release on Monday.
BioNTech & Franco-Nevada report earnings Monday morning before the opening bell, followed by Asana, HighPeak Energy, Limbach Holdings, Mission Produce, Oracle, Paymentus, StandardAero & Vail Resorts after the closing bell.
Tuesday opens with NFIB Optimism Index data at 6:45 am, before Job Openings Data is released at 10 am.
Ciena, Dick’s Sporting Goods, Ferguson Enterprises, First Watch Restaurant Group, Holley, Kohl’s, Korn Ferry, Legend Biotech, United Natural Foods & Viking Holdings all report earnings before Tuesday’s opening bell, with Cadre Holdings, Casey’s General, Stitch Fix & Westrock Coffee reporting after the session’s close.
Wednesday begins with Consumer Price Index, CPI Year-over-Year, Core CPI & Core CPI Year-over-Year data at 8:30 am, followed by Monthly U.S. Federal Budget data at 2 pm.
ABM Industries, Arcos Dorados & iRobot all report earnings Wednesday before the session’s open, with Adobe, American Eagle Outfitters, Calavo Growers, Crown Castle, Phreesia, SentinelOne, Sprinklr & UiPath reporting after the closing bell.
Initial Jobless Claims come out at 8:30 am on Thursday, as well as Producer Price Index, Core PPI, PPI Year-over-Year & Core PPI Year-over-Year data.
Thursday’s earnings kick off with Dollar General, G-III Apparel & Weibo in the morning, before Ulta Beauty, Berry Petroleum, Blink Charging, DocuSign, EverCommerce, PagerDuty, Rubrik, Semtech, ServiceTitan, Wheaton Precious Metals, Xponential Fitness & Zumiez report after the session’s close.
Consumer Sentiment (prelim) March data is due for release on Friday at 10 am.
Friday’s morning’s earnings reports include Buckle, Gogo & Li Auto.
See you back here next week!
*** I DO NOT OWN SHARES OR OPTIONS CONTRACT POSITIONS IN SPY, QQQ, IWM OR DIA AT THE TIME OF PUBLISHING THIS ARTICLE ***