SPY, the SPDR S&P 500 ETF dipped -0.06% last week, as the larger cap indexes were the safe-haven favorite of the major four.
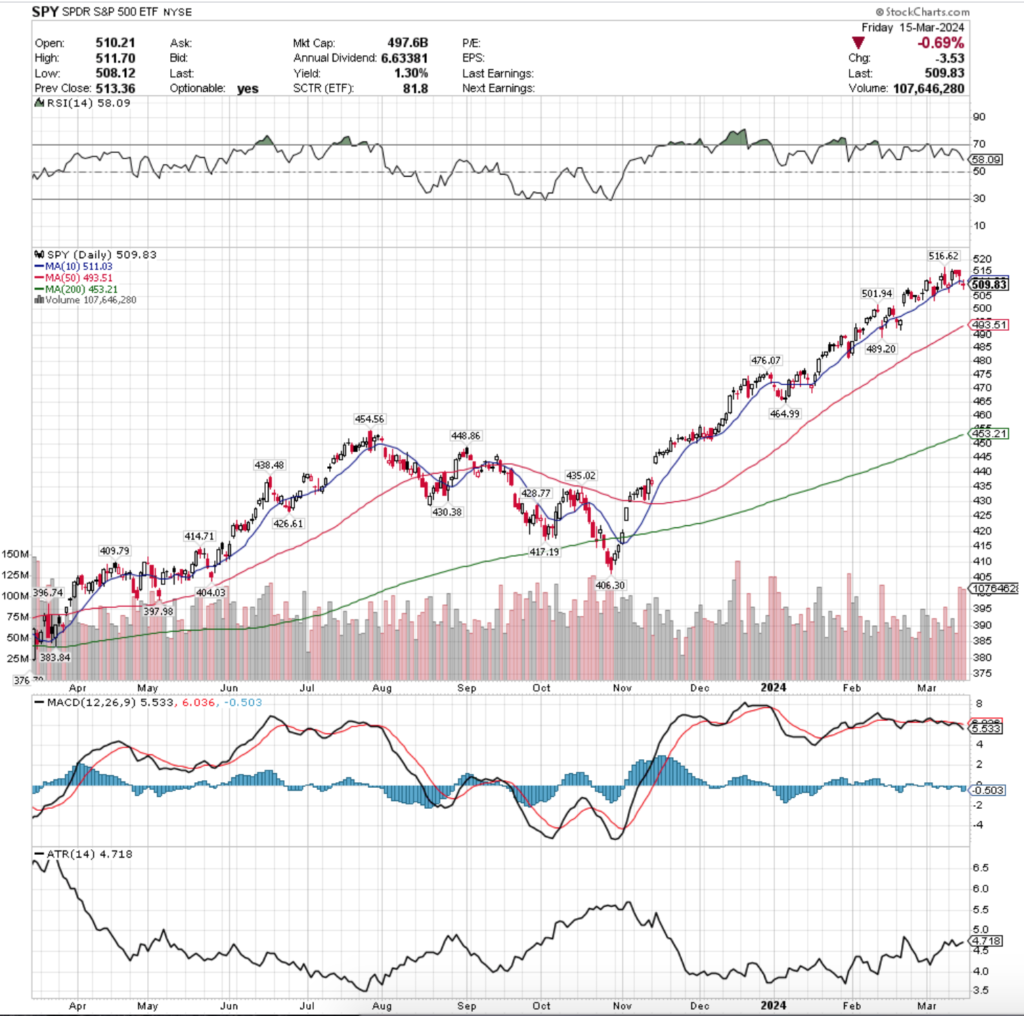
Their RSI is currently trending back towards neutral & sits at 58.09, while their MACD is bearish in the wake of last week’s volatility.
Volumes were +3.44% above average last week compared to the year prior (81,706,660 vs. 78,989,814), which should raise eyebrows given that most of the stronger volume was on declining days & the only bullish day of the week had the 3rd highest volume of the week.
This signals that there is skepticism among market participants about the strength of the recent rally & that profit taking is becoming more & more prevalent recently.
It is also noteworthy that the 52-week high that was set with the upper shadow of last Friday’s session’s candle was not challenged during the last of the week, with three sessions having highs in the $515/share range, unable to break towards the $516.62 level set Friday.
The bearish volume sentiment became especially strong on Thursday & Friday, signaling risk-off sentiment going into the weekend, which should be noted falls days before Wednesday’s FOMC interest rate decision announcement.
Based on how the support of the 10 day moving average broke down on Friday, it appears that some folks decided to hop out of the pool in the event of a hawkish/longer for higher message from Jerome Powell (there are also a handful of big earnings calls next week, all of which are outlined in the next section).
Monday kicked the week off on a bearish note, with the day opening at the 10 day moving average’s support level, testing lower (lower shadow), but ultimately closing higher, spurring the next three session’s last attempts higher.
Volumes were relatively light on Monday, before Tuesday opened higher, tested the 10 DMA’s support briefly, before climbing to the highest level of the week, also on lackluster volume levels though, which does not indicate much strength.
Wednesday & Thursday showed back-to-back hanging man candles, with Wednesday’s staying in a tight price range on the lowest volumes of the week, as investors were unsure of what to do leading up to Thursday’s PPI announcement.
Thursday brought more volatility & a major uptick in volume, ultimately having the most volume of the week.
Thursday also began to flash the warning lights that the uptrend is at least temporarily in trouble, as the lower shadow broke the 10 DMA’s support & set the stage for Friday’s decline that opened & closed below the 10 DMA.
Friday’s candle is also a doji, representing uncertainty by market participants, which is also cause for concern given how tight their daily range was & how high the declining volume was.
Their Average True Range is ticking higher, signaling an increase in volatility, which should likely continue higher given how tight the price range has been (~2%) following the gap up session three weeks ago at the end of February.
A key area to watch will be how price react to the resistance of the 10 day moving average, particularly if it applies more downwards pressure on their price level.
This is particularly important here as the next support level is ~2% below the current price of SPY, with the 50 day moving average’s support another percentage point lower.
One percent below that is the last standing support level before the next support level, which is 6.62% from Friday’s closing price & the other support levels below that have a decent amount of space between them.
The 200 day moving average will be moving higher to stand in as support should prices dip that low, but the current layout of support levels is sparse & may become problematic in the event of any decline of over 3% from Friday’s close.
To the upside, volumes & the highs of last week do not suggest much strength at these levels & the resistance looks sturdy & sustainable to force consolidation.
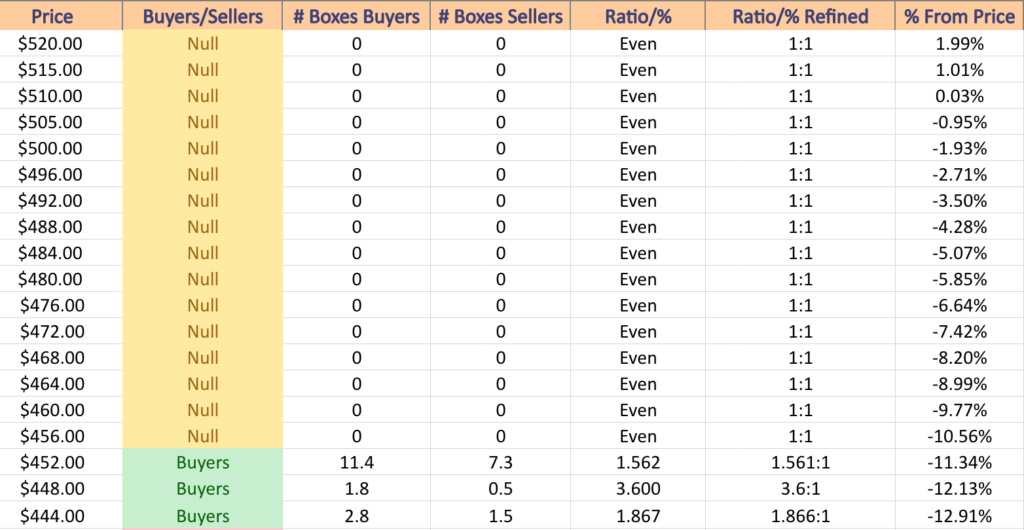
SPY has support at the $501.94 (Volume Sentiment: NULL, 0:0*), $493.51 (50 Day Moving Average; Volume Sentiment: NULL, 0:0*), $489.20 (Volume Sentiment: NULL, 0:0*) & $467.07/share (Volume Sentiment: NULL, 0:0*) price levels, with resistance at the $511.03 (10 Day Moving Average; Volume Sentiment: NULL, 0:0*) & $516.62/share (All-Time High; Volume Sentiment: NULL, 0:0*) price levels.
QQQ, the Invesco QQQ Trust ETF fell -1.16% last week, faring second worst of the major indexes for weekly performance.
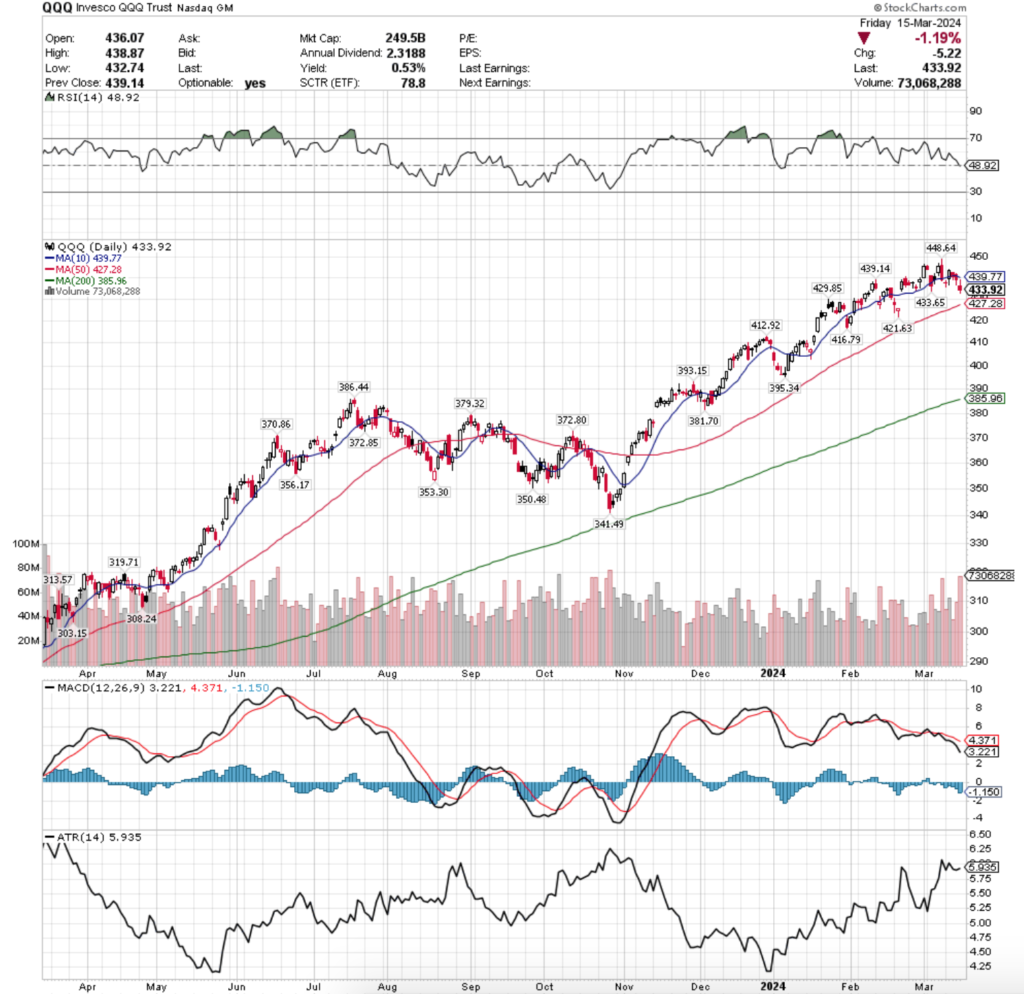
Their RSI has just crossed below the neutral level of 50 & currently sits at 48.92, while their MACD is bearish, as it has been throughout most of the month of March, but has recently been trending even more bearishly than at the beginning of the month.
Volumes were +5.14% above average last week compared to the week prior (52,864,720 vs. 50,281,257), and much like SPY are a cause for concern as there was slight upticks in volume, but the week resulted in minor loss/treading water.
Monday the week kicked off on a gap down that fell below the support of the 10 day moving average, and closed with a doji candle, indicating uncertainty & a lack of enthusiasm given the mediocre volume level.
Tuesday attempted to recover, with the market opening just below the 10 DMA’s resistance, dipping below Monday’s close, before roaring back to close higher & above the 10 DMA.
This was short lived however, as Wednesday delivered a low volume declining day that closed below the 10 DMA, leading into Thursday & Friday’s risk off action.
Thursday opened above the 10 DMA, but was unable to stay afloat & ultimately tested much lower before closing just beneath the 10 DMA’s resistance level.
It is worth noting that the declining volume of Thursday was just short of the advancing volume of Tuesday’s session, especially as we look at Friday.
Friday was purely risk off heading into the weekend, with a gap down that attempted higher on the upper shadow but was unable to reach Thursday’s close, nor the 10 DMA’s resistance & ultimately it sank &* settled lower on high volume.
Much like SPY, it appears that profit taking was the primary theme of the day & signals warning lights for next week.
QQQ’s Average True Range is also beginning to tick up, indicating a rise in volatility, which appears likely to continue into next week.
Like SPY, the 10 DMA’S resistance is an area to keep a close eye on heading into next week,particularly as the 50 day moving average is much closer to the 10 DMA & current price than SPY’s instance.
While QQQ has more densely distributed support levels below its current price, it still warrants the same caution as outlined for SPY in terms of potential downside action, especially if Wednesday’s FOMC meeting leads a sell off in the tech-heavy index.
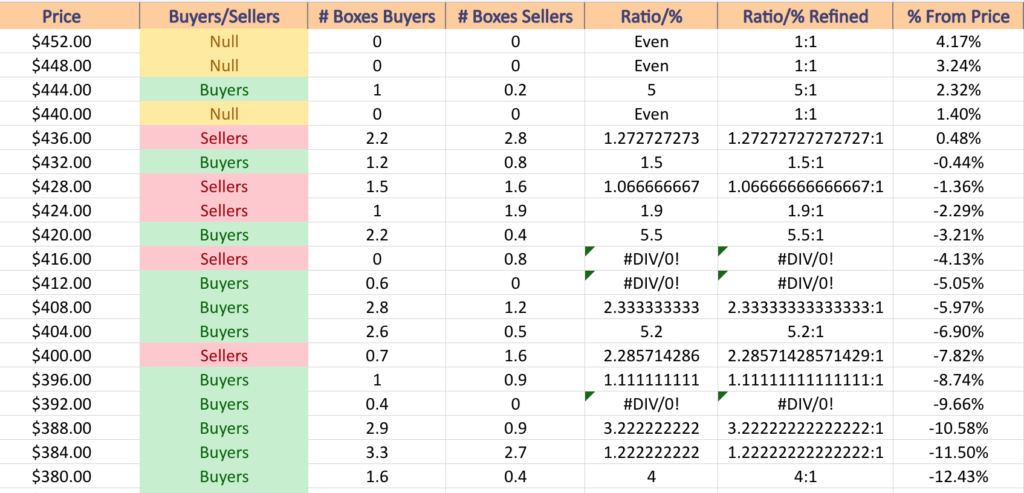
QQQ has support at the $433.65 (Volume Sentiment: Buyers, 1.5:1), $429.85 (Volume Sentiment: Sellers, 1.07:1), $427.28 (50 Day Moving Average; Volume Sentiment: Sellers, 1.9:1) & $421.63/share (Volume Sentiment: Buyers, 5.5:1) price levels, with resistance at the $439.14 (Volume Sentiment: Sellers, 1.27:1), $439.77 (10 Day Moving Average; Volume Sentiment: Sellers, 1.27:1) & $448.64/share (All-Time High; Volume Sentiment: NULL, 0:0*) price levels.
IWM, the iShares Russell 2000 ETF declined -2.14% last week, as investors shied away from the uncertainty that comes with small cap stocks.
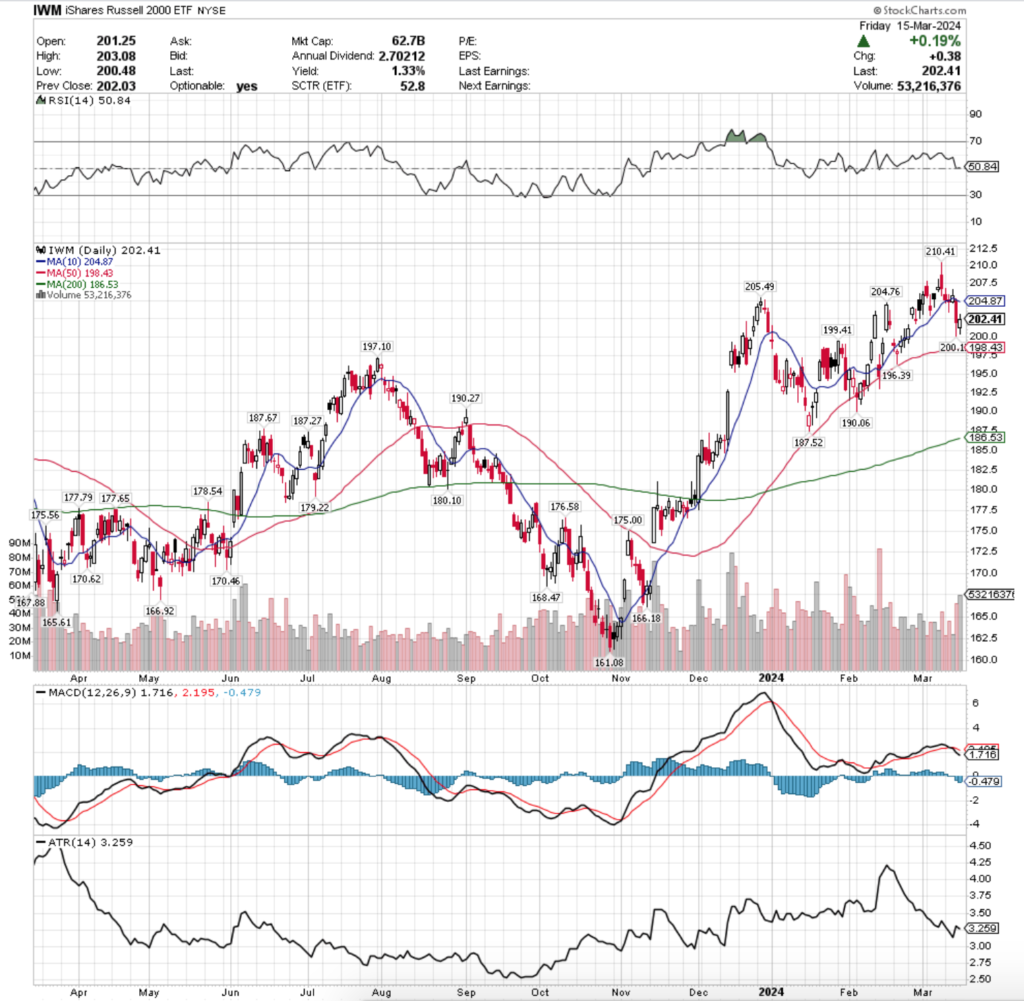
Their RSI is neutral at 50.84, while their MACD has been in bearish decline following the bearish start of last week.
Volumes were +6.64% above average last week compared to the year prior (37,049,240 vs. 34,724,721), which will be interesting to watch coming into a new week as the highest volume day was Friday’s advancing session.
The small cap index has moved much more in an oscillating fashion around a price range compared to the other members of the big 4 indexes, meaning that their recent price action will be different compared to SPY, QQQ & DIA to a degree.
Monday kicked the week off with a move downward on very low volume, signaling bearishness, but with a kick of caution, as the price still managed to settle at the 10 day moving average’s support.
Tuesday had more market participants out than Monday, moving still bearishly for the day, but on a wide-range, high-wave session based on the size of the candle’s long lower & upper shadows.
This shows peak uncertainty about where to value IWM & its components, as there was a lot of motion on the up & downside, but volumes were not large enough to write home about & the open & close were about at the same level & roughly in line with the 10 day moving average.
Wednesday showed a spark of hope to the upside, as the day opened in line with the open & close of Tuesday, but ultimately the support of the 10 DMA prevailed & forced the closing price higher.
The upper shadow indicates that there was a push higher, but the low volume on the day shows that not many market participants were willing to jump into the pool & push IWM meaningfully higher & indicates that there was some silent profit taking, despite the day’s session trending higher.
Thursday featured a bit of a shock for IWM, as the day opened near the 10 day moving average, ducked beneath it & tested down to almost the 50 day moving average’s support on the second highest volume of the week.
Unlike SPY & QQQ, investors poured into IWM on Friday, as the session had the week’s highest trading volume, as there was an appetite for risk in small cap stocks heading into the weekend.
This week it will be interesting to see how prices of IWM behave & if they are contained within the 10 & 50 day moving averages like they have been the past two sessions, or if they will be able to break out to the upside or downside.
Monday’s volume will give some clues to this, as if there is another high advancing volume session there runs a greater risk of profit taking which would force prices lower throughout the rest of the week.
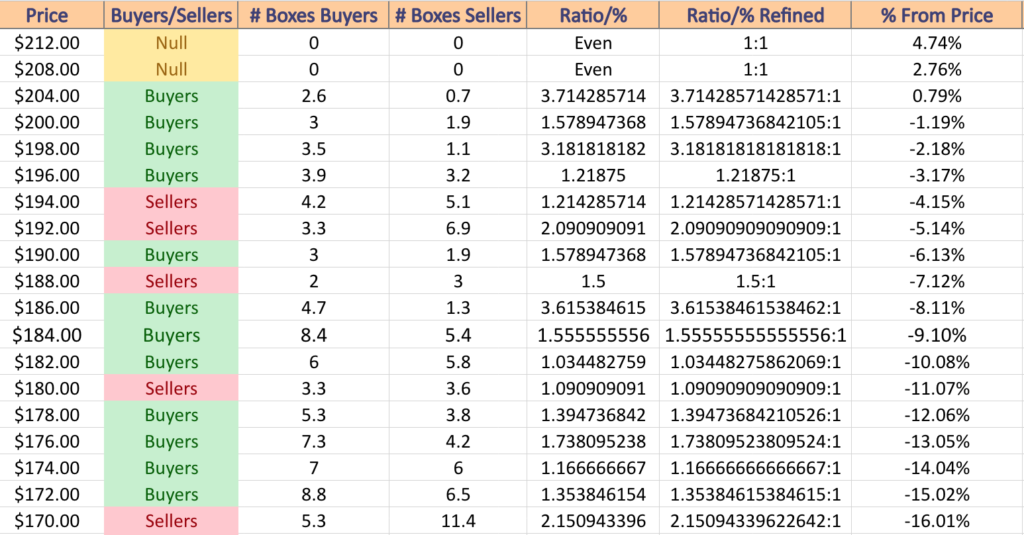
IWM has support at the $200.10 (Volume Sentiment: Buyers, 1.58:1), $199.41 (Volume Sentiment: Buyers, 3.18:1), $198.43 (50 Day Moving Average; Volume Sentiment: Buyers, 3.18:1) & $197.10/share (Volume Sentiment: Buyers, 1.22:1) price levels, with resistance at the $204.76 (Volume Sentiment: Buyers, 3.71:1), $204.87 (10 Day Moving Average; Volume Sentiment: Buyers, 3.71:1), $205.49 (Volume Sentiment: Buyers, 3.71:1) & $210.41/share (52-Week High; Volume Sentiment: NULL, 0:0*) price levels.
DIA, the SPDR Dow Jones Industrial Average ETF inched downward -0.02% last week, and was the best performer out of the major four indexes, despite still closing the week down.
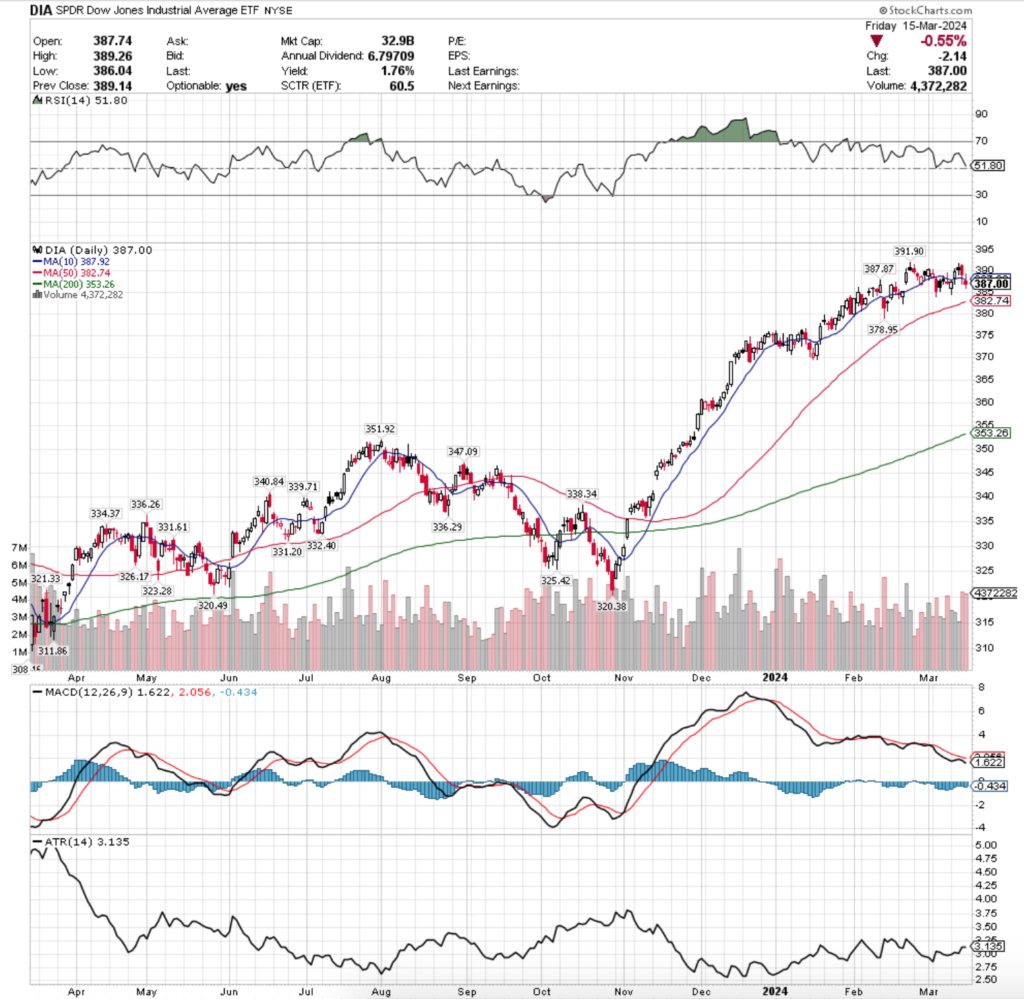
Their RSI is relatively neutral & sits currently at 51.8, while their MACD has been bearish throughout the entire month of March.
Volumes were +6.44% above average last week compared to the year prior (3,660,660 vs. 3,439,304), which should be a cause for concern given that the two declining sessions at the end of the week had the heaviest trading volumes.
Monday kicked the week off with a hammer candle that was contained under the resistance of the 10 day moving average.
Tuesday was able to open around the 10 DMA, tested lower, but ultimately climbed higher & was able to close above the support of the 10 DMA.
Wednesday featured an uncertain note, as the lowest volume session of the week resulted in a spinning top that closed below its open on a bullish session.
This signaled that there is a lack of appetite for DIA & its components, which have had a very strong performance since November of 2023.
Thursday continued the theme of caution & led the risk-off into the weekend move with a high volume session that tested below the support of the 10 DMA but was able to gather enough support to close above it.
Friday though signaled the real weakness, where the second highest volume session of the week resulted in a spinning top that neither opened nor closed above the 10 DMA.
This is particularly worth noting as the 10 DMA’s resistance is now pushing down on prices as the 50 DMA is rising ~1.5% below the closing price of Friday.
That will be an area to keep an eye on in the coming week, as it will likely be the key to figuring out where prices close out on Friday.
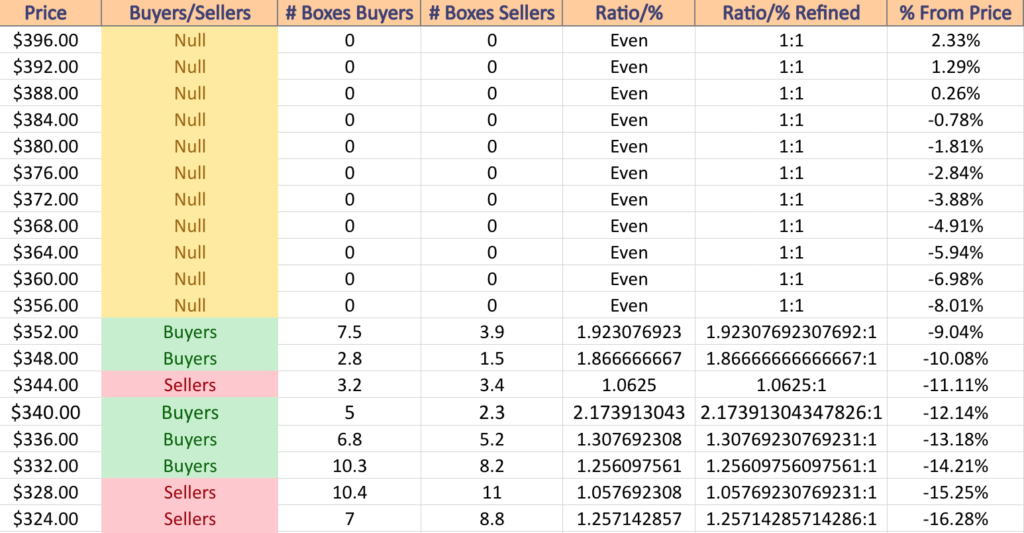
DIA has support at the $382.74 (50 Day Moving Average; Volume Sentiment: NULL, 0:0*), $378.95 (Volume Sentiment: NULL, 0:0*), $353.26 (200 Day Moving Average; Volume Sentiment: Buyers, 1.92:1) & $351.92/share (Volume Sentiment: Buyers, 1.87:1) price levels, with resistance at the $387.87 (Volume Sentiment: NULL, 0:0*), $387.92 (10 Day Moving Average; Volume Sentiment: NULL, 0:0*) & $391.90/share (All-Time-High; Volume Sentiment: NULL, 0:0*) price levels.
The Week Ahead
Monday the week kicks off with Home Builder Confidence Index data at 10 am.
Science Applications is scheduled to report earnings before the opening bell on Monday, with dLocal & Stone Co. scheduled to report after the closing bell.
Housing Starts & Building Permits data is released on Tuesday at 8:30 am.
On Tuesday morning Caleres, Endeavour Silver & Tencent Music report earnings before the opening bell, with ZTO Express reporting earnings after the session’s close.
Wednesday s a big day, with the FOMC Interest Rate Decision at 2pm, followed by Fed Chair Powell’s press conference at 2:30 pm.
Micron is scheduled to report earnings on Wednesday, with BioNTech, BRP, General Mills, Kingsoft Cloud, Ollie’s Bargain Outlet & Signet Jewelers scheduled to report earnings before the session’s open & BlackBerry, Chewy, Five Below, Guess?, KB Home, Steelcase, Wheaton Precious Metals & Worthington Enterprises scheduled to report earnings after the closing bell.
Initial Jobless Claims & Philadelphia Fed Manufacturing Survey data are released at 8:30 am on Thursday, followed by S&P Flash U.S. Services PMI & S&P Flash U.S. Manufacturing PMI data at 9:45 am & U.S. Leading Economic Indicators & Existing Home Sales data at 10 am.
Thursday’s major earnings reports comes from FedEx & Nike after the bell, with Academy Sports + Outdoors, Accenture, Darden Restaurants, Designer Brands, FactSet, Shoe Carnival, Titan Machinery & Winnebago scheduled to report before the day’s session & AAR Corp, Lululemon Athletica & Worthington Steel all scheduled to deliver earnings results after the close.
Friday does not have any major economic data scheduled to be released.
There are no noteworthy earnings reports scheduled for Friday.
See you back here next week!
*** I DO NOT OWN SHARES OR OPTIONS CONTRACT POSITIONS IN SPY, QQQ, IWM OR DIA AT THE TIME OF PUBLISHING THIS ARTICLE ***