SPY, the SPDR S&P 500 ETF gained +3.45% this past week, with trading volumes falling more back in line with the average over the past year.
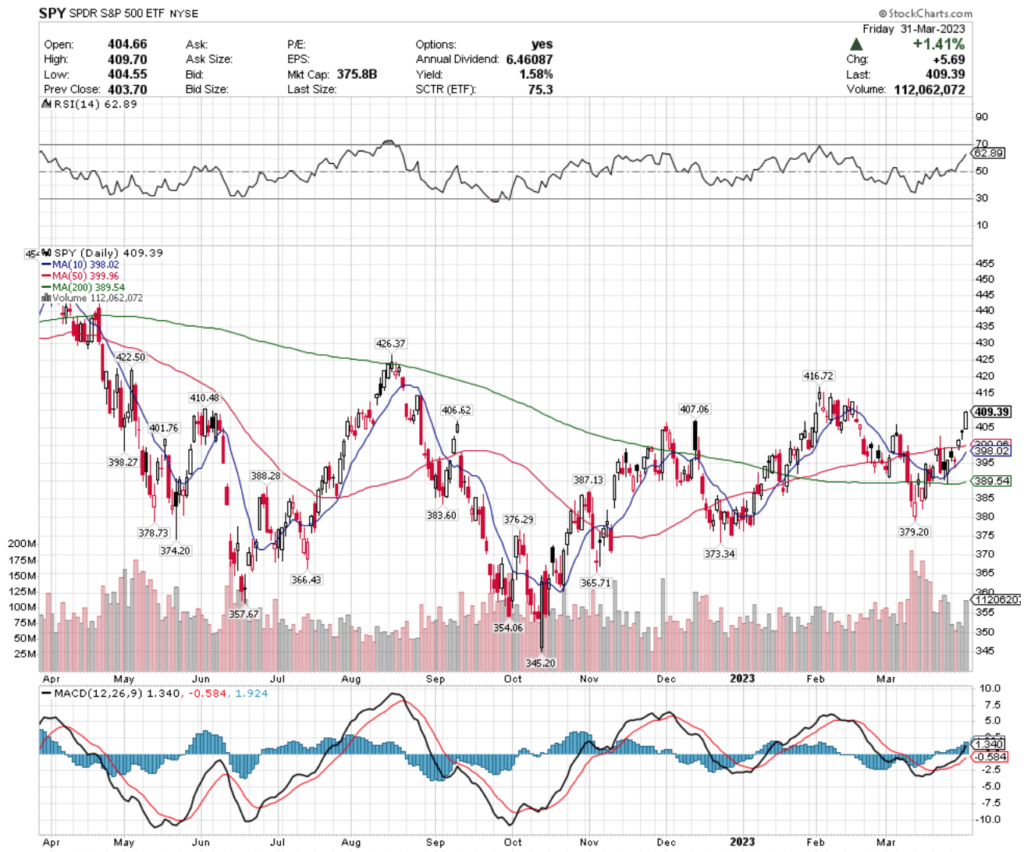
Their MACD is very bullish, but their 62.89 RSI is approaching overbought territory.
Resistance after the past week’s rally is at $410.48, $416.72 & $422.50, with support at the $407.06, $406.62 & $401.76/share price level.
QQQ, the Invesco QQQ Trust ETF added +3.23% over the past week, with volumes also returning more to the average level for the past 52 weeks.

At 68, QQQ’s RSI is almost overbought, although their MACD is still showing bullish signals.
QQQ has support at the $313.93, $312.16 & $310.83 (10 day moving average), with overhead resistance at the $327.77, $331.51 & $338.56/share price levels.
IWM, the iShares Russell 2000 ETF gained +3.85% last week, showing smaller cap stocks were favored compared to larger cap names.
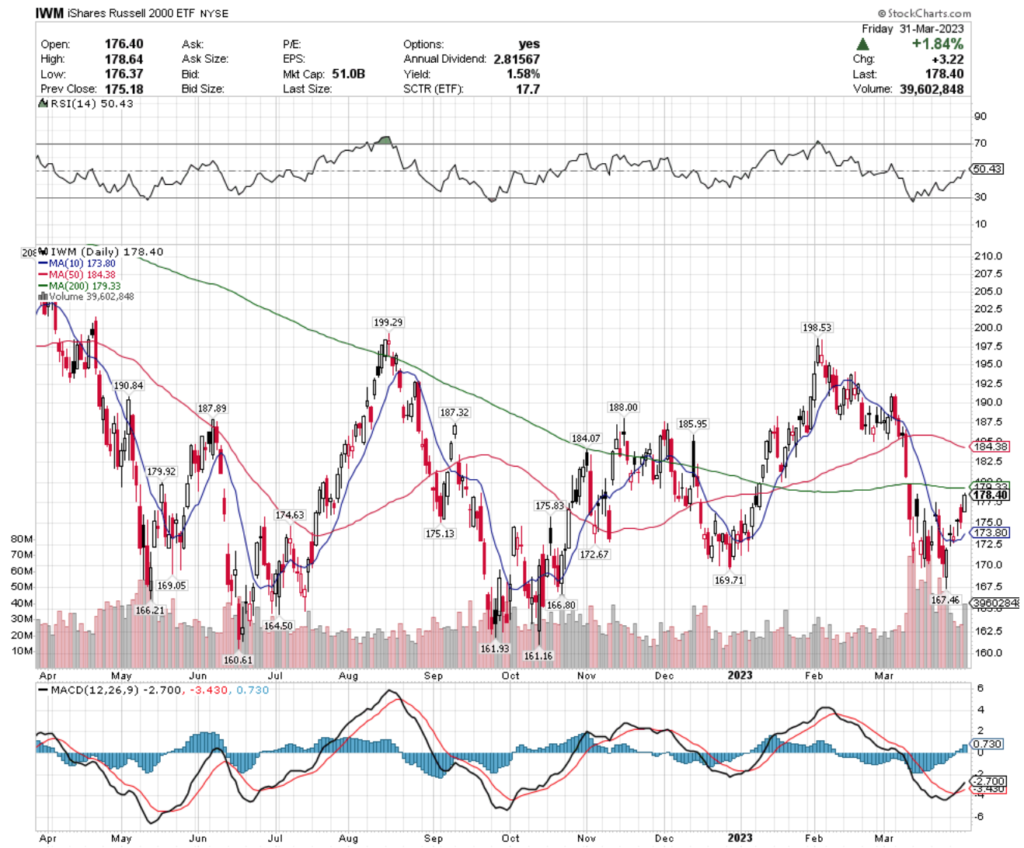
They bucked the trend & has above average volume, during a volatile, but successful week.
Their RSI is neutral at 50.43 & MACD is bullish, but their 200 day moving average is 0.52% away & will be an interesting resistance point to watch for more insight into their future performance.
IWM has support at the $175.83, $175.13 & $174.63/share price levels, with resistance at the $179.33 (200 day moving average), $179.92 & $184.07/share price levels.
Let’s dive into the week’s report.
Global Gold Miners (RING), Europe (EURL), North American Tech (IGM) & Global Comm Services (IXP) Are All Bullishly Leading The Market
RING, the iShares MSCI Global Gold Miners ETF has lost -13.74% over the past year, but has recovered +51.72% (ex-distributions) since their 52 week low in September 2022.
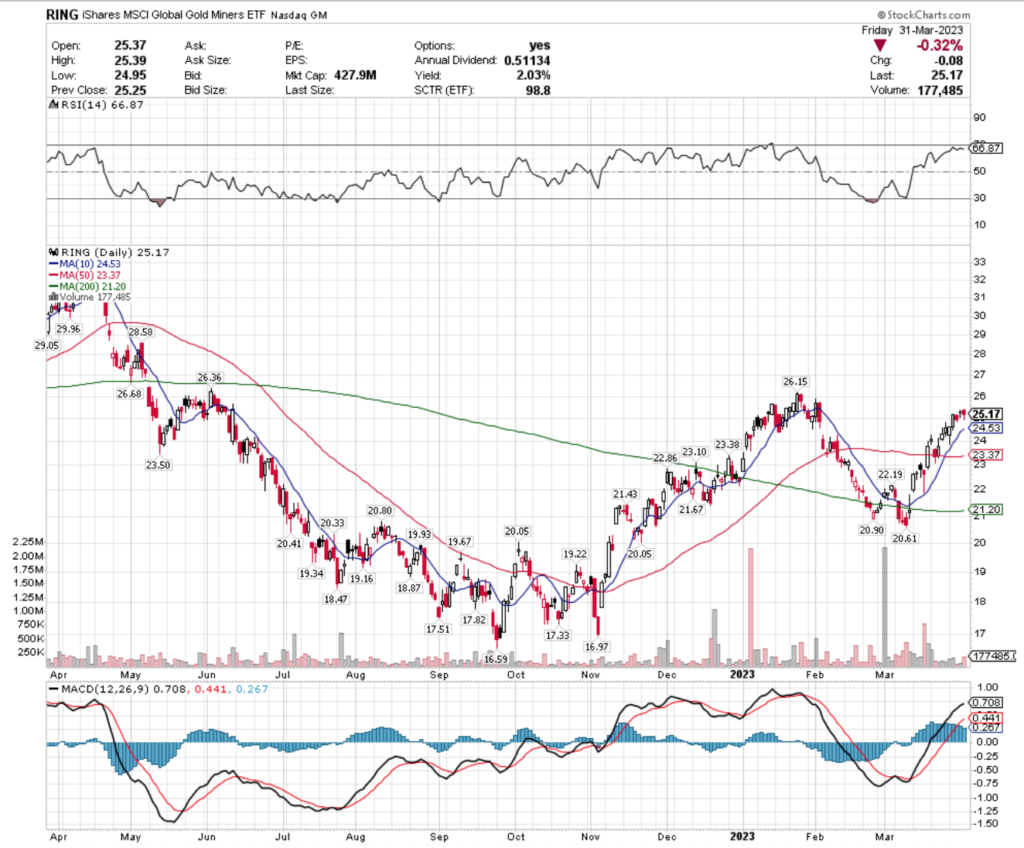
Their RSI is approaching overbought at 66.87 & their MACD has begun curling over, signaling a cool down period in the near-term.
Given that their distribution yield is only 2.03% for long-term shareholders, it may be wisest to wait to see how they behave at their next test of support or trade an options strategy rather than buying long shares into uncertainty.
RING has support at the $24.53 (10 day moving average), $23.50, $23.38 & $23.37 (50 day moving average), with resistance overhead at the $26.15, $26.36, $26.68 & $28.58/share price levels.
EURL, the Direxion Daily FTSE Europe Bull 3x Shares ETF has lost -25% over the past 52 weeks, but has rebounded +128.04% (ex-distributions) since their low in October of 2022.

Their MACD is still bullish, while their RSI is neutral & recent trading volumes have been about average compared to the year prior.
After Thursday & Friday’s candlesticks & the back to back gap up day mid-week EURL should also be approached with caution, as their 1.68% distribution yield will only provide so much safety from a near-term shakeup in price.
EURL has support at the $21.15, $20.83 (50 day moving average), $20.74 & $19.95/share price levels, with resistance at the $21.83, $22.52, $22.73 & $23.08/share price levels, which are the key areas to be watching their behavior at currently.
IGM, the iShares North American Tech ETF has lost -14.12% over the past year, but has climbed +30.21% (ex-distributions) from their low of October 2022.
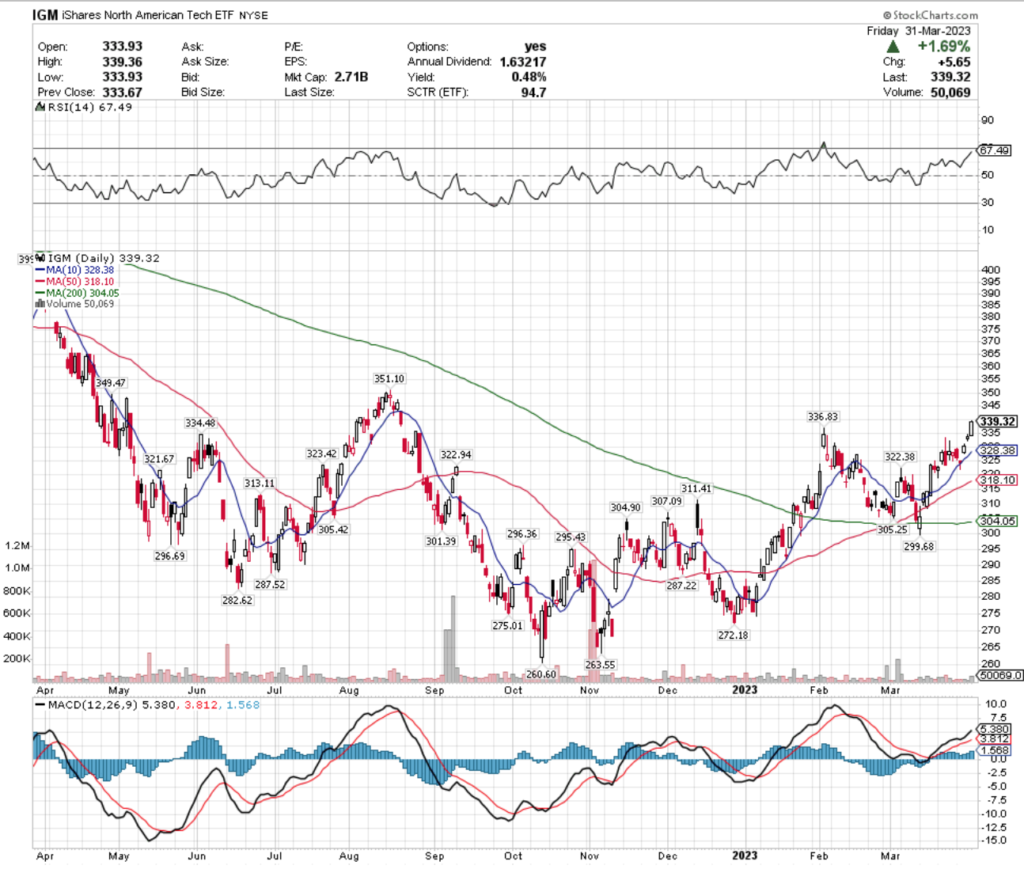
Their RSI is approaching overbought conditions at 67.49, as their MACD begins to show signals of exhausting.
Recent trading volumes have been below average compared to the year prior & their 0.48% distribution yield will not provide much cushion for safety, making IGM another candidate for options trading while waiting for their price to stabilize.
IGM has support levels to keep an eye on at the $336.83, $334.48, $328.38 (10 day moving average) & $323.42/share price level, with resistance at the $349.47, $351.10, $352.90 & $359.78/share levels.
IXP, the iShares Global Comm Services ETF dropped -14.8% over the past year, but has gained +29.05% (ex-distributions) since their low in November of 2022.
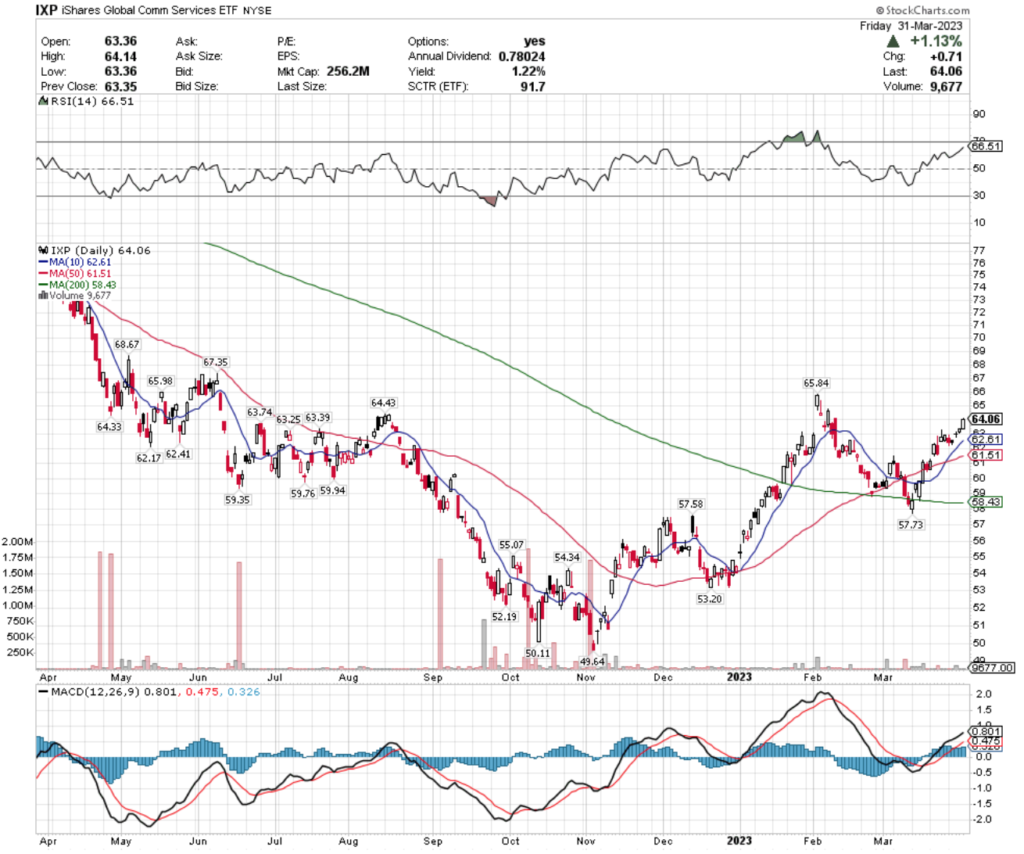
Their RSI is also approaching the overbought level & their MACD is beginning to show signals of losing momentum.
While long-term holders will receive 1.22% annually in the form of distributions, patchy low trading volumes raise concerns about IXP’s strength in the near-term & signal to hold off on a long-term position entry.
IXP has support at the $63.74, $63.39, $63.25 & $62.61 (10 day moving average) price levels, with resistance at the $64.33, $64.43, $65.84 & $65.98/share price levels.
Banks (KBE), Genomics Immunology and Healthcare (IDNA), Mortgage Real Estate (REM) & Brazil (BRZU) Are All Bearishly Lagging The Market
KBE, the SPDR S&P Bank ETF has lost -30.32% over the past year, losing -30.49% from the high of April 2022, but reclaiming +7.89% (ex-distributions) since their recent low.
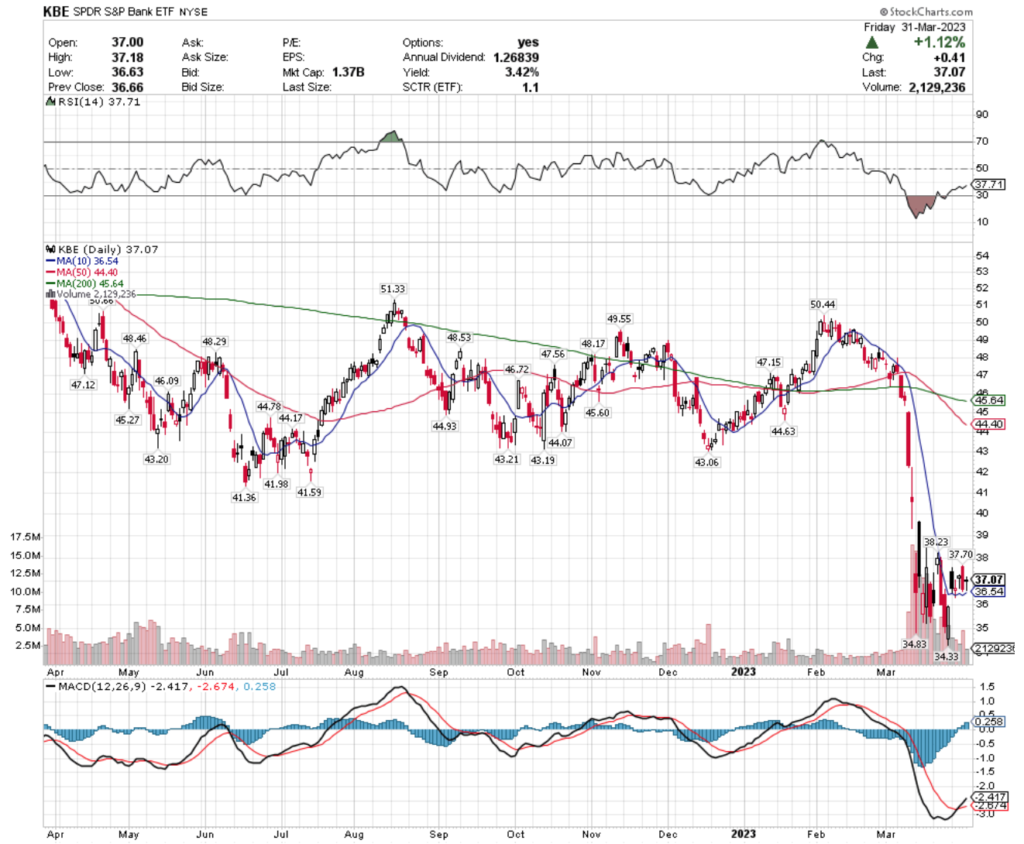
Their RSI has recently recovered from being in oversold territory but remains on the oversold end of neutral after suffering sharp declines in March 2023 & MACD has crossed over bullishly while the price has consolidated over the past month.
Recent trading volumes have been very high compared to the year prior, and their 3.42% annual distribution yield will provide some protection against loss for long-term holders, but the price may still require more time to settle down making any near-term moves in the name without options protection unwise.
KBE has support at the $36.54 (10 day moving average), $34.83 & $34.33/share price levels, with resistance at the $37.70, $38.23 & $41.36/share price levels.
IDNA, the iShares Genomics Immunology & Healthcare ETF has lost -33.07% over the past year, dropping -35.22% from their high in April 2022, but has reclaimed +5.34% (ex-distributions) from their low of March 2023.
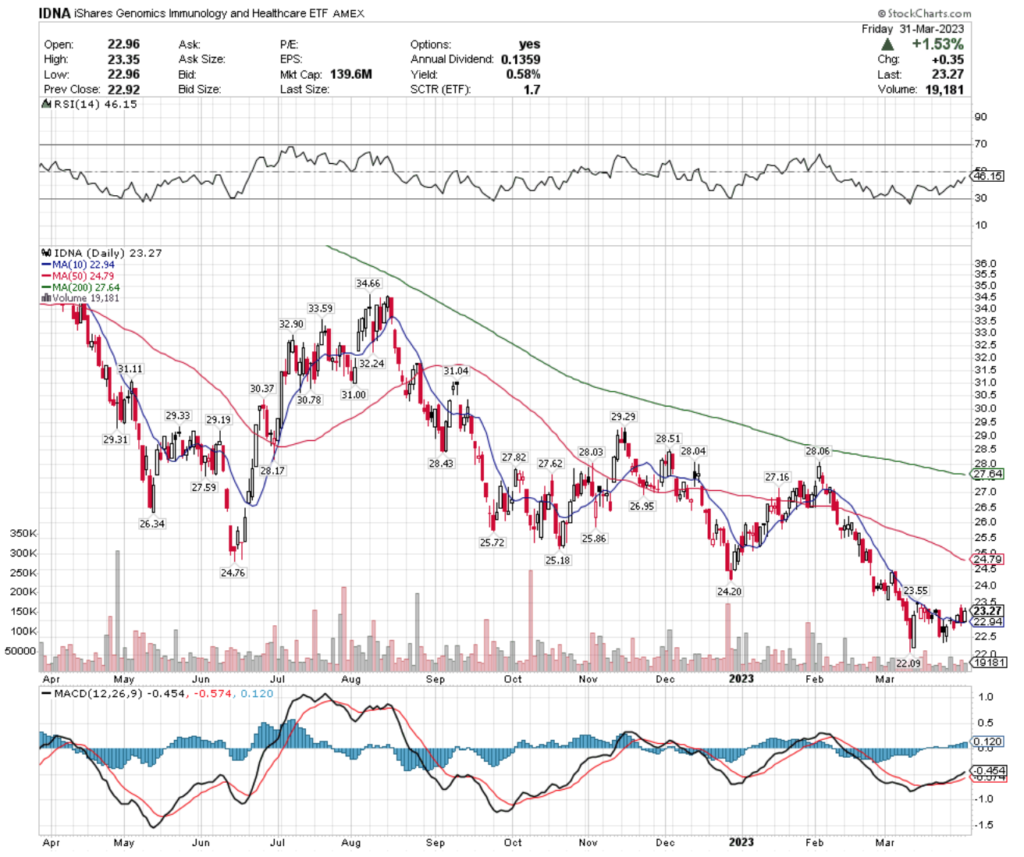
Their RSI is approaching neutral again, while their MACD is still bullish, but recent trading volumes have been very light compared to the year prior.
IDNA’s 0.58% distribution yield will not provide much protection for investors, so waiting to see how their price behaves around support/resistance areas will be imperative to find the most opportune entry point.
IDNA has support at the $22.94 & $22.09/share price levels, with resistance at the $23.55, $24.20 & $24.76/share price levels.
REM, the iShares Mortgage Real Estate Capped ETF has lost -26.34% over the past 52 weeks, losing -27.56% since their high in April 2022, while regaining +16.17% since their low in October 2022 (ex-distributions).
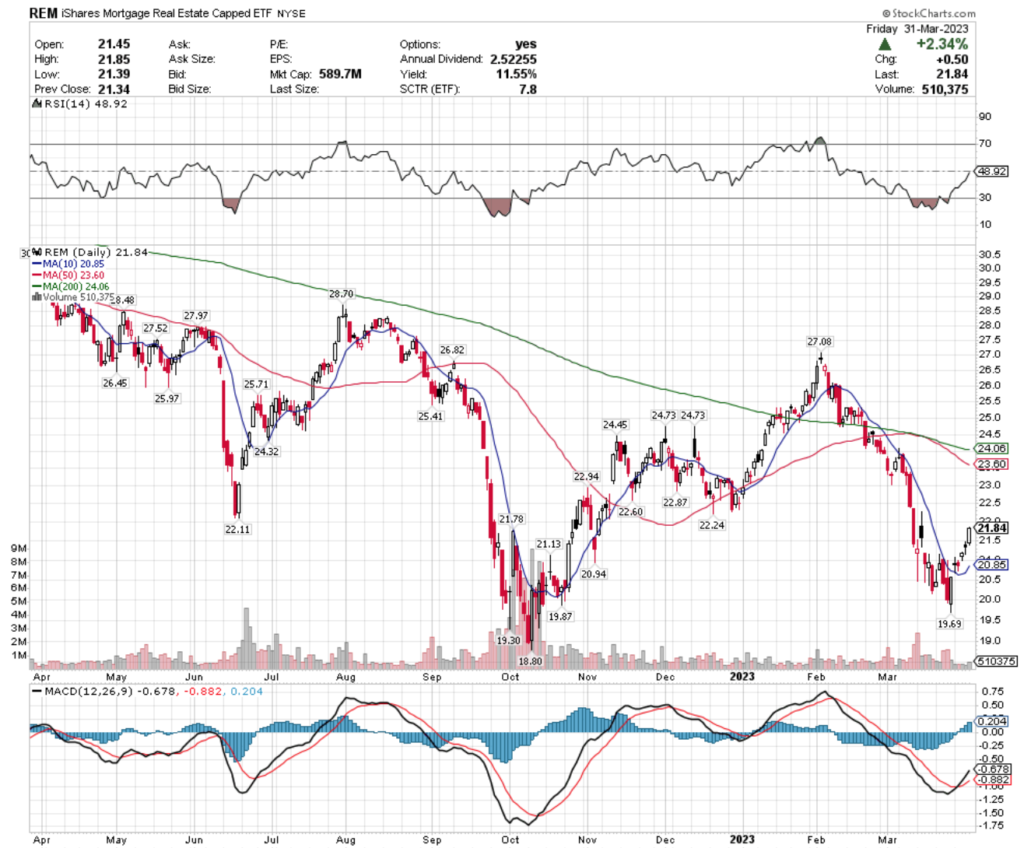
With a bullish MACD, REM’s RSI has recovered to just below neutral levels after their price slid most of the past 2 months.
While long-term holders receive an 11.55% distribution yield, their shaky recent trading volumes show that there is still uncertainty around where to value these shares at & it would be wisest to approach with caution.
REM has support at the $21.78, $21.13, $20.94 & $20.85 (10 day moving average)price levels, with resistance at the $22.11, $22.24, $22.60 & $22.87/share price levels.
BRZU, the Direxion Daily Brazil Bull 2x Shares ETF has lost -43.75% over the past year, shedding -48.5% since their high of April 2022 & has gained +20.47% (ex-distributions) since their low in July 2022.
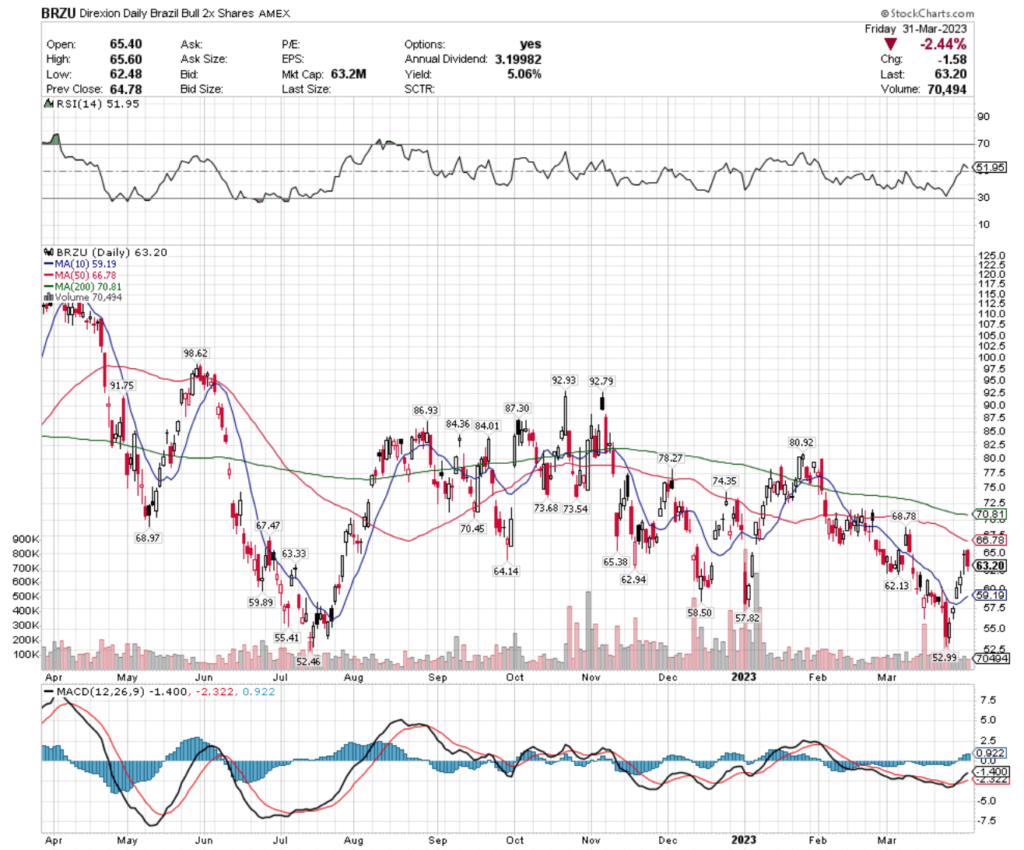
Their MACD is beginning to show signs of waning enthusiasm, as their RSI is is re-approaching neutral, which when paired with their below average recent trading volumes is a good reason to wait & see how they interact with their nearest support/resistance levels before making an investment in them.
While their distribution yield is 5.06%, that is not enough protection to justify entry into a long-term position here.
BRZU has support at the $62.94, $62.13, $59.89 & $59.19 (10 day moving average) price levels, with resistance overhead at the $63.33, $64.14, $65.38 & $67.47/share price levels.
Tying It All Together
This week we hit the pavement running Monday, with St. Louis Fed President Bullard speaking at 8:30 am, followed by S&P final U.S. Manufacturing PMI at 9:45 am, ISM Manufacturing & Construction Spending data at 10 am & closing out with Fed. Governor Cook speaking at 4:15 pm.
Factory Orders & Job Openings data get reported on Tuesday at 10 am & at 6 pm Cleveland Fed President Mester speaks.
On Wednesday we get the ADP Employment data at 8:15 am, with U.S. Trade Balance data at 8:30 am, S&P Final U.S. Services PMI data at 9:45 am & the ISM Services report at 10 am.
Thursday kicks off with Initial Jobless Claims & Continuing Jobless Claims data at 8:30 am, with St. Louis Fed President Bullard Speaking at 10 am.
We close out with the US Unemployment Report, US Unemployment Rate, Average Hourly Wages & Average Hourly Wages Y-o-Y at 8:30 am on Friday, followed by Consumer Credit data at 3 pm.
See you back here next week!
*** I DO NOT OWN SHARES OR OPTIONS CONTRACT POSITIONS IN SPY, QQQ, IWM, RING, EURL, IGM, IXP, KBE, IDNA, REM or BRZU AT THE TIME OF PUBLISHING THIS ARTICLE ***