SPY, the SPDR S&P 500 ETF closed the week mostly flat, falling -0.06%, as we began receiving more earnings data from companies, while hearing a number of Federal Reserve speakers throughout the week.
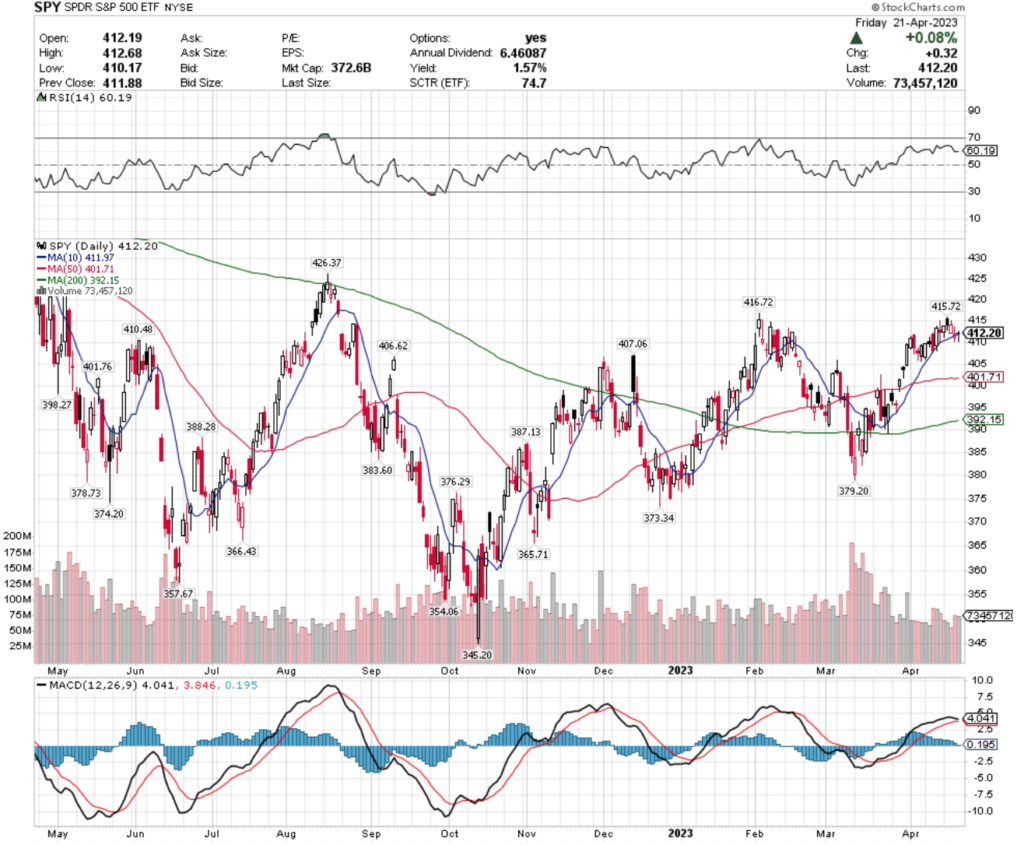
Their MACD is about to bearishly crossover, which looks particularly troubling, as with an RSI of 60 (overbought end of neutral), there is more room to fall before algorithms will be tripped into buying again.
Volume in April has been lower than March, but relatively average compared to the rest of the year prior, and last week’s assortment of candlesticks show a rejection of the $415 price level, followed by uncertainty floating between $410-$415/share.
SPY has support at the $411.97 (10 day moving average), $410.48, $407.06 & $406.62/share price levels, with resistance at the $415.72, $416.72, $426.37 & $438.52/share price levels.
QQQ, the Invesco QQQ Trust ETF fared a bit worse than SPY, dropping -0.62% during the course of last week, as investors moved away from the technology-heavy index.
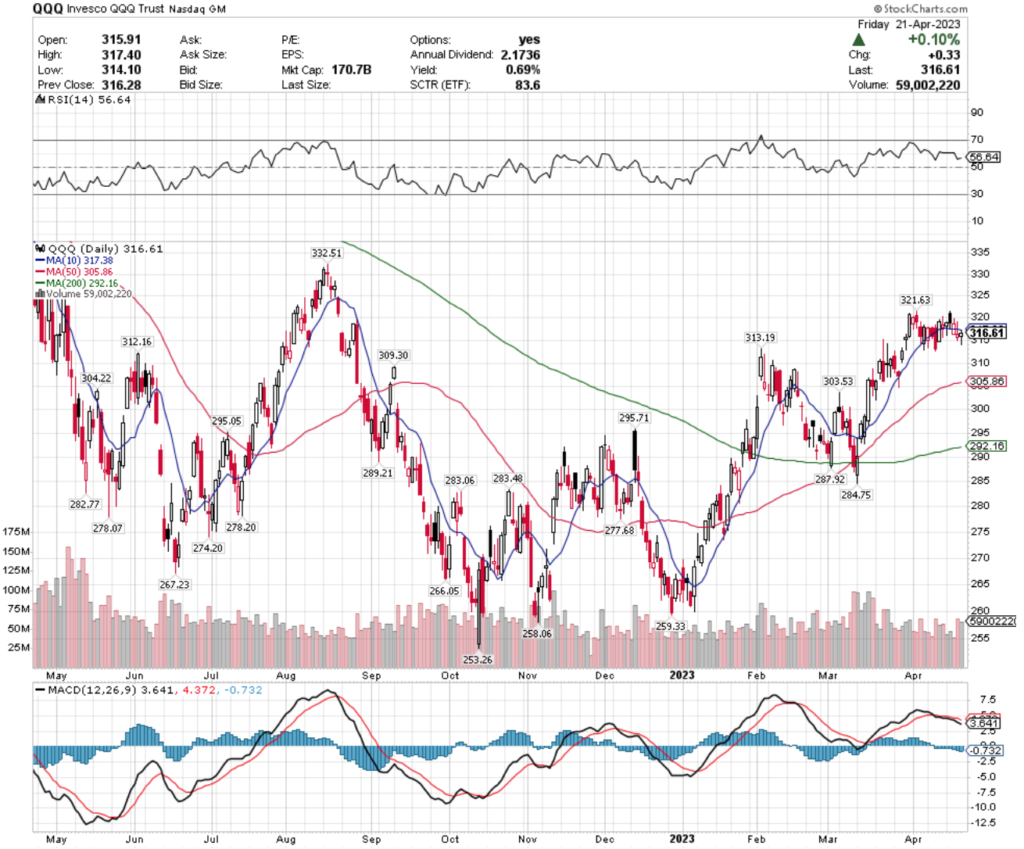
Their MACD has already completed a bearish crossover in April, as they’ve hovered around a consolidation range for most of the month, with their RSI at 56.
Volumes have been about average/just below average compared to the year prior throughout that time & Friday’s hanging man candle after Thursday’s shooting star candlestick signals more uncertainty & consolidation are on the horizon.
QQQ has support at the $313.19, $312.16, $309.30 & $305.86/share (50 day moving average) price levels, with resistance at the $317.38, $321.63, $331.19 & $332.51/share price levels.
IWM, the iShares Russell 2000 ETF proved small caps were the haven of choice this week among market participants, gaining +0.59% over the course of the week.
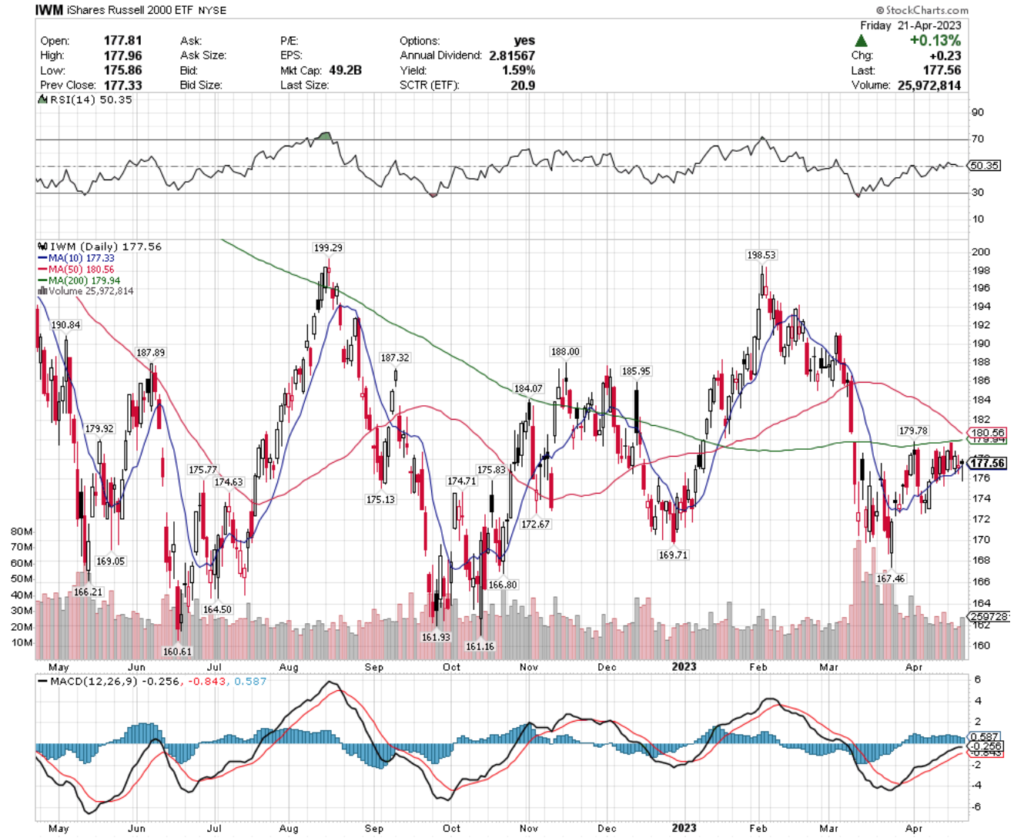
Their RSI is neutral at 50, and their MACD is beginning to show signs of a near-term bearish crossover on the horizon in the next couple of trading sessions.
Volumes have settled down relative to March’s above average volume & are still about average compared to the year prior.
Much like SPY & QQQ, IWM has been in a consolidation range for the month of April so far, with Thursday & Friday’s candlesticks looking very similar to their larger index counterparts’ as well.
IWM has support at the $177.33 (10 day moving average), $175.83, $175.77 & $175.13/share price levels, with resistance overhead at the $179.78, $179.92, $179.94 (200 day moving average) & $180.56/share (50 day moving average) price levels.
Let’s dive into some of the best & worst sectors & geo-locations in the market based on this week’s technical analysis ratings for their respective ETF’s!
Mexico (EWW), Switzerland (EWL), Semiconductors (SMH) & European SmallCap Dividend Investments (DFE) Are All Bullishly Leading The Market
EWW, the iShares MSCI Mexico Capped ETF has gained +20.64% over the past year, climbing +37.34% from their 52 week low in September of 2022 (ex-distributions).
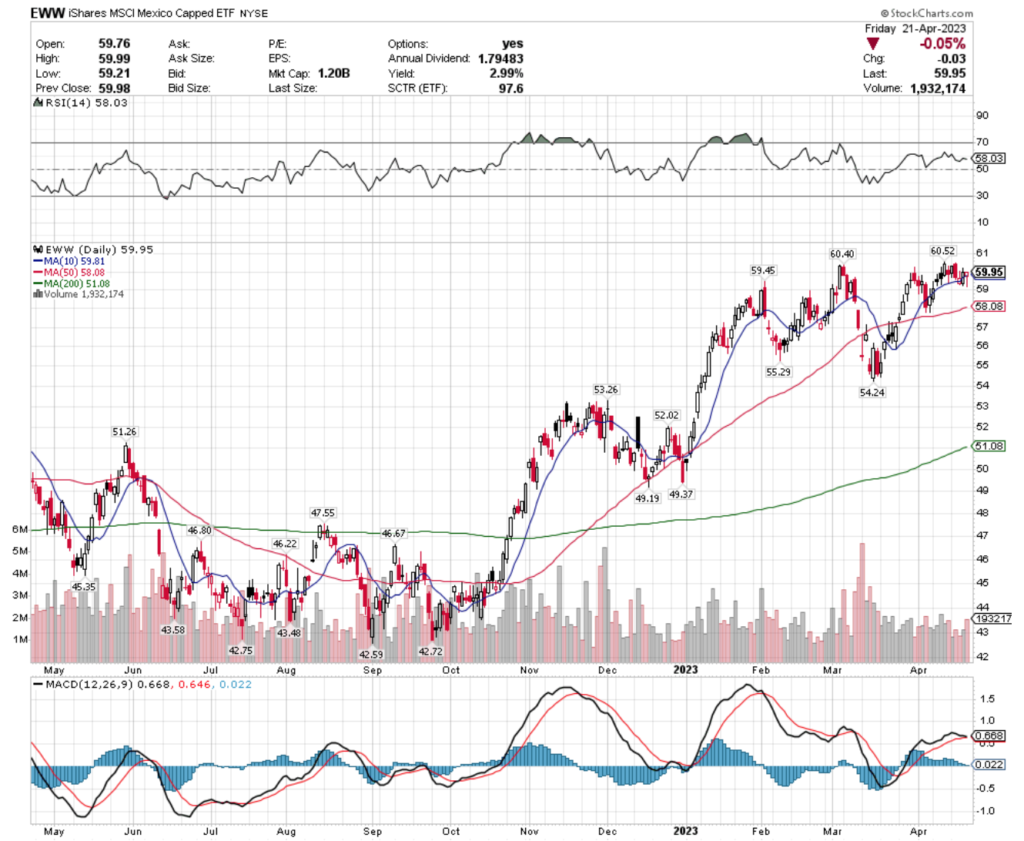
Their MACD is beginning to send signals of an impending cool off period, which is further supported by Friday’s hanging man candlestick.
Their RSI is on the oversold end of neutral at 58, with recent volumes being a bit lower than average compared to the year prior, signaling slowing enthusiasm in the near-term.
EWW pays a 2.99% distribution to long-term holders, which can provide some protection from a downfall, but otherwise it would be wisest to use an options strategy for protection (selling calls/buying puts), while eying its behavior at support levels in the coming weeks.
EWW has support at the $59.81 (10 day moving average), $59.45, $58.08 (50 day moving average) & $55.29/share price levels, with resistance at the $60.40 & $60.52/share price levels.
EWL, the iShares MSCI Switzerland Capped ETF has gained 2.9% over the past year, but has bounced back +33.54% from their 52 week low in October of 2022 (ex-distributions).
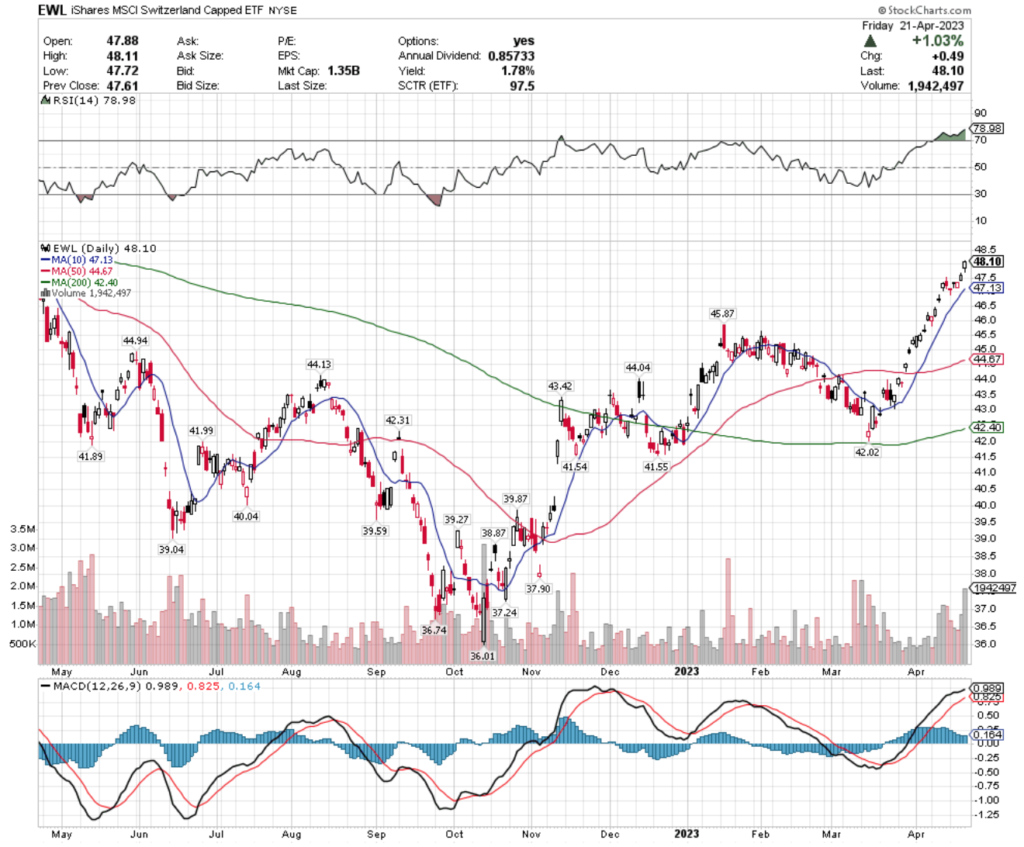
Their RSI is well into overbought territory at 78.98, with their MACD beginning to signal a bearish rollover.
Friday’s hanging man candlestick on a +1% gap up with high volume will make for an interesting Monday/Tuesday session while we wait to see if the gap is filled or not.
EWL pays a 1.78% distribution to long-term shareholders, but that will not be enough protection when you factor in where their support levels, so other methods of insurance would be beneficial while watching where to make a better entry in less volatile market conditions.
EWL has support at the $47.13 (10 day moving average), $45.87, $44.94 & $44.67/share (50 day moving average) price levels, with resistance at the $49.27, $50.28 & $52.02/share price levels.
SMH, the VanEck Vectors Semiconductor ETF has grown +7% over the past year, while rising +48.73% since their 52 week low in October of 2022 (ex-distributions).
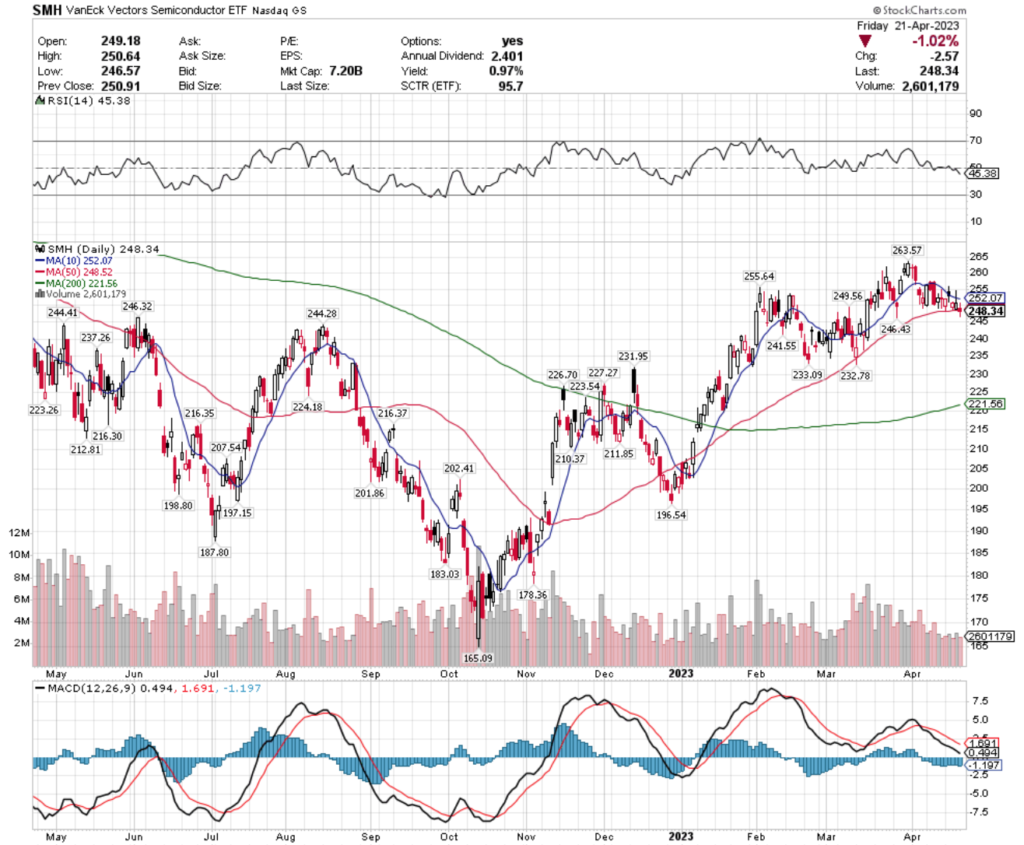
Their MACD has been bearish for a couple of weeks, but their RSI is relatively neutral (oversold side), after spending the past couple of weeks in a consolidation range.
Recent trading volumes have been below average, signaling indecision on the part of investors, which is validated by Friday’s doji candlestick.
SMH’s 0.97% distribution yield doesn’t offer much in the form of insurance against losses from volatility, making it important to have an options strategy as a hedge while eyeing how they behave at support levels to begin planning an entry.
SMH has support at the $246.43, $246.32, $244.41 & $244.28/share price levels, with resistance at the $248.52 (50 day moving average), $249.56, $252.07 (10 day moving average) & $255.64/share price levels.
DFE, the WisdomTree Europe SmallCap Dividend Fund has lost -3% over the past year, but has grown 35.96% since their 52 week low in September of 2022 (ex-distributions).

Their MACD is beginning to signal a bearish crossover in the coming days, with their RSI showing room to cool off, as it is approaching the overbought end of neutral.
This is a lightly traded ETF throughout the year that sports a 5.91% distribution for long-term shareholders.
While eyeing their behavior at support levels, there may be opportunities using options to profit from a near-term strategy, but as the shares themselves as so illiquid, make sure open interest levels are liquid before trading them.
DFE has support at the $59.60 (10 day moving average), $58.41 (50 day moving average), $57.96 & $56.82/share price levels, with resistance at the $60.19, $60.49, $60.84 & $61.27/share price levels.
Regional Banks (DPST), Oil & Gas Exploration & Production (XOP), China (PGJ) & 20+ Year Treasuries (UBT) Are All Bearishly Lagging The Market
DPST, the Direxion Daily Regional Banks Bull 3x Shares ETF has fallen -79.46% over the past year, losing -81.9% from their 52 week high in August of 2022, but reclaiming +9.08% from their 52 week low in March of 2023 (ex-distributions).
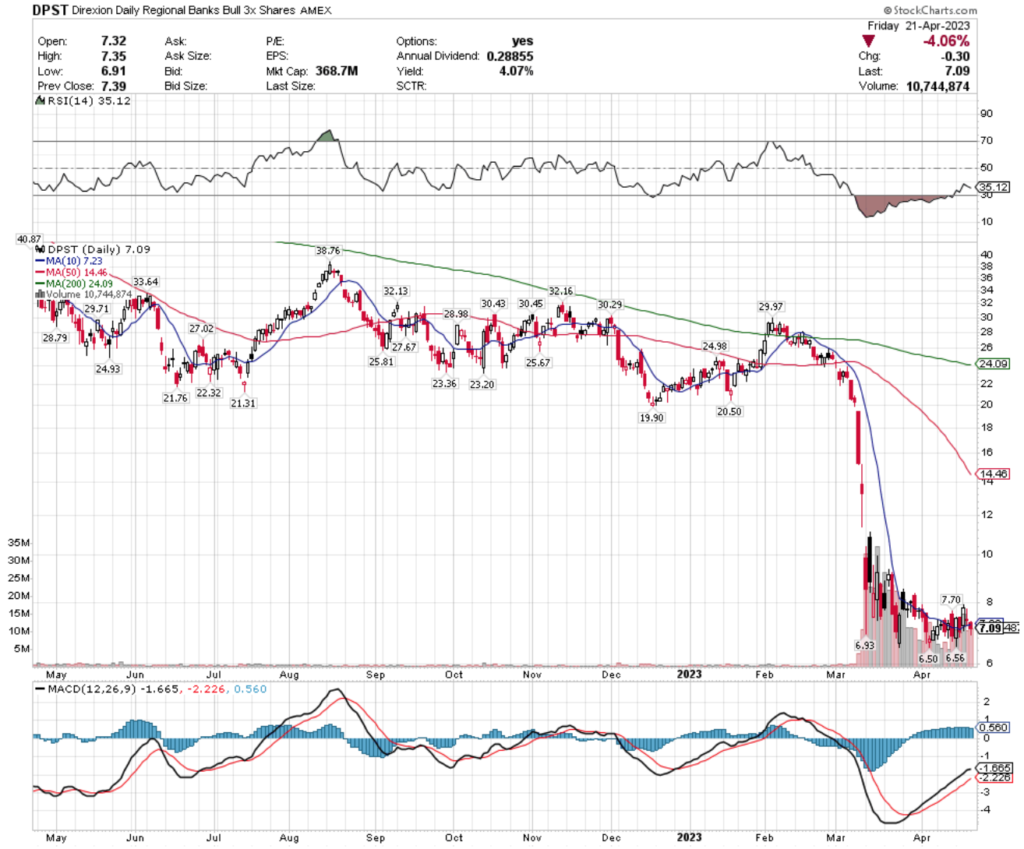
Their MACD has been bullish since late March, but their RSI is bearishly trending back to oversold conditions after this most recent consolidation period.
Recent volumes have been above average compared to the year prior, with the past few days’ candlesticks signaling more uncertainty.
While they offer a 4.07% distribution yield to long-term holders, traders can profit in the meantime using options strategies while the market participants find an agreeable price range for DPST.
DPST has support at the $6.93, $6.56 & $6.50/share price levels, with resistance overhead at the $7.23 (10 day moving average), $7.70 & $14.46/share (50 day moving average) price levels.
XOP, the SPDR S&P Oil & Gas Exploration & Production ETF has shed -1.91% over the past year, losing 25.62% since their 52 week high of June of 2022, but gaining 17.51% since their 52 week low of July 2022 (ex-distributions).
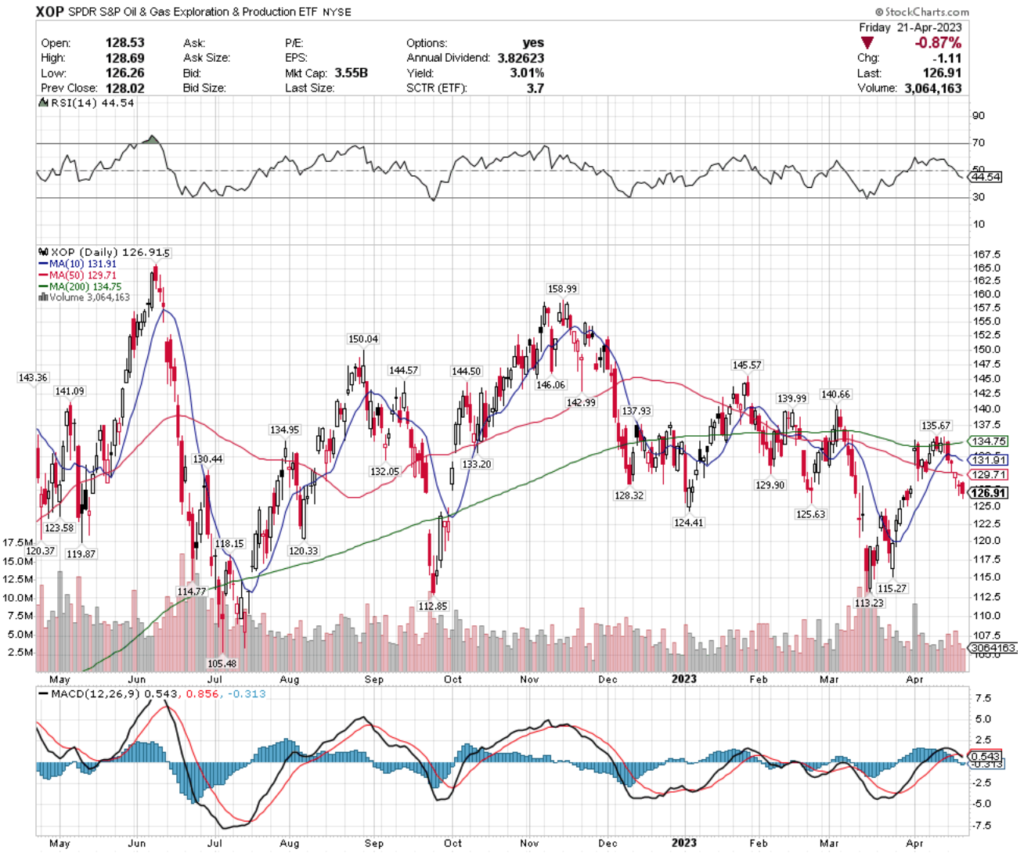
Their MACD recently completed a bearish crossover, but their recent volumes have been below average, signaling uncertainty, which is further confirmed by their mix of candlesticks from the past week, which include multiple bearish hanging man candles & a doji.
Their RSI is approaching the oversold end of neutral at 44, but with only 3.01% cushion for losses from their distribution yield (for long-term holders), unless using an options protection strategy, it would be wisest to wait & see at what level they begin trending upward again.
XOP has support at the $125.63, $124.41, $123.58 & $120.33/share price level, with resistance at the $128.32, $129.71 (50 day moving average), $129.90 & $130.44/share price levels.
PGJ, the Invesco Golden Dragon China ETF has gained 7.81% over the past year, losing -20.75% from their 52 week high in June of 2022, while rebounding +60.7% since their 52 week low in October of 2022 (ex-distributions).
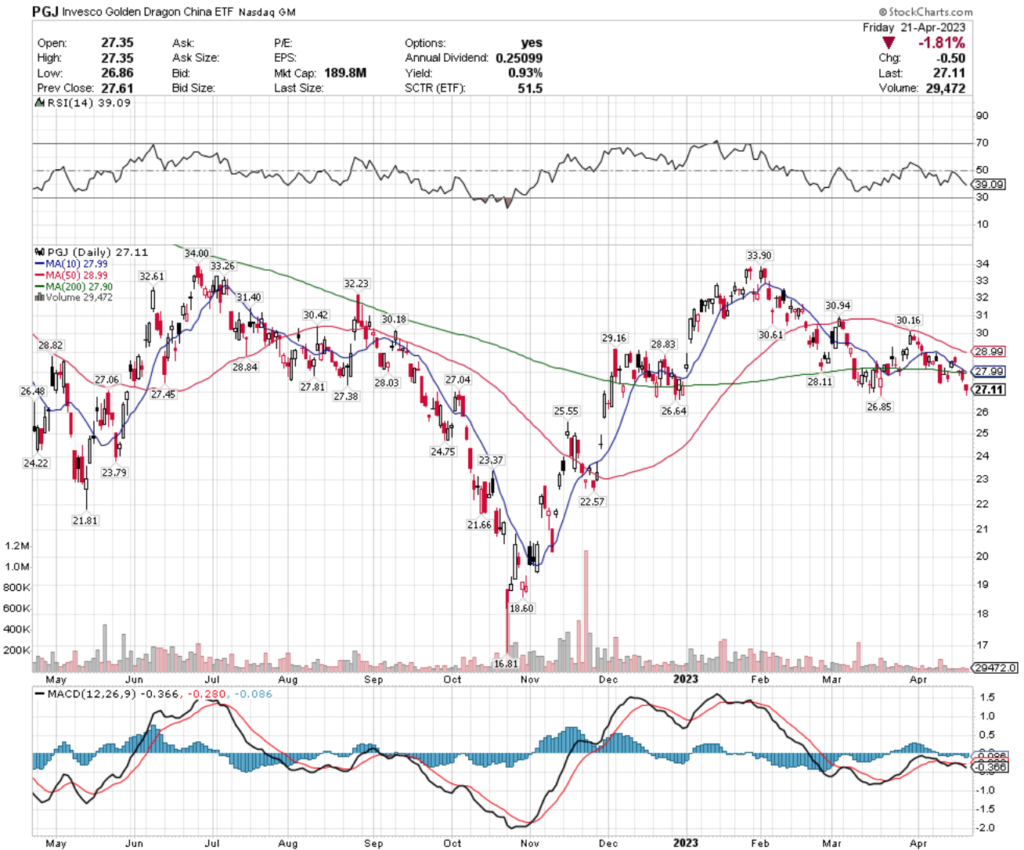
Their RSI is beginning to approach oversold conditions, but their MACD is trending downward.
Recent volumes have been extremely light & below average, confirming the negative sentiment that the 2 gap down days last week expressed.
With only 0.93% for longterm holders coming from distribution, this is another one to either trade around using options, or wait to see when it begins to find stable footing at one of its support levels.
PGJ has support at the $27.06, $27.04, $26.85 & $26.64/share price levels, with resistance at the $27.38, $27.45, $27.81 & $27.90/share (200 day moving average) price levels.
UBT, the ProShares Ultra 20+ Year Treasury ETF has lost -26.52% over the past year, losing 30.33% since their 52 week high in April of 2022, but regaining 25.98% since their 52 week low in October of 2022 (ex-distributions).
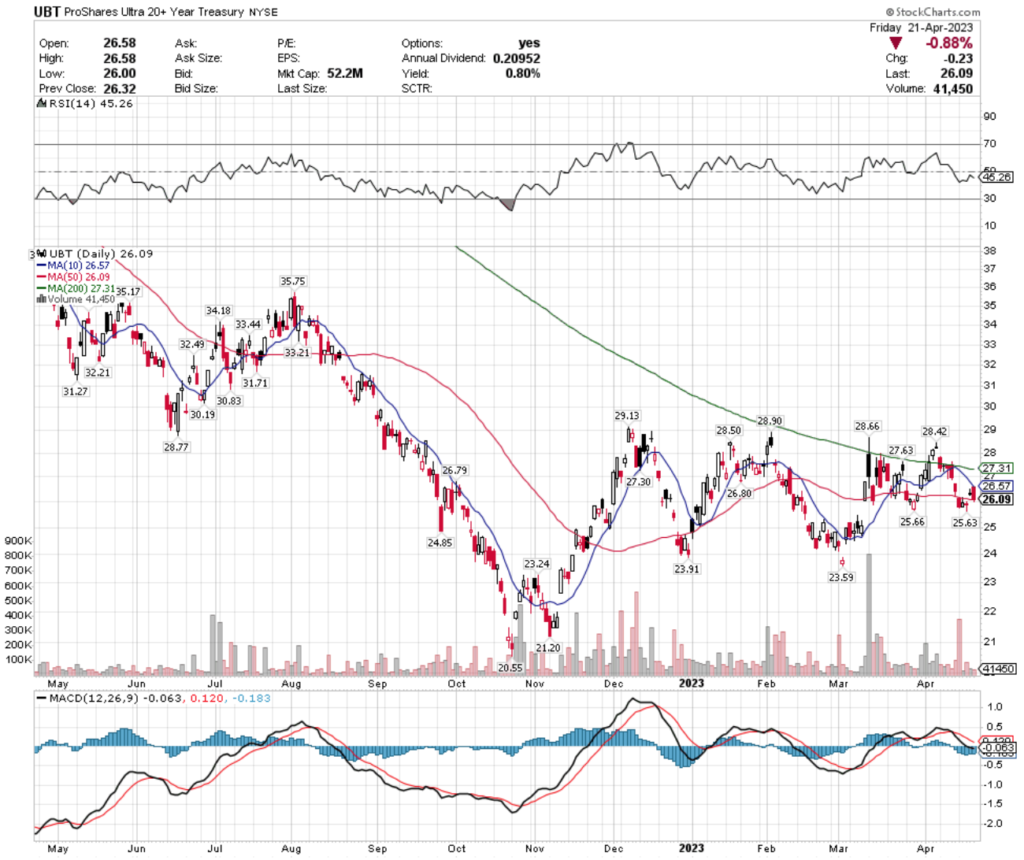
Their MACD is showing signs of a near-term bullish crossover, but they also run the risk of filling the gap from March of 2023 if there is broader market volatility.
With an RSI at 45 & trending downward, below average volume recently & a modest 0.80% distribution yield for protection, this one is best left alone until a new range is established to trend from.
UBT has support at the $25.66, $25.63, $24.85 & $23.91/share price level, with resistance at the $26.57 (10 day moving average), $26.79, $26.80 & $27.30/share price level.
Tying It All Together
In terms of data reporting, this week starts off quiet, with nothing to be announced on Monday, which will give more control over the market’s direction to the results of earnings reports.
Monday’s earnings reports include Bank of Hawaii, AGNC, Coca Cola, Cleveland-Cliffs, First Republic Bank & Whirlpool.
On Tuesday we get the S&P Case-Schiller Home Price Index (20 cities) & the FHFA Home Price Index data at 9 am, followed by New Home Sales & Consumer Confidence numbers at 10 am.
Also on Tuesday, Microsoft, Alphabet, Archer Daniels Midland, 3M, Biogen, Chubb, Chipotle Mexican Grill, Danaher, DOW, General Electric, General Motors, Halliburton, McDonald’s, Sherwin Williams, Raytheon Technologies, Texas Instruments, UPS, Verizon Communications, Visa & many other large names report their earnings.
Wednesday we get Durable Goods Orders, Durable Goods Minus Transportation, Advanced U.S. Trade Balance In Goods, Advanced Retail Inventories & Advanced Wholesale Inventories data, all at 8:30 am.
Wednesday’s earnings include Meta, Automatic Data, C.H. Robinson Worldwide, Churchill Downs, CME Group, Boeing, eBay, Meritage Homes, Lending Club, Humana, Norfolk Southern, Old Dominion, Otis Worldwide, Penske Auto, Ryder System, Steve Madden, Thermo Fisher, United Rentals, Waste Management, Wyndham Hotels & Resorts and many other names as well.
Thursday’s data kicks off with GDP, Initial Jobless Claims & Continuing Jobless Claims at 8:30 am, and Pending Home Sales at 10 am.
Thursday will also be a busy day of earnings calls, with Amazon, AbbVie, Activision Blizzard, Amgen, Bristol-Myers, Boston Beer Co. Caterpiller, Church & Dwight, Cloudflare, Comcast, Domino’s Pizza, Eli Lilly, Grainger, Harley Davidson, Hershey Foods, Honeywell, Mastercard, Merck, Mohawk Industries, Modelez International, Northrop Grumman, S&P Global, Southern, T-Mobile, Tractor Supply, U.S. Steel, Valero Energy, Xcel Energy & many other names.
Friday the week winds down with Employment Cost Index, Personal Income (nominal), Personal Spending (nominal), PCE Index, Core PCE Index, PCE (year-over-year) & Core PCE (year-over-year) at 8:30 am, the Chicago Business Barometer at 9:45 am & Final Consumer Sentiment numbers at 10 am.
Friday is more quiet on the earnings calls front, with Aon, Charter Communications, Colgate-Palmolive, Exxon Mobil, Newell Brands & Wisdom Tree, among others all reporting quarterly earnings.
Between the data being reported & the large amount of companies reporting earnings, this promises to be a volatile week.
See you back here next week!
*** I DO NOT OWN SHARES OR OPTIONS CONTRACT POSITIONS IN SPY, QQQ, IWM, EWW, EWL, SMH, DFE, DPST, XOP, PGJ or UBT AT THE TIME OF PUBLISHING THIS ARTICLE ***