Last week earnings reports dominated the headlines, along with the continuing news about banks being in financial distress as a solution is worked out.
SPY, the SPDR S&P 500 ETF gained +0.9% over the past week, in a week that started off on a weak foot until Thursday & Friday’s sessions.
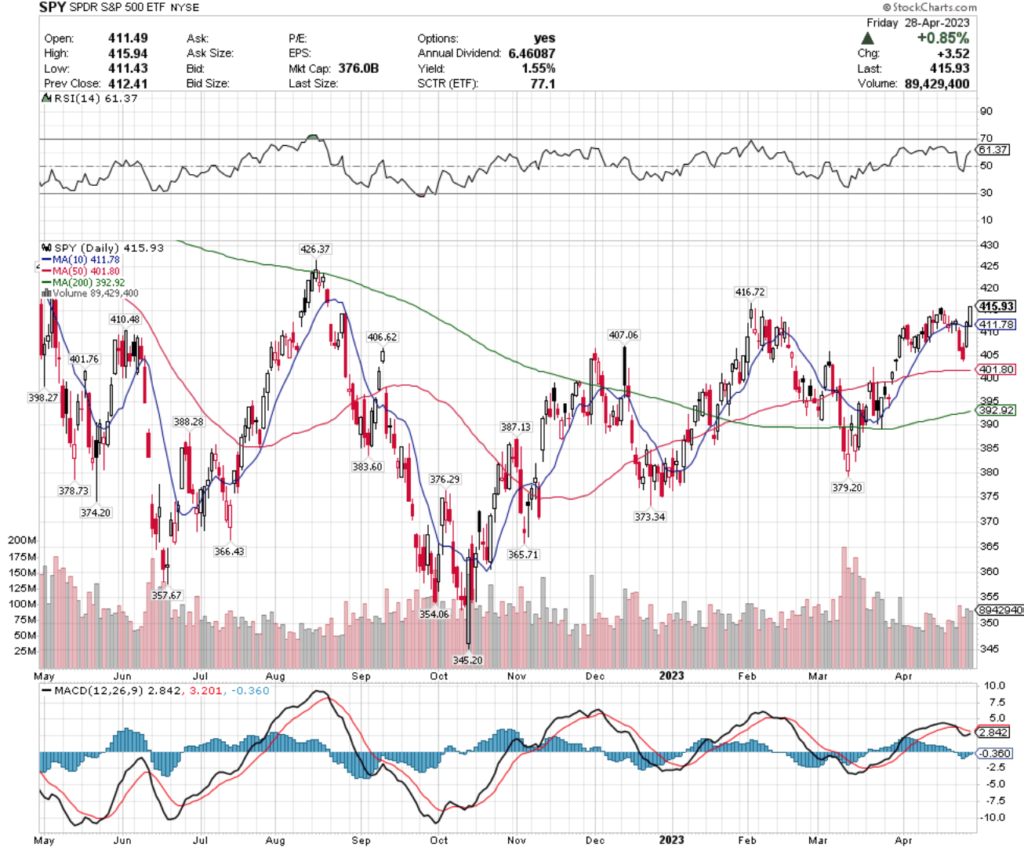
Volumes were more enthusiastic compared to the week prior, returning to about average compared to the year prior.
Their RSI is beginning to show signs of weakness as it approaches overbought conditions, but their MACD is approaching a bullish crossover, which signals there will be some volatility in the coming week.
SPY’s current moving averages, particularly the 10 day moving average are now all in positions to act as support, but they need to re-test the $416.72 resistance level.
SPY has support at the $411.78 (10 day moving average), $410.48, $407.06 & $406.62/share price levels, with resistance at the $416.72, $426.37, $438.53 & $442.12/share price levels.
QQQ, the Invesco QQQ Trust ETF improved +1.88% over the past week, faring the best of the indexes, as investors cheered earnings reports & piled into stocks most impacted by interest rates in the week before the next rate announcement.
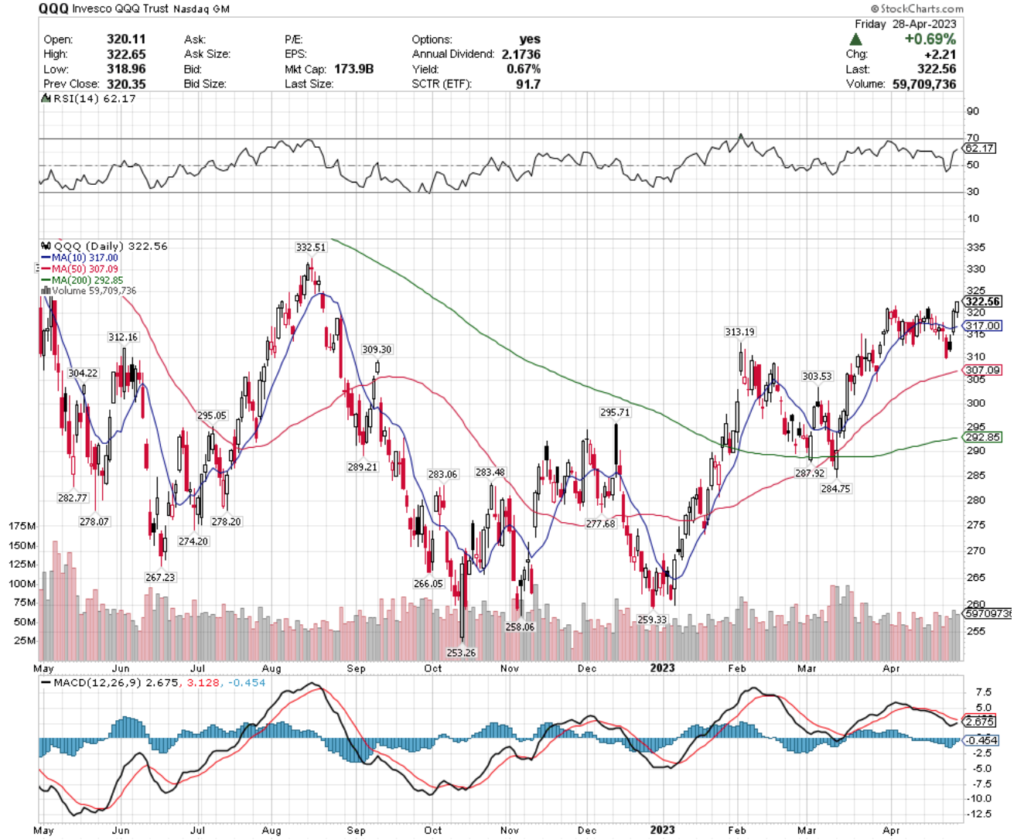
They too have an RSI approaching overbought, while their MACD is turning towards a bullish crossover, confirming the volatility SPY is also showing on the horizon.
Volumes for QQQ were also relatively in-line with average compared to the year prior, but Friday’s candlestick is signaling more uncertainty in the near-term, as it is not a hanging man due to the opening price being too low into the real-body:shadow, but is not entirely signaling bullishness either.
QQQ has support at the $317 (10 day moving average), $313.19, $312.16 & $309.30/share price levels, with resistance at the $331.19, $332.51, $338.56 & $346.78/share price levels.
IWM, the iShares Russell 2000 ETF -1.33% 0ver the past week, has investors were moving away from smaller cap stocks & investments in favor of larger S&P 500 names & technology heavy NASDAQ names.
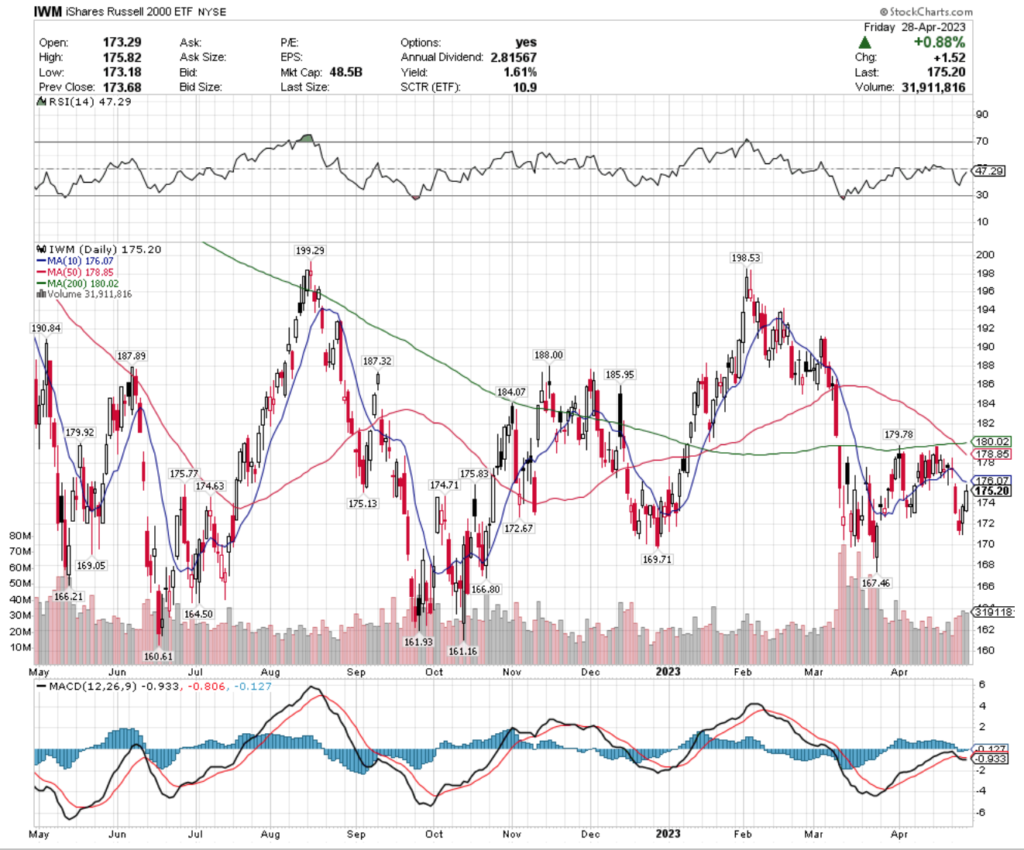
They ended the week trying to strengthen after falling out of a consolidation range earlier in the week, on above average volume compared to the year prior.
Their RSI is neutral, with their MACD fluttering around as Monday’s session will determine whether or not it settles in a bullish or bearish direction.
IWM has support at the $175.13, $174.71, $174.63 & $172.67/share price levels, with resistance at the $175.77, $175.83, $176.07 (10 day moving average) & $178.85/share (50 day moving average) price levels.
Let’s take a look into some of the best & worst performing sectors & geo-locations in the market, based on this week’s technical analysis!
Homebuilders (XHB), Greece (GREK), Indonesia (EIDO) & Emerging Markets Dividend Stocks (EDIV) Are All Bullishly Leading The Market
XHB, the SPDR S&P Homebuilders ETF has climbed +14.49% over the past year, gaining +38.43% since their 52 week low in June of 2022 (ex-distributions).
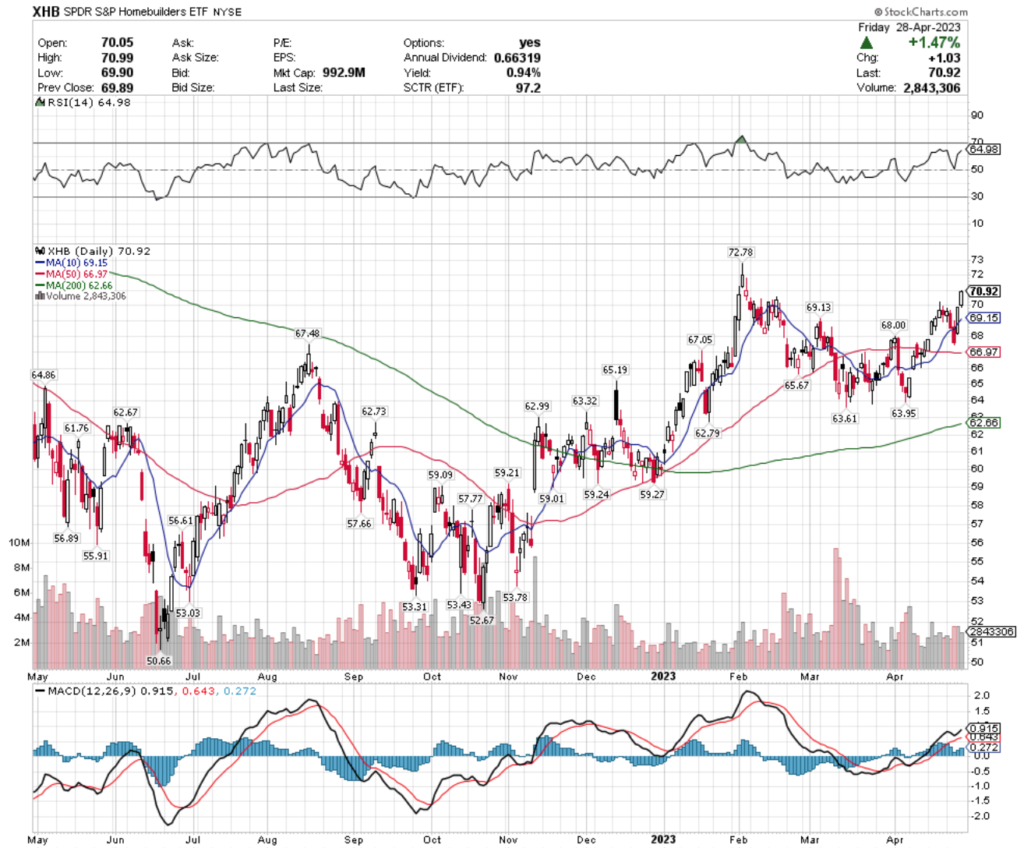
Their RSI is approaching overbought, while their MACD is beginning to look exhausted & in need of a breather.
Last week’s below average volumes also confirm that XHB’s sentiment is waning in the near-term, and their distribution yield pays 0.94% to long-term holders throughout the year, leaving little protection from downside risks.
Investors should wait to see how they perform around support levels in the coming weeks to plan their entry, while employing an options strategy for additional protection & profits.
XHB has support at the $69.15 (10 day moving average), $69.13, $68 & $67.48/share price levels, with resistance at the $72.78, $73.31, $74.13 & $74.45/share price levels.
GREK, the Global X MSCI Greece ETF has gained +23.85% over the past year, improving 51.06% from their 52 week low in September of 2022 (ex-distributions).
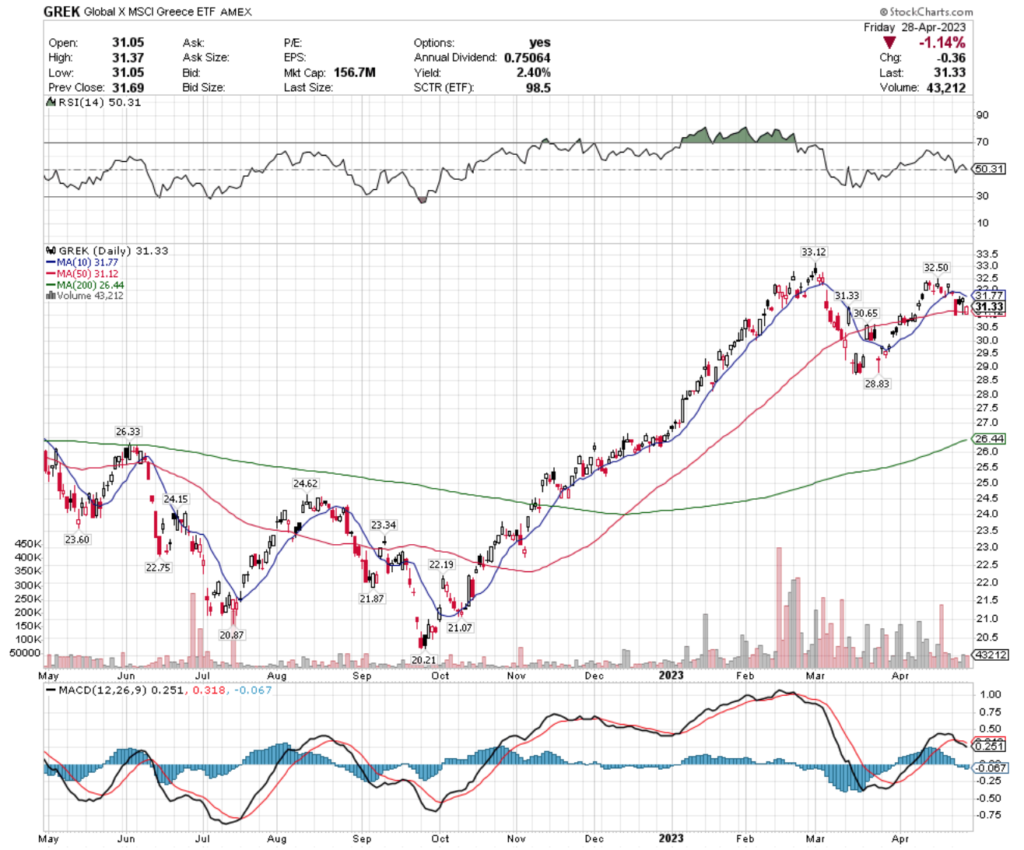
They’ve already begun to cool off a bit recently throughout the month of March, after a steady near 6-month climb & their RSI is back to neutral.
Their MACD is already bearish, with volumes over the past two months being above average compared to the year prior.
While GREK offers a 2.4% distribution yield over the year to long-term holders, they too look best suited for a wait & see approach for long-term investors, with an options strategy such as selling calls or buying puts in place as well for protection from downside moves.
GREK has support at the $31.12 (50 day moving average), $30.65, $28.83 & $26.44/ share (200 day moving average) price levels, with resistance at the $31.77 (10 day moving average), $32.50 & $33.12/share price levels.
EIDO, the iShares MSCI Indonesia ETF has improved by 0.84% over the past year, while gaining +16.64% since their 52 week low in July of 2022 (ex-distributions).
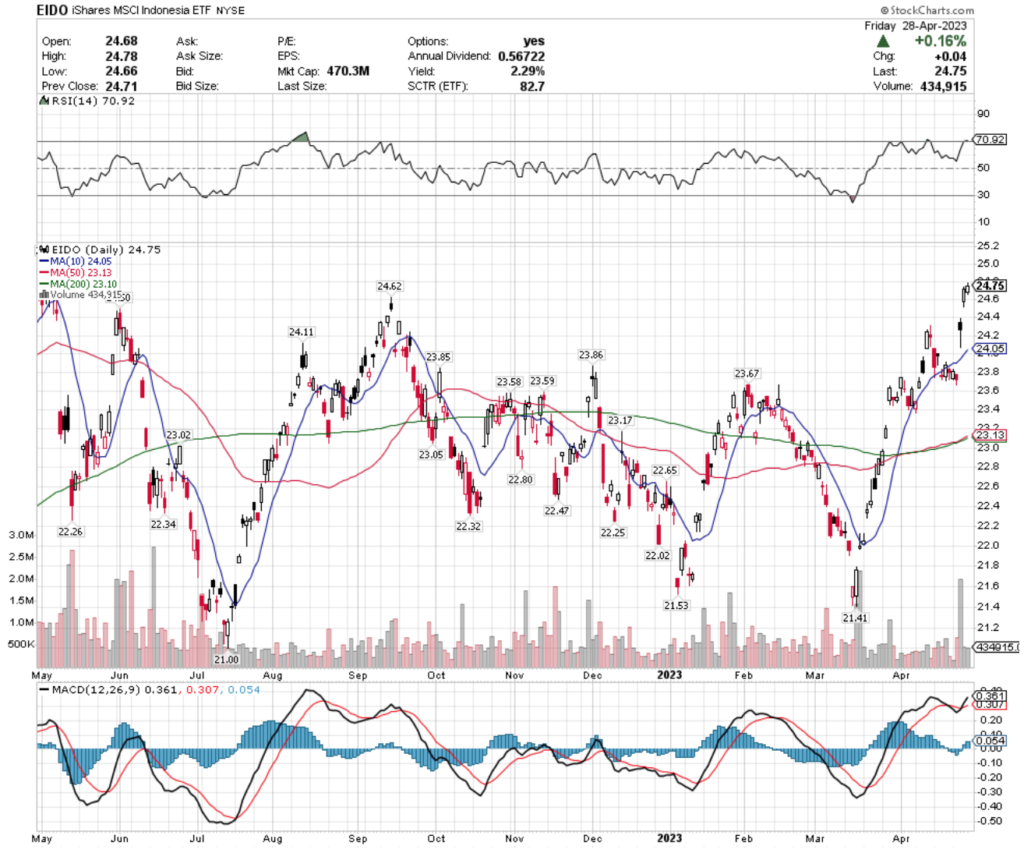
Their RSI is overbought after a couple of major gap up days last week, with volume only being particularly strong on Wednesday, which was a gap up hanging man candlestick session.
Investors & traders would be wise to see how they behave around the most recent gap, to see if they will go test Wednesday’s candlestick level, as that could avalanche into a closing of the window created by Wednesday’s gap up.
With a 2.29% distribution yield for long-term holders & so many signals of uncertainty, EIDO’s behavior at support levels will be critical in timing an entry to a position in this environment.
EIDO has support at the $24.62, $24.11, $24.05 (10 day moving average) & $23.86/share price levels, with resistance at the $25.01, $25.15, $25.27 & $25.79/share price levels.
EDIV, the SPDR S&P Emerging Markets Dividend ETF has gained +0.79% over the past year, climbing +24.44% from their 52 week low in November of 2022 (ex-distributions).
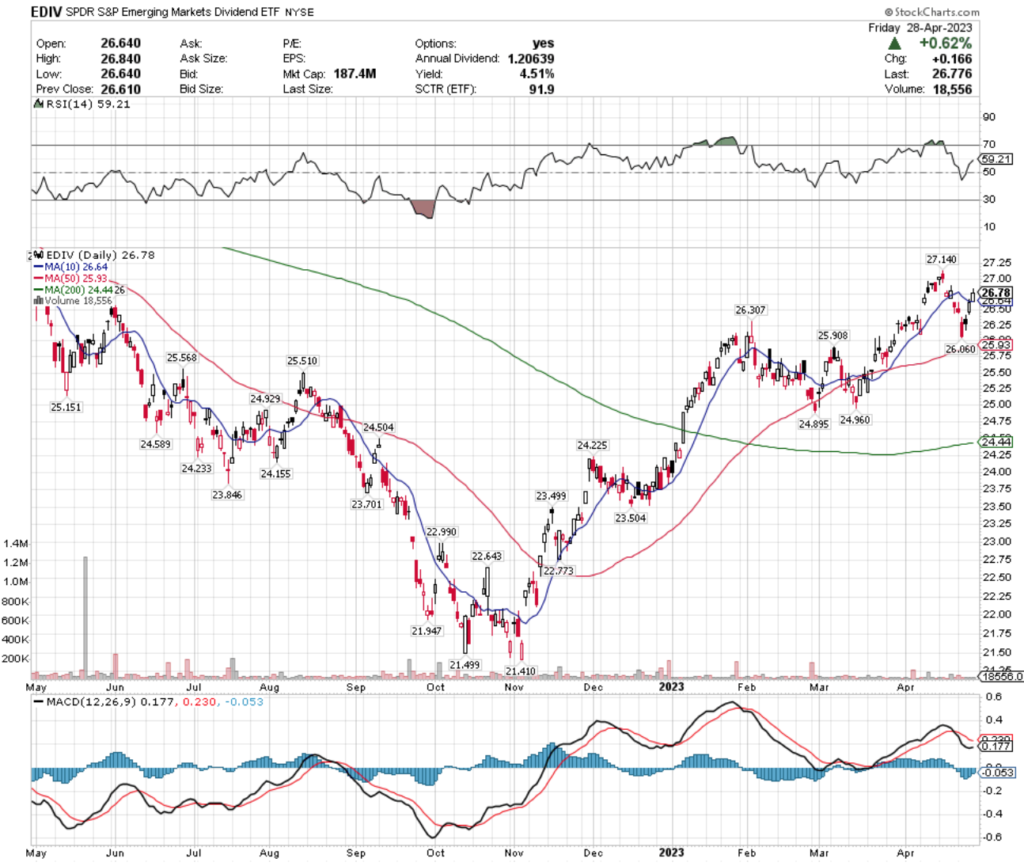
They’re volume tends to be light, with the most recent trading sessions falling below average compared to the year prior & their RSI is on the overbought end of neutral.
While their MACD is bearish, it is beginning to point bearish, mostly due to the gap up day on Thursday of last week.
EDIV pays a 4.51% distribution yield to long-term investors throughout each year, which is a better cushion against losses than many of the other names outlined in this article, but using options for additional protection is advisable in the near-term.
EDIV has support at the $26.64 (10 day moving average), $26.31, $26.01 & $25.93/share (50 day moving average), with resistance at the $26.80, $26.89, $27.14 & $27.76/share price levels.
China Small Cap Stocks (ECNS), Small Cap Momentum Stocks (DWAS), Natural Gas (FCG) & Agribusiness (MOO) Are All Bearishly Lagging The Market
ECNS, the iShares MSCI China Small Cap ETF has fallen -9.03% over the past year, losing -19.33% since their 52 week high in February of 2022, but has rebounded +24.58% since their 52 week low in October of 2022 (ex-distributions).
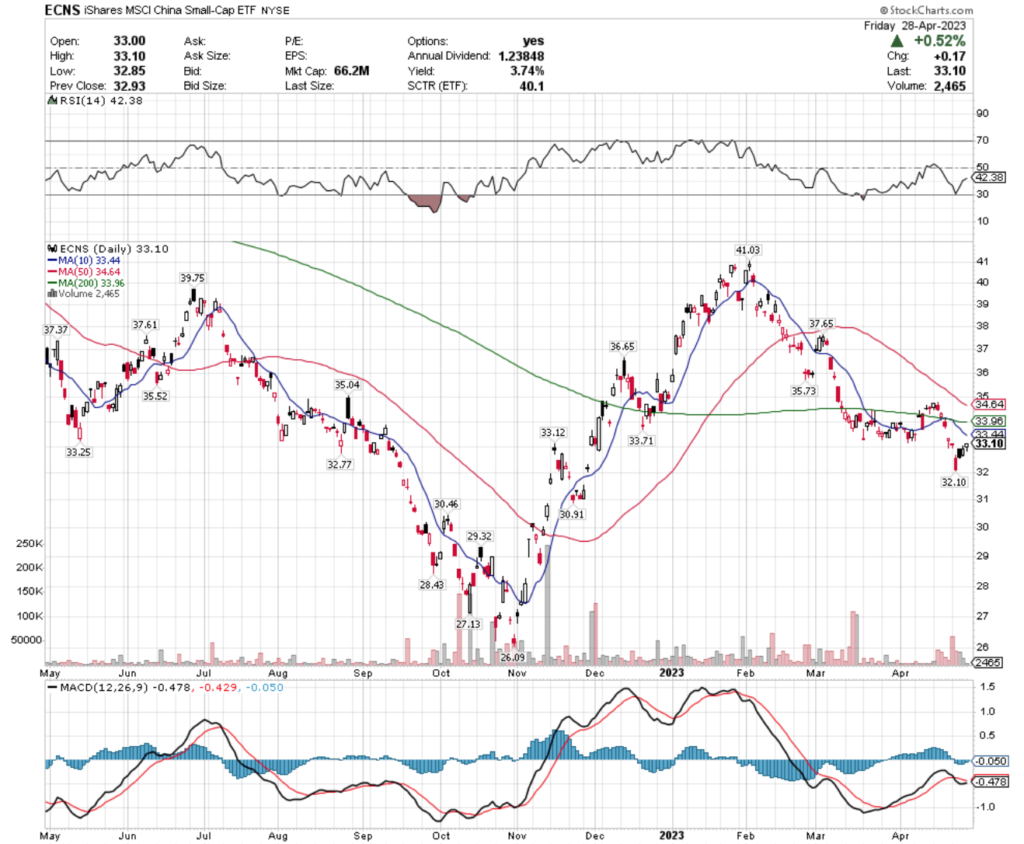
Their MACD is about to crossover bullish, but weak volumes compared to the year prior don’t signal much strength in the near-term.
Their RSI is on the oversold end of neutral, with Friday’s session resulting in a hanging man candlestick, implying more volatility to come on the horizon.
With a 3.74% distribution yield paid to long-term holders throughout the year they do have some cushion against losses, but an options strategy for protection while waiting to see how they behave at support levels looks to be the best near-term course of action.
ECNS has support at the $32.77, $32.10, $30.91 & $30.46/share price levels, with resistance at the $33.25, $33.44 (10 day moving average), $33.71 & $33.96/share (200 day moving average) price levels.
DWAS, the Invesco DWA Small Cap Momentum ETF has lost -8.52% over the past year, falling -14.61% since their 52 week low in June of 2022, but has bounced +10.84% since their 52 week low in July of 2022 (ex-distributions).
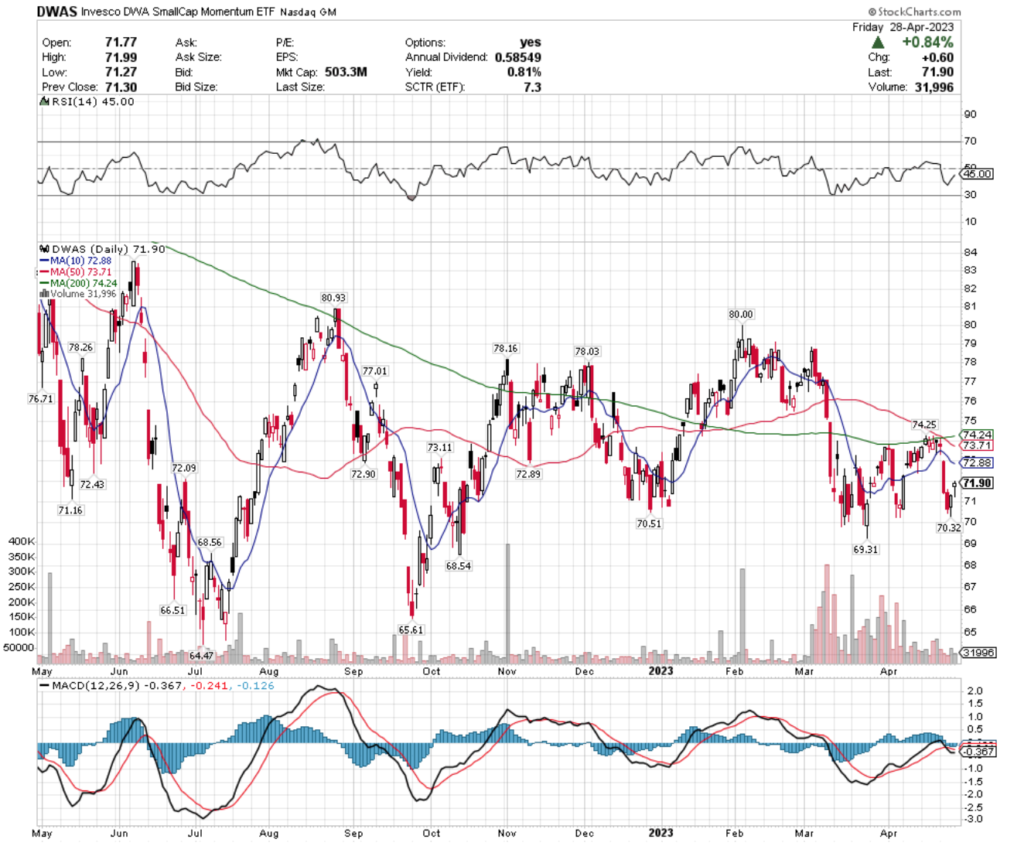
Their RSI is heading back towards neutral after Friday’s gap up following a week of declines, with volumes being about neutral compared to the year prior.
Their MACD is bearish, but hinting at a chance of a near-term bullish crossover, but Friday’s hanging man candlestick signals a dampening of the chances of that.
With a modest 0.81% distribution yield for long-term holders, a protective strategy should be employed, while watching their behavior at support levels.
DWAS has support at the $71.16, $70.51, $70.32 & $69.31/share price levels, with resistance at the $72.09, $72.43, $72.88 (10 day moving average) & $72.89/share price levels.
FCG, the First Trust Natural Gas ETF shed -0.65% over the past year, declining -25.62% from their 52 week high in June of 2022, but has rebounded +17.97% from their 52 week low in July of 2022 (ex-distributions).
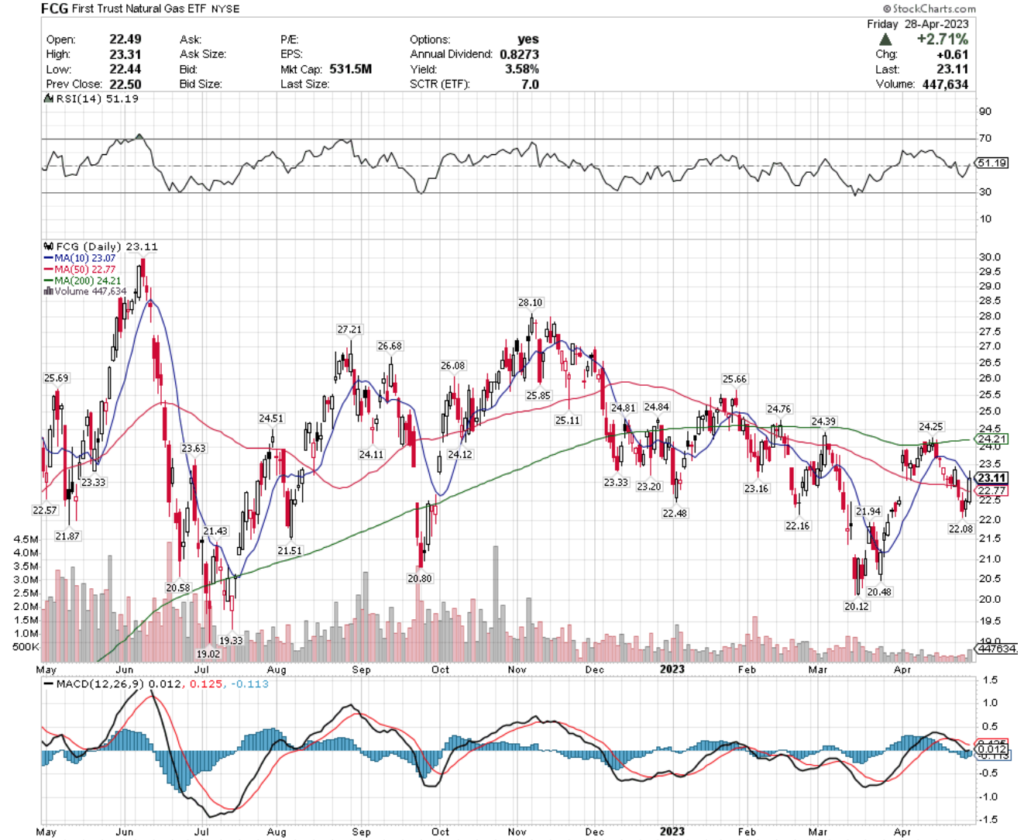
Their RSI is neutral, with their MACD in a bearish decline on below average volume for the past couple of month’s trading sessions.
With a 3.58% distribution yield they offer some cushion against losses for long-term holders, but based on the indecisiveness behind their recent performance it appears best to wait to see how they behave at support levels in the near-term, with a defensive near-term trading strategy around them for protection & profits while waiting.
FCG has support at the $23.07 (10 day moving average), $22.77 (50 day moving average), $22.57 & $22.48/share price levels, with resistance at the $23.16, $23.20, $23.33 & $23.63/share price level.
MOO, the VanEck Vectors Agribusiness ETF has lost -11.44% over the past year, losing -16% from their 52 week high in May of 2022, but reclaiming +6.09% since their 52 week low in September of 2022 (ex-distributions).
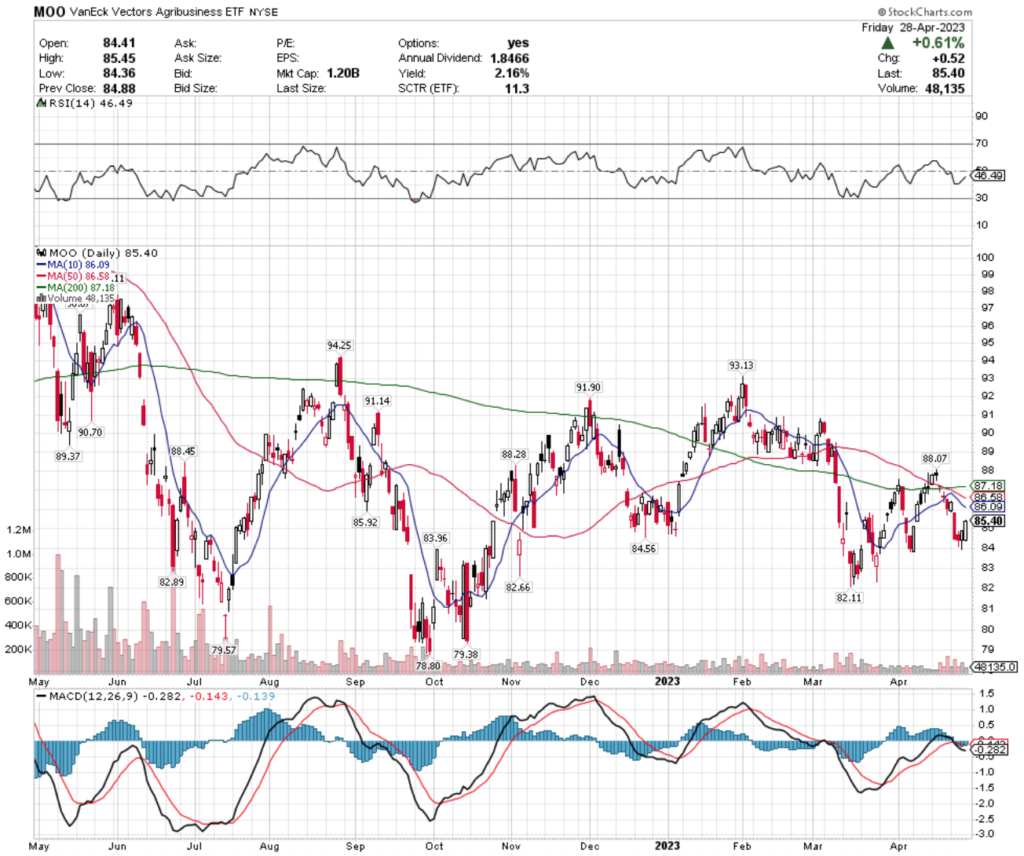
Thursday & Friday’s recovery sessions have helped push their RSI back towards neutral, but their MACD is still bearish.
Recent trading volumes have also signaled uncertainty, as they have been below average compared to the year prior, which when paired with their 2.16% distribution yield as a cushion against losses stresses the importance of taking a wait & see defensive approach to MOO.
MOO has support at the $84.56, $83.96, $82.89 & $82.66/share price levels, with resistance overhead at the $85.92, $86.09 (10 day moving average), $86.58 (50 day moving average) & $87.18/share (200 day moving average) price levels.
Tying It All Together
May kicks off with highly anticipated data being released, in addition to quarterly earnings calls continuing.
Monday at 9:45 am the S&P US Manufacturing PMI data will be released, followed by ISM Manufacturing & Construction Spending data at 10 am.
On the earning’s front, Monday’s reports include Avis Budget, Chegg, Diamondback Energy, Hologic, J&J Snack Foods, MGM Resorts International, Microstrategy, Norwegian Cruise Line, NXP Semiconductors, SoFi Technologies, Stryker & ZoomInfo, amongst others.
Tuesday we get U.S. Job Openings data reported & Factory Orders data at 10 am, with the m0st anticipated data release being Advanced Micro Devices & Pfizer’s earnings calls.
Other earnings being reported on Tuesday include ADT, BP, Cheniere Energy, Chesapeake Energy, Clorox, Cummins, DuPont, Ford Motor Company, Illinois Tool Works, Marriott, Molson Coors Brewing, Prudential, Simon Property Group, Starbucks, Sunoco, T. Rowe Price, Thomason Reuters, Uber Technologies & Western Union, with many more.
Wednesday will be very interesting, with ADP Employment data kicking off the dat at 8:15 am, S&P U.S. Services PMI data at 9:45 am, ISM Services data reported at 10 am & the highly anticipated Federal Reserve Interest Rate Statement at 2 pm & Fed Chair Powell’s Press Conference at 2:30 pm.
Albermarle, Allstate, Clean Harbors, Fresh Del Monte, Garmin, Hanesbrands, Kraft Heinz, Marathon Oil, MetLife, Phillips 66, Scotts Miracle Grow, Trip Advisor, Wingstop & Yum! Brands are some of Wednesday’s earnings reports.
Thursday morning at 8:30 am we hear U.S. Productivity, U.S. Trade Deficit, Initial Jobless Claims & Continuing Jobless claims data to start off the day.
Apple’s earnings call is Thursday, as well as American International Group, Anheuser-Busch InBev, Ball Corp., Block, ConocoPhillips, DISH Network, DraftKings, DropBox, Ferrari, GoDaddy, Huntington Ingalls, Hyatt Hotels, Kellogg, Lyft, Moderna, Monster Beverage, Peloton Interactive, Shake Shack, Starwood Property Trust, Wayfair, XPO, Yelp & more.
Friday winds down with the U.S. Employment Report, U.S. Unemployment Rate, U.S. Hourly Wages & Hour Wages Year Over Year reported at 8:30 am & Consumer Credit data coming in at 3pm.
Friday’s earnings reports include AMC Entertainment, CBOE Global Markets, Dominion Energy, Goodyear Tire, Johnson Controls, The Cigna Group & more.
See you back here next week!
*** I DO NOT OWN SHARES OR OPTIONS CONTRACT POSITIONS IN SPY, QQQ, IWM, XHB, GREK, EIDO, EDIV, ECNS, DWAS, FCG or MOO AT THE TIME OF PUBLISHING THIS ARTICLE ***