SPY, the SPDR S&P 500 ETF added +1.65% this past week, while the VIX closed at 11.99 to finish the week, implying a one-day move of +/-0.92% & a one-month move of +/-2.19%, in yet another week of lackluster volumes across the major four indexes.
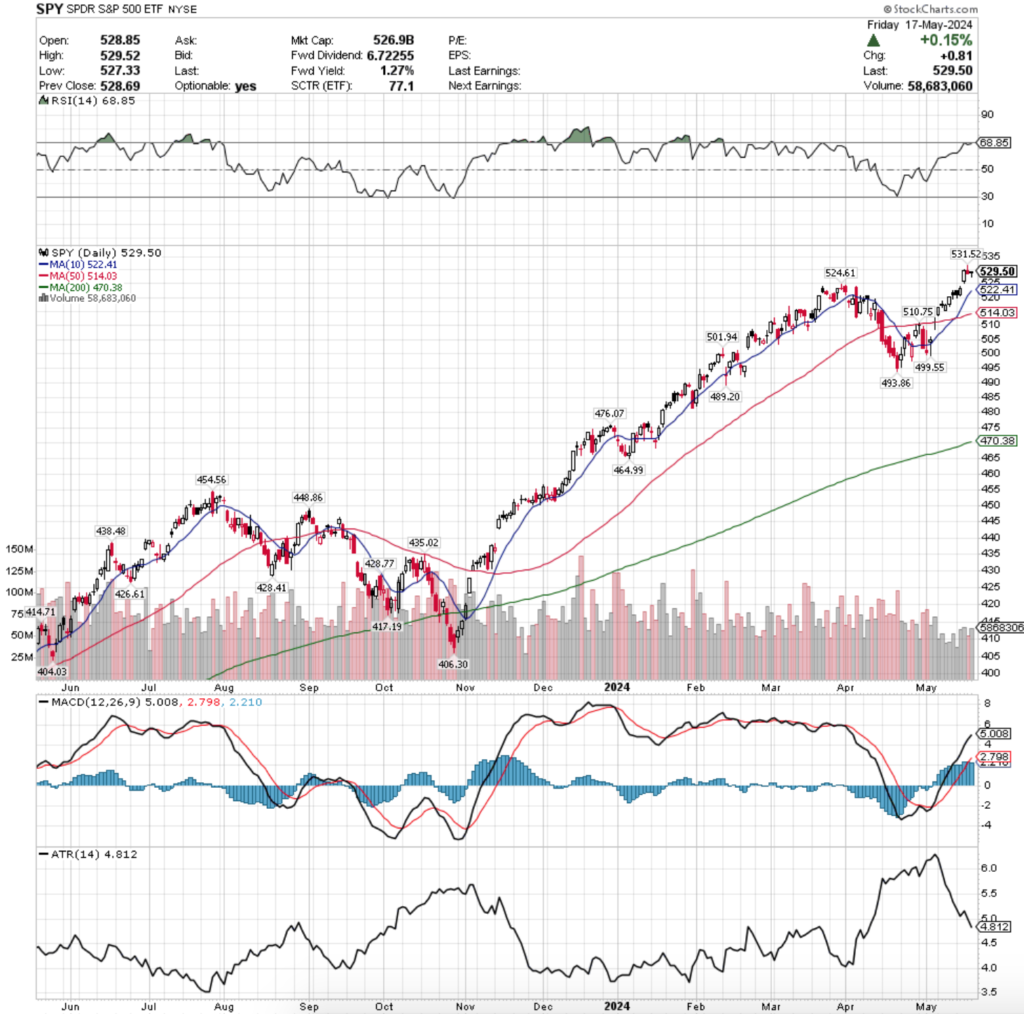
Their RSI is nearing the overbought level & currently sits at 68.85 after a week of relative quiet (asides from Wednesday’s gap up session), while their MACD is still bullish, but showing signs of weakening in the near-term.
Volumes were -31.42% below average compared to the year prior (including last week’s “participation trophy week”, 52,530,754 vs. 76,595,337), indicating severe hesitancy on the part of market participants, as it appears the well of enthusiasm has dried up.
This low volume should be particularly alarming, given that most of the sessions of the past two weeks have closed in advances so there is not much conviction behind these moves up.
Monday kicked the week off on a similar note that last Friday wound down the previous week, resulting in a gap up open that tested lower to about mid-way through Friday’s lower shadow, before rallying back to close just above Friday’s close on what was one of the year’s bottom 3 lowest volume sessions.
Tuesday was able to find some stable footing & advance higher, but volumes again were nothing spectacular & folks weren’t just diving back into the fool in masses, as PPI data had just been announced & CPI data was on deck for Wednesday.
Wednesday opened with a gap up with enough enthusiasm to close higher for the day’s session & establish a new trading range for the end of the week, but volumes were still nothing to write home about (although they were the highest of the week for SPY).
Thursday is where the treading water began, which we will likely see continue into the coming week until the highly anticipated NVDA earnings call on Wednesday.
SPY ended Thursday on a bearish & uncertain note, as the session had declining volume that was similar to the advancing volumes of the past two days, on a shooting star candle.
This was to be expected walking into the open & is likely to continue into the coming week, barring there is some major news development in the time running up to the NVDA earnings report (bearish), or a head-fake up to get more people to pile back into the pool on one last pump.
Friday continued this theme, as the second highest volume session of the week ended in a +0.15% advance for the day, resulting in a dragonfly doji, which is a bullish reversal candle.
It also created a bullish harami pattern with Thursday’s candle, however, the session closed below its open & with the poor volume it is hard to read it as being particularly bullish.
SPY’s Average True Range is continuing lower, due to the gap up of Wednesday’s session & general lack of volatility, which we did anticipate would be rising in the near-term (and still do).
The late-July 2023 to November period is still something to be keeping a close eye on, as while the 10 Day Moving Average has recently pulled further ahead of the 50 DMA than it did during that time, this time around a new 52-week (and all-time) high was established.
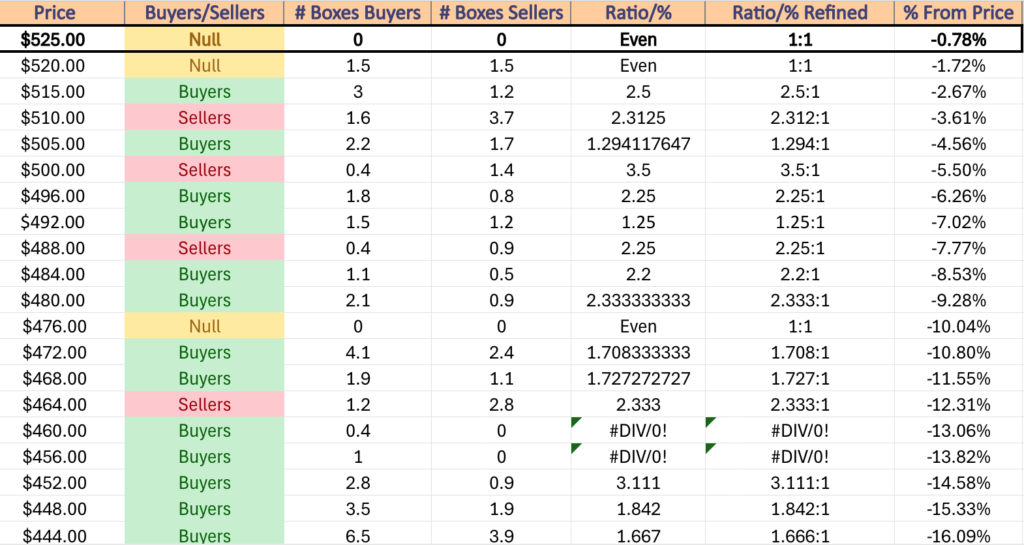
Support levels for SPY are also in an interesting position as they currently sit, as using the data from the past 1-2 years, the immediate next two support levels do not have enough data yet to establish whether buyers or sellers have been the dominant force & they’re reportedly even (let’s assume buyers have the slight edge due to the nature of where they are currently trading).
The next two support levels are in the $510-514.99/share box, which is historically dominated by sellers at a rate of 2.31:1 & is only a 2.67% decline away from their current trading price from Friday’s close.
A decline of -4.56% would be in the cards if the sellers overtake the first two support levels & carry enough selling momentum from the historic behavior of the $510 range, which will be an area to keep a close eye on in the coming week, especially after the Fed speakers of the week & the NVDA earnings report.
SPY has support at the $524.61 (Volume Sentiment: Even, 1:1), $522.41 (10 Day Moving Average, Volume Sentiment: Even, 1:1), $514.03 (50 Day Moving Average, Volume Sentiment: Sellers, 2.31:1) & $510.75/share (Volume Sentiment: Sellers, 2.31:1) price levels with resistance at the $531.52/share (All-Time High, Volume Sentiment: NULL, 0:0*) price level.
QQQ, the Invesco QQQ Trust ETF that tracks the NASDAQ 100, advanced +2.19% last week, having the strongest weekly performance of the major four index ETFs.
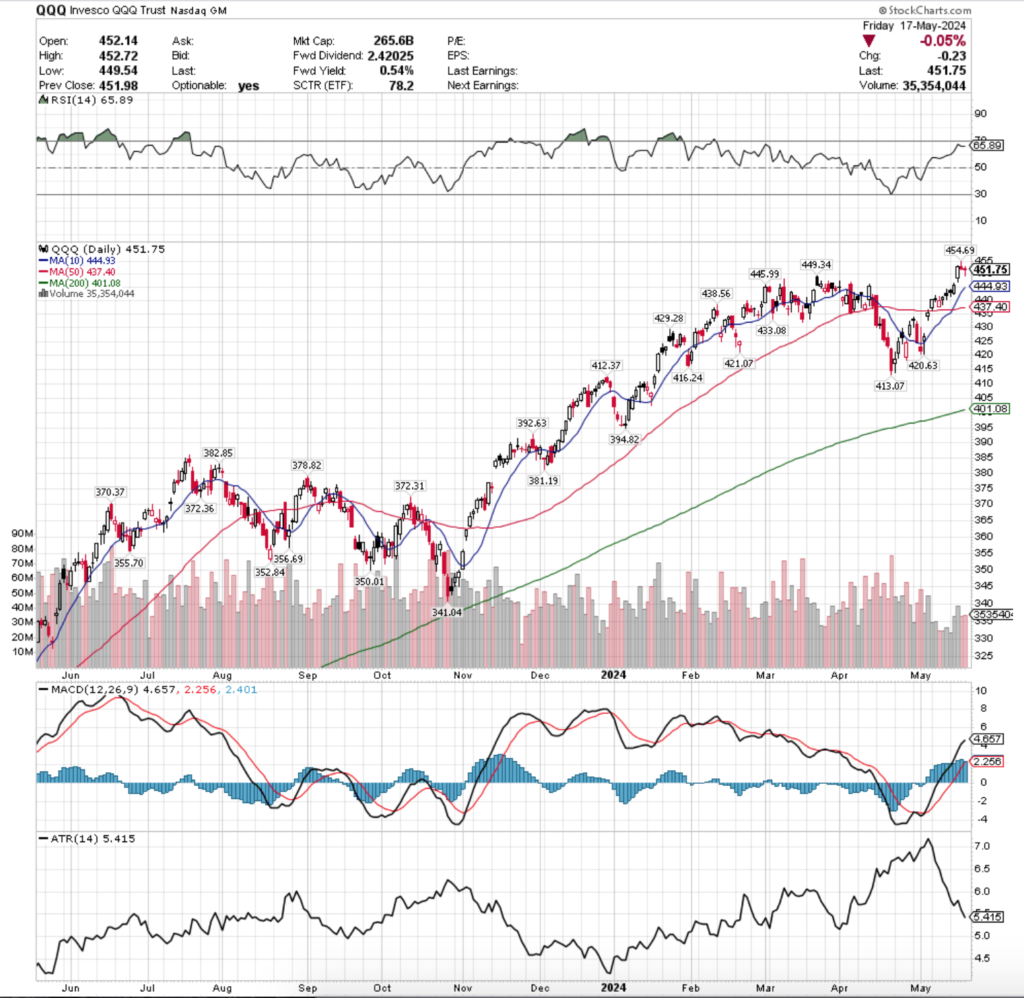
Their RSI is near the overbought level, but has backed away from it in the wake of the past two sessions & sits at 65.89, while their MACD is bullish but showing signs of impending weakness in the coming week(s).
Volumes were weak, -29.72% below average vs. the prior year (33,892,137 vs. 48,227,138), indicating that there is still a lot of skepticism about their near-term potential among market participants.
Much like SPY, QQQ has now had back-to-back weeks of subpar volumes as investors sit on the edge of their seats awaiting to see if NVDA’s earnings call can give markets the strength to continue climbing.
Monday saw one of the lowest volume sessions of the year for QQQ on a day where despite gapping higher than the week prior on the open there was minimal strength & a test to the downside & ultimate close lower than the open.
Tuesday saw investors more eager to enter the market both in terms of volumes & the session’s bullish engulfing candle, leading to Wednesday’s gap up session on the highest volume of the week.
From there QQQ became range-bound near the closing price of Wednesday’s session for the rest of the week.
Thursday formed a bearish harami with Wednesday’s candle (bearish) as the real body of the shooting star candle was confined within the real body of Wednesday’s.
Friday confirmed this with more downside action, as the lower shadow of the day’s range tested down ~75% of Wednesday’s candle’s real body, indicating that pessimism has not left the building for QQQ & will likely continue into the new week.
QQQ’s Average True Range has been trending lower & recently crossed its mean as volatility has subsided since April, although it is likely to pick back up this coming week.
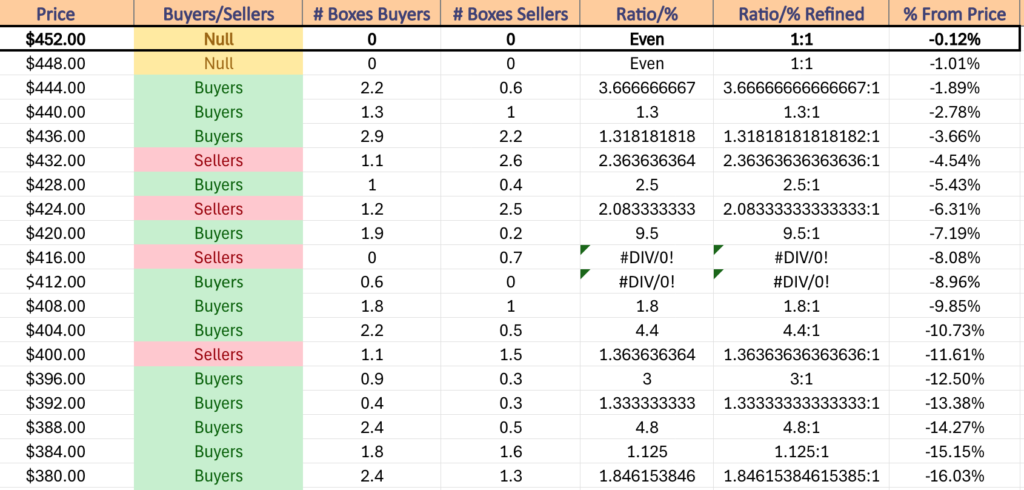
As noted in prior weeks, QQQ has more nearby support points than SPY due to the velocity with which SPY climbed over the past 7-8 months, but all eyes will continue to be on the 10 & 50 day moving averages.
If prices are to fall below them, there will be downward pressure from their resistance & given how close they are in the first place it would not take particularly long for them to begin flashing bearish signals.
Another thing to be mindful 0f in the coming few months is in the event of a decline, whether or not a head & shoulders pattern emerges with last week’s new all-time high as the head (or a new high reached this week).
It will also be important to be watching how volume trends change after two weeks with subpar volumes, as well as noting whether the buyers or sellers have been the dominating players at the support levels that QQQ is likely going to test in the coming week(s).
QQQ has support at the $449.34 (Volume Sentiment: NULL, 0:0*), $445.99 (Volume Sentiment: Buyers, 3.67:1), $444.93 (10 Day Moving Average, Volume Sentiment: Buyers, 3.67:1) & $438.56/share (Volume Sentiment: Buyers, 1.32:1) price levels with resistance at the $454.69/share (All-Time High, Volume Sentiment: NULL, 0:0*) price level.
IWM, the iShares Russell 2000 ETF climbed +1.85% last week, experiencing the same low volumes as SPY & QQQ.
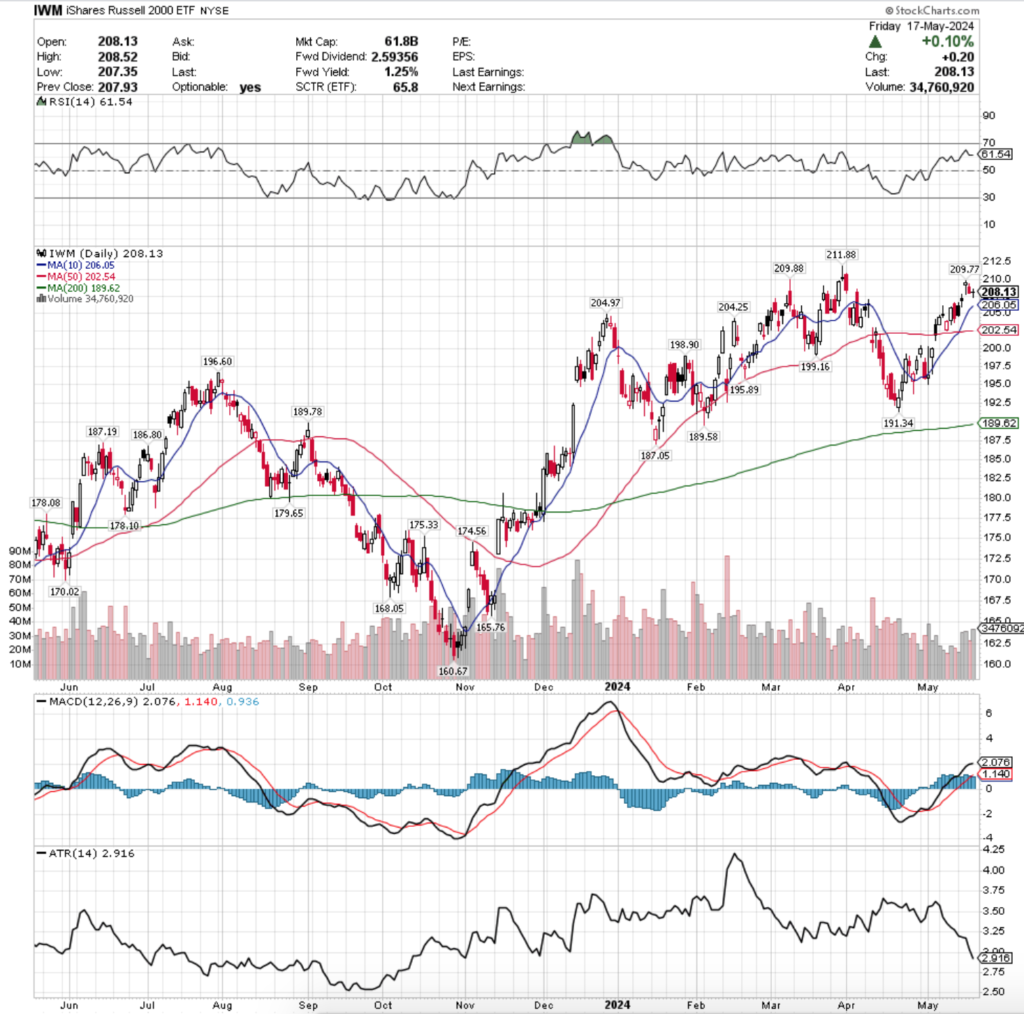
Their RSI is near the oversold end of neutral, currently sitting at 61.54, while their MACD is bullish but has curled over bearishly & looks primed for a bearish crossover in the coming days.
Volumes were -15.46% below average compared to the year prior (29,329,278 vs. 34,692,386), as market participants were reluctant to buy into IWM for a second straight week.
The week kicked off on a unique & anything but certain note, as one of the lowest volume sessions of the year opened above last Friday’s close, tried to march up to Friday’s high, but ultimately retreated & closed lower.
This resulted in a bullish harami pattern, but given the low volume & the lower close than open it was to be taken with a grain of salt & not a sign of bullish enthusiasm.
Tuesday opened on a gap higher, but ended up closing in confusion & uncertainty as a spinning top candle, on a second straight day of lower closes than opens for IWM.
This lack of conviction among market participants continued throughout the week, as despite gapping higher on Wednesday, IWM closed the day with a hanging man candle, which is a bearish signal.
Thursday & Friday went on to work on closing the gap created by Wednesday’s session, with Thursday being a declining session & Friday resulting in a doji candle, signaling uncertainty going into the weekend.
Friday had the highest volumes of the week, which should also raise a skeptical brow about the strength in IWM currently, given that they closed at the exact price level that they opened on for the day, indicating that investors didn’t have any conviction one way or the other regarding their price.
IWM’s Average True Range has continued to decline in the month of May as volatility has subsided dramatically since April, but their other indicators look like we’ll see an uptick in their ATR in the week ahead.
It’ll be worth keeping an eye on IWM’s MACD this upcoming week & how its 10 day moving average moves in relation to it, as their MACD is showing signs of weakness & if the declines from it begin to pull the 10 DMA down that could set up a decent size swing to the downside.
Much like SPY & QQQ, that downwards move for the 10 DMA would also begin forcing downwards pressure on price if it drops beneath it & would also trigger the same downwards pressure from the 50 DMA in the event of declining below that as well.
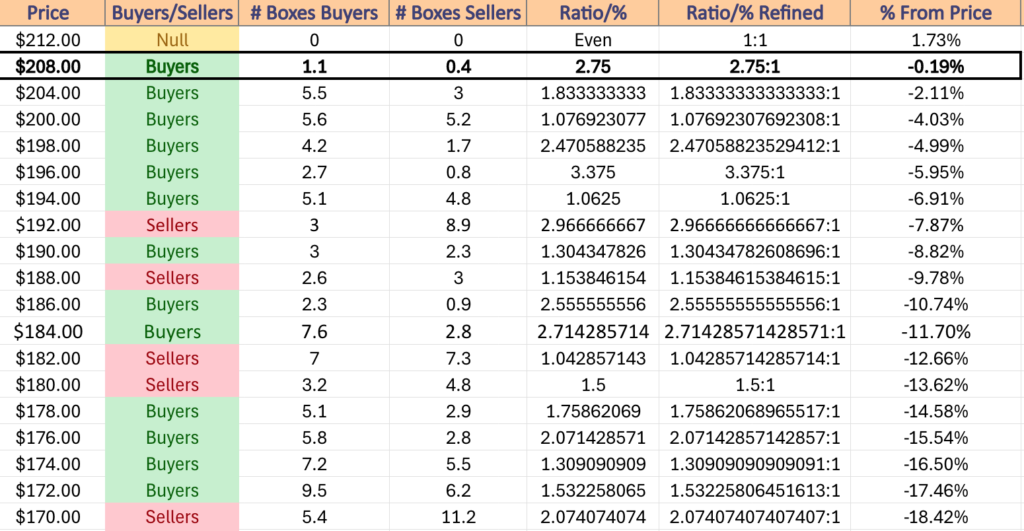
IWM has support at the $206.05 (10 Day Moving Average, Volume Sentiment: Buyers, 1.83:1), $204.97 (Volume Sentiment: Buyers, 1.83:1), $204.25 (Volume Sentiment: Buyers, 1.83:1) & $202.54/share (50 Day Moving Average, Volume Sentiment: Buyers, 1.08:1) price levels with resistance at the $209.77 (Volume Sentiment: Buyers, 2.75:1), $209.88 (Volume Sentiment: Buyers, 2.75:1) & $211.88/share (52-Week High, Volume Sentiment: Buyers, 2.75:1) price level.
DIA, the SPDR Dow Jones Industrial Average ETF climbed +1.21% last week, as the large cap index was the least favored among market participants.
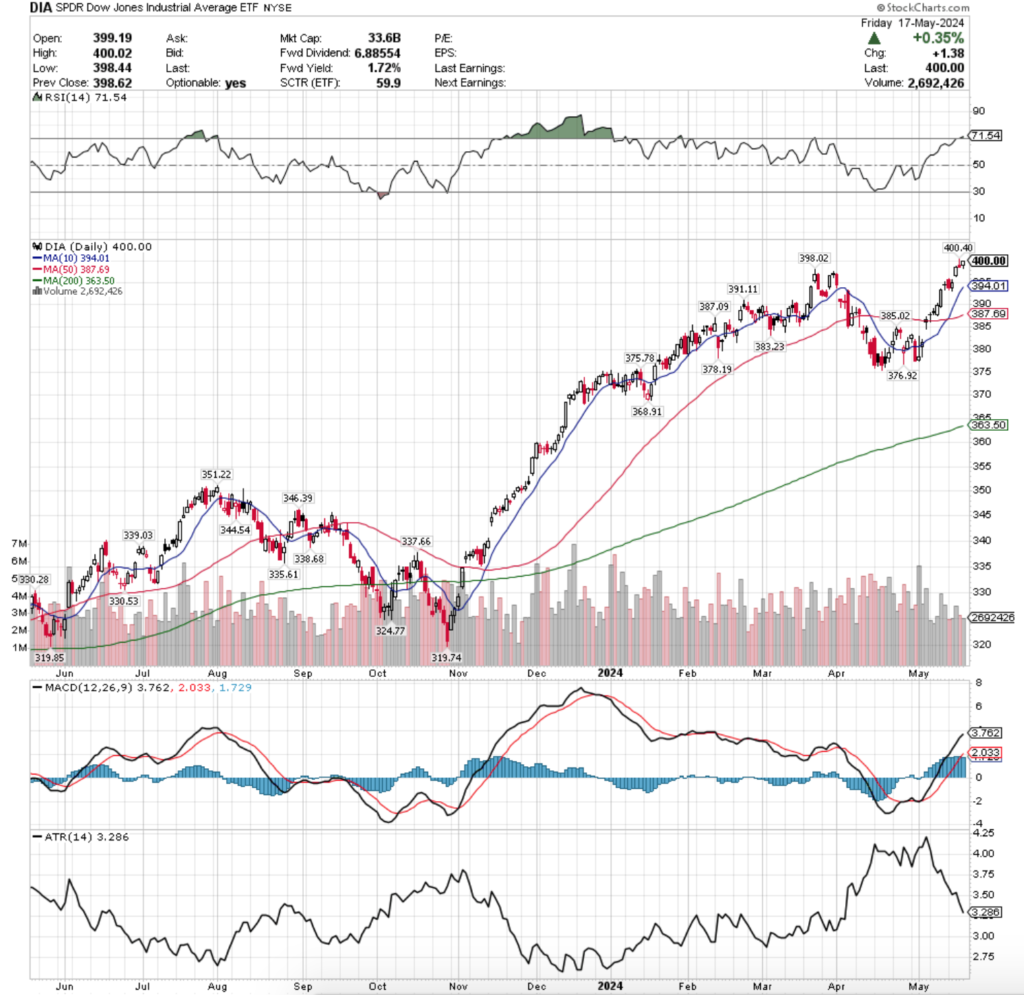
Their RSI is in overbought territory following the advances of the month of May & currently sits at 71.54, while their MACD is bullish, but showing signs of a bearish roll-over on the near-term horizon.
Volumes were -19.6% lower last week compared to the year prior (2,857,738 vs. 3,554,391), in another week of lackluster trading activity.
Monday began DIA’s week with a bearish engulfing candle that almost engulfed the entirety of Friday’s doji’s range.
However, this large downside candle came on weak volumes, adding a layer of uncertainty into the mix & a lack of conviction behind market participants.
Tuesday resulted in an advancing session that created a bullish harami pattern with Monday’s & set the stage for the rest of the week’s advances.
Wednesday’s gap up came in the wake of Tuesday’s harami pattern & it also was the session with the week’s highest volumes, which isn’t a strong sign of conviction given how low volumes were for the week & the week prior.
Thursday brought another all-time high for DIA, but on a bearish note as the day’s session resulted in a shooting star candle, showing that investors did not want to budge over the $400.40/share mark for DIA.
Friday resulted in a relatively range-bound hanging man candle (bearish) on sub-par volumes indicating that there is a bit of bearish sentiment out there among market participants in regards to DIA.
Much like SPY, QQQ & IWM, DIA’s Average True Range has been declining throughout May as volatility has subsided, but it should begin to uptick again in the coming week(s).
DIA’s week will be interesting, as unlike SPY & QQQ NVDA is not a component of DIA.
Most of the same observations for SPY, QQQ & IWM are applicable to DIA in terms of their coming week’s performance & concerns, with the primary ones being the strength of their nearest support levels & how price behaves in relation to their 10 & 50 day moving averages.
Their recent volumes have painted a troublesome picture & it looks as though folks are very hesitant to dive into the pool & are more interested in seeing if it is almost time to jump out to take a break.
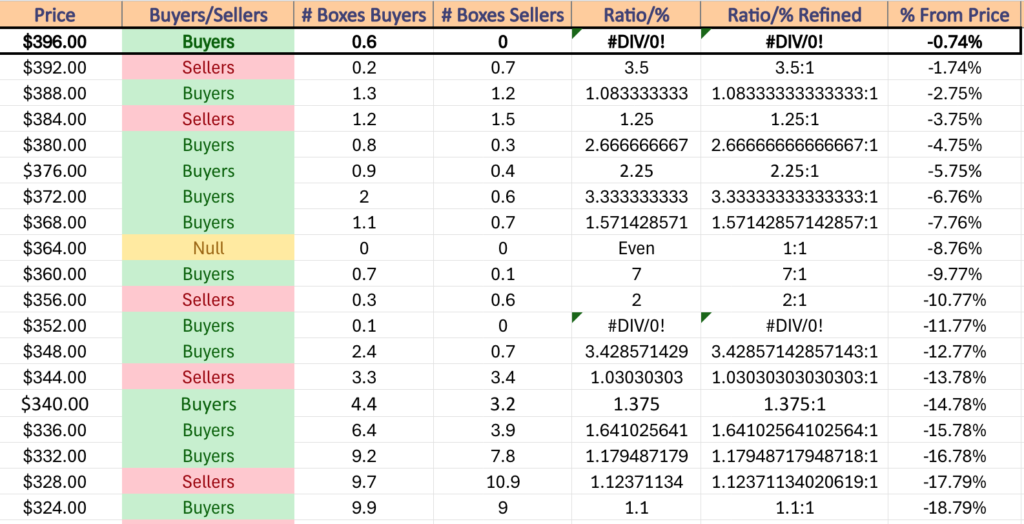
DIA has support at the $398.02 (Volume Sentiment: Buyers, 0.6:0*), $394.01 (10 Day Moving Average, Volume Sentiment: Sellers, 3.5:1), $391.11 (Volume Sentiment: Buyers, 1.08:1) & $387.69/share (50 Day Moving Average, Volume Sentiment: Sellers, 1.25:1) price levels with resistance at the $400.40/share (All-Time High, Volume Sentiment: NULL, 0:0*) price level.
The Week Ahead
Monday the week kicks off on a sleepy note, with no economic data scheduled to be released.
global-E Online, Li Auto & Wix.com are all scheduled to report earnings Monday morning before the opening bell, with Keysight Technologies, Nordson, Palo Alto Networks & Zoom Video Communications reporting after the closing bell.
Cleveland Fed President Loretta Mester, Atlanta Fed President Raphael Bostic & Boston Fed President Susan Collins speak together on a panel on Tuesday night at 7pm.
Tuesday opens up with AutoZone, Eagle Materials, James Hardie, Lowe’s & Macy’s all reporting earnings before the opening bell, with Toll Brothers, Modine Manufacturing, Skyline Champion, Urban Outfitters & Viasat all reporting earnings after the session’s close.
Wednesday brings us Existing Home Sales data at 10 am, followed by Minutes of the May FOMC Meeting at 2pm.
Target, Analog Devices, Brady, Dorian LPG, Dycom, GDS Holdings, Kingsoft Cloud, Petco Health & Wellness, Phontronics, TJX, Vipshop Holdings & Williams-Sonoma all report earnings Wednesday morning before the market opens, with the day’s headliner NVIDIA reporting after the closing bell, along with Enersys, LiveRamp, Snowflake, Sociedad Quimica y Minera, Synopsys, VF Corp & Zuora as well.
Initial Jobless Claims will be reported at 8:30 am on Thursday, followed by S&P Flash U.S. Services PMI & S&P Flash U.S. Manufacturing PMI data at 9:45 am, New Home Sales data at 10 am & Atlanta Fed President Raphael Bostic speaking at 3pm.
Thursday kicks off with BJ’s Wholesale, Endava, Hamilton Lane, KE Holdings, Medtronic, Minro Muffler, NetEase, Ralph Lauren, Shoe Carnival, Titan Machinery, Triumph Group & Weibo reporting earnings before the market opens, followed by Intuit, Lions Gate Entertainment, Ross Stores, StepStone Group & Workday after the closing bell.
Friday winds the week down with Durable-Goods Orders & Durable Goods minus Transportation data at 8:30 am, followed by Consumer Sentiment (final) data at 10 am.
The week ends on the earnings front in the morning when Booz Allen Hamilton, Hudbay Minerals & TransAlta are all scheduled to report earnings before the market’s opening bell.
See you back here next week!
*** I DO NOT OWN SHARES OR OPTIONS CONTRACT POSITIONS IN SPY, QQQ, IWM OR DIA AT THE TIME OF PUBLISHING THIS ARTICLE ***