The VIX closed at 16.56, indicating an implied one day move of +/-1.04% & an implied one month move of +/-4.79% for the S&P 500.
Highest Technical Rated S&P 500 Components Per 1/29/2025’s Close:
1 – PLTR
2 – UAL
3 – TPR
4 – RCL
5 – FFIV
6 – AXON
7 – CCL
8 – TSLA
9 – DFS
10 – GEV
Lowest Technical Rated S&P 500 Components Per 1/29/2025’s Close:
1 – SMCI
2 – MRNA
3 – EIX
4 – ENPH
5 – AES
6 – CE
7 – EA
8 – STZ
9 – MCHP
10 – ON
Highest Volume Rated S&P 500 Components Per 1/29/2025’s Close:
1 – JNPR
2 – SBUX
3 – HSIC
4 – FFIV
5 – DHR
6 – PKG
7 – GLW
8 – BXP
9 – NDAQ
10 – IP
Lowest Volume Rated S&P 500 Components Per 1/29/2025’s Close:
1 – WDAY
2 – HON
3 – GEHC
4 – CTAS
5 – ALL
6 – LLY
7 – WTW
8 – TPL
9 – ROK
10 – MPWR
Highest Technical Rated ETFs Per 1/29/2025’s Close:
1 – BITU
2 – WEBL
3 – BITW
4 – FBL
5 – TSLR
6 – TESL
7 – TSLT
8 – TSLL
9 – BTFX
10 – BITX
Lowest Technical Rated ETFs Per 1/29/2025’s Close:
1 – MSOX
2 – TSLZ
3 – TSDD
4 – TSLQ
5 – SBIT
6 – BCHG
7 – CNBS
8 – LTCN
9 – SARK
10 – YANG
Highest Volume Rated ETFs Per 1/29/2025’s Close:
1 – USNZ
2 – BKWO
3 – SDCI
4 – XFIV
5 – BSJW
6 – CMCI
7 – DIEM
8 – FLN
9 – LIAF
10 – TEKX
Lowest Volume Rated ETFs Per 1/29/2025’s Close:
1 – SPMB
2 – GVUS
3 – IVVB
4 – FDVL
5 – UJB
6 – XHYT
7 – FDTB
8 – PSCQ
9 – EFZ
10 – QMAG
Highest Technical Rated General Stocks Per 1/29/2025’s Close:
1 – GROM
2 – EXOD
3 – DXF
4 – CYFRF
5 – NVNI
6 – CAPC
7 – BSXGF
8 – WLGS
9 – RGTI
10 – MNPR
Lowest Technical Rated General Stocks Per 1/29/2025’s Close:
1 – MGOL
2 – CHSN
3 – STSS
4 – MULN
5 – GMHS
6 – YYAI
7 – RIME
8 – CDT
9 – HMMR
10 – LPTX
Highest Volume Rated General Stocks Per 1/29/2025’s Close:
1 – KRKR
2 – EVTV
3 – CMCT
4 – OCEA
5 – SGN
6 – LGCL
7 – OUT
8 – GVH
9 – SXTP
10 – PACK
Lowest Volume Rated General Stocks Per 1/29/2025’s Close:
1 – BNPQF
2 – PYFRF
3 – SPIEF
4 – NSRPF
5 – BTCY
6 – GOMRF
7 – QMCI
8 – JPOTF
9 – MFGCF
10 – OMZNF
*** THE LIST ABOVE IS STRICTLY FOR INFORMATIONAL PURPOSES – I MAY OR MAY NOT HAVE OR INITIATE A LONG, SHORT, OR LONG/SHORT POSITION IN ANY NAME ABOVE AT ANY TIME ***
The VIX closed at 15.1, indicating an implied one day move of +/-0.95% & an implied one month move of +/-4.36% for the S&P 500.
Highest Technical Rated S&P 500 Components Per 1/22/2025’s Close:
1 – PLTR
2 – GEV
3 – VST
4 – UAL
5 – CEG
6 – TSLA
7 – TPR
8 – ANET
9 – TPL
10 – AVGO
Lowest Technical Rated S&P 500 Components Per 1/22/2025’s Close:
1 – MRNA
2 – ENPH
3 – EIX
4 – AES
5 – STZ
6 – DG
7 – CE
8 – SMCI
9 – REGN
10 – BIIB
Highest Volume Rated S&P 500 Components Per 1/22/2025’s Close:
1 – ORCL
2 – NFLX
3 – STX
4 – GPC
5 – TDY
6 – ABT
7 – COF
8 – UAL
9 – GLW
10 – DFS
Lowest Volume Rated S&P 500 Components Per 1/22/2025’s Close:
1 – AXON
2 – HUM
3 – BA
4 – ARE
5 – UHS
6 – EXPD
7 – AIG
8 – PAYC
9 – TPL
10 – CNC
Highest Technical Rated ETFs Per 1/22/2025’s Close:
1 – TSLR
2 – TSLT
3 – TSLL
4 – BITU
5 – TSL
6 – BITW
7 – BITX
8 – BTFX
9 – WEBL
10 – TARK
Lowest Technical Rated ETFs Per 1/22/2025’s Close:
1 – MSOX
2 – TSLZ
3 – TSDD
4 – TSLQ
5 – SBIT
6 – CNBS
7 – KOLD
8 – BCHG
9 – NVD
10 – SARK
Highest Volume Rated ETFs Per 1/22/2025’s Close:
1 – PABD
2 – TDFC
3 – LBO
4 – GFGF
5 – DVND
6 – MSMR
7 – BCUS
8 – GLOW
9 – NDVG
10 – CPLS
Lowest Volume Rated ETFs Per 1/22/2025’s Close:
1 – GVUS
2 – EMCS
3 – CPNS
4 – MDCP
5 – USCA
6 – DMAR
7 – BBEM
8 – USCL
9 – CCNR
10 – XFEB
Highest Technical Rated General Stocks Per 1/22/2025’s Close:
1 – BBIG
2 – VAXX
3 – RGTI
4 – WLGS
5 – CAPC
6 – CHRO
7 – NUKK
8 – SEVCD
9 – FNMA
10 – SPCB
Lowest Technical Rated General Stocks Per 1/22/2025’s Close:
1 – GOEV
2 – WNW
3 – SLXN
4 – HEPA
5 – MULN
6 – GTI
7 – CERO
8 – YYAI
9 – AILEQ
10 – AEON
Highest Volume Rated General Stocks Per 1/22/2025’s Close:
1 – BLBX
2 – IPA
3 – OUT
4 – CLEU
5 – HEPA
6 – NTRB
7 – PAPL
8 – POAI
9 – FFBB
10 – FFBW
Lowest Volume Rated General Stocks Per 1/22/2025’s Close:
1 – GENMF
2 – VRDR
3 – AUXXF
4 – DSNY
5 – BOID
6 – ALPIB
7 – MHCUF
8 – SPIEF
9 – CPIX
10 – VAXX
*** THE LIST ABOVE IS STRICTLY FOR INFORMATIONAL PURPOSES – I MAY OR MAY NOT HAVE OR INITIATE A LONG, SHORT, OR LONG/SHORT POSITION IN ANY NAME ABOVE AT ANY TIME ***
The VIX closed at 15.06, indicating an implied one day move of +/-0.95% & an implied one month move of +/-4.35% for the S&P 500.
Highest Technical Rated S&P 500 Components Per 1/21/2025’s Close:
1 – GEV
2 – VST
3 – PLTR
4 – UAL
5 – TSLA
6 -TPR
7 – CEG
8 – TPL
9 – AVGO
10 – TRGP
Lowest Technical Rated S&P 500 Components Per 1/21/2025’s Close:
1 – MRNA
2 – ENPH
3 – SMCI
4 – STZ
5 – AES
6 – EIX
7 – DG
8 – BIIB
9 – CE
10 – REGN
Highest Volume Rated S&P 500 Components Per 1/21/2025’s Close:
1 – MMM
2 – ORCL
3 – NFLX
4 – SCHW
5 – KEY
6 – AME
7 – STX
8 – GS
9 – FICO
10 – LEN
Lowest Volume Rated S&P 500 Components Per 1/21/2025’s Close:
1 – HUM
2 – WDAY
3 – LII
4 – IFF
5 – APTV
6 – AXON
7 – TROW
8 – IEX
9 – HST
10 – UHS
Highest Technical Rated ETFs Per 1/21/2025’s Close:
1 – TSLR
2 – TSLT
3 – TSLL
4 – BITU
5 – TSL
6 – BITX
7 – BTFX
8 – BITW
9 – HODL
10 – BTCW
Lowest Technical Rated ETFs Per 1/21/2025’s Close:
1 – TSLZ
2 – TSDD
3 – TSLQ
4 – MSOX
5 – SBIT
6 – CNBS
7 – MRNY
8 – BCHG
9 – SARK
10 – KOLD
Highest Volume Rated ETFs Per 1/21/2025’s Close:
1 – AGRH
2 – CCNR
3 – LCF
4 – MVFG
5 – MVFD
6 – SFYX
7 – SFY
8 – CPLS
9 – PIFI
10 – BBSB
Lowest Volume Rated ETFs Per 1/21/2025’s Close:
1 – GVUS
2 – ZSEP
3 – MDCP
4 – XHYT
5 – HEJD
6 – TAFL
7 – SEPW
8 – PFUT
9 – FEUZ
10 – FCA
Highest Technical Rated General Stocks Per 1/21/2025’s Close:
1 – BBIG
2 – CAPC
3 – RGTI
4 – NUKK
5 – WLGS
6 – SPCB
7 – CHRO
8 – QNCCF
9 – FNMA
10 – LAES
Lowest Technical Rated General Stocks Per 1/21/2025’s Close:
1 – GOEV
2 – BETSF
3 – SLXN
4 – MULN
5 – CERO
6 – AEON
7 – GTI
8 – IGMS
9 – STAI
10 – LICN
Highest Volume Rated General Stocks Per 1/21/2025’s Close:
1 – USEG
2 – INM
3 – DWTX
4 – VATE
5 – SST
6 – ASST
7 – LEDS
8 – CHRO
9 – SOPA
10 – HUSA
Lowest Volume Rated General Stocks Per 1/21/2025’s Close:
1 – QMCI
2 – TIMCF
3 – DMXCF
4 – SEELQ
5 – SFES
6 – BONXF
7 – SUGP
8 – POCI
9 – AMXEF
10 – SVBL
*** THE LIST ABOVE IS STRICTLY FOR INFORMATIONAL PURPOSES – I MAY OR MAY NOT HAVE OR INITIATE A LONG, SHORT, OR LONG/SHORT POSITION IN ANY NAME ABOVE AT ANY TIME ***
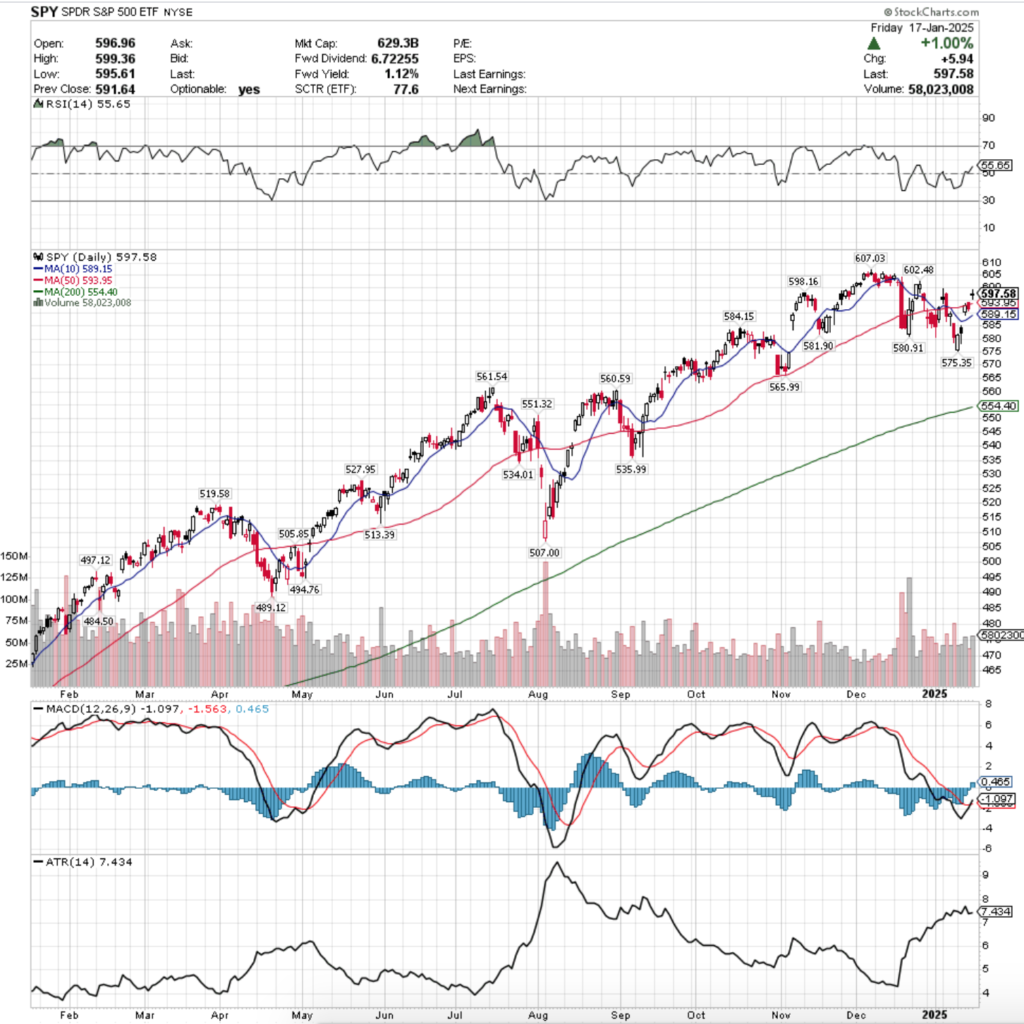
SPY, the SPDR S&P 500 ETF gained +2.94% last week, while the VIX closed at 15.97, indicating an implied one day move of +/-1.01% & an implied one month move of +/-4.62%, following the first full week of trading of the past four weeks.
SPY ETF – SPDR S&P 500 ETF’s Technical Performance Over The Past Year
Their RSI crossed the neutral level of 50 after Wednesday’s gap up session, while their MACD crossed over bullishly on Friday.
Volumes were -9.36% lower than the prior year’s average (50,924,000 vs. 54,180,870), which casts the gains of the week in a suspicious light, given that the highest volume advancing days came on sessions with gap ups & leave windows to be filled.
Monday saw the temporary recovery from the prior week kick off, but note the low volume of the day, indicating that there was not enough conviction behind the move to view it as a true, robust reversal.
Tuesday continued this theme, as the session opened on a gap up, but was unable to test much higher & SPY sunk to the middle of Monday’s range, before rallying back to close above Monday’s close, but below it’s own opening price.
This intraday volatility paired with the low volume attached with it don’t paint a picture of a healthy bull run & signal that there was a bit of intraday profit taking with a surge higher heading into the end of the session.
Wednesday opened on a gap up above the 10 day moving average’s resistance, saw a small amount of downside test before continuing higher to temporarily break above the 50 day moving average’s resistance & settling in-line with the 50 DMA.
On Thursday, SPY opened on another gap up that was above the 50 day moving average’s resistance, but that profits were quickly taken from, forcing the day lower & closing below the 50 DMA.
A couple of things of note on Thursday: firstly, the lower shadow indicates that there was some more appetite lower for SPY, and the other is that all of this price action took place on the week’s lowest volume.
Friday the week left off on a rather ominous note & cast uncertainty on SPY’s future week(s).
On another gap up, SPY managed to briefly break out above the $598.16/share resistance level, but it did not sustain & the day ended closing as a doji candle on the week’s highest volume.
This indicates that there was a bit of profit taking, as well as some tug of war between the bulls & bears.
Looking ahead to the upcoming shortened week due to MLK Jr. Day, it’s worth taking a look at the difference between SPY & each of the following index ETF’s week-over-week (last week’s note is here), as this week again will be determined largely by volume.
The $598.16/share resistance level will play an important role in the week ahead, as prices will need to break through it to continue SPY’s climb higher.
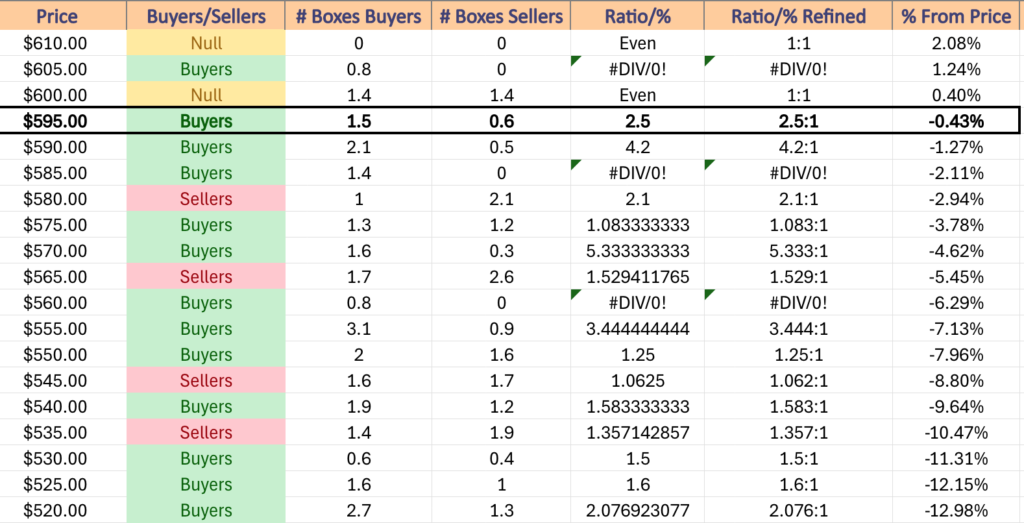
This falls in a price zone that has typically been dominated by Buyers at a rate of 2.5:1 over the past ~2 years, but there has not been much declining pressure here & we may see sellers step up to block this move.
It will also be important to keep an eye on the 10 day moving average as it moves towards the 50 DMA to see if a crossover inspires any more upwards movement in SPY, as a ~2% advance has it brushing up against its all-time high.
Again, this will require an uptick in volume in order to be sustainable, especially given the number of windows that were created by gaps last week that will eventually need to be filled.
If the support of the 10 & 50 DMAs does break down & prices reach the $589.99/share level we may see further declines down to the $579.99/share level, as the Buyers who dominate the $585-589.99 price zone have seen limited pressure from Sellers & the %580-584.99/share price zone is historically dominated by Sellers 2.1:1.
There’s not a ton of economic data this week, but there are a lot of earnings announcements which are more likely to drive SPY’s direction this week.
If neither of the two situations above occur, it will most likely be a week of SPY straddling & oscillating around the 10 DMA while awaiting the next large clue as to which way market participants are feeling.
SPY has support at the $593.95 (50 Day Moving Average, Volume Sentiment: Buyers, 4.2:1), $589.15 (10 Day Moving Average, Volume Sentiment: Buyers, 1.4:0*), $584.15 (Volume Sentiment: Sellers, 2.1:1) & $581.90/share (All-Time High, Volume Sentiment: Sellers, 2.1:1) price levels, with resistance at the $598.16 (Volume Sentiment: Buyers, 2.5:1), $602.48 (Volume Sentiment: Even, 1:1) & $607.03/share (Volume Sentiment: Buyers, 0.8:0*) price levels.
SPY ETF’s Price Level:Volume Sentiment Over The Past ~2 Years
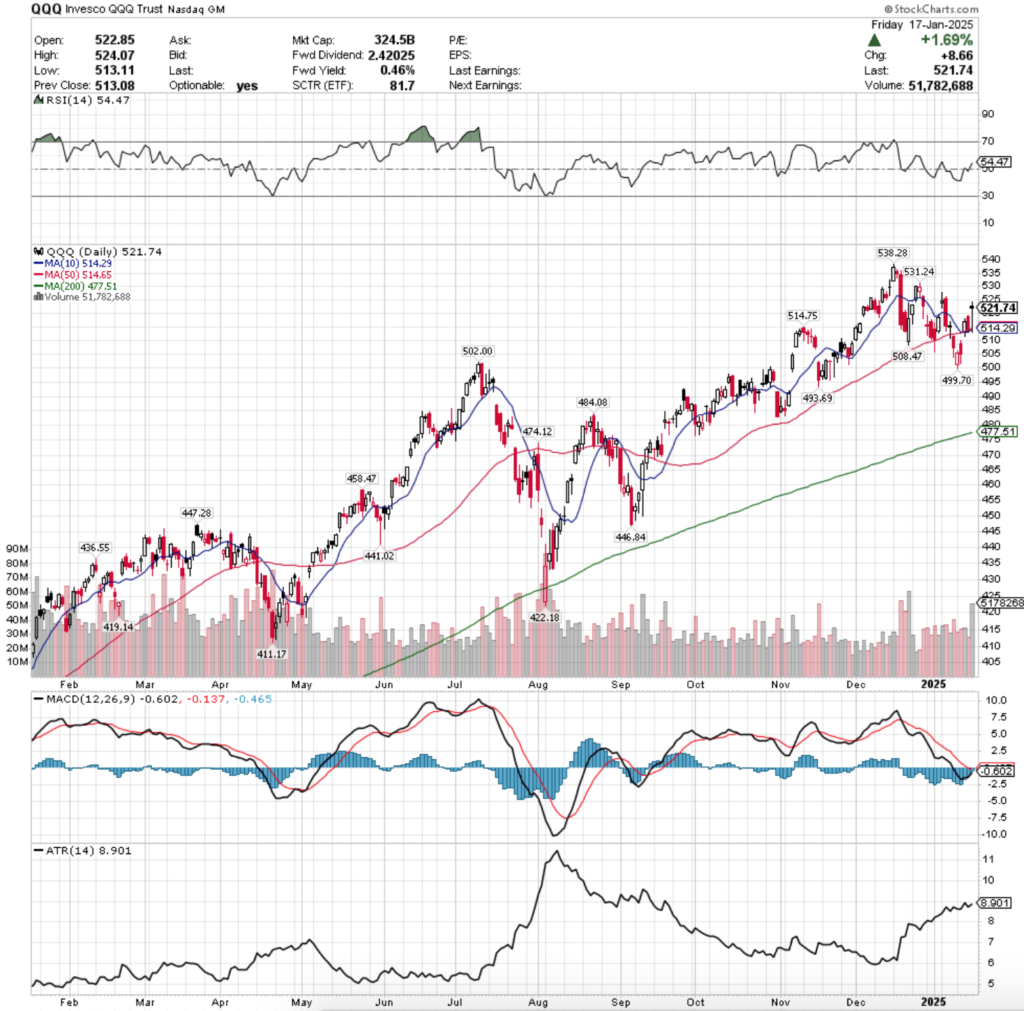
QQQ ETF – Invesco QQQ ETF’s Technical Performance Over The Past Year
Their RSI crossed over the neutral 50 mark after Wednesday’s gap up session, while their MACD is still bearish, but looks set to cross over bullishly during Tuesday’s session.
Volumes were -1.81% lower than the prior year’s average (36,092,000 vs. 36,757,391), which much like SPY tells of there being some trouble brewing for readers to be aware of.
Last week QQQ fell -2.2% on volume that was -2.3% lower than the prior year, while this week there was slightly more participation among investors, but gains mostly came on the back of Wednesday & Friday’s opening gap ups.
Monday QQQ’s week began on a gap down that managed to break below the $500/share mark briefly, before rallying higher to close above $505/share & an upper shadow showing that there was some more appetite for higher prices.
Given that this day had the second lowest volume of the week & was by no means noteworthy in terms of volume compared to the past 5+ months, it doesn’t have sturdy legs as a reversal point & needs to provide more proof in terms of the change of general sentiment in the market.
Tuesday opened on a gap up, tested higher, but ultimately retraced almost all of Monday’s candle’s real body’s price range before closing just below Monday’s closing price.
This should be cause for concern as there was more volume on Tuesday than Monday, reflecting in part some short-term profit taking, but also some market participants slowly jumping back into the pool.
Note that on Tuesday, both the 10 & 50 DMAs’ resistance levels were neck & neck & above QQQ’s price, before Wednesday’s gap up open occurred right in-line with both levels, and despite there being a retest & breakdown of their support levels, it proved temporary as prices powered higher throughout the session.
Wednesday resulted in the second highest volume of the week, but when compared to Friday’s volume (highest day) it was nothing to write home about, despite the good news pouring in in terms of big banks’ earnings results.
Recall too that financial stocks are not typically included in QQQ, which should add an added bit of skepticism about the staying power behind the day’s move.
Thursday opened on another gap higher, but sunk back down to sit in-line with the support of the 10 & 50 day moving averages, which were still braided together.
None of the above spell out a particularly strong outlook, or much in terms of optimism, which makes Friday’s performance all the more important.
Friday opened on a gap up, and despite the small upper shadow on the session’s candle is a hanging man candle, indicating that there is uncertainty & bearishness still in the air.
While it took the week’s highest volume award, Friday’s session was quite the game of tug of war between bulls & bears, where prices failed to reach the $525/share level, tested to the downside to break down the support of both the 10 & 50 day moving averages, only to close at $521.74, but lower than its opening price ($522.85).
Options expiration may have contributed to these swings & some covering/squeezing may have also played a factor, but there is not an overwhelming amount of confidence out there at the moment.
QQQ’s week ahead looks similar, except that to the upside they’ll need ~3% to challenge their all-time high, but an uptick in advancing volume will be essential for it to be sustainable.
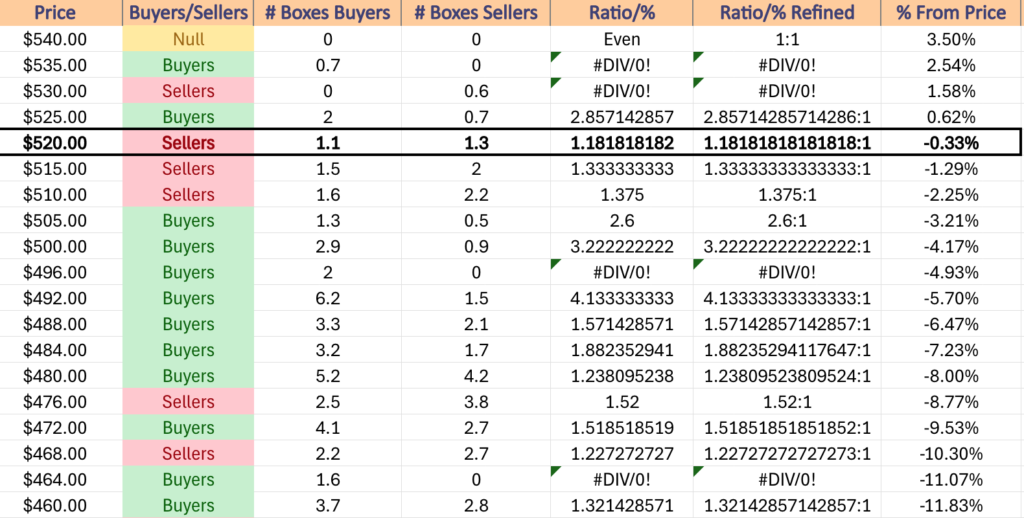
They’ll need to break above the $525/share price level as well to find stable footing, as all of the prices for the next -2.25% lower are dominated by sellers historically, which would lead to further breakdowns for QQQ & push their price below the support of the 10 & 50 day moving averages.
If the $514.75 support breaks down it will lead to them being challenged, and if they break down expect to see a retest of the $508.47 price level.
Otherwise, much like SPY, there will likely be further consolidation & oscillation around the 10 & 50 day moving averages until there is a major catalyst to the up or downside, as this is a shortened, quiet week.
QQQ has support at the $514.75 (Volume Sentiment: Sellers, 1.38:1), $514.65 (50 Day Moving Average, Volume Sentiment: Sellers, 1.38:1), $514.29 (10 Day Moving Average, Volume Sentiment: Sellers, 1.38:1) & $508.47/share (Volume Sentiment: Buyers, 2.6:1) price levels, with resistance at the $531.24 (Volume Sentiment: Sellers, 0.6:0*) & $538.28/share (All-Time High, Volume Sentiment: 0.7:0*) price levels.
QQQ ETF’s Price Level:Volume Sentiment Over The Past ~2 Years
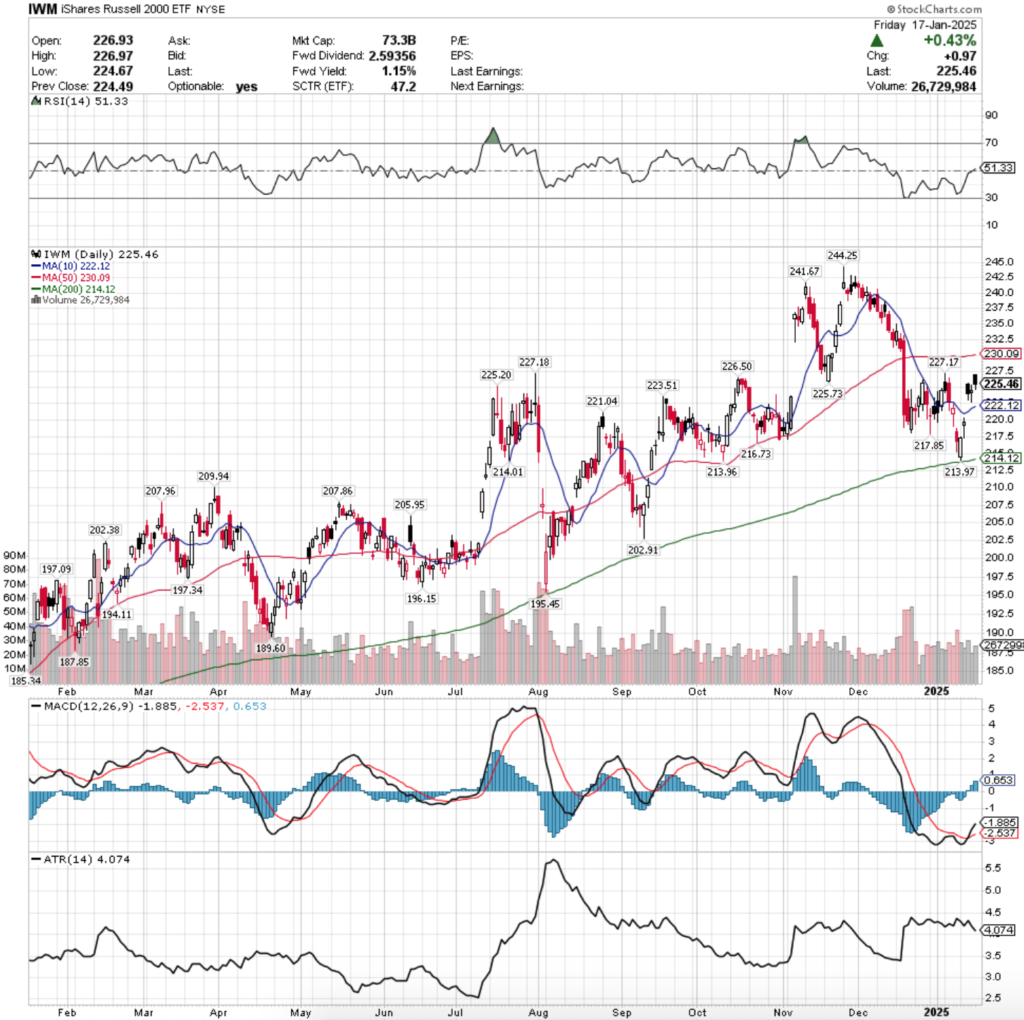
IWM, the iShares Russell 2000 ETF advanced +3.98%, as the small cap index was the most favored among market participants out of the major four index ETFs.
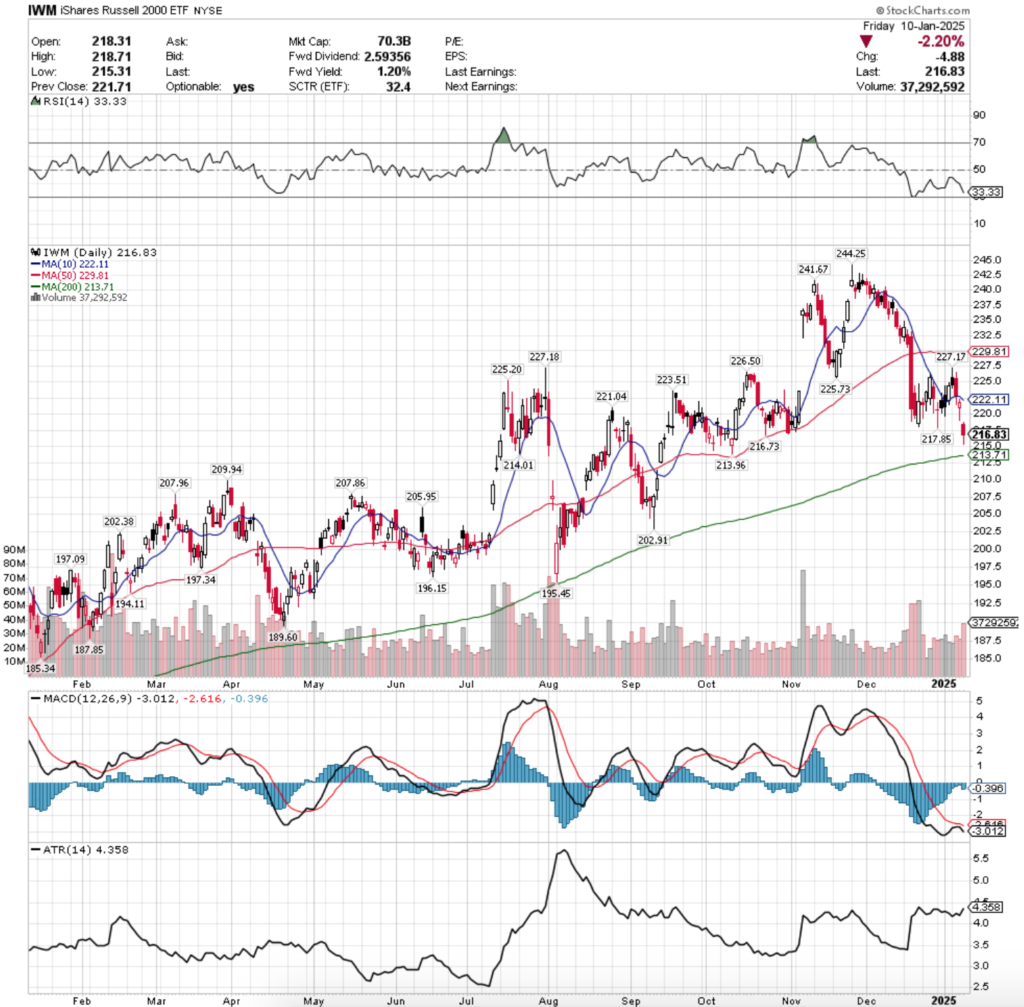
IWM ETF – iShares Russell 2000 ETF’s Technical Performance Over The Past Year
Their RSI crossed over above their neutral 50 mark & sits at 51.33 after Wednesday’s gap up session, while their MACD crossed over bullishly on Thursday.
Volumes were -14.6% lower than the prior year’s average (26,390,000 vs. 30,902,213), which also tells a tale of uncertainty that could well result in weakness in the coming week(s).
It is worth noting before we proceed that IWM’s chart is unique in that it contains no proper declining sessions compared to SPY & QQQ, however, there’s still a lot that stands to be improved from a place of market confidence for the small-cap index.
Firstly, on Monday IWM opened on a gap down, wound up declining to test the long-term trend’s support level a the 200 day moving average, before advancing higher to close above the prior Friday’s close.
While the session had the second highest volume of the week, the small upper shadow combined with the overall lackluster volume compared to the previous year’s average level is reason to carry caution into the coming week.
Tuesday featured a gap up open to near the $220/share price level, that tested below the $217.50 price level intraday, as well as above the $220/share level before ultimately settling up for an advancing session, but closed as a spinning top, indicating indecision.
The size of the upper shadow on Tuesday’s candle does not categorize it necessarily as a hanging man, but it certainly looks similar.
Wednesday IWM gapped up on the open to above the resistance of the 10 day moving average & above the $225/share mark on the highest volume of the week, but left reason for concern still for market participants.
Throughout the day the bulls & bears battled it out, at times forcing prices to near as low as $222.50/share & while the session closed above the day’s low, it was below the opening price, indicating that there was still quite a bit of doubt circulating IWM & its component stocks.
Thursday this theme continued, as volumes plunged to the lowest level of the week & while the session opened higher & did advance, it resulted in a spinning top high wave candle, marking a lot of uncertainty among market participants.
The lows of Thursday were lower than Wednesday’s lows & their high was lower than Wednesday’s opening price, which is a reason to tread cautiously.
The spinning top also signifies indecision & the high waves of the upper/lower shadows also show that there was a lot of reshuffling of cards amongst players, and that type of repositioning the day before an option’s expiration day is always cause for concern.
Friday couldn’t shake this theme, as the open was on a gap up higher & prices eroded all day until the $225/share mark was temporarily broken through, but prices were propped back up to close at $225.46/share to end the week, which is lower than the opening price of $226.93.
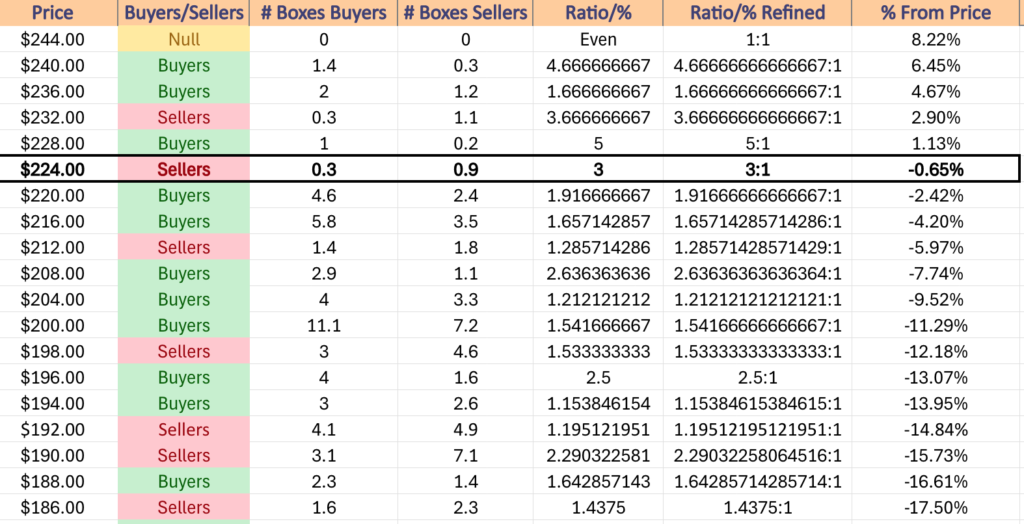
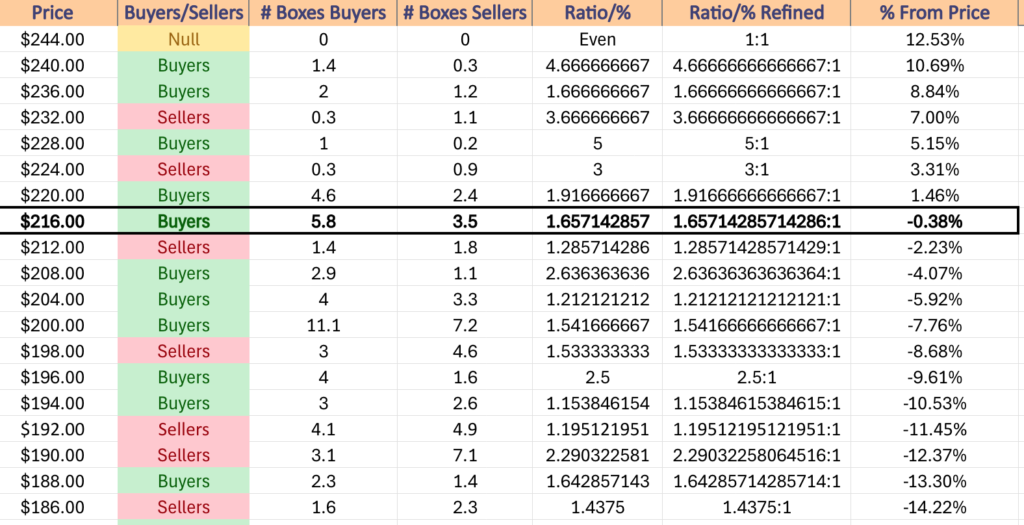
IWM will face an interesting week, as its price currently sits in a price zone that is Seller dominated 3:1, and all of the next four resistance levels are in the same zone.
In the event it gets the volume to break above the $227.17-18 levels it’ll be in a Buyer dominated zone 5:1 where it will need to break above the resistance of the 50 day moving average.
To the downside it has Buyer dominated support levels for the next -4.2%, but if you look at their past year’s chart there hasn’t been much downside testing against these levels, which might occur in the wake of some negative earnings data this week or possible bad economic data next week.
It’s also worth noting that IWM’s long-term trend line (200 DMA) is only ~5% from their closing price on Friday, which resides in a Seller dominated zone & could make for an interesting retest should prices break down.
Otherwise, expect oscillations between the 10 & 50 DMAs until an upside or downside catalyst.
IWM has support at the $225.20 (Volume Sentiment: Sellers, 3:1), $223.51 (Volume Sentiment: Buyers, 1.92:1), $222.12 (10 Day Moving Average, Volume Sentiment: Buyers, 1.92:1) & $221.04/share (Volume Sentiment: Buyers, 1.92:1) price levels, with resistance at the $225.73 (Volume Sentiment: Sellers, 3:1), $226.50 (Volume Sentiment: Sellers, 3:1), $227.17 (Volume Sentiment: Sellers, 3:1) & $227.18/share (Volume Sentiment: Sellers, 3:1) price levels.
IWM ETF’s Price Level:Volume Sentiment Over The Past ~2 Years
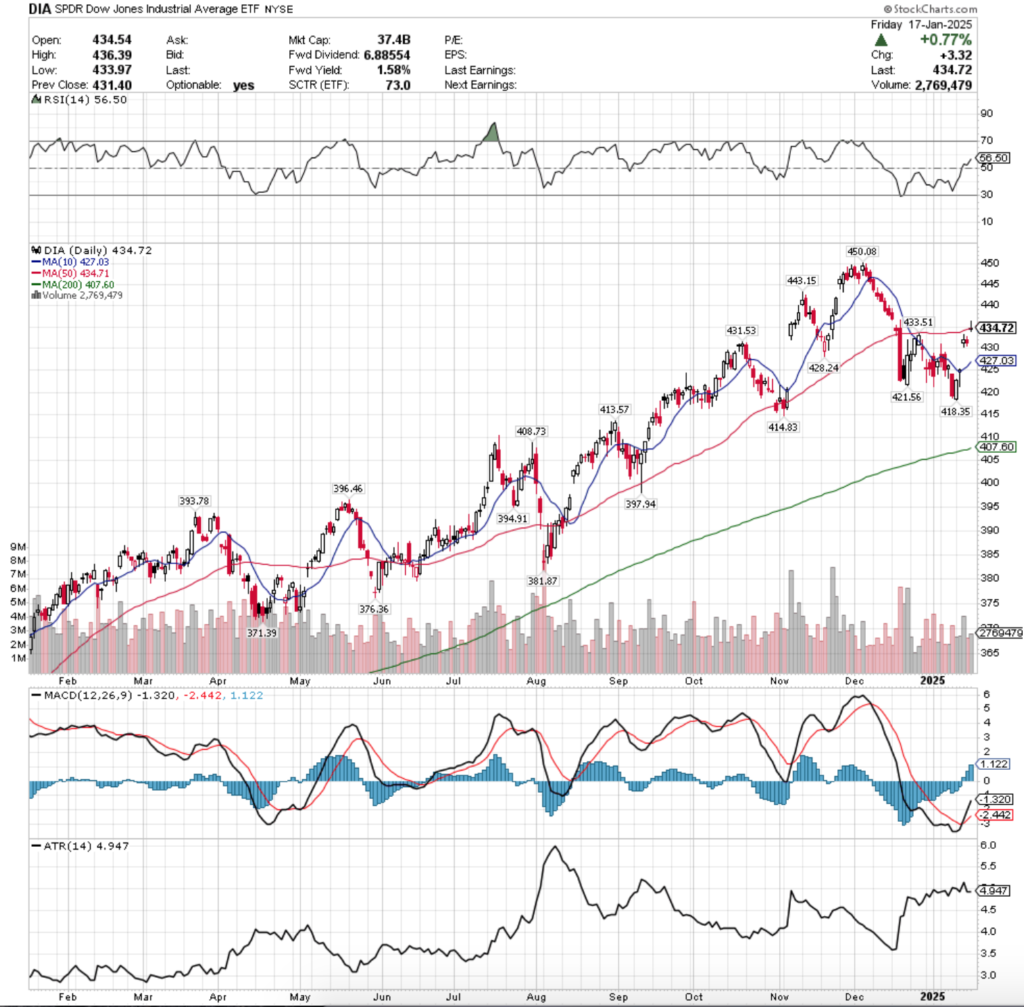
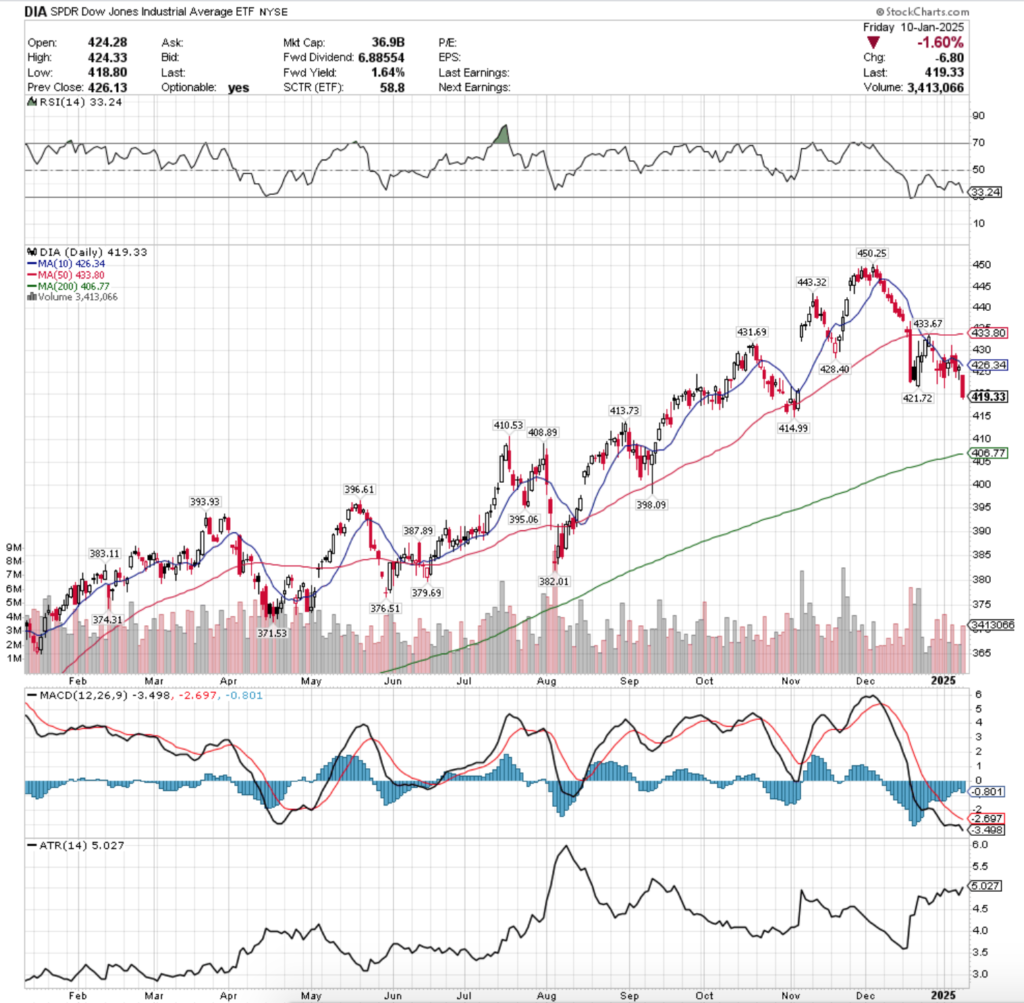
DIA ETF – SPDR Dow Jones Industrial Average ETF’s Technical Performance Over The Past Year
Their RSI has just crossed up above the neutral 50 level & sits at 56.5 following Wednesday & Friday’s gap ups, while their MACD crossed over bullishly on Wednesday.
Volumes were -12.7% lower than the previous year’s average (2,922,000 vs. 3,347,075), which should be noted given that most of the week’s session’s were advances that opened on gap ups, as this exposes weakness in the moves.
Monday DIA opened lower, but rallied on the week’s weakest volumes to close near Friday’s opening price, but the volume weakness was not convincing that there was a true reversal at play.
Tuesday opened on a gap higher to be in-line with the 10 day moving average, but retraced lower throughout the session to below Monday’s close before rallying back to close as a hanging man candle, indicating that there was not particularly strong sentiment abound.
Wednesday opened on a gap higher on the week’s strongest volume, but closed as a spinning top candle, indicating uncertainty among investors, and a great deal of it.
The primary takeaway is that the $430/share level held up & remained resilient, but prices were not able to test the 50 day moving average’s resistance.
Thursday is when things began to look murky, as the session opened slightly lower than Wednesday’s close, and closed in-line with its opening price, forming another spinning top & being a penny shy of a bearish harami candle.
It’s worth noting too that this declining volume was the second lowest of the week, so there was an extreme air of caution.
Friday also flashed warning signs, as the session opened on a gap up to just below the 50 day moving average, temporarily broke out above it, before settling back down to form a gravestone doji candle.
This will be an area to keep an eye on this week, as while their current price zone & the one below it are historically Buyer dominated, they have faced limited downside tests & Friday’s candle doesn’t indicate that there was enough upwards sentiment for DIA.
Another area to watch for DIA is the long-term trend line, which is currently ~6.2% below Friday’s closing price & climbing higher.
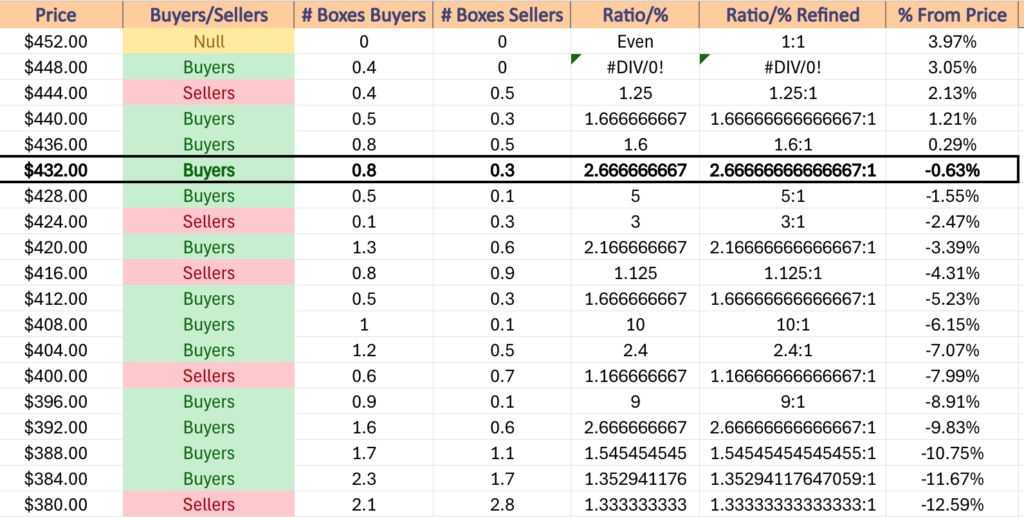
This week prices are likely to oscillate around between the 10 & 50 day moving averages, barring some catalyst to the upside or downside.
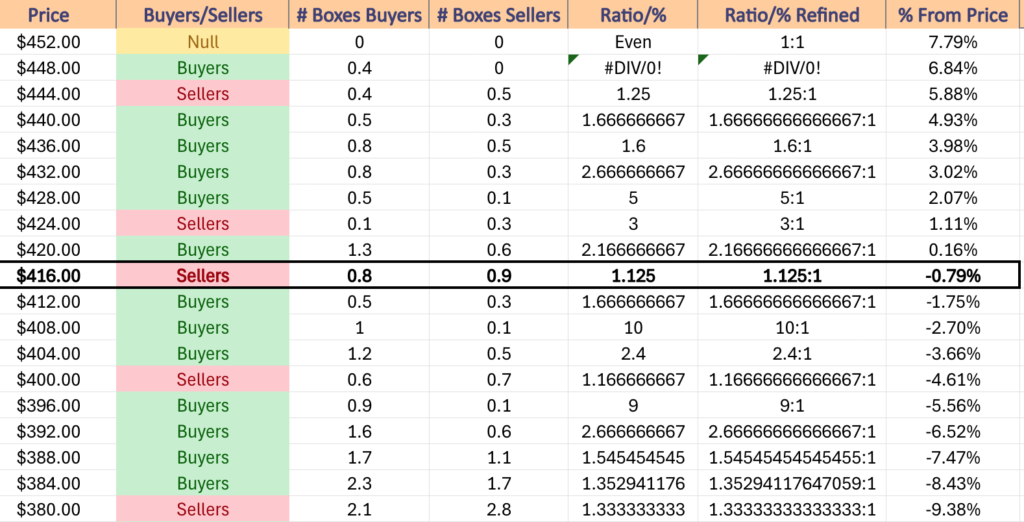
If the 10 DMA gets retested it is currently in a zone dominated by Sellers 3:1, which would put the $421.56/share support level in DIA’s crosshairs as an important support point.
DIA has support at the $434.71 (50 Day Moving Average, Volume Sentiment: Buyers, 2.67:1), $431.53 (Volume Sentiment: Buyers, 5:1), $428.24 (Volume Sentiment: Buyers, 5:1) & $427.03/share (10 Day Moving Average, Volume Sentiment: Sellers, 3:1) price levels, with resistance at the $443.15 (Volume Sentiment: Buyers, 1.67:1) & $450.08/share (10 Day Moving Average, Volume Sentiment: Buyers, 0.4:0*) price levels.
DIA ETF’s Price Level:Volume Sentiment Over The Past ~3-4 Years
The Week Ahead
Monday there is no economic data due to release as it is Martin Luther King Jr. Day.
There is also no data currently scheduled for release on Tuesday, 1/21/25.
Tuesday morning’s earnings reports feature 3M, Charles Schwab, Community Financial System, D.R. Horton, FB Financial, Fifth Third Bancorp, KeyCorp, New Oriental Education & Technology, Old National Bancorp, Peoples Bancorp, Progressive & Prologis, with Netflix, Agilysys, Canadian National Railway, Capital One Financial, Fulton Financial, Hancock Whitney, Interactive Brokers, Pathward Financial, Pinnacle Financial Partners, Progress Software, RBB Bancorp, Seagate Technology, Simmons First National, United Airlines, Wintrust Financial & Zions Bancorp scheduled to report after the closing bell.
U.S. Leading Economic Indicators are released Wednesday morning at 10 am.
Wednesday morning’s earnings reports include GE Vernova, Abbott Laboratories, Ally Financial, Amphenol, BankUnited, Comerica, Commerce Bancshares, F.N.B. Corp, Halliburton, Johnson & Johnson, OFG Bancorp, Procter & Gamble, TE Connectivity, Textron, Travelers & United Community Banks, with Alcoa, CACI International, Cadence Bank, Canadian Pacific Kansas City Ltd., Cathay Bancorp, Celestica, Discover Financial Services, Hexcel, Kinder Morgan, Knight-Swift Transportation, National Bank, Plexus, RLI Corp, SL Green Realty, Steel Dynamics, Waste Connections & WesBanco all due to report after the session’s close.
Thursday kicks off with Initial Jobless Claims data at 8:30 am.
Alaska Air Group, American Airlines, Atlantic Union Bankshares, Banc of California, Elevance Health, First Bancorp, FirstService, Freeport-McMoRan, GATX, GE Aerospace, McCormick, Northern Trust, Pacific Premier, Rogers Communications, Teck Resources, Texas Capital, Union Pacific, Valley National & WNS all report earnings on Thursday morning, followed by Associated Banc-Corp, Columbia Banking, CSX, Customers Bancorp, East West Banc, First Financial Bancorp, Glacier Bancorp, Intuitive Surgical, Sallie Mae, South State & Texas Instruments after the closing bell.
S&P Flash U.S. Services PMI & S&P flash U.S. Manufacturing PMI are scheduled for release Friday at 9:45 am, followed by Existing Home Sales & Consumer Sentiment at 10 am.
The VIX closed at 16.6, indicating an implied one day move of +/-1.05% & an implied one month move of +/-4.8% for the S&P 500.
Highest Technical Rated S&P 500 Components Per 1/16/2025’s Close:
1 – GEV
2 – VST
3 – PLTR
4 – UAL
5 – TSLA
6 – CEG
7 – TPL
8 – TPR
9 – EQT
10 – TRGP
Lowest Technical Rated S&P 500 Components Per 1/16/2025’s Close:
1 – MRNA
2 – SMCI
3 – ENPH
4 – DG
5 – EIX
6 – CE
7 – STZ
8 – ON
9 – MCHP
10 – AES
Highest Volume Rated S&P 500 Components Per 1/16/2025’s Close:
1 – CRL
2 – PNC
3 – MS
4 – USB
5 – EIX
6 – SRE
7 – JBHT
8 – MTB
9 – UNH
10 – INTU
Lowest Volume Rated S&P 500 Components Per 1/16/2025’s Close:
1 – KEYS
2 – SMCI
3 – BXP
4 – GL
5 – MLM
6 – NOW
7 – EPAM
8 – OXY
9 – PSA
10 – BA
Highest Technical Rated ETFs Per 1/16/2025’s Close:
1 – TSLR
2 – TSLT
3 – TSLL
4 – GXLM
5 – TESL
6 – TSL
7 – BOIL
8 – BTFX
9 – BITW
10 – UNG
Lowest Technical Rated ETFs Per 1/16/2025’s Close:
1 – MSOX
2 – TSLZ
3 – TSDD
4 – TSLQ
5 – KOLD
6 – MRNY
7 – CNBS
8 – TSLS
9 – MSOS
10 – WEED
Highest Volume Rated ETFs Per 1/16/2025’s Close:
1 – GVUS
2 – KCSH
3 – FHEQ
4 – IBIK
5 – GSID
6 – KWT
7 – KLXY
8 – FXG
9 – CATF
10 – KDRN
Lowest Volume Rated ETFs Per 1/16/2025’s Close:
1 – BBEM
2 – INOV
3 – UNIY
4 – DYNI
5 – MDCP
6 – IBMS
7 – AUGW
8 – KOOL
9 – BCIM
10 – QTJA
Highest Technical Rated General Stocks Per 1/16/2025’s Close:
1 – CAPC
2 – QNCCF
3 – SEVCD
4 – VRME
5 – RGTI
6 – DATS
7 – CTM
8 – HTCO
9 – OPTT
10 – XBOTF
Lowest Technical Rated General Stocks Per 1/16/2025’s Close:
1 – RGFC
2 – GCTK
3 – LUXH
4 – CRKN
5 – MULN
6 – SLXN
7 – IGMS
8 – CMCT
9 – APLT
10 – ACON
Highest Volume Rated General Stocks Per 1/16/2025’s Close:
1 – BMRA
2 – TWO
3 – FSI
4 – PMAX
5 – PMEC
6 – AEON
7 – TROO
8 – WHLR
9 – KPLT
10 – KEYLB
Lowest Volume Rated General Stocks Per 1/16/2025’s Close:
1 – SDCH
2 – LONCF
3 – OMTK
4 – MSCLF
5 – NGPHF
6 – PUCCF
7 – ARTH
8 – WPGCF
9 – RHHBF
10 – PIFYF
*** THE LIST ABOVE IS STRICTLY FOR INFORMATIONAL PURPOSES – I MAY OR MAY NOT HAVE OR INITIATE A LONG, SHORT, OR LONG/SHORT POSITION IN ANY NAME ABOVE AT ANY TIME ***
The VIX closed at 16.12, indicating an implied one day move of +/-1.02% & an implied one month move of +/-4.66% for the S&P 500.
Highest Technical Rated S&P 500 Components Per 1/15/2025’s Close:
1 – TSLA
2 – GEV
3 – UAL
4 – PLTR
5 – VST
6 – TPL
7 – CEG
8 – TPR
9 – EQT
10 – AVGO
Lowest Technical Rated S&P 500 Components Per 1/15/2025’s Close:
1 – MRNA
2 – SMCI
3 – DG
4 – STZ
5 – CE
6 – EIX
7 – ENPH
8 – AES
9 – BIIB
10 – LW
Highest Volume Rated S&P 500 Components Per 1/15/2025’s Close:
1 – EIX
2 – C
3 – SRE
4 – ISRG
5 – GS
6 – BLDR
7 – BK
8 – GWW
9 – PCG
10 – CBOE
Lowest Volume Rated S&P 500 Components Per 1/15/2025’s Close:
1 – SMCI
2 – DLTR
3 – UHS
4 – CNC
5 – ERIE
6 – SBUX
7 – CLX
8 – BA
9 – EL
10 – GNRC
Highest Technical Rated ETFs Per 1/15/2025’s Close:
1 – UVIX
2 – TSLR
3 – TSLT
4 – TSLL
5 – TSL
6 – TESL
7 – GXLM
8 – BTFX
9 – BOIL
10 – BITW
Lowest Technical Rated ETFs Per 1/15/2025’s Close:
1 – MSOX
2 – TSLZ
3 – TSDD
4 – TSLQ
5 – KOLD
6 – CNBS
7 – MRNY
8 – TSLS
9 – WEED
10 – MSOS
Highest Volume Rated ETFs Per 1/15/2025’s Close:
1 – LKOR
2 – GSIB
3 – EFAV
4 – MCDS
5 – SRET
6 – FLLA
7 – USVM
8 – NBFC
9 – ISDB
10 – SPDV
Lowest Volume Rated ETFs Per 1/15/2025’s Close:
1 – AUGT
2 – ZSEP
3 – AUGW
4 – MDCP
5 – GSID
6 – BHYB
7 – TPMN
8 – SEPW
9 – MDPL
10 – MSSS
Highest Technical Rated General Stocks Per 1/15/2025’s Close:
1 – VAXX
2 – CAPC
3 – SEVCD
4 – QNCCF
5 – UPHL
6 – VRME
7 – RGTI
8 – XBOTF
9 – HTCO
10 – QUBT
Lowest Technical Rated General Stocks Per 1/15/2025’s Close:
1 – RGFC
2 – GCTK
3 – AEON
4 – CRKN
5 – AILEQ
6 – MULN
7 – CERO
8 – EFSH
9 – LICN
10 – IGMS
Highest Volume Rated General Stocks Per 1/15/2025’s Close:
1 – CMCT
2 – MITQ
3 – OSTX BKYI
4 – SONM
5 – PMAX
6 – SGD
7 – SGBX
8 – ONCY
9 – FAMI
10 – MASS
Lowest Volume Rated General Stocks Per 1/15/2025’s Close:
1 – SFES
2 – NMREF
3 – RGFC
4 – CMRZF
5 – AILEQ
6 – QYOUF
7 – SCTSF
8 – SVBL
9 – MHCUF
10 – BNPQF
*** THE LIST ABOVE IS STRICTLY FOR INFORMATIONAL PURPOSES – I MAY OR MAY NOT HAVE OR INITIATE A LONG, SHORT, OR LONG/SHORT POSITION IN ANY NAME ABOVE AT ANY TIME ***
The VIX closed at 19.19, indicating an implied one day move of +/-1.21% & an implied one month move of +/-5.55% for the S&P 500.
Highest Technical Rated S&P 500 Components Per 1/13/2025’s Close:
1 – UAL
2 – TSLA
3 – VST
4 – PLTR
5 – TPR
6 – AVGO
7 – TPL
8 – CEG
9 – EQT
10 – TRGP
Lowest Technical Rated S&P 500 Components Per 1/13/2025’s Close:
1 – MRNA
2 – EIX
3 – CE
4 – SMCI
5 – AES
6 – STZ
7 – ENPH
8 – DG
9 – MCHP
10 – INTC
Highest Volume Rated S&P 500 Components Per 1/13/2025’s Close:
1 – EIX
2 – MRNA
3 – PCG
4 – STZ
5 – SRE
6 – AEP
7 – MDLZ
8 – CEG
9 – ESS
10 – MMC
Lowest Volume Rated S&P 500 Components Per 1/13/2025’s Close:
1 – HSIC
2 – AXON
3 – ERIE
4 – DLTR
5 – BA
6 – SW
7 – SMCI
8 – TER
9 – JNPR
10 – PAYC
Highest Technical Rated ETFs Per 1/13/2025’s Close:
1 – TSDD
2 – TSLR
3 – TSLT
4 – TSLL
5 – TESL
6 – TSL
7 – BOIL
8 – BITW
9 – BZQ
10 – UNG
Lowest Technical Rated ETFs Per 1/13/2025’s Close:
1 – MSOX
2 – TSLZ
3 – TSLQ
4 – MRNY
5 – CNBS
6 – KOLD
7 – AMDL
8 – TSLS
9 – MSOS
10 – WEED
Highest Volume Rated ETFs Per 1/13/2025’s Close:
1 – SECR
2 – TEMP
3 – CPNS
4 – IQSM
5 – VABS
6 – KLXY
7 – EMHC
8 – MBBB
9 – IWLG
10 – IQHI
Lowest Volume Rated ETFs Per 1/13/2025’s Close:
1 – EMCS
2 – CCNR
3 – PABU
4 – USCA
5 – FEUZ
6 – GSID
7 – MDCP
8 – QQQW
9 – FFIU
10 – AUGW
Highest Technical Rated General Stocks Per 1/13/2025’s Close:
1 – CAPC
2 – VRME
3 – SEVCD
4 – DATS
5 – FUBO
6 – NITO
7 – MVST
8 – XBOTF
9 – FMCC
10 – FNMA
Lowest Technical Rated General Stocks Per 1/13/2025’s Close:
1 – RGFC
2 – AEON
3 – MULN
4 – CYN
5 – CRKN
6 – IGMS
7 – AILEQ
8 – ALUR
9 – EFSH
10 – LICN
Highest Volume Rated General Stocks Per 1/13/2025’s Close:
1 – SLRX
2 – PHIO
3 – OUT
4 – ATPC
5 – XXII
6 – FDVA
7 – GCTK
8 – AZTR
9 – ITCI
10 – JYD
Lowest Volume Rated General Stocks Per 1/13/2025’s Close:
1 – WMLLF
2 – ALPIB
3 – ORZCF
4 – SDCH
5 – STPGF
6 – AILEQ
7 – GAMI
8 – FDSB
9 – AVCNF
10 – RHHBF
*** THE LIST ABOVE IS STRICTLY FOR INFORMATIONAL PURPOSES – I MAY OR MAY NOT HAVE OR INITIATE A LONG, SHORT, OR LONG/SHORT POSITION IN ANY NAME ABOVE AT ANY TIME ***
SPY, the SPDR S&P 500 ETF finished the third consecutive four day shortened week -1.94%, while the VIX closed at 19.54, indicating an implied one day move of +/-1.23% & an implied one month move of +/-5.65%.
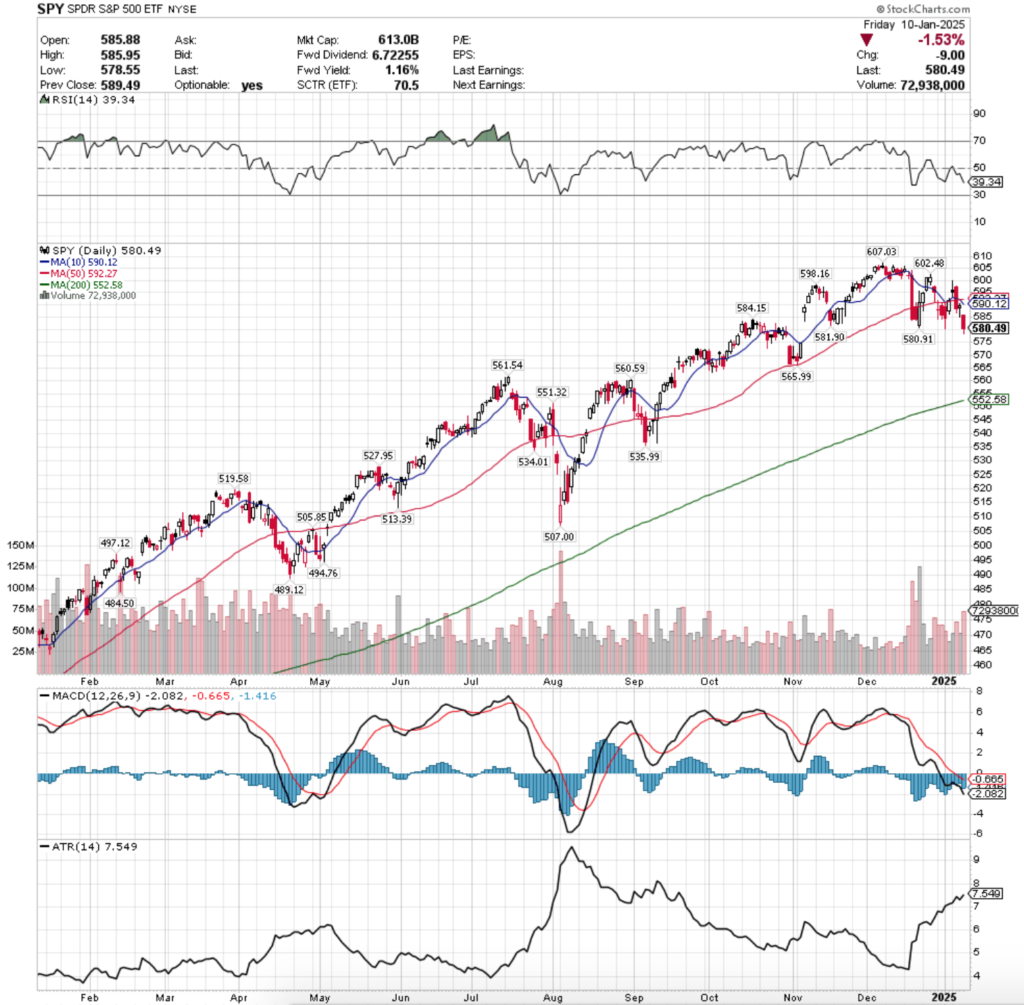
SPY ETF – SPDR S&P 500 ETF’s Technical Performance Over The Past Year
Their RSI is trending down closer to oversold territory & sits currently at 39.34, while their MACD continues bearishly lower as it has been since early December.
Volumes were +1.03% above the previous year’s average level (57,120,000 vs. 56,537,421), which should cause concern for market participants, given that most of the volume was declining & it was in a short week.
Also, as has been noted over the past nine months, volumes as a whole for all of the major index ETFs for the most part have been markedly lower since April 19,2024, so the fact that this week was slightly above average SPY volume is really not a great sign.
Monday set the tone for a week of continued weakness for SPY, as a light volume session opened on a gap up above the 10 & 50 day moving averages’ resistance, only to result in a spinning top candle, who closed lower than it opened, in a move that does not inspire confidence.
It’s upper shadow showed that there was some interest in the $600/share mark at one point during the day, but that profits were quickly taken & there was a test of the 10 DMA’s support that held up for the day.
There was quite a bit of uncertainty floating around in SPY & its components in a shortened week before earnings season begins again.
Tuesday the floor fell out, as SPY opened higher, but proceeded to sink below both the 10 & 50 day moving averages’ support & continue lower, with the lower shadow indicating that there was still some appetite to push prices lower than where they wound up closing at, which occurred on the second highest volume of the week.
People were clearly deciding it time to cash in their chips & take their profits given the higher than normal volume of the week noted above.
Wednesday has similar low volumes as Monday, and the day’s candle continued painting the grim outlook for SPY, as while the day opened higher, it quickly showed that investors had their eyes set on the $585/share level & temporarily dropped that low before being squeezed higher to close the day with a slight advance.
It should be noted that the 10 DMA crossed bearishly through the 50 DMA on Wednesday as well, signaling that there will be a rocky couple of weeks ahead of us for SPY.
Friday confirmed that, when the week’s highest volume session came on a declining day that opened above $585, but barreled down to close at $580.49 by the end of the day, with the lower shadow indicating that there was appetite for SPY <$580/share.
In terms of what to watch for this week, much of last week’s same themes continue, as there are little upside catalysts, unless earnings reports mid-week from the big banks stun investors positively, which seems increasingly less likely.
Even should we get a pleasant surprise, the current upside view is hinged upon the 10 & 50 DMAs’ resistance, which are now both bearing down on price as investors have already signaled that they don’t mind pushing SPY into the $575 price block.
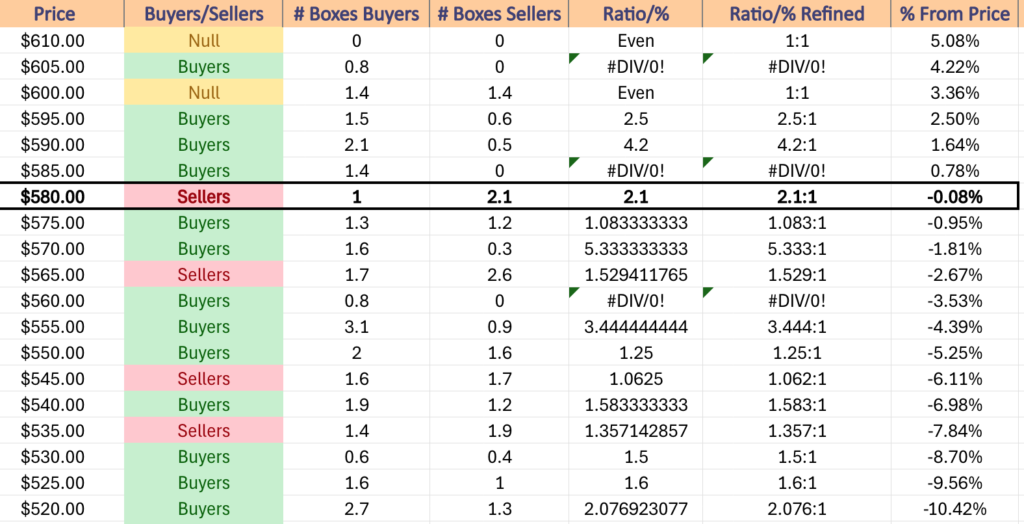
Another thing to be mindful of is that over the past ~2 years SPY when trading between $580-584.99/share has been dominated by Sellers at the rate of 2.1:1 & that is the price block they closed in on Friday.
As was alluded on last week, there are now no support levels until $565.99/share, which presents a new problem for SPY.
In the table below you can see that the $570-574.99/share zone is Buyer dominated 5.33:1, but there are no support levels in that zone, leading SPY into a Seller dominated zone where the ratio is 1.53:1.
Should that support level break down the next is $561.54, which occurs in a Buyer dominated zone where the ratio is 0.8:0*, indicating that sellers have not historically been active in this price zone.
Typically these zones get retested & there will be more declining volume, which suddenly leaves SPY with the $560.59/share support level & then the 200 day moving average, which represents the long-term trend.
While the decline from Friday’s closing price to hit the 200 DMA is -4.81%, it is something to keep an eye out for as we descend into an anticipated earnings season.
Unless there is a major change in advancing volume levels it seems unlikely that there will be any sturdy upside move in the coming week, and should there be one the 10 & 50 DMAs’ resistance will also need to be broken through, which seems unlikely after the past few weeks.
At best, perhaps price will straddle/oscillate around the 10 DMA.
SPY has support at the $565.99 (Volume Sentiment: Sellers, 1.53:1), $561.54 (Volume Sentiment: Buyers, 0.8:0*), $560.59 (Volume Sentiment: Buyers, 0.8:0*) & $552.58/share (200-Day Moving Average, Volume Sentiment: Buyers, 1.25:1) price levels, with resistance at the $580.91 (Volume Sentiment: Sellers, 2.1:1), $581.90 (Volume Sentiment: Sellers, 2.1:1), $584.15 (Volume Sentiment: Sellers, 2.1:1) & $590.12/share (10 Day Moving Average, Volume Sentiment: Buyers, 4.2:1) price levels.
SPY ETF’s Price Level:Volume Sentiment Over The Past ~2 Years
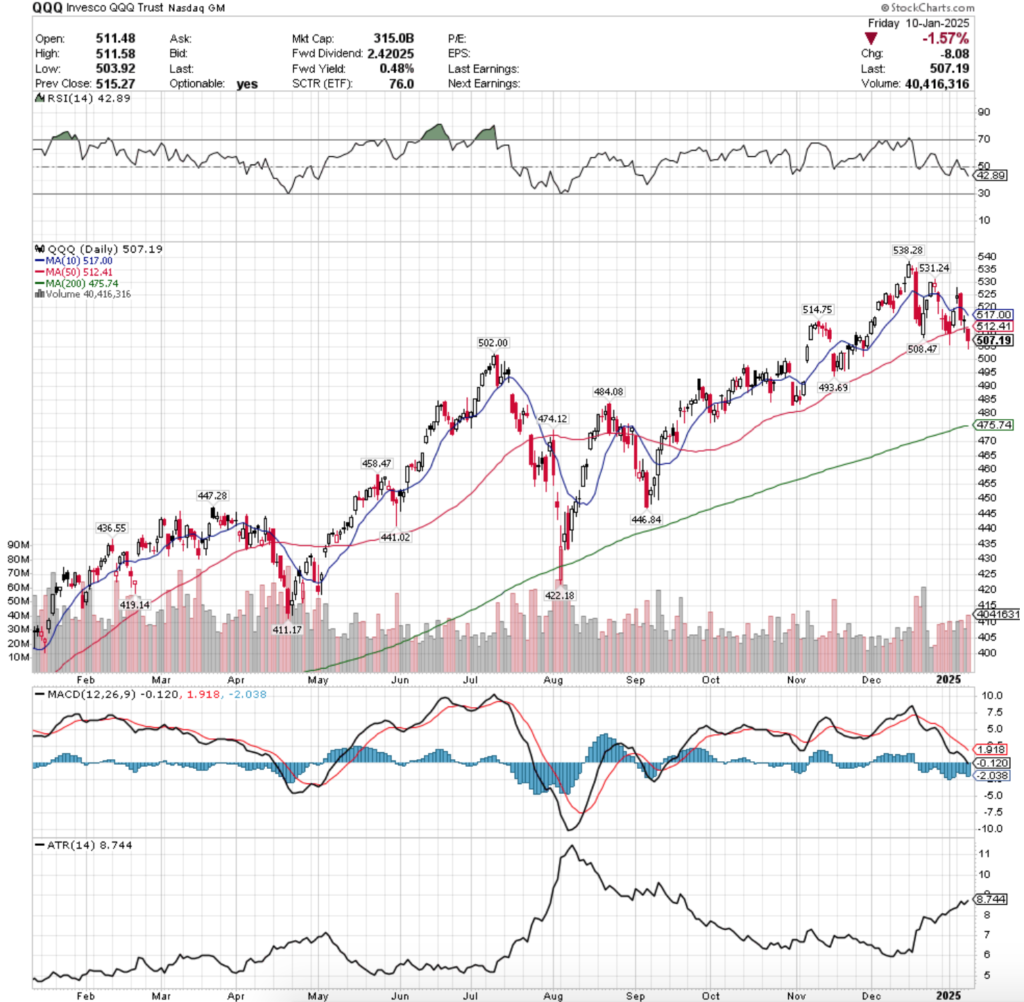
QQQ, the Invesco QQQ Trust ETF finished the week down -2.2%, as the tech-heavy NASDAQ index saw even more selling than SPY.
QQQ ETF – Invesco QQQ Trust ETF’s Technical Performance Over The Past Year
Their RSI is also downtrending & sits at 42.89, while their MACD continues to bearishly decline.
Volumes were -2.28% lower than the previous year’s average level (36,027,500 vs. 36,869,643), which is cause for concern similar to SPY’s, given that this occurred on a short week.
Again, while average volume levels of the past year have become diluted compared to what they were when running the same exercise nine months ago, these “high” levels are cause for concern given that they’re occurring on declining weeks at somewhat pivotal points on their one year charts.
Much like SPY, QQQ opened the week up on unstable footing, with a spinning top candle on Monday that had long upper & lower shadows indicating that there was a lot of tug of war taking place between bulls & the bears.
Tuesday the floor fell out from under QQQ, as the day opened higher, but on the week’s second highest volume their price crashed through the 10 day moving average’s support & their candles’s lower shadow showed that there was appetite for taking on the 50 DMA as well.
Wednesday confirmed this, when the day wound up temporarily breaking down through the 50 DMA, but was able to close as a doji that closed lower than it has opened, indicating weakness, especially when combined with the low volume.
Friday the session opened on a gap down to below the 50 DMA & never tested its resistance level, and continued to decline lower, with a lower shadow indicating that there is likely more downside movement on the horizon in the coming week(s).
As we’ve been saying for months, QQQ & SPY have been trading quite similarly to one another & what to look for this week is similar between the two.
On each ETF’s chart there is an emerging bearish head & shoulders pattern, which appears to be continuing into this new week.
QQQ’s 10 DMA will cross bearishly through their 50 DMA as well by Wednesday, which will apply downwards pressure on the price, leading to their 200 DMA, the long-term trend, which is currently their fourth support level from Friday’s closing price.
Their 200 DMA is -6.2% below Friday’s closing price, which will make for an interesting test against the long-term trend should they meet again like they did temporarily in August (recall they barely came out of that ahead).
Prices are likely to fluctuate around between the 200, 50 & 10 DMAs in the coming week in a form of consolidation.
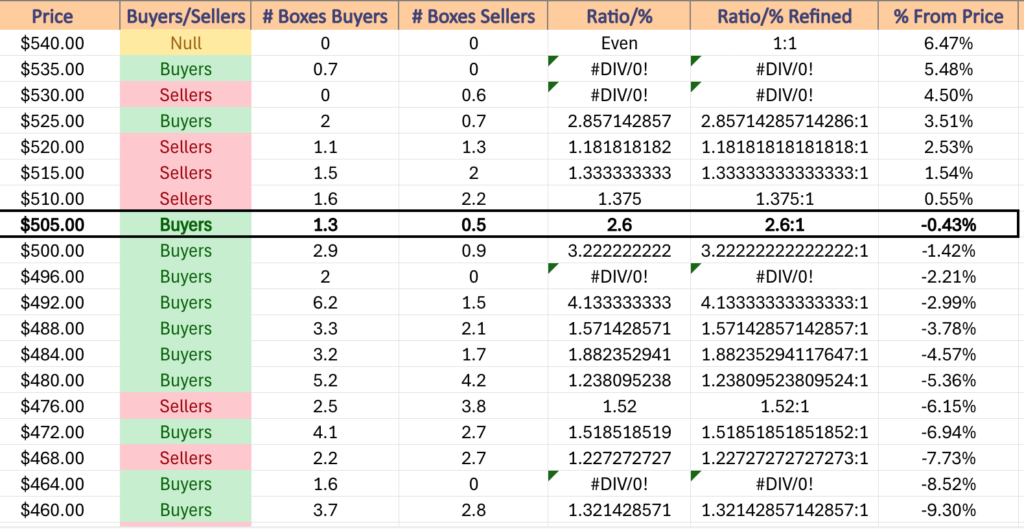
Referencing the data below re: volume sentiments appears like a rosy picture at first, but aside from the $492-495.99/share zone there is not a whole lot of support, particularly when you break down how untested many of the price levels below are.
Any type of upside movement will likely be straddling/oscillating around the 10 DMA, as unless there is significant advancing volume there doesn’t appears to be much left in the tank to retest QQQ’s all-time high.
QQQ has support at the $502 (Volume Sentiment: Buyers, 3.22:1), $493.69 (Volume Sentiment: Buyers, 4.13:1), $484.08 (Volume Sentiment: Buyers, 1.88:1) & $475.74/share (200-Day Moving Average, Volume Sentiment: Buyers, 1.52:1) price levels, with resistance at the $508.47 (Volume Sentiment: Buyers, 2.6:1), $512.41 (50-Day Moving Average, Volume Sentiment: Sellers, 1.38:1), $514.75 (Volume Sentiment: Sellers, 1.38:1) & $517/share (10-Day Moving Average, Volume Sentiment: Sellers, 1.33:1) price levels.
QQQ ETF’s Price Level:Volume Sentiment Over The Past ~2 Years
IWM, the iShares Russell 2000 ETF declined -3.39%, as the small cap index was the least favored of the major four index ETFs last week.
IWM ETF – iShares Russell 2000 ETF’s Technical Performance Over The Past Year
Their RSI is trending down towards the oversold 30 mark & sits at 33.33, while their MACD continues its descent lower.
Volumes were -6.52% lower than the previous year’s average (29,140,000 vs. 31,172,738), which is sending a bearish signal given that 20% of the trading week didn’t take place & the week resulted in declines; people wanted out.
Monday opened up similar to QQQ & SPY, where low volumes & wide daily ranges ran supreme, but IWM’s session managed to close lower than it opened, a bearish signal.
Tuesday the bleeding really started, as the day opened within the prior day’s range made an upwards move but was quickly halted only to break down below the 10 day moving average’s support, and barely being able to rally up to close in-line with it on the second highest volume of the week.
Wednesday this theme continued, as the session opened on a gap down & while it managed to close higher than it opened, and the low volumes made it near impossible for IWM to run at the 10 day moving average’s resistance.
Friday this continued, with another gap down which brought IWM’s price +1.46% above the 200 day moving average, making the long-term trend beginning to look in danger.
Friday’s volume being the highest of the week is also a troubling issue, as it does begin to make the long-term trend look in danger of breaking down.
As mentioned above, there also appears to be a bearish head & shoulders emerging which will require some heavy advancing volume to break out of to the upside.
It should be noted too that the 4th support level for IWM is also their 200 DMA, much like SPY & QQQ.
This week it will be important to keep an eye out on how the price interacts with the 200 DMA’s support & the descending 10 & 50 DMAs above them.
So far in 2024 IWM managed to stay above the 200 DMA’s support, but this is looking like that may break down in the event of a retest, particularly as their all-time high took place only a month ago.
Volume sentiment also suggests that the trend may break down, given that the $212-215.99/share price level is Seller dominated 1.29:1.
Should that break down the $208-211.99/share zone is the strongest Buyer zone nearby for IWM, which will need to hold up should the $209.94/share support level be tested again.
IWM has support at the $216.73 (Volume Sentiment: Buyers, 1.66:1), $214.01 (Volume Sentiment: Sellers, 1.29:1), $213.96 (Volume Sentiment: Sellers, 1.29:1) & $213.71/share (200-Day Moving Average, Volume Sentiment: Sellers, 1.29:1) price levels, with resistance at the $217.85 (Volume Sentiment: Buyers, 1.66:1), $221.04 (Volume Sentiment: Buyers, 1.92:1), $222.11 (10-Day Moving Average, Volume Sentiment: Buyers, 1.92:1) & $223.51/share (Volume Sentiment: Buyers, 1.92:1) price levels.
IWM ETF’s Price Level:Volume Sentiment Over The Past ~2 Years
DIA ETF – SPDR Dow Jones Industrial Average ETF’s Technical Performance Over The Past Year
Their RSI is also trending down towards the oversold level much like IWM & sits at 33.24, while their MACD continues to sink lower.
Volumes were -18.58% lower than the previous year’s average (2,737,500 vs. 3,362,341), which signals that market participants are really getting anxious & there’s a bit of fear in the air.
Monday began on a high volume sell-off (relative to the rest of the week) where the 10 DMA’s support broke down.
Tuesday managed to open above the 10 DMA, but quickly ducked bath beneath it & that theme carried out throughout the week based on the downside appetite shown by the candle’s lower shadow.
Wednesday the bleeding took a short pause on low volume, and the spinning top candle showed that there was quite a bit of uncertainty in the air, especially as the session did not advance much at all towards the 10 DMA’s resistance.
Friday the pain continued, on a gap down session that wound up taking -1.6% off of DIA’s price on high volume for the week.
In the week ahead it will be beneficial to keep an eye out on for how the price moves in relation to the resistance of the 10 & 50 DMAs above, as well as how far above its 200 DMA’s support it can stay before a retest.
DIA is further from its long-term trend line vs. the previous three mentioned index ETFs in terms of support levels, but its price is still ~3% above the 200 DMA’s support, while a similar head & shoulders reversal pattern to the prior three ETFs is appearing on their one year chart.
Sustainable upward movement for DIA will require an influx in advancing volume, and the volume at the immediate price levels below Friday’s close do look like they’re ready to be tested against, particularly the $408-411.99/share zone which is currently in favor of the Buyers 10:1.
DIA has support at the $414.99 (Volume Sentiment: Buyers, 1.67:1), $413.73 (Volume Sentiment: Buyers, 1.67:1), $410.53 (Volume Sentiment: Buyers, 10:1) & $408.89/share (Volume Sentiment: Buyers, 10:1) price levels, with resistance at the $421.72 (Volume Sentiment: Buyers, 2.17:1), $426.34 (10-Day Moving Average, Volume Sentiment: Sellers, 3:1), $428.40 (Volume Sentiment: Buyers, 5:1) & $431.69/share (Volume Sentiment: Buyers, 5:1) price levels.
DIA ETF’s Price Level:Volume Sentiment Over The Past 3-4 Years
The Week Ahead
Monday the week begins with the Monthly U.S. Federal Budget at 2 pm & KB Homes reports earnings after the session’s close.
NFIB Optimism Index data is released Tuesday at 6 am, followed by Producer Price Index, Core PPI, PPI Year-over-Year & Core PPI Year-over-Year data at 8:30 am, Fed President Schmid speaking at 10 am & the Fed Beige Book at 2pm.
Tuesday morning features earnings from Progressive, followed by Applied Digital Corp. & Calavo Growers after the closing bell.
Wednesday begins with Consumer Price Index, CPI Year-over-Year, Core CPI, Core CPI Year-over-Year, Empire State Manufacturing Survey & Philadelphia Fed Manufacturing Survey data at 8:30 am, followed by Home Builder Confidence Index & Business Inventories data at 10 am.
JP Morgan Chase, BlackRock, BNY Mellon, Citigroup, Goldman Sachs & Wells Fargo report earnings before Wednesday’s opening bell, with Concentrix, H.B. Fuller, Home Bancshares & Synovus reporting after the session’s close.
Initial Jobless Claims, U.S. Retail Sales, Retail Sales minus Autos, Import Price Index & Import Price Index minus Fuel data are all scheduled for 8:30 am on Thursday.
Thursday morning starts off with UnitedHealth Group, Bank of America, First Horizon, Insteel Industries, M&T Bank, Morgan Stanley, PNC Financial Services Group, & U.S. Bancorp reporting earnings, followed by Bank OZK & J.B. Hunt Transportation Services after the closing bell.
Friday the week winds down with Housing Starts & Building Permits data at 8:30 am, followed by Industrial Production & Capacity Utilization data at 9:15 am.
SLB reports earnings Friday morning, as well as Citizens Financial Group, Fastenal, Huntington Banc, Regions Financial, State Street, Truist Financial & Webster Financial.
See you back here next week!
*** I DO NOT OWN SHARES OR OPTIONS CONTRACT POSITIONS IN SPY, QQQ, IWM OR DIA AT THE TIME OF PUBLISHING THIS ARTICLE ***
The VIX closed at 17.7, indicating an implied one day move of +/-1.12% & an implied one month move of +/-5.12% for the S&P 500.
Highest Technical Rated S&P 500 Components Per 1/8/2025’s Close:
1 – UAL
2 – PLTR
3 – TSLA
4 – VST
5 – TPR
6 – AVGO
7 – TPL
8 – AXON
9 – EQT
10 – ANET
Lowest Technical Rated S&P 500 Components Per 1/8/2025’s Close:
1 – CE
2 – MRNA
3 – SMCI
4 – DG
5 – MCHP
6 – AES
7 – ENPH
8 – NUE
9 – INTC
10 – LW
Highest Volume Rated S&P 500 Components Per 1/8/2025’s Close:
1 – EIX
2 – EBAY
3 – SOLV
4 – CEG
5 – ON
6 – PANW
7 – BSX
8 – PCG
9 – ANSS
10 – SO
Lowest Volume Rated S&P 500 Components Per 1/8/2025’s Close:
1 – SMCI
2 – BA
3 – MPWR
4 – HUM
5 – LULU
6 – STE
7 – LVS
8 – MOH
9 – CI
10 – AVGO
Highest Technical Rated ETFs Per 1/8/2025’s Close:
1 – TSLR
2 – TSLT
3 – TSLL
4 – TSL
5 – BITW
6 – GXLM
7 – EVAV
8 – WEBL
9 – BZQ
10 – BTFX
Lowest Technical Rated ETFs Per 1/8/2025’s Close:
1 – MSOX
2 – TSLZ
3 – TSDD
4 – TSLQ
5 – CNBS
6 – SARK
7 – MRNY
8 – NVD
9 – MSOS
10 – BTOP
Highest Volume Rated ETFs Per 1/8/2025’s Close:
1 – HAPY
2 – BHYB
3 – TBFG
4 – CDEI
5 – WOOD
6 – CCOR
7 – CVSE
8 – SPVU
9 – HAPI
10 – LOPP
Lowest Volume Rated ETFs Per 1/8/2025’s Close:
1 – USCA
2 – MCSE
3 – AUGT
4 – SEPW
5 – MDCP
6 – WBND
7 – XFEB
8 – AUGW
9 – XAPR
10 – ITEQ
Highest Technical Rated General Stocks Per 1/8/2025’s Close:
1 – QNCCF
2 – NITO
3 – OPTT
4 – FUBO
5 – LAES
6 – CTM
7 – KULR
8 – LEEEF
9 – RGTI
10 – CAPC
Lowest Technical Rated General Stocks Per 1/8/2025’s Close:
1 – RAASY
2 – RNWEY
3 – GCTK
4 – AEON
5 – EFSH
6 – MULN
7 – DNMR
8 – GOEV
9 – ADD
10 – GTI
Highest Volume Rated General Stocks Per 1/8/2025’s Close:
1 – TWO
2 – CURR
3 – SILO
4 – OUT
5 – EONR
6 – XHG
7 – GCTK
8 – SANA
9 – CHNR
10 – GURE
Lowest Volume Rated General Stocks Per 1/8/2025’s Close:
1 – GENGF
2 – CIAFF
3 – SENR
4 – IEGCF
5 – DXYN
6 – EQMEF
7 – BCEKF
8 – MTBLY
9 – BRWXF
10 – AZREF
*** THE LIST ABOVE IS STRICTLY FOR INFORMATIONAL PURPOSES – I MAY OR MAY NOT HAVE OR INITIATE A LONG, SHORT, OR LONG/SHORT POSITION IN ANY NAME ABOVE AT ANY TIME ***
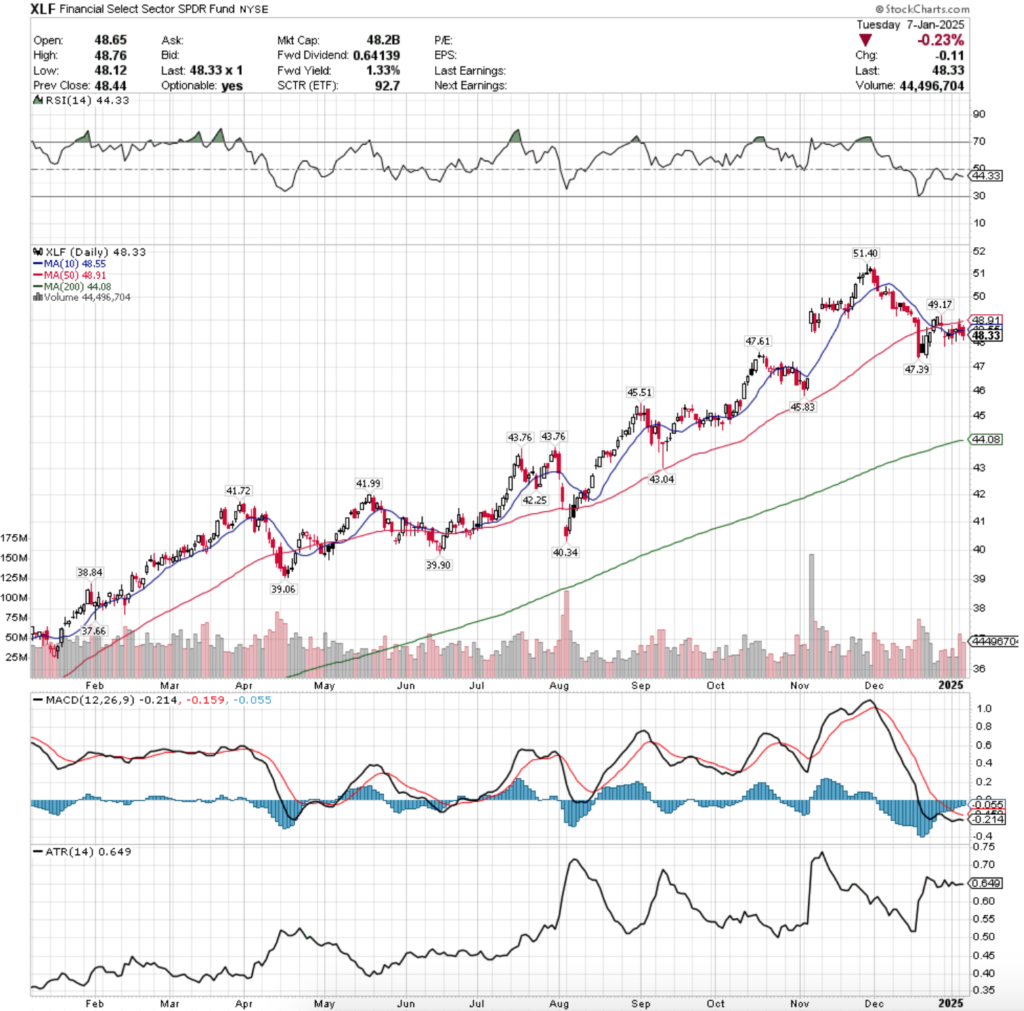
XLF, the Financial Select Sector SPDR Fund ETF has had a solid year, gaining +27.24% over the past year & +30.83% since their 52-week low in January of 2024, while sitting -6.35% below their 52-week high set in November of 2024 (all figures ex-distributions).
This is attributed to the strong performance among the financial sector over the past year, as banks for the most part have had a great year up until the past month.
Some of their biggest holdings include Berkshire Hathaway Inc CL B (BRK/B), JP Morgan Chase & Co. (JPM), Visa Inc Class A Shares (V), Mastercard Inc Class A (MA), Bank of America Corp. (BAC), Wells Fargo & Co. (WFC), Goldman Sachs Group Inc. (GS), American Express Co (AMEX), Morgan Stanley (MS) & S&P Global Inc. (SPGI).
Since early December there has been a bit of weakness showing in the financial sector, and with earnings season kicking off next week for many of the banks it is worth examining how market participants have behaved previously at different price levels.
This can be beneficial for understanding & assessing the strength of support/resistance levels that may be tested in the coming weeks as these companies begin to report earnings, as well as for when other companies across other sectors report as well.
Below is a brief technical analysis of XLF, as well as a price level:volume sentiment analysis of the price levels XLF has traded at over the ~16 years.
Included in this data is also their recent support & resistance levels so that readers can gain insight into how strong/weak these support/resistance levels may be in the future, based on past investor behavior.
It is not intended to serve as financial advice, but rather as an additional tool to reference while performing your own due diligence on XLF.
XLF, The Financial Select Sector SPDR Fund ETF’s Technical Performance Broken Down
XLF ETF – Financial Select Sector SPDR Fund ETF’s Technical Performance Over The Past Year
The RSI is trending lower just below the neutral 50 mark & sits currently at 44.33, while their MACD is bearish, but has flattened out & is moving towards the signal line with its histogram waning after their past week & a half’s consolidation.
Volumes over the past week & a half have been -8.83% lower than the previous year’s average level (37,200,000 vs. 40,804,007.94), which reflects caution given that they’ve been consolidating & that the past nine months have seen much lower volumes than the previous years’ average levels.
Another area to note about their recent volumes is that the declining volumes have been eclipsing the advancing volumes, as it appears that the bulls are either becoming exhausted or have been collecting their profits in the wake of the post-election gap up from early November that greatly benefitted XLF.
Last Monday XLF resembled the major four indexes (SPY, QQQ, IWM & DIA), as the week kicked off on a gap down below the support of the 10 day moving average & the session resulted in a high wave doji, setting the stage for the consolidation range that they’ve traded in since.
XLF was unable to break above the resistance of the 10 DMA & showed that market participants had the appetite to send it below $48/share briefly after the week prior’s brief rally higher.
Tuesday opened on a gap up to be in-line with the 10 DMA & was able to briefly break out above it, but the rest of the session resulted in tested lower, including to below the open/close of Monday’s session before ultimately closing above it, but below their opening price, indicating more bearish sentiment.
Thursday confirmed this, as the session opened higher above the 10 DMA & made a run at the 50 day moving average’s resistance, but came up short & wound up retreating down to below the $48/share level before settling just below the resistance of the 10 day moving average, forming a bearish engulfing candle pattern with Tuesday’s session.
The weak sentiment continued on Friday, when despite an advancing session there was bearish flags thrown all around, starting with the low volume of the day.
Additionally, while the session opened above the 10 DMA’s support, it drifted below it towards the $48/share price level, before rallying higher to close above its open, but in the process forming a hanging man candle (bearish).
Monday opened with a glimmer of hope on a gap up to just below the 50 DMA’s resistance, briefly broke above it, before the bears came back into control & forced prices back to close below the 10 DMA’s support & based on the small lower shadow & highest daily volume of the prior two (short) weeks showed that there was still a lot of uncertainty & hesitancy in the air.
Tuesday that narrative continued, when on slightly lower than Monday’s volume XLF opened midway between Monday’s range & broke down through the 10 DMA’s support to close lower, with their lower shadow showing that market participants were still eyeing that $48/share price level.
For the rest of this week & into next week market participants should have their eye on how XLF’s price behaves within the consolidation range that’s been set by the 50 DMA, $48/share price level & the 10 DMA which is oscillating around in between the two marks.
Prices have spent all of 2025 & the last two sessions of 2024 straddling the 10 DMA, while attempting to break out one way or the other from the 50 DMA to the upside & the $48 mark on the downside.
So far there seems to be more appetite for the downside breakout, but Monday’s session breaking the 50 DMA’s resistance briefly offers a glimmer of hope for investors hoping to see XLF break out to the upside.
The $48/share price level has been relatively even split between Buyers & Sellers, coming in at 1:1, while a breakout above the 50 DMA would place XLF into another Even price level, where Buyers & Sellers have met at a ratio of 1:1.
Should the $48 mark break down the $47-47.99 zone has been Buyer dominated at a rate of 0.2:0*, indicating that there has not been much downside testing compared to advancing volume & that it may be due for a test from the bears.
It is likely that barring any extreme news that the price will continue along in the manner mentioned above for the next week or so until we begin to see earnings reports for the financial companies, which will be where all eyes are watching on 1/15 & 1/16/2025.
Given that this recent consolidation looks set to continue before breaking out in either direction, it is imperative to understand how investors have behaved at the different price levels XLF has historically traded at in order to get a sense of how they may behave again.
The section below lays out how the buyers & sellers have met at each price level XLF has traded at over the past ~16 years.
While it is not indicative of future performance, history repeats itself & or rhymes & this can be used as a barometer to anticipate how market participants may behave when faced with these price levels again.
Price Level:Volume Sentiment Analysis For XLF, The Financial Select Sector SPDR Fund ETF
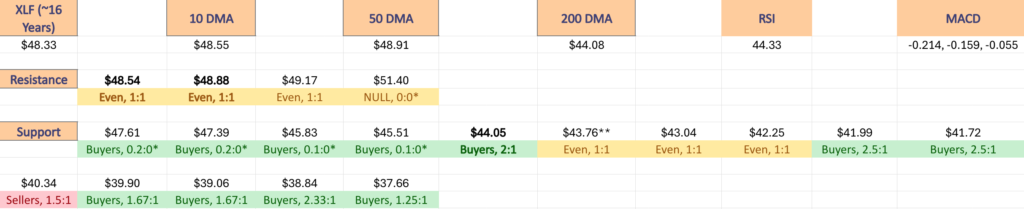
The top table below shows the support & resistance levels of XLF from the past year’s chart, as well as their price level:volume sentiment at each from data covering the past ~16 years, using Tuesday 1/7/2025’s closing data for their price & moving averages/other technicals.
The moving averages are denoted with bold.
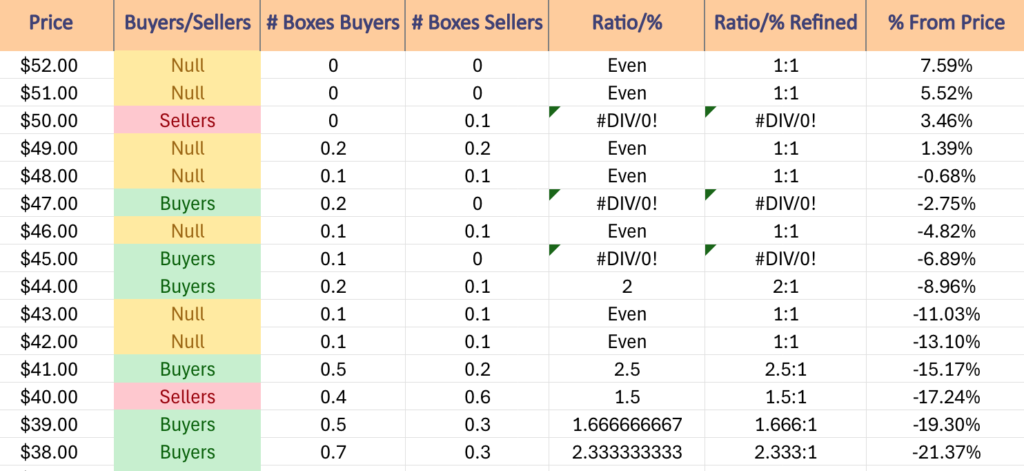
The next charts show the volume sentiment at each individual price level XLF has traded at over the past ~16 years.
Beneath them is a copy & pasteable list of the same data, where the support/resistance levels are denoted in bold.
All ratios with “0” in the denominator are denoted with a “*”.
NULL values are price levels that had limited trading volume, whether it be due to gaps, quick advances or they are at price extremes; in the event that they are retested & there is more data they would have a distinct “Buyers”, “Sellers” or “Even” title.
This is not intended as financial advice, but rather another tool to consider when performing your own research & due diligence on XLF.
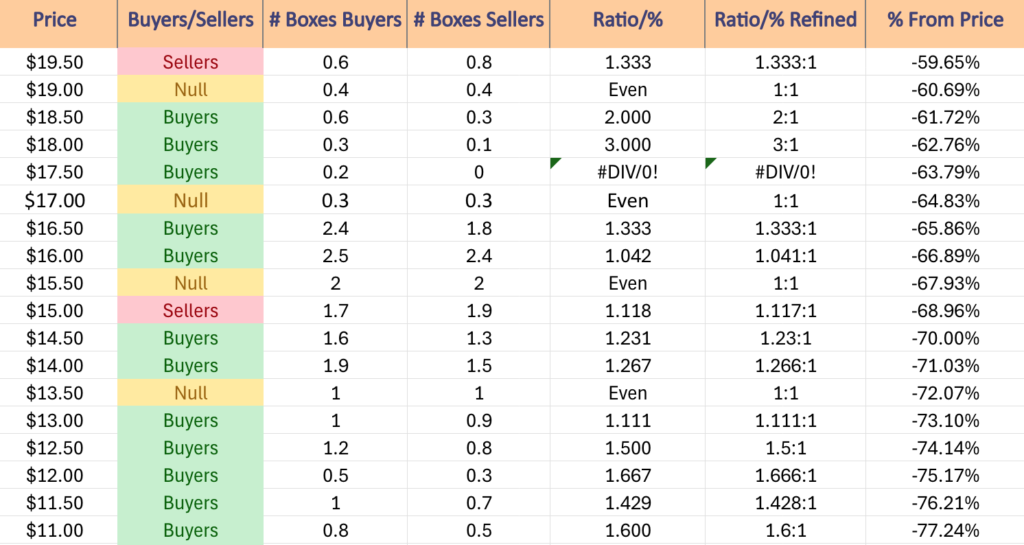
XLF ETF’s Price Level:Volume Sentiment Over The Past ~16 Years At Their Past Year’s Support/Resistance Levels
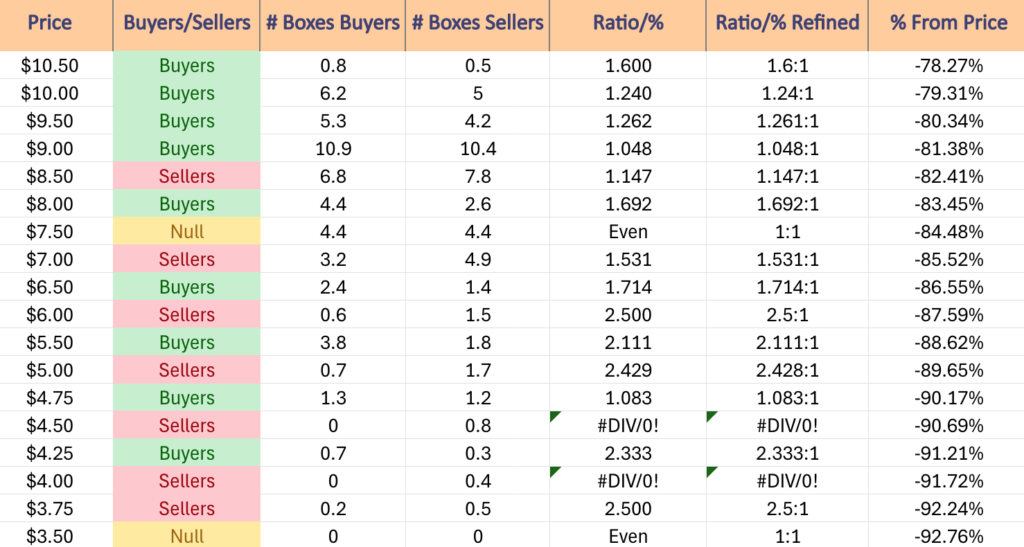
XLF ETF’s Price Level:Volume Sentiment Over The Past ~16 Years
Price Level:Volume Sentiment For XLF ETF Over The Past ~16 Years
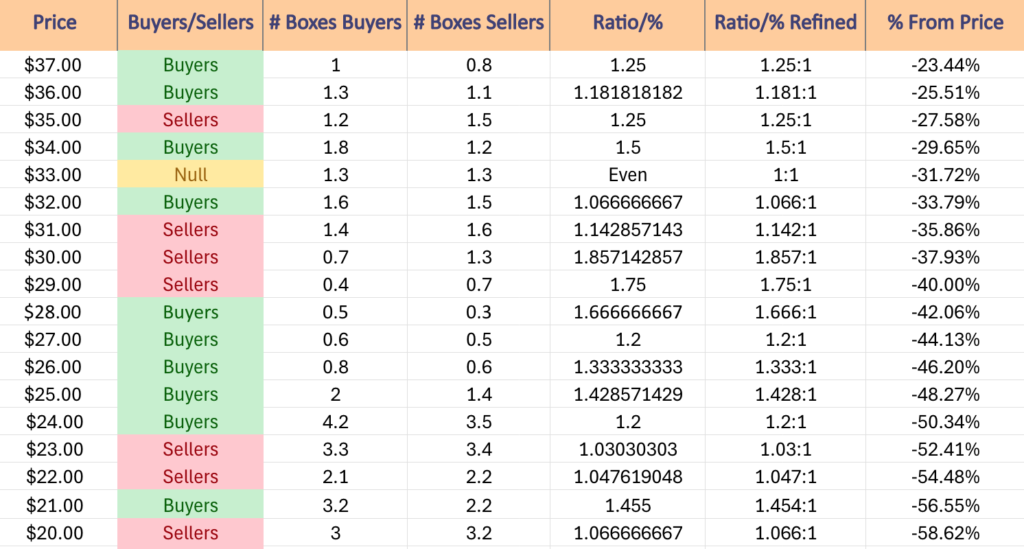
Price Level:Volume Sentiment For XLF ETF Over The Past ~16 Years
XLF ETF’s Price Level:Volume Sentiment Over The Past ~16 Years
$52 – NULL – 0:0*, +7.59% From Current Price Level
$51 – NULL – 0:0*, +5.52% From Current Price Level
$50 – Sellers – 0.1:0*, +3.46% From Current Price Level
$49 – Even – 1:1, +1.39% From Current Price Level
$48 – Even – 1:1, -0.68% From Current Price Level – Current Price Level, 10 & 50 Day Moving Averages***
$47 – Buyers – 0.2:0*, -2.75% From Current Price Level
$46 – Even – 1:1, -4.82% From Current Price Level
$45 – Buyers – 01.:0*, -6.89% From Current Price Level
$44 – Buyers – 2:1, -8.96% From Current Price Level – 200 Day Moving Average*
$43 – Even – 1:1, -11.03% From Current Price Level
$42 – Even – 1:1, -13.1% From Current Price Level
$41 – Buyers – 2.5:1, -15.17% From Current Price Level
$40 – Sellers 1.5:1, -17.24% From Current Price Level
$39 – Buyers- 1.67:1, -19.3% From Current Price Level
$38 – Buyers – 2.33:1, -21.37% From Current Price Level
$37 – Buyers – 1.25:1, -23.44% From Current Price Level
$36 – Buyers – 1.18:1, -25.51% From Current Price Level
$35 – Sellers – 1.25:1, -27.58% From Current Price Level
$34 – Buyers – 1.5:1, -29.65% From Current Price Level
$33 – Even – 1:1, -31.72% From Current Price Level
$32 – Buyers – 1.07:1, -33.79% From Current Price Level
$31 – Sellers – 1.14:1, -35.86% From Current Price Level
$30 – Sellers – 1.86:1, -37.93% From Current Price Level
$29 – Sellers – 1.75:1, -40% From Current Price Level
$28 – Buyers – 1.67:1, -42.06% From Current Price Level
$27 – Buyers – 1.2:1, -44.13% From Current Price Level
$26 – Buyers – 1.33:1, -46.2% From Current Price Level
$25 – Buyers – 1.43:1, -48.27% From Current Price Level
$24 – Buyers – 1.2:1, -50.34% From Current Price Level
$23 – Sellers – 1.03:1, -52.41% From Current Price Level
$22 – Sellers – 1.05:1, -54.48% From Current Price Level
$21 – Buyers – 1.45:1, -56.55% From Current Price Level
$20 – Sellers – 1.07:1, -58.62% From Current Price Level
$19.50 – Sellers – 1.33:1, -59.65% From Current Price Level
$19 – Even – 1:1, -60.69% From Current Price Level
$18.50 – Buyers – 2:1, -61.72% From Current Price Level
$18 – Buyers – 3:1, -62.76% From Current Price Level
$17.50 – Buyers – 02:0*, -63.79% From Current Price Level
$17 – Even – 1:1, -64.83% From Current Price Level
$16.50 – Buyers – 1.33:1, -65.86% From Current Price Level
$16 – Buyers – 1.04:1, -66.89% From Current Price Level
$15.50 – Even – 1:1, -67.93% From Current Price Level
$15 – Sellers – 1.12:1, -68.96% From Current Price Level
$14.50 – Buyers – 1.23:1, -70% From Current Price Level
$14 – Buyers – 1.27:1, -71.03% From Current Price Level
$13.50 – Even – 1:1, -72.07% From Current Price Level
$13 – Buyers – 1.11:1, -73.1% From Current Price Level
$12.50 – Buyers – 1.5:1, -74.14% From Current Price Level
$12 – Buyers – 1.67:1, -75.17% From Current Price Level
$11.50 -Buyers – 1.43:1, -76.21% From Current Price Level
$11 – Buyers – 1.6:1, -77.24% From Current Price Level
$10.50 – Buyers – 1.6:1, -78.27% From Current Price Level
$10 – Buyers – 1.24:1, -79.31% From Current Price Level
$9.50 – Buyers – 1.26:1, -80.34% From Current Price Level
$9 – Buyers – 1.05:1, -81.38% From Current Price Level
$8.50 – Sellers – 1.15:1, -82.41% From Current Price Level
$8 – Buyers – 1.69:1, -83.45% From Current Price Level
$7.50 – Even – 1:1, -84.48% From Current Price Level
$7 – Sellers – 1.53:1, -85.52% From Current Price Level
$6.50 – Buyers – 1.71:1, -86.55% From Current Price Level
$6 – Sellers – 2.5:1, -87.59% From Current Price Level
$5.50 – Buyers – 2.11:1, -88.62% From Current Price Level
$5 – Sellers – 2.43:1, -89.65% From Current Price Level
$4.75 – Buyers – 1.08:1, -90.17% From Current Price Level
$4.50 – Sellers – 0.8:0*, -90.69% From Current Price Level
$4.25 – Buyers – 2.33:1, -91.21% From Current Price Level
$4 – Sellers – 0.4:0*, -91.72% From Current Price Level
$3.75 – Sellers – 2.5:1, -92.24% From Current Price Level
$3.50 – NULL – 0:0*, -92.76% From Current Price Level
*** I DO NOT OWN SHARES OR OPTIONS CONTRACT POSITIONS IN XLF AT THE TIME OF PUBLISHING THIS ARTICLE ***