The VIX closed at 16.64, indicating an implied one day move range of +/-1.05% & an implied one month move range of +/-4.81% for the S&P 500.
Highest Technical Rated S&P 500 Components Per 9/23/2025’s Close:
1 – WDC
2 – STX
3 – WBD
4 – APP
5 – HOOD
6 – PSKY
7 – MU
8 – ORCL
9 – LRCX
10 – NEM
Lowest Technical Rated S&P 500 Components Per 9/23/2025’s Close:
1 – TTD
2 – FDS
3 – LULU
4 – IT
5 – ALGN
6 – STZ
7 – FI
8 – KVUE
9 – DOW
10 – ACN
Highest Volume Rated S&P 500 Components Per 9/23/2025’s Close:
1 – HAL
2 – KVUE
3 – DAY
4 – GNRC
5 – APD
6 – AZO
7 – CAH
8 – SRE
9 – SPGI
10 – FDS
Lowest Volume Rated S&P 500 Components Per 9/23/2025’s Close:
1 – FICO
2 – AOS
3 – WYNN
4 – IP
5 – EL
6 – DAL
7 – ALB
8 – CME
9 – NCLH
10 – SWK
Highest Technical Rated ETFs Per 9/23/2025’s Close:
1 – RGTU
2 – RGTX
3 – MUU
4 – OKLL
5 – MULL
6 – JNUG
7 – NUGT
8 – URAA
9 – WGMI
10 – IONL
Lowest Technical Rated ETFs Per 10/17/2025’s Close:
1 – JDST
2 – TSLZ
3 – TSDD
4 – TSLQ
5 – DUST
6 – ETQ
7 – ETHD
8 – SOXS
9 – UVIX
10 – HZEN
Highest Volume Rated ETFs Per 9/23/2025’s Close:
1 – TOTR
2 – XJAN
3 – QVMM
4 – HEQQ
5 – IBIJ
6 – QMAR
7 – NANR
8 – TRSY
9 – XOCT
10 – QSPT
Lowest Volume Rated ETFs Per 9/23/2025’s Close:
1 – KLMN
2 – EMCS
3 – IBMT
4 – SDFI
5 – USCA
6 – IHYF
7 – HTAX
8 – YFYA
9 – KCSH
10 – ASMF
Highest Technical Rated General Stocks Per 9/23/2025’s Close:
1 – QMMM
2 – FRBKQ
3 – ZPTA
4 – BETR
5 – ORBS
6 – SREMF
7 – BREA
8 – ONPH
9 – ZEPP
10 – HGRAF
Lowest Technical Rated General Stocks Per 9/23/2025’s Close:
1 – ZRFY
2 – WEJOF
3 – VSOLF
4 – TMPOQ
5 – TBPMQ
6 – SUNWQ
7 – SIRC
8 – SCLF
9 – RSHN
10 – RLBD
Highest Volume Rated General Stocks Per 9/23/2025’s Close:
1 – WHLR
2 – TWO
3 – DEA
4 – GLTO
5 – IBG
6 – JXG
7 – OUT
8 – FTEL
9 – ZSPC
10 – SLE
Lowest Volume Rated General Stocks Per 9/23/2025’s Close:
1 – BIOF
2 – RIINF
3 – WNLV
4 – SCPX
5 – PFHO
6 – BTSGU
7 – FMCB
8 – PLAG
9 – BDCO
10 – PREIF
*** THE LIST ABOVE IS STRICTLY FOR INFORMATIONAL PURPOSES – I MAY OR MAY NOT HAVE OR INITIATE A LONG, SHORT, OR LONG/SHORT POSITION IN ANY NAME ABOVE AT ANY TIME ***
The VIX closed at 16.1, indicating an implied one day move range of +/-1.01% & an implied one month move range of +/-4.65% for the S&P 500.
Highest Technical Rated S&P 500 Components Per 9/22/2025’s Close:
1 – WDC
2 – STX
3 – WBD
4 – APP
5 – ORCL
6 – HOOD
7 – MU
8 – LRCX
9 – PSKY
10 – NEM
Lowest Technical Rated S&P 500 Components Per 9/22/2025’s Close:
1 – TTD
2 – FDS
3 – LULU
4 – IT
5 – ALGN
6 – STZ
7 – KVUE
8 – FI
9 – KDP
10 – DOW
Highest Volume Rated S&P 500 Components Per 9/22/2025’s Close:
1 – DAY
2 – KVUE
3 – FDS
4 – DXCM
5 – ES
6 – WAB
7 – NI
8 – MTCH
9 – ORCL
10 – MET
Lowest Volume Rated S&P 500 Components Per 9/22/2025’s Close:
1 – UNH
2 – CME
3 – EL
4 – AES
5 – A
6 – RMD
7 – BDX
8 – STT
9 – TRV
10 – ALGN
Highest Technical Rated ETFs Per 9/22/2025’s Close:
1 – OKLL
2 – JNUG
3 – MUU
4 – NUGT
5 – MULL
6 – URAA
7 – WGMI
8 – RGTU
9 – RGTX
10 – KORU
Lowest Technical Rated ETFs Per 9/22/2025’s Close:
1 – TSLZ
2 – TSDD
3 – TSLQ
4 – JDST
5 – DUST
6 – ETQ
7 – ETHD
8 – SOXS
9 – UVIX
10 – CONI
Highest Volume Rated ETFs Per 9/22/2025’s Close:
1 – IWLG
2 – XBB
3 – LFBE
4 – TSME
5 – GSEE
6 – SQEW
7 – IHYF
8 – MGNR
9 – TMET
10 – JHHY
Lowest Volume Rated ETFs Per 9/22/2025’s Close:
1 – CSHP
2 – LSVD
3 – CCNR
4 – KFEB
5 – BBEM
6 – EMCS
7 – XBAP
8 – FHDG
9 – DSPY
10 – XJUL
Highest Technical Rated General Stocks Per 9/22/2025’s Close:
1 – FTCHQ
2 – QMMM
3 – ZPTA
4 – AMPE
5 – GMRE
6 – SREMF
7 – ORBS
8 – ZEPP
9 – SOGP
10 – BETR
Lowest Technical Rated General Stocks Per 9/22/2025’s Close:
1 – ICCT
2 – NXTT
3 – NAKA
4 – VCIG
5 – ORGS
6 – QH
7 – GRFXY
8 – ATYR
9 – OP
10 – PBLA
Highest Volume Rated General Stocks Per 9/22/2025’s Close:
1 – SLG
2 – AGRI
3 – BOXL
4 – OUT
5 – IPW
6 – ARBB
7 – QLGN
8 – FLGC
9 – BETR
10 – BTAX
Lowest Volume Rated General Stocks Per 9/22/2025’s Close:
1 – PSYTF
2 – BETRF
3 – IFNNF
4 – HGTXU
5 – BTSGU
6 – GECSF
7 – SBIG
8 – VXTRF
9 – VNPKF
10 – CBDBY
*** THE LIST ABOVE IS STRICTLY FOR INFORMATIONAL PURPOSES – I MAY OR MAY NOT HAVE OR INITIATE A LONG, SHORT, OR LONG/SHORT POSITION IN ANY NAME ABOVE AT ANY TIME ***
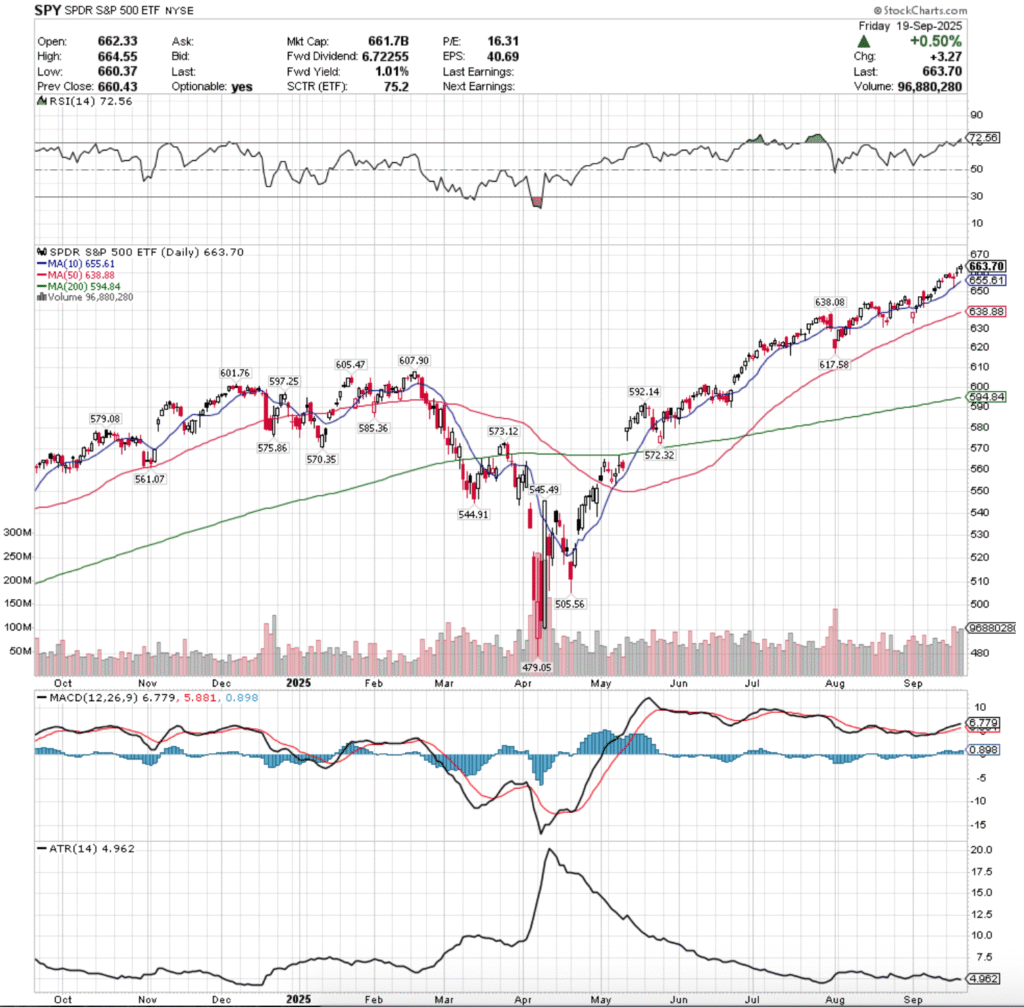
SPY, the SPDR S&P 500 ETF added +0.96% this week, while the VIX closed at 15.45, indicating an implied one day movement range of +/-0.97 % & an implied one month movement range of +/-4.47%.
SPY ETF – SPDR S&P 500 ETF’s Technical Performance Over The Past Year
Their RSI is in overbought territory, currently at 72.56, while their MACD is bullish, but has flattened towards the end of the week, indicating that the trend may be losing steam.
Volumes were +31.57% above the prior year’s average (83,060,000 vs. 63,130,000), which is something to keep in mind given that the highest volume session of the week came on Wednesday’s decline.
Monday the week began on a muted, but bullish note, as the week’s second lowest volume session resulted in a gap up that was never able to break above the $660/share level.
Tuesday also opened on a gap up, but was also unable to break above the $660/share level, resulting in a declining session on slightly lower volume than Monday’s.
Wednesday opened slightly higher than Tuesday, rallied higher, but was unable to get as high as either of the past two days & profit taking resulted in a decline that temporarily went down to test the strength of the 10 day moving average’s support, but recovered higher by the end of the day to close -0.12%.
The mix of profit taking & the rally to force the close higher & mitigate the day’s losses combined to form the strongest volume session of the week around the Federal Reserve’s FOMC rate decision, matching the uncertainty Chairman Powell echoed & putting extra importance on the litany of Fed speakers this week.
Thursday opened on a gap up at $660.06, broke higher to $663.05, with a low of $658.44, before settling +0.47% on the day as a gravestone doji candle, indicating that there was waning sentiment in the bull run.
Friday also opened on a gap higher, tested & found support down by the $660/share level, and rallied higher to close +0.5% higher day-over-day on the week’s second highest volume.
It should be noted that Friday’s candle is a hanging man, and while it came on a bullish session there may be some support at these price levels, the spinning top with the lower shadow indicates that sentiment is waning & folks are becoming indecisive.
Heading into the new week, the upside case continues to be that there will need to be higher, sustained advancing volume in order to continue to set new all-time highs (such as Friday).
This is especially true now that there are some cracks showing in sentiment.
The consolidation case focuses on the $660/share level & the 10 day moving average, with prices oscillating around the two as we await an upside or downside catalyst, which will be influenced by what we hear from all of the Fed speakers (list is in last section), PCE/Core PCE, & GDP data.
Given the wide range of views on the most recent dot plot, the speakers will likely be some of the stronger clues for this week, especially given Powell’s remarks about the .25 bps being a hedge against the unseen.
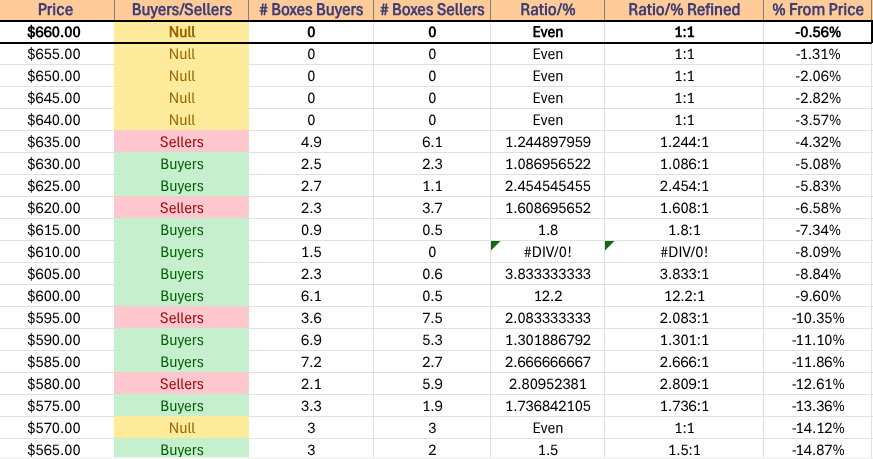
The downside case now puts the $638-638.99/share support zone in the spotlight, which if it holds up can create a new consolidation range for SPY to grow from in the future after it’s built up some support.
The tricky thing here is that the zone resides in a Seller dominated zone in terms of historic volume sentiment (1.25:1) from the past ~3 years, which increases the likelihood of a breakdown.
Should that happen the $617.58/share level becomes the next line of support, which opens up a new can of worms, as the late-June unfilled gap by $600/share comes within view, as does the 200 day moving average.
There are other support levels between them, but it will begin to be on folks’ radars.
The table below lists SPY’s historic volume sentiment by price level for the past ~3 years.
SPY has support at the $655.61 (10 Day Moving Average, Volume Sentiment: NULL, 0:0*), $638.88 (50 Day Moving Average, Volume Sentiment: Sellers, 1.25:1), $638.08 (Volume Sentiment: Sellers, 1.25:1) & $617.58/share (Volume Sentiment: Buyers, 1.8:1) price levels, with resistance at the $664.55/share (All-Time High, Volume Sentiment: NULL, 0:0*) price levels.
SPY ETF’s Price Level:Volume Sentiment Over The Past ~3 Years
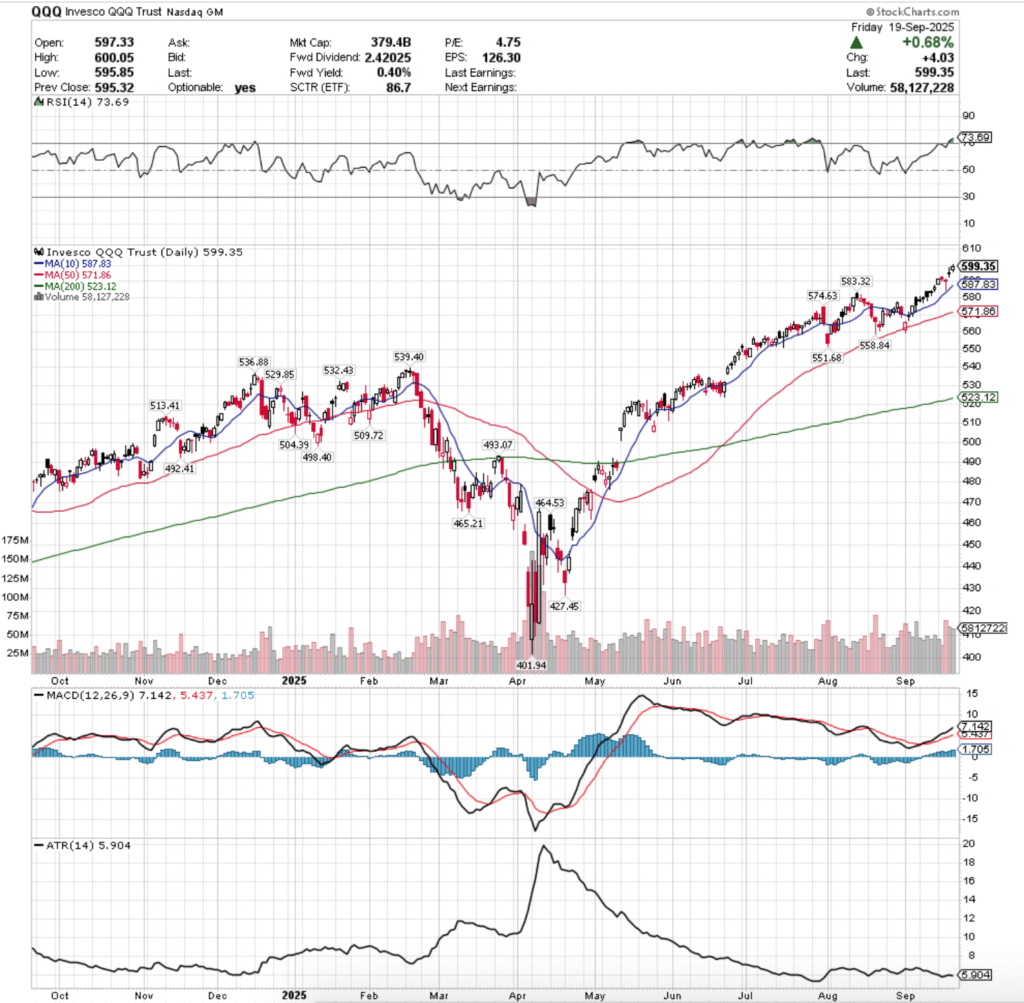
QQQ, the Invesco QQQ Trust ETF advanced +2.16% for the week, having the strongest weekly performance of the four major indexes.
QQQ ETF – Invesco QQQ Trust ETF’s Technical Performance Over The Past Year
Their RSI is in overbought territory, currently at 73.69, while their MACD is bullish.
Volumes were +32.04% higher than the prior year’s average (53,990,000 vs. 40,888,446), which based on Friday’s performance signals that there is some hesitency for QQQ components compared to SPY’s performance.
Monday the week began on a gap up, bringing QQQ to above the $590/share level on the second lowest volume of the week.
Tuesday opened on another gap higher, but enthusiasm fell, as did QQQ on the week’s lowest volume.
Wednesday opened on a gap lower, tested higher, before giving out to go test the support of the 10 day moving average, but managing to recover -0.2% down for the day on the week’s highest volume.
Again, much like SPY the profit taking pre-FOMC announcement & the subsequent rally after its conclusion created said volume, indicating that there is a lot of uncertainty among market participants.
Thursday this uncertainty began to show, as a gap up open tested higher to the $597.45/share level, but retreated throughout the day & closed as a tight spinning top that closed below its opening price.
The indecision signaled there shows that caution has entered the market for QQQ & its components.
Friday opened again on another gap up, temporarily crossed $600/share, but closed +0.68% higher on the day at $599.35/share.
As we move forward, recall that in weeks’ prior notes it has been mentioned that QQQ is currently leading SPY, making it important to watch the moves of both, which adds more importance to the volume heading into the weekend trend.
SPY’s advanced heading into the weekend, while QQQ’s Friday volume did not reflect the same enthusiasm as Thursday’s volume level, which may be market participants growing weary at such high levels.
Heading into the new week the upside case continues to be the same as before for months & in SPY’s, new all-time highs will continue but they’ll need sustainable advancing volume behind them to continue driving higher.
The upside level of $600/share will be of importance though, as to carry higher it must be broken through & in the case of consolidation it will also be a point to watch.
In the consolidation case, QQQ is likely to oscillate between the $600/share level & the 10 day moving average ($587.83) while awaiting the next major upside/downside news catalyst.
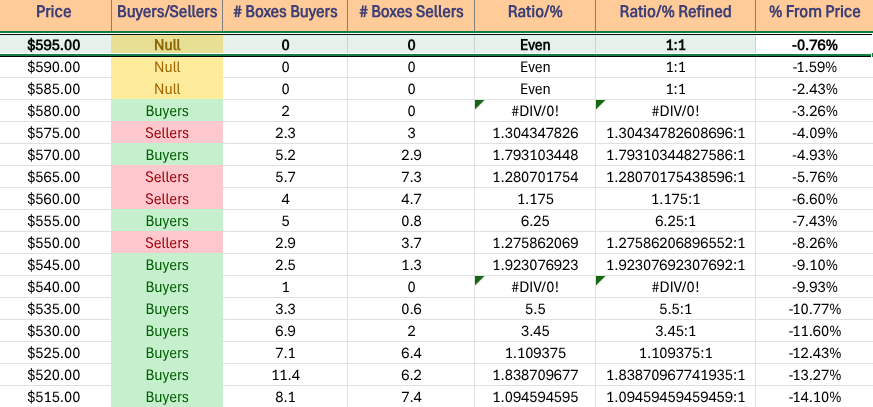
The downside case for QQQ is important to watch, with the strength of the 10 DMA’s support being the first major test.
This price zone has limited volume sentiment data available at the moment, so the approach to the 10 DMA will be interesting to lend clues into whether or not there is untold Buyer sentiment, or if the Sellers are out waiting to take profits & run.
Should it break down, the 50 DMA comes into play, as does eyes on the unfilled gap from early September, especially given that there is elevated Seller entiment all around it, Per the table below.
QQQ has support at the $587.83 (10 Day Moving Average, Volume Sentiment: NULL, 0:0*), $583.32 (Volume Sentiment: Buyers, 2:0*), $574.63 (Volume Sentiment: Buyers, 1.79:1) & $571.86/share (50 Day Moving Average, Volume Sentiment: Buyers, 1.79:1) price levels, with resistance at the $600.05/share (All-Time High, Volume Sentiment: NULL, 0:0*) price levels.
QQQ ETF – Invesco QQQ Trust ETF’s Price Level:Volume Sentiment Over The Past ~1 Year
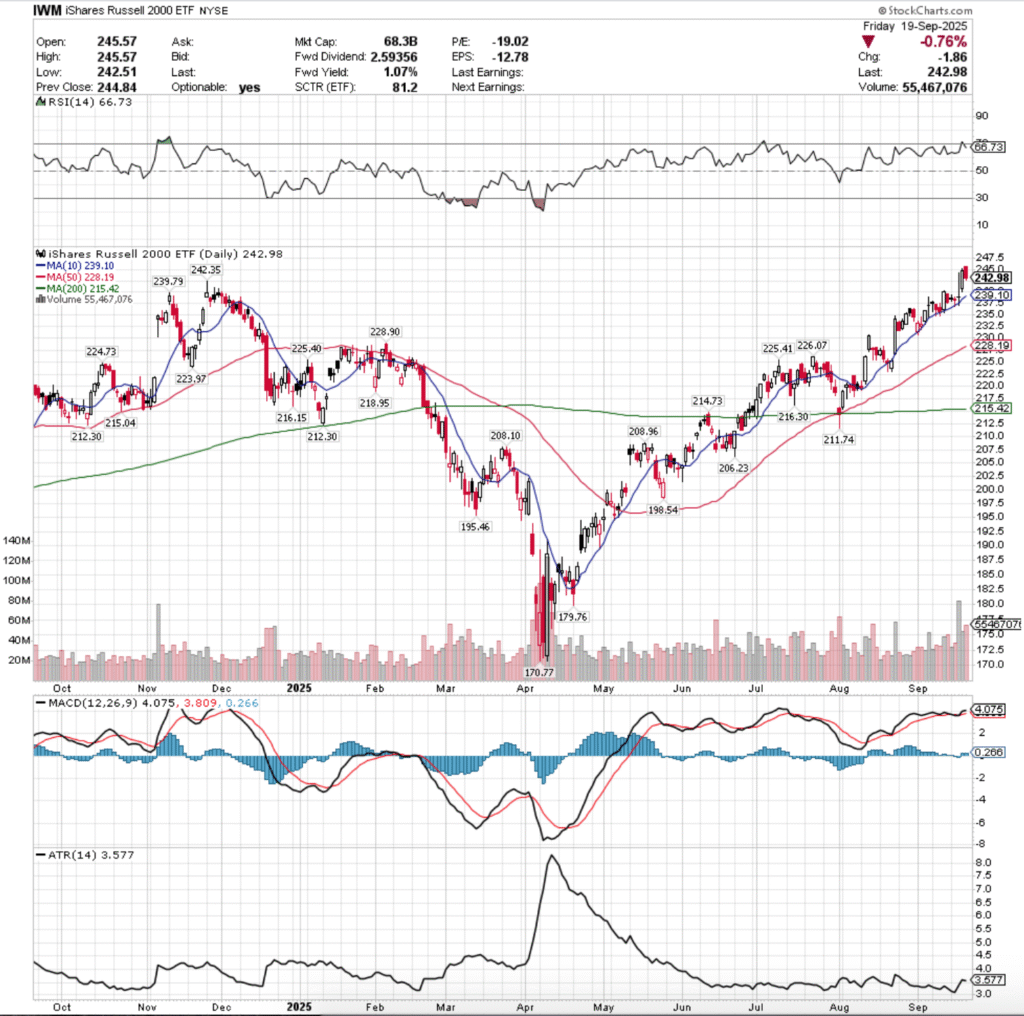
IWM ETF – iShares Russell 2000 ETF’s Technical Performance Over The Past Year
Their RSI is coming back from overbought levels following Friday’s session & is at 66.73, while their MACD is bullish, but flat following Thursday & Friday’s sessions.
Volumes were +62.75% higher than the prior year’s average (51,058,000 vs. 31,372,430), which paints a mixed picture in terms of broader sentiment, particularly given that IWM just reached a new all-time high.
Monday IWM kicked off higher, but resulted in a thin spinning top candle on the week’s thinnest volume, which did not inspire confidence & showed that market participants felt uneasy.
Tuesday opened lower, tested down to the support of the 10 day moving average, before rallying higher but still closing the day down -0.16%.
Wednesday opened on a gap higher & had quite the intraday whipesaw, testing as low as $272.02 & the 10 DMA’s support & as high as $244.28, before settling only +0.26% for the day.
An argument an be made that Wednesday’s highest volume of the week due to intraday pumps & profit taking is a gravestone doji, which carries negative bearish sentiment into the new week, which will be an area of focus.
Thursday opened on a gap higher & managed to push beyond the high of Wednesday as there was strong short-term euphoria pulling IWM higher on the week’s third highest volume.
Friday though is where things began to unwind, as after a gap up open, profit taking took over & IWM slumped -0.76% on the second highest volume of the week, which is not an indicator of near-term confidence.
The upside case for IWM continues as it’s been, particularly as they’re at all-time highs, they’ll keep following the larger indexes higher at a subdued pace, as the risks associated with small cap names are not considered advantegeous to larger caps in this current rate environment.
The consolidation case focuses on the range between the all-time high & the 10 day moving average, with oscillations occurring between them establishing a base that could provide additional support higher in the event of an upside catalyst.
The downside case becomes interesting, as the appetite is clearly there & IWM’s spent much of the past two months & beyond straddling the 10 day moving average.
When that breaks down, the 50 day moving average & the $228.90/share level will become important areas of interest.
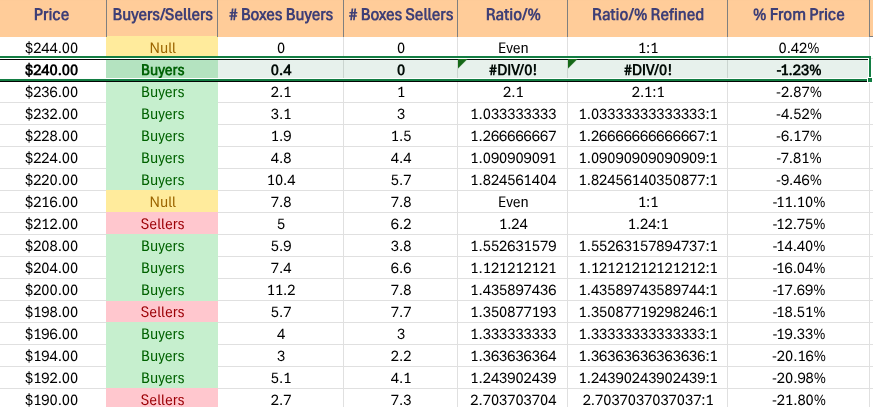
Much of their historic sentiment from the past ~2-3 years has been Buyer orienteuntil their $219.99/share level, which brings questions of how strong those levels above & the $223.97-226.07/share support zone will be, as we may see their ratios dilute with increased Seller Senitment, forcing a breakdown, or at best a consolidation range similar to the support levels mentioned.
IWM has support at the $242.35 (Volume Sentiment: Buyers, 0.4:0*), $239.79 (Volume Sentiment: Buyers, 2.1:1), $239.10 (10 Day Moving Average, Volume Sentiment: Buyers, 2.1:1) & $228.90/share (Volume Sentiment: Buyers 1.27:1) price levels, with resistance at the $245.57/share (All-Time High, Volume Sentiment: NULL, 0:0*) price levels.
IWM ETF – iShares Russell 2000 ETF’s Price Level:Volume Sentiment Over The Past ~2-3 Years
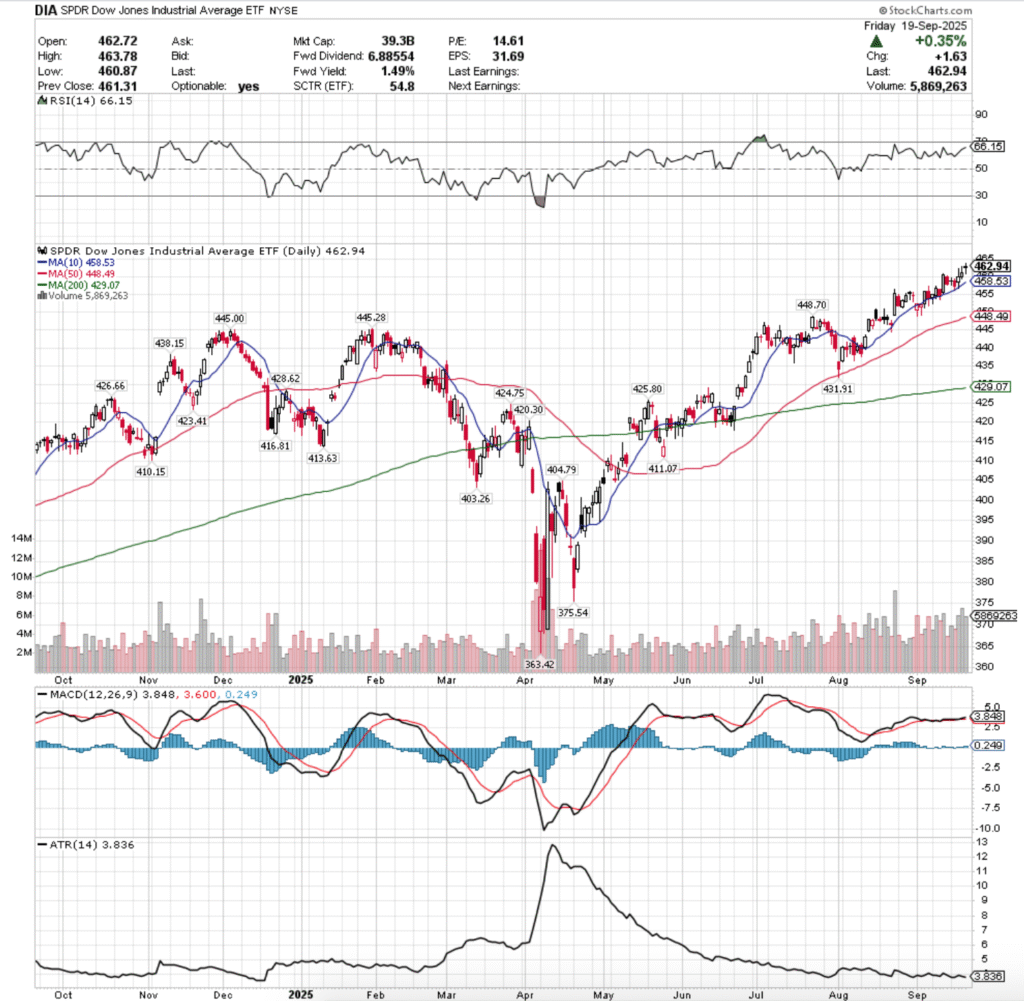
DIA ETF – SPDR Dow Jones Industrial Average ETF Over The Past Year
Their RSI is climbingtowards the overbought 70 mark & is currently at 66.15, while their MACD is bullish, but flat & its histpgram has been undulating for much of September, which indicates uncertainty.
Volumes were +63.38% higher than the prior year’s average (5,588,000 vs. 3,420,199), with much of it coming from the last three sessions of the week, which had the highest volumes.
Monday opened up DIA’s week with a bullish harami cross, but the day only resulted in +0.16% in returns, so hesitency was showing.
Tuesday’s candle resulted in a bearish engulfing candle, as profits taking took place the day before the FOMC announcement, and the 10 day moving average’s support was tested but prevailed.
Wednesday also saw a test of the 10 DMA, which held up & the day resulted in a high wave spinning top, showing that markets could move in any direction to a fair degree, but that folks were still buying after Powell’s Press Conference.
Thursday the highest volume session of the week opened higher, retraded in Wednesday’s range, before springing higher to $463.05/share, before profit takers stepped in forcing the price down to close at $461.31, +0.3% on the day.
The highest volume session having such a high upper shadow but the body concentration being towards the bottom of the candle showed that the bears have begun to step in more aggressively.
Friday the week wound down with a gap up open that retraced all the way down to into Thursday’s real body, but managed to close as a thin hanging man, indicating that the end of the line is likely near for DIA or at least a short-term breather as the bulls barely squeeked by with much beyond the gap in terms of day-over-day gains.
Heading into the new week, the upside case remains the same, more all-time highs will need sustained higher levels of advancing volume before markets lose steam.
The consolidation case focuses around DIA oscillating around its 10 day moving average until there’s an upside or downside catalyst.
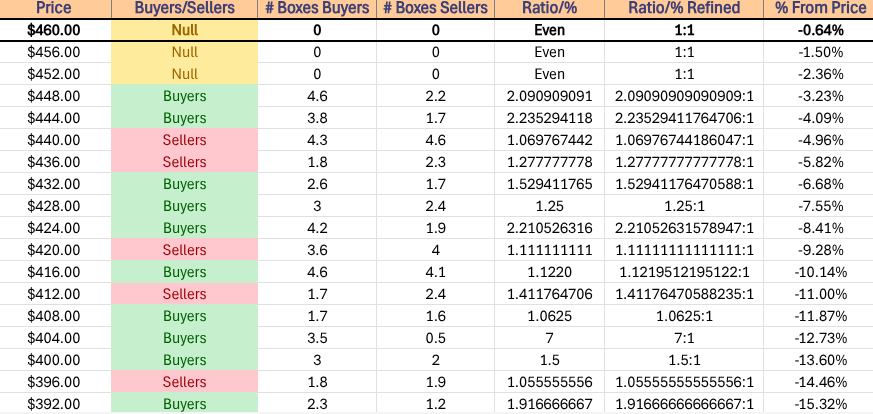
To the downside, once the 10 DMA breaks down, $448.49(50 DMA)-448.70 & $445-445.28 are key areas of support to watch, especially given that they are the gatekeepers to $443.99/share, which is when DIA enters back-to-back Seller dominated zones, as shown on the chart below.
Given that DIA tends to be more Buy & Hold type of names, a decline may be more forceful than anticipated if folks are liquidating long-held positions in favor of cash & safer assets than the blue chip index components.
DIA has support at the $458.53 (10 Day Moving Average, Volume Sentiment: NULL, 0:0*), $448.70 (Volume Sentiment: Buyers, 2.09:1), $448.49 (50 Day Moving Average, Volume Sentiment: Buyers, 2.09:1) & $445.28/share (Volume Sentiment: Buyers, 2.24:1) price levels, with resistance at the $463.78/share (All-Time High, Volume Sentiment: NULL, 0:0*) price levels.
DIA ETF’s Price Level:Volume Sentiment Over The Past ~3 Years
The Week Ahead
Monday the week begins with Fed President Williams speaking at 9:45 am, Fed President Musalem speaking at 10 am & Fed Governors Miran, Hammack & Barkin speaking at 12 pm, and there are no major earnings reports.
More Fed speakers are on deck for Tuesday, including a speach from Vice Chair of Supervision Bowman at 9 am, S&P Flash U.S. Services PMI & S&P Flash U.S. Manufacturing PMI data at 9:45 am & Fed Chair Powell speaking at 12:35 pm.
Tuesday morning begins with earnings from AutoZone, followed by AAR, Micron, MillerKnoll & Worthington Enterprises after the closing bell.
Wednesday brings us New Home Sales data at 10 am, followed by Fed President Daly speaking at 4:10 pm.
Fed President Goolsbee speaks at 8:20 am Thursday, before Initial Jobless Claims, GDP (third estimate), Advanced U.S. Trade Balance In Goods, Advanced Retail Inventories, Advanced Wholesale Inventories, Durable-Goods Orders & Durable-Goods minus Transportation data at 8:30 am; Fed President Williams speaks at 9 am, followed by Fed Vice Chair of Supervision Bowman speaking & Existing Home Sales data at 10 am, Fed Govrnor Barr speaking at 1 pm, Fed President Logan speaking at 1:40 pm & Fed President Daly speaking at 3:30 pm.
Thursday morning kicks off with earnings from Accenture, CarMax, Jabil & TD Synnex, before Costco Wholesale, BlackBerry & Concentrix report following the closing bell.
Friday the week rounds out with Person Income, Personal Spending, PCE Index, PCE (Year-over-Year), Core PCE Index & Core PCE (Year-over-Year) data at 8:30 am, followed by Fed President Barkin speaking at 9 am, Consumer Sentiment (final) data at 10 am & Fed Vice Chair for Supervision Bowman speaking at 1 pm & all is quiet on the earnings front heading into the weekend.
See you back here next week!
*** I DO NOT OWN SHARES OR OPTIONS CONTRACT POSITIONS IN SPY, QQQ, IWM OR DIA AT THE TIME OF PUBLISHING THIS ARTICLE ***
The VIX closed at 15.45, indicating an implied one day move range of +/-0.97% & an implied one month move range of +/-4.47% for the S&P 500.
Highest Technical Rated S&P 500 Components Per 9/20/2025’s Close:
1 -WBD
2 – STX
3 – WDC
4 – PSKY
5 – ORCL
6 – MU
7 – PLTR
8 – GLW
9 – LRCX
10 – NEM
Lowest Technical Rated S&P 500 Components Per 9/20/2025’s Close:
1 – TTD
2 – FDS
3 – LULU
4 – IT
5 – STZ
6 – ALGN
7 – MOH
8 – FI
9 – CHTR
10 – TPL
Highest Volume Rated S&P 500 Components Per 9/20/2025’s Close:
1 – MKTX
2 – CZR
3 – WELL
4 – ES
5 – SW
6 – DXCM
7 – LEN
8 – ENPH
9 – COR
10 – JKHY
Lowest Volume Rated S&P 500 Components Per 9/20/2025’s Close:
1 – UNH
2 – ALB
3 – NCLH
4 – SMCI
5 – TSLA
6 – MOS
7 – LII
8 – XYZ
9 – CARR
10 – AMD
Highest Technical Rated ETFs Per 9/20/2025’s Close:
1 – OKLL
2 – RGTX
3 – MUU
4 – RGTU
5 – MULL
6 – NUGT
7 – JNUG
8 – URAA
9 – WGMI
10 – PTIR
Lowest Technical Rated ETFs Per 10/17/2025’s Close:
1 – ETQ
2 – ETHD
3 – TSLZ
4 – TSDD
5 – TSLQ
6 – JDST
7 – DUST
8 – UVIX
9 – CONI
10 – SOXS
Highest Volume Rated ETFs Per 9/20/2025’s Close:
1 – LFBE
2 – GAEM
3 – BMVP
4 – GEME
5 – GSEP
6 – SHUS
7 – TSEP
8 – IBAT
9 – SRHQ
10 – ELD
Lowest Volume Rated ETFs Per 9/20/2025’s Close:
1 – LSVD
2 – CSHP
3 – DSPY
4 – KWT
5 – CARK
6 – HTAX
7 – ACLO
8 – ASMF
9 – JPY
10 – EMCS
Highest Technical Rated General Stocks Per 9/20/2025’s Close:
1 – QMMM
2 – SDCCQ
3 – SING
4 – ZPTA
5 – ORBS
6 – OPEN
7 – SOGP
8 – SREMF
9 – ZEPP
10 – TURB
Lowest Technical Rated General Stocks Per 9/20/2025’s Close:
1 – ORGS
2 – BINI
3 – ICCT
4 – NXTT
5 – ATYR
6 – NAKAh
7 – HWNID
8 – VCIG
9 – QH
10 – CLEUF
Highest Volume Rated General Stocks Per 9/20/2025’s Close:
1 – DEA
2 – CMND
3 – FATN
4 – OUT
5 – CLIR
6 – AGMH
7 – VRCA
8 – CJET
9 – ARBB
10 – GLBS
Lowest Volume Rated General Stocks Per 9/20/2025’s Close:
1 – OLNCF
2 – AGSS
3 – AURX
4 – IFABF
5 – ICCT
6 – VHIBF
7 – RDEXF
8 – CTXXF
9 – TSGZF
10 – GECSF
*** THE LIST ABOVE IS STRICTLY FOR INFORMATIONAL PURPOSES – I MAY OR MAY NOT HAVE OR INITIATE A LONG, SHORT, OR LONG/SHORT POSITION IN ANY NAME ABOVE AT ANY TIME ***
The VIX closed at 16.36, indicating an implied one day move of +/-1.03% & an implied one month move of +/-4.73% for the S&P 500.
Highest Technical Rated S&P 500 Components Per 9/16/2025’s Close:
1 – WDC
2 – WBD
3 – STX
4 – ORCL
5 – MU
6 – GLW
7 – AVGO
8 – PSKY
9 – NEM
10 – LRCX
Lowest Technical Rated S&P 500 Components Per 9/16/2025’s Close:
1 – TTD
2 – LULU
3 – IT
4 – ALGN
5 – SNPS
6 – STZ
7 – MOH
8 – CHTR
9 – FI
10 – CMG
Highest Volume Rated S&P 500 Components Per 9/16/2025’s Close:
1 – TKO
2 – BSX
3 – ORCL
4 – ROP
5 – WRB
6 – EMR
7 – HSY
8 – GLW
9 – STLD
10 – EQT
Lowest Volume Rated S&P 500 Components Per 9/16/2025’s Close:
1 – DAY
2 – BEN
3 – PLTR
4 – AOS
5 – FICO
6 – BDX
7 – ALB
8 – SMCI
9 – ROST
10 – AMD
Highest Technical Rated ETFs Per 9/16/2025’s Close:
1 – MUU
2 – MULL
3 – BABX
4 – JNUG
5 – AVL
6 – AVGX
7 – KORU
8 – NUGT
9 – WGMI
10 – GGLL
Lowest Technical Rated ETFs Per 10/17/2025’s Close:
1 – ETQ
2 – ETHD
3 – TSLZ
4 – TSDD
5 – TSLQ
6 – JDST
7 – DUST
8 – UVIX
9 – SOXS
10 – CONI
Highest Volume Rated ETFs Per 9/16/2025’s Close:
1 – EVUS
2 – GBXA
3 – USCL
4 – DMXF
5 – DVQQ
6 – BAI
7 – EFG
8 – EUSB
9 – INOV
10 – GLOW
Lowest Volume Rated ETFs Per 9/16/2025’s Close:
1 – SMRI
2 – BBEM
3 – MYMF
4 – PABD
5 – ZOCT
6 – WSML
7 – OCTU
8 – TLCI
9 – EET
10 – UNOV
Highest Technical Rated General Stocks Per 9/16/2025’s Close:
1 – QMMM
2 – TURB
3 – SREMF
4 – OPEN
5 – SOGP
6 – FORD
7 – ZEPP
8 – AEI
9 – CHEK
10 – NVFY
Lowest Technical Rated General Stocks Per 9/16/2025’s Close:
1 – BINI
2 – CJET
3 – NXTT
4 – HWNID
5 – RAYA
6 – PBLA
7 – SMX
8 – ATYR
9 – NAKA
10 – OP
Highest Volume Rated General Stocks Per 9/16/2025’s Close:
1 – WHLR
2 – TURB
3 – BOXL
4 – FGI
5 – TWO
6 – BREA
7 – TOPP
8 – APVO
9 – GORV
10 – CNFR
Lowest Volume Rated General Stocks Per 9/16/2025’s Close:
1 – AGSS
2 – CPNFF
3 – DBIN
4 – DRRSF
5 – MGPHF
6 – IFNNF
7 – GOMRF
8 – SEOVF
9 – ICMFF
10 – MOJO
*** THE LIST ABOVE IS STRICTLY FOR INFORMATIONAL PURPOSES – I MAY OR MAY NOT HAVE OR INITIATE A LONG, SHORT, OR LONG/SHORT POSITION IN ANY NAME ABOVE AT ANY TIME ***
The VIX closed at 15.69, indicating an implied one day move of +/-0.99% & an implied one month move of +/-4.53% for the S&P 500.
Highest Technical Rated S&P 500 Components Per 9/15/2025’s Close:
1 – WBD
2 – WDC
3 – STX
4 – PSKY
5 – ORCL
6 – MU
7 – AVGO
8 – GLW
9 – NEM
10 – GOOGL
Lowest Technical Rated S&P 500 Components Per 9/15/2025’s Close:
1 – TTD
2 – LULU
3 – IT
4 – SNPS
5 – ALGN
6 – STZ
7 – CMG
8 – MOH
9 – CHTR
10 – MRNA
Highest Volume Rated S&P 500 Components Per 9/15/2025’s Close:
1 – CTVA
2 – TKO
3 – FDS
4 – STX
5 – ORCL
6 – KDP
7 – IT
8 – MSCI
9 – NWS
10 – LYV
Lowest Volume Rated S&P 500 Components Per 9/15/2025’s Close:
1 – CSX
2 – LNT
3 – WMB
4 – PODD
5 – FICO
6 – CRL
7 – PSKY
8 – PPL
9 – ED
10 – DAY
Highest Technical Rated ETFs Per 9/15/2025’s Close:
1 – MUU
2 – JUNG
3 – MULL
4 – NUGT
5 – AVL
6 – AVGX
7 – GGLL
8 – BABX
9 – WGMI
10 – GOOX
Lowest Technical Rated ETFs Per 9/15/2025’s Close:
1 – ETHD
2 – ETQ
3 – TSLZ
4 – TSDD
5 – TSLQ
6 – JDST
7 – DUST
8 – UVIX
9 – CONI
10 – SOXS
Highest Volume Rated ETFs Per 9/15/2025’s Close:
1 – MAPP
2 – KMAY
3 – CXRN
4 – IMAR
5 – XNAV
6 – XBAP
7 – IWFG
8 – WEEL
9 – KFEB
10 – RFEU
Lowest Volume Rated ETFs Per 9/15/2025’s Close:
1 – PABU
2 – UJB
3 – USCA
4 – ACLO
5 – JANM
6 – SIXJ
7 – LVSD
8 – BBEM
9 – NUGO
10 – TLCI
Highest Technical Rated General Stocks Per 9/15/2025’s Close:
1 – QMMM
2 – SOGP
3 – OPEN
4 – FORD
5 – SEMRF
6 – ZEPP
7 – GDC
8 – NVFY
9 – CAPC
10 – ISTKF
Lowest Technical Rated General Stocks Per 9/15/2025’s Close:
1 – ORGS
2 – BINI
3 – CJET
4 – NXTT
5 – NAKA
6 – ATYR
7 – RAYA
8 – ZNB
9 – LGCL
10 – YYGH
Highest Volume Rated General Stocks Per 9/15/2025’s Close:
1 – IHT
2 – MTVA
3 – LRE
4 – MSN
5 – ONFO
6 – OUT
7 – NAOV
8 – HSDT
9 – RELI
10 – CHEK
Lowest Volume Rated General Stocks Per 9/15/2025’s Close:
1 – RIINF
2 – CNND
3 – TMGEF
4 – ICMFF
5 – PLSDF
6 – SENR
7 – CODQL
8 – ESMC
9 – HLTOY
10 – FUNI
*** THE LIST ABOVE IS STRICTLY FOR INFORMATIONAL PURPOSES – I MAY OR MAY NOT HAVE OR INITIATE A LONG, SHORT, OR LONG/SHORT POSITION IN ANY NAME ABOVE AT ANY TIME ***
SPY, the SPDR S&P 500 ETF gained +1.57% last week, while the VIX closed at 14.76, indicating an implied one day move range of +/-0.93% & a one month implied move range of +/-4.27%.
SPY ETF – SPDR S&P 500 ETF’s Technical Performance Over The Past Year
Their RSI has recently begun to downtrend from near overbought levels, currently sitting at 67.74, while their MACD is bullish, but waning & signaling that it may be a short-term signal cross & a “dolphin” situation.
Volumes were +12.07% higher than the previous year’s average levels (70,000,000 vs. 62,458,640), which helped SPY continue higher to set another all-time high on Friday.
Monday the week opened up on a note of cautious optimism following a big risk-off Friday session, forming a bullish harami star with Friday’s candle, on weak volume as market participants were still feeling skeptical.
Wednesday opened on a gap up with the highest volume of the week, accounting for much of the week’s gains, but it also flashed a warning signal as the session closed lower than it opened, an indication of unease & near-term profit taking.
Thursday also saw another gap up open & SPY continued to climb higher throughout the day, but Friday saw reality come creeping back into the marketplace.
Friday’s session produced the second highest volume of the week, and flashed warning signs as it formed a bearish harami cross with Thursday’s session’s candle & there was a clear risk-off sentiment & profits taken for SPY.
The session’s high was unable to breach the $660/share mark.
Heading into a new week the upside case continues on as it has for months now, in order to see continued new all-time highs there will need to be consistent, elevated advancing volume.
Last week’s volume levels were a step in the correct direction, but there will need to be continued higher levels in order to keep SPY marching higher.
The consolidation case is likely to see the $660/share level be significant mentally & price may be held up & range bound while the 10 day moving average catches up to price, before price oscillating around it awaiting the upside or downside catalyst (likely to be Wednesday, courtesy of the FOMC).
The downside case still hinges on the strength of support from the 50 day moving average, partcularly as it continues climbing higher & is approaching their second support levels ($639.85).
If those give out, all eyes go to $619.29/share & if that is unable to provide SPY with support then $609.59/share comes into play.
There is historic Buyer sentiment at that level (3.83:1 over the past ~3 years) which is helpful, but there are Seller zones to pass through on the way down that lead SPY to that support zone of $609.59-607.15.
The table below outlines SPY’s historic volume sentiment & can be used to assess the strength/weakness of support/resistance levels in retests.
SPY has support at the $649.18 (10 Day Moving Average, Volume Sentiment: NULL, 0:0*), $639.85 (Volume Sentiment: Sellers, 1.25:1), $636.82 (50 Day Moving Average, Volume Sentiment: Sellers, 1.25:1) & $619.29/share (Volume Sentiment: Buyers, 1.8:1) price levels, with resistance at the $659.11/share (All-Time High, Volume Sentiment: NULL, 0:0*) price levels.
SPY ETF’s Price Level:Volume Sentiment Over The Past ~3 Years
QQQ, the Invesco QQQ Trust ETF advanced +1.84% for the week, as the tech-heavy index was the favorite among the major four indexes.
QQQ ETF – Invesco QQQ Trust ETF’s Technical Performance Over The Past Year
Their RSI is trending towards overbought territory, currently sitting at 66.17, while their MACD is bullish.
Volumes were +16.26% higher than the prior year’s average (47,038,000 vs. 40,458,960), which was able to keep QQQ grinding higher, but the week still had elements of risk awareness.
Monday closed lower than it opened, forming a bearish harami with an upper shadow that showed that there was still a bit of upside sentiment in the air.
Tuesday opened on a gap up, but again closed lower than it opened as it seemed that profits were being taken quickly to mitigate risk near these all-time highs.
Wednesday also opened on a gap higher following Oracle’s earnings report Tuesday night, but quickly saw profits taken & the session also closed lower than it opened, only ganing +0.03% for the day.
This cautious outlook continued on into Thursday, as QQQ closed the day up +0.58% & the day closed as a dragonfly doji, indicating that there was potentially going to be more room to run higher.
Friday the week wound down on a gap up open, but indecision was abound & QQQ closed as a spinning top,shy of the $590/share mark.
Moving into the new week the upside case remains the same as it has been for months now, in order to continue hitting new all-time highs there will need to be increased & consistent advancing volume.
The consolidation case features QQQ oscillating around the 10 day moving average & between it & the 50 day moving average as that draws nearer while awaiting an upside/downside catalyst (also, likely to come Wednesday courtsey of the FOMC).
To the downside, historic volume sentiment (shown in the table below) has shown increased Seller pressure in the past year near these prices, which if the support of the 50 day moving average gives out would help guide prices down to re-test the $558.84 & $6551.68/share support levels.
While both of those reside in a Buyer zone (6.25:1 over the past year), should they fail QQQ enters another Seller zone (1.28:1), and will begin to look to close the window from the gap in late June.
QQQ has support at the $583.32 (Volume Sentiment: Buyers, 2:0*), $576.82 (10 Day Moving Average, Volume Sentiment: Sellers, 1.3:1), $574.63 (Volume Sentiment: Buyers, 1.79:1) & $567.96/share (50 Day Moving Average, Volume Sentiment: Sellers, 1.28:1) price levels, with resistance at the $587.86/share (All-Time High, Volume Sentiment: NULL, 0:0*) price levels.
QQQ ETF’s Price Level:Volume Sentiment Over The Past ~1 Year
IWM ETF – iShares Russell 2000 ETF’s Technical Performance Over The Past Year
Their RSI is trending back towards neutral, currently at 62.35, while their MACD is set to bearishly cross the signal line within the beginning of the week.
Volumes were +22.61% higher than the prior year’s average (38,106,000 vs. 31,078,080), which should raise eyebrows given that the highest volume session of the week was Friday’s declining sessions & two of the other sessions were also days of decline.
Monday the week opened on a gap higher & sparked optimism with a dragonfly doji candle, but it should be noted that this was the weakest move of the week by volume.
Tuesday opened on a gap lower, retested down the 10 day moving average’s support, but was able to hover above it heading into the close, as profits from the two prior sessions were yanked out of IWM.
Wednesday opened slightly higher & made a push higher, but ultimately crashed down to retest the 10 DMA’s support again, briefly breaking below it, before ultimately closing above it but down -0.18%.
Thursday opened in-line with the 10 day moving average, but was able to rally throughout the session to close +1.85% higher on the day, on the week’s second highest volume, which led to Friday’s highest volume of the week risk-off profit taking session that declined -1.02%.
As highlighted in prior weeks, the upside case for IWM echos that of SPY & IWM, except it also hinges upon the performance & enthusiasm behind the larger cap indexes, as with valuations as high as they are smaller cap names are less favored to their larger peers.
Their consolidation case looks set to osillate around the 10 day moving average while we await an upside/downside catalyst.
To the downside, IWM does have a good deal of support levels between $225.37-229.55, including the 50 day moving average at $226.95 (and climbing higher).
In the event that that support zone listed above breaks down, the $212.90/share level will be a key place to focus on, given there are two support points there in the past year & it is in a Seller oriented zone, historically, which may be cause for further concern.
IWM has support at the $236.78 (10 Day Moving Average, Volume Sentiment: Buyers, 2.1:1), $229.55 (Volume Sentiment: Buyers, 1.27:1), $226.95 (50 Day Moving Average, Volume Sentiment: Buyers, 1.09:1) & $226.71/share (Volume Sentiment: Buyers, 1.09:1) price levels, with resistance at the $240.47 (Volume Sentiment: Buyers, 0.4:0*), $240.93 (Volume Sentiment: Buyers, 0.4:0*) & $243.04/share (Volume Sentiment: Buyers, 0.4:0*) price levels.
IWM ETF’s Price Level:Volume Sentiment Over The Past ~2-3 Years
DIA ETF – SPDR Dow Jones Industrial Average ETF’s Technical Performance Over The Past Year
Their RSI is trending back towards the neutral 50-mark, sitting currently at 60.88, while their MACD is losing steam on the histogram, looking set to cross the signal line in the next few days.
Volumes were +53.31% higher than the prior year’s average (5,184,000 vs. 3,381,400), which should prove interesting as there were more advancing than declining sessions.
Monday the week opened up in line with the 10 day moving average, tested lower, but ultimately advanced +0.27% on the day.
Tuesday opened in a similar range, tested lower briefly before powering higher to close up +0.4% on particularly strong volume.
Wednesday opened lower, but profits were taken & the session drifted lower throughout the day, dipping below the support of the 10 DMA briefly, but closing in-line with it.
Thursday DIA delivered the best volume performance of the week & risk was back in fashion as DIA closed +1.31% for the day.
Friday is where things began to become more bleak & uncertainty had clearly begun to spread, as DIA opened lower & closed the day as a bearish harami pattern on the weakest volume of the week.
Heading into a new week that will be an important area to watch for the blue chip index.
The upside case for DIA remains as it has been & similar to SPY & QQQ, if there can be consistent advancing volume to support higher prices the blue chip buy & hold index can continue to roll higher.
In the event of complacency & consolidation, look for DIA to oscillate around the 10 day moving average &449.98/share price level while awaiting a catalyst to the upside/downside.
To the downside, the 50 day moving average is creeping higher towards the price, and will be important to watch in the coming week(s) as a support level that may become resistance, as it takes 5x longer to move than the 10 DMA & may signal extended periods of decline.
Should support break down & DIA drop into the $443.99-436/share range there is Seller pressure over the past ~3 years, as shown on the table below, which may force price down towards the long-term trendline.
DIA has support at the $456.64 (10 Day Moving Average, Volume Sentiment: NULL, 0:0*), $449.98 (Volume Sentiment: Buyers, 2.09:1), $448.09 (50 Day Moving Average, Volume Sentiment: Buyers, 2.09:1) & $446.55/share (Volume Sentiment: Buyers, 2.24:1) price levels, with resistance at the $462.32/share (Volume Sentiment: NULL, 0:0*) price levels.
DIA ETF’s Price Level:Volume Sentiment Over The Past ~3 Years
The Week Ahead
Monday the week kicks off with the Empire State Manufacturing Survey data at 8:30 am.
Hain Capital reports earnings Monday before the opening bell, followed by Dave & Busters after the closing bell.
U.S. Retail Sales, Retail Sales Minus Autos, Import Price Index & Import Price minus Fuel data is scheduled for release Tuesday at 8:30 am before Industrial Production & Capacity Utlization data at 9:15 am & Business Inventories & Home Builder Confidence Index data at 10 am.
Ferguson reports earnings before Tuesday’s opening bell.
Wednesday promises fun, with Housing Starts & Building Permits data at 8:30 am, before the much anticipated FOMC Interest Rate Decision at 2pm & Fed Chair Powell’s Press Conference at 2:30 pm.
Crack Barrel Old Country Store & General Mills report earnings before Wednesday’s opening bell, before Bullish reports after the session’s close.
Initial Jobless Claims & The Philadeplhia Fed Manufacturing Survey data come out Thursday at 8:30 am, followed by U.S. Leading Economic Indicators at 10 am.
Thursday begins with earnings from Darden Restaurants & FactSet, before FedEx & Lennar report following the sessions close.
The week winds down Friday with Fed President Daly speaking at 2:30 pm & there are no noteworthy earnings reports scheduled for release.
See you back here next week!
*** I DO NOT OWN SHARES OR OPTIONS CONTRACT POSITIONS IN SPY, QQQ, IWM OR DIA AT THE TIME OF PUBLISHING THIS ARTICLE ***
Since our last Volume Sentiment Analysis SPY, QQQ, IWM & DIA have continued to reach new all-time highs, but things have become to look less & less stable & sustainable, making it a great time to check in on historic volume sentiments.
Last night the VIX closed at 15.35, indicating an implied one day move range of +/-0.97% & an implied one month move range of +/-4.44% & it seems more likely it’ll heat up than cool down in the near-to-mid-term.
Volumes have been questionable-to-unstable at best (see this week’s market review note) & AI/related-tech has clearly become the long-shot bet that has not proven itself & is not fully prepared to scale at the rates forecasters are projecting (pending a lot of other changes in other sectors & infrastructure), yet is fueling the mania.
This makes it worth checking in on historic volume sentiments in the event of near-term re-tests to assess the strength/weakness of support/resistance levels for the major index ETFs.
Each section below contains a view of each index ETF’s chart (for a technical breakdown of each’s chart, see the link above for last week’s note), as well as a list of their current one year support & resistance levels with the volume sentiment noted beneath it on the table.
There is an additional table beneath this table with each price level’s sentiment, as well as a typed text version below that is able to be copied & pasted.
Note that “NULL, 0:0*” values denote areas that each name has traded at but with limited volume data to work with from a comparison standpoint in terms of creating a ratio of buyers:sellers (or vice versa) or is the outlier above the highest/lowest level with price data.
Also, prices that do have a ratio of Buyers:Sellers (Sellers:Buyers) where the denominator is 0 are denoted with an asterisk “*” as well.
In the written lists of the price levels & volume sentiments the price levels that contain support & resistance levels are marked in BOLD.
Recall that at price extremes such as the highs that we have recently hit there will tend to be skewed data due to the small sample size & factor that into how you interpret each price level’s reported sentiment.
This is intended to serve as an additional tool, similar to a barometer to use during your due diligence process & is not meant to replace doing your own research & is not financial advice.
Price Level:Volume Sentiment Analysis For SPY, the SPDR S&P 500 ETF
SPY ETF – SPDR S&P 500 ETF’s Technical Performance Over The Past Year
SPY, the SPDR S&P 500 ETF is still hovering around it’s upper Bollinger band intraday, but is beginning to show signs of overextension, particularly due to the volume/participation rate.
For a deeper dive into SPY’s technicals, see the link to the market review note above.
SPY ETF’s Price Level:Volume Sentiment Over The Past ~3 Years, Including 1 Year Support/Resistance Levels
SPY ETF’s Price Level:Volume Sentiment Over The Past ~3 Years
Price Level:Volume Sentiment For SPY ETF Over The Past ~3 Years
Price Level:Volume Sentiment For SPY ETF Over The Past ~3 Years
SPY ETF’s Price Level:Volume Sentiment Over The Past ~3 Years
$655 – NULL – 0:0*, +0.00% From Current Price Level – Current Price Level*
$650 – NULL – 0:0*, -0.76% From Current Price Level
$645 – NULL – 0:0*, -1.53% From Current Price Level – 10 Day Moving Average*
$640 – NULL – 0:0*, -2.29% From Current Price Level
$635 – Sellers – 1.24:1, -3.05% From Current Price Level – 50 Day Moving Average*
$630 – Buyers – 1.09:1, -3.82% From Current Price Level
$625 – Buyers – 2.46:1, -4.58% From Current Price Level
$620 – Sellers – 1.61:1, -5.34% From Current Price Level
$615 – Buyers – 1.8:1, -6.11% From Current Price Level
$610 – Buyers – 1.5:0*, -6.87% From Current Price Level
$605 – Buyers – 3.83:1, -7.63% From Current Price Level
$600 – Buyers – 12.2:1, -8.4% From Current Price Level
$595 – Sellers – 2.08:1, -9.16% From Current Price Level
$590 – Buyers – 1.3:1, -9.93% From Current Price Level – 200 Day Moving Average*
$585 – Buyers – 2.67:1, -10.69% From Current Price Level
$580 – Sellers – 2.81:1, -11.45% From Current Price Level
$575 – Buyers – 1.74:1, -12.22% From Current Price Level
$570 – Even – 1:1, -12.98% From Current Price Level
$565 – Buyers – 1.5:1, -13.74% From Current Price Level
$560 – Sellers – 1.07:1, -14.51% From Current Price Level
$555 – Buyers – 3.53:1, -15.27% From Current Price Level
$550 – Buyers – 1.24:1, -16.03% From Current Price Level
$545 – Buyers – 2.24:1, -16.8% From Current Price Level
$540 – Buyers – 1.67:1, -17.56% From Current Price Level
$535 – Sellers – 1.11:1, -18.32% From Current Price Level
$530 – Buyers – 1.67:1, -19.09% From Current Price Level
$525 – Buyers – 1.92:1, -19.85% From Current Price Level
$520 – Buyers – 1.33:1, -20.61% From Current Price Level
$515 – Buyers – 4:1, -21.38% From Current Price Level
$510 – Sellers – 1.41:1, -22.14% From Current Price Level
$505 – Buyers – 1.2:1, -22.9% From Current Price Level
$500 – Sellers – 2.05:1, -23.57% From Current Price Level
$496 – Buyers – 1.24:1, -24.28% From Current Price Level
$492 – Sellers – 7.83:1, -24.89% From Current Price Level
$488 – Buyers – 1.61:1, -25.5% From Current Price Level
$484 – Sellers – 1.2:1, -26.11% From Current Price Level
$480 – Buyers – 1.27:1, -26.72% From Current Price Level
$476 – Buyers – 2.33:1, -27.33% From Current Price Level
$472 – Buyers – 1.91:1, -27.94% From Current Price Level
$468 – NULL – 0:0*, -28.55% From Current Price Level
$464 – Buyers – 1.83:1, -29.16% From Current Price Level
$460 – Sellers – 1.52:1, -29.77% From Current Price Level
$456 – Buyers – 1.13:1, -30.38% From Current Price Level
$452 – Buyers – 0.7:0*, -30.99% From Current Price Level
$448 – Buyers – 2:0*, -31.6% From Current Price Level
$444 – Buyers – 1.42:1, -32.21% From Current Price Level
$440 – Buyers – 2.78:1, -32.83% From Current Price Level
$436 – Buyers – 1.87:1, -33.44% From Current Price Level
$432 – Sellers – 1.58:1, -34.05% From Current Price Level
$428 – Buyers – 1.22:1, -34.66% From Current Price Level
$424 – Buyers – 1.92:1, -35.27% From Current Price Level
$420 – Sellers – 1.68:1, -35.88% From Current Price Level
$416 – Buyers – 1.08:1, -36.49% From Current Price Level
$412 – Buyers – 1.31:1, -37.1% From Current Price Level
$408 – Sellers – 1.63:1, -37.71% From Current Price Level
$404 – Buyers – 1.95:1, -38.32% From Current Price Level
$400 – Buyers – 2.51:1, -38.93% From Current Price Level
$396 – Sellers – 1.8:1, -39.54% From Current Price Level
$392 – Sellers – 1.97:1, -40.15% From Current Price Level
$388 – Buyers – 5:1, -40.76% From Current Price Level
$384 – Buyers – 1.67:1, -41.37% From Current Price Level
$380 – Buyers – 1.39:1, -41.99% From Current Price Level
$376 – Sellers – 2.47:1, -42.6% From Current Price Level
$372 – Sellers – 2.11:1, -43.21% From Current Price Level
$368 – Sellers – 2:1, -43.82% From Current Price Level
$364 – Sellers – 1.28:1, -44.43% From Current Price Level
$360 – Buyers – 1.11:1, -45.04% From Current Price Level
$356 – Buyers – 1.43:1, -45.65% From Current Price Level
$352 – Buyers – 1.67:1, -46.26% From Current Price Level
$348 – Sellers – 0.9:0*, -46.87% From Current Price Level
$344 – NULL – 0:0*, -47.48% From Current Price Level
Price Level:Volume Sentiment Analysis For QQQ, The Invesco QQQ Trust ETF
QQQ ETF – Invesco QQQ Trust ETF’s Technical Performance Over The Past Year
QQQ, the Invesco QQQ Trust ETF has also benefitted from the AI/tech boom, but has shown a more conservative performance of recent vs. SPY.
Given the heights & gappy performance of recent from QQQ components the table below can serve as a barometer for how they may perform in coming re-tests for market participants.
QQQ ETF’s Price Level:Volume Sentiment Over The Past ~1 Year With 1 Year Support/Resistance Levels
QQQ ETF’s Price Level:Volume Sentiment Over The Past ~1 Year
Price Level:Volume Sentiment For QQQ ETF Over The Past ~1 Year
Price Level:Volume Sentiment For QQQ ETF Over The Past ~1 Year
$585 – NULL – 0:0*, +0.34% From Current Price Level
$580 – Buyers – 2:0*, -0.52% From Current Price Level – Current Price Level*
$575 – Sellers – 1.3:1, -1.38% From Current Price Level – 10 Day Moving Average*
$570 – Buyers – 1.79:1, -2.24% From Current Price Level
$565 – Sellers – 1.28:1, -3.09% From Current Price Level – 50 Day Moving Average*
$560 – Sellers – 1.18:1, -3.95% From Current Price Level
$555 – Buyers – 6.25:1, -4.81% From Current Price Level
$550 – Sellers – 1.28:1, -5.67% From Current Price Level
$545 – Buyers – 1.92:1, -6.52% From Current Price Level
$540 – Buyers – 1:0*, -7.38% From Current Price Level
$535 – Buyers – 5.5:1, -8.24% From Current Price Level
$530 – Buyers – 3.45:1, -9.1% From Current Price Level
$525 – Buyers – 1.11:1, -9.95% From Current Price Level
$520 – Buyers – 1.84:1, -10.81% From Current Price Level – 200 Day Moving Average*
$515 – Buyers – 1.1:1, -11.67% From Current Price Level
$510 – Sellers – 2.04:1, -12.53% From Current Price Level
$505 – Sellers – 1.42:1, -13.39% From Current Price Level
$500 – Buyers – 1.79:1, -14.24% From Current Price Level
$496 – Buyers – 1.17:1, -14.93% From Current Price Level
$492 – Buyers – 1.49:1, -15.61% From Current Price Level
$488 – Buyers – 2.58:1, -16.3% From Current Price Level
$484 – Buyers – 1.17:1, -16.99% From Current Price Level
$480 – Buyers – 1.35:1, -17.67% From Current Price Level
$476 – Sellers – 1.06:1, -18.36% From Current Price Level
$472 – Buyers – 1.69:1, -19.05% From Current Price Level
$468 – Sellers – 2.68:1, -19.73% From Current Price Level
$464 – Buyers – 5.46:1, -20.42% From Current Price Level
$460 – Buyers – 1.79:1, -21.1% From Current Price Level
$456 – Buyers – 1.48:1, -21.79% From Current Price Level
$452 – Buyers – 1.17:1, -22.48% From Current Price Level
$448 – Even – 1:1, -23.16% From Current Price Level
$444 – Sellers – 2.25:1, -23.85% From Current Price Level
$440 – Sellers – 1.31:1, -24.53% From Current Price Level
$436 – Buyers – 1.6:0*, -25.22% From Current Price Level
$432 – Sellers – 4.6:0*, -25.91% From Current Price Level
$428 – NULL – 0:0*, -26.59% From Current Price Level
$424 – NULL – 0:0*, -27.28% From Current Price Level
$420 – Buyers – 1.43:1, -27.96% From Current Price Level
$416 – NULL – 0:0*, -28.65% From Current Price Level
$412 – Sellers – 3.5:0*, -29.34% From Current Price Level
$408 – NULL – 0:0*, -30.02% From Current Price Level
Price Level:Volume Sentiment Analysis For IWM, The iShares Russell 2000 ETF
IWM ETF – iShares Russell 2000 ETF’s Technical Performance Over The Past Year
IWM, the iShares Russell 2000 ETF has moved along at a slower pace than its larger part index ETFs, but its movements in the future will be dictated in part by theirs.
With that said, the table data below can help aid in assessing the strength/weakness of the small cap index’s support/resistance levels.
IWM ETF’s Price Level:Volume Sentiment Over The Past ~2 Years With One Year Support/Resistance Levels
IWM ETF’s Price Level:Volume Sentiment Over The Past ~2 Years
Price Level:Volume Sentiment For IWM ETF Over The Past ~2 Years
$244 – NULL – 0:0*, +3.12% From Current Price Level
$240 – Buyers – 0.4:0*, +1.43% From Current Price Level
$236 – Buyers – 2.1:1, -0.26% From Current Price Level – Current Price Level & 10 Day Moving Average**
$232 – Buyers – 1.03:1, -1.95% From Current Price Level
$228 – Buyers – 1.27:1, -3.64% From Current Price Level
$224 – Buyers – 1.09:1, -5.33% From Current Price Level – 50 Day Moving Average*
$220 – Buyers – 1.83:1, -7.02% From Current Price Level
$216 – Even – 1:1, -8.71% From Current Price Level
$212 – Sellers – 1.24:1, -10.4% From Current Price Level – 200 Day Moving Average*
$208 – Buyers – 1.55:1, -12.09% From Current Price Level
$204 – Buyers – 1.12:1, -13.78% From Current Price Level
$200 – Buyers – 1.44:1, -15.47% From Current Price Level
$198 – Sellers – 1.35:1, -16.32% From Current Price Level
$196 – Buyers – 1.33:1, -17.16% From Current Price Level
$194 – Buyers – 1.36:1, -18.01% From Current Price Level
$192 – Buyers – 1.24:1, -18.85% From Current Price Level
$190 – Sellers – 2.7:1, -19.7% From Current Price Level
$188 – Buyers – 1.19:1, -20.54% From Current Price Level
$186 – Buyers – 1.42:1, -21.39% From Current Price Level
$184 – Buyers – 1.83:1, -22.23% From Current Price Level
$182 – Buyers – 3.38:1, -23.08% From Current Price Level
$180 – Sellers – 1.8:1, -23.93% From Current Price Level
$178 – Sellers – 2.2:1, -24.77% From Current Price Level
$176 – Buyers – 1.27:1, -25.62% From Current Price Level
$174 – Buyers – 1.68:1, -26.46% From Current Price Level
$172 – Buyers – 1.18:1, -27.31% From Current Price Level
$170 – Buyers – 1.24:1, -28.15% From Current Price Level
$168 – Sellers – 1.39:1, -29% From Current Price Level
$166 – Sellers – 1.27:1, -29.84% From Current Price Level
$164 – Sellers – 1.78:1, -30.69% From Current Price Level
$162 – Even – 1:1, -31.53% From Current Price Level
$160 – Sellers – 1.07:1, -32.38% From Current Price Level
$158 – NULL – 0:0*, -33.22% From Current Price Level
Price Level:Volume Sentiment Analysis For DIA, The SPDR Dow Jones Industrial Average ETF
DIA ETF – SPDR Dow Jones Industrial Average ETF’s Technical Performance Over The Past Year
When DIA begins to correct it may be felt harder than other indexes as it is a mainly buy & hold index, making the data below worth looking into as an added tool in your assessment of both the ETF & individual names within the index.
Price Level:Volume Sentiment Of DIA ETF Over The Past ~3 Years With One Year Support/Resistance Levels
Price Level:Volume Sentiment Of DIA ETF Over The Past ~3 Years
Price Level:Volume Sentiment Analysis For DIA ETF Over The Past ~3 Years
Price Level:Volume Sentiment Analysis For DIA ETF Over The Past ~3 Years
$460 – NULL – 0:0*, +0.4% From Current Price Level
$456 – NULL – 0:0*, -0.83% From Current Price Level – Current Price Level & 10 Day Moving Average**
$452 – NULL – 0:0*, -1.7% From Current Price Level
$448 – Buyers – 2.09:1, -2.57% From Current Price Level
$444 – Buyers – 2.24:1, -3.44% From Current Price Level – 50 Day Moving Average*
$440 – Sellers – 1.07:1, -4.31% From Current Price Level
$436 – Sellers – 1.28:1, -5.18% From Current Price Level
$432 – Buyers – 1.53:1, -6.05% From Current Price Level
$428 – Buyers – 1.25:1, -6.92% From Current Price Level – 200 Day Moving Average*
$424 – Buyers – 2.21:1, -7.79% From Current Price Level
$420 – Sellers – 1.11:1, -8.66% From Current Price Level
$416 – Buyers – 1.12:1, -9.53% From Current Price Level
$412 – Sellers – 1.41:1, -10.4% From Current Price Level
$408 – Buyers – 1.06:1, -11.27% From Current Price Level
$404 – Buyers – 7:1, -12.14% From Current Price Level
$400 – Buyers – 1.5:1, -13.01% From Current Price Level
$396 – Sellers – 1.06:1, -13.88% From Current Price Level
$392 – Buyers – 1.92:1, -14.75% From Current Price Level
$388 – Buyers – 2.4:1, -15.62% From Current Price Level
$384 – Sellers – 1.03:1, -16.49% From Current Price Level
$380 – Sellers – 1.02:1, -17.36% From Current Price Level
$376 – Sellers – 1.58:1, -18.23% From Current Price Level
$372 – Buyers – 1.38:1, -19.1% From Current Price Level
$368 – Buyers – 1.07:1, -19.97% From Current Price Level
$364 – Buyers – 1.87:1, -20.84% From Current Price Level
$360 – Buyers – 2.86:1, -21.71% From Current Price Level
$356 – Buyers – 0.3:0*, -22.58% From Current Price Level
$352 – Buyers – 3:1, -23.45% From Current Price Level
$348 – Sellers – 1.25:1, -24.32% From Current Price Level
$344 – Buyers – 1:0*, -25.19% From Current Price Level
$340 – Buyers – 1.63:1, -26.06% From Current Price Level
$336 – Buyers – 1.9:1, -26.93% From Current Price Level
$332 – Buyers – 1.25:1, -27.8% From Current Price Level
$328 – Buyers – 1.54:1, -28.67% From Current Price Level
$324 – Buyers – 1.2:1, -29.54% From Current Price Level
$320 – Buyers – 1.31:1, -30.41% From Current Price Level
$316 – Sellers – 1.09:1, -31.28% From Current Price Level
$312 – Sellers – 1.04:1, -32.15% From Current Price Level
$308 – Buyers – 1.13:1, -33.02% From Current Price Level
$304 – Sellers – 3.6:1, -33.89% From Current Price Level
$300 – Buyers – 1.77:1, -34.76% From Current Price Level
$296 – Sellers – 1.68:1, -35.63% From Current Price Level
$292 – Sellers – 1.57:1, -36.5% From Current Price Level
$288 – Sellers – 1.41:1, -37.37% From Current Price Level
$284 – Sellers – 1.55:1, -38.24% From Current Price Level
$280 – Sellers – 2.25:1, -39.11% From Current Price Level
$276 – Sellers – 8.33:1, 39.98% From Current Price Level
$272 – NULL – 0:0*, 40.85% From Current Price Level
*** I DO NOT OWN SHARES OR OPTIONS CONTRACT POSITIONS IN SPY, QQQ, IWM OR DIA AT THE TIME OF PUBLISHING THIS ARTICLE***
The VIX closed at 15.35, indicating an implied one day move of +/-0.97% & an implied one month move of +/-4.44% for the S&P 500.
Highest Technical Rated S&P 500 Components Per 9/10/2025’s Close:
1 – ORCL
2 – WDC
3 – STX
4 – AVGO
5 – NEM
6 – ANET
7 – GLW
8 – GEV
9 – MU
10 – APH
Lowest Technical Rated S&P 500 Components Per 9/10/2025’s Close:
1 – TTD
2 – LULU
3 – IT
4 – SNPS
5 – ALGN
6 – CMG
7 – FI
8 – CHTR
9 – MOH
10 – CNC
Highest Volume Rated S&P 500 Components Per 9/10/2025’s Close:
1 – SNPS
2 – ORCL
3 – TTD
4 – CDNS
5 – FOX
6 – PCG
7 – FIS
8 – GLW
9 – CARR
10 – HUM
Lowest Volume Rated S&P 500 Components Per 9/10/2025’s Close:
1 – AIZ
2 – HOLX
3 – CSX
4 – PSKY
5 – SJM
6 – IBKR
7 – EBAY
8 – ULTA
9 – FSLR
10 – VMC
Highest Technical Rated ETFs Per 9/10/2025’s Close:
1 – AVL
2 – AVGX
3 – JNUG
4 – NUGT
5 – GGLL
6 – WGMI
7 – MUU
8 – GOOX
9 – MULL
10 – PTIR
Lowest Technical Rated ETFs Per 9/10/2025’s Close:
1 – ETQ
2 – ETHD
3 – JDST
4 – DUST
5 – UVIX
6 – AIYY
7 – MSTX
8 – SOXS
9 – CONI
10 – MSTU
Highest Volume Rated ETFs Per 9/10/2025’s Close:
1 – LSVD
2 – TLCI
3 – QMID
4 – GGM
5 – AAVM
6 – BENJ
7 – SEPU
8 – PBUS
9 – ZTAX
10 – NDAA
Lowest Volume Rated ETFs Per 9/10/2025’s Close:
1 – UJB
2 – NFEB
3 – XBAP
4 – FHDG
5 – XHYC
6 – OCTM
7 – KCSH
8 – PSMD
9 – CPSF
10 – MYMF
Highest Technical Rated General Stocks Per 9/10/2025’s Close:
1 – QMMM
2 – OCTO
3 – ZEPP
4 – SOGP
5 – SUPX
6 – VAXX
7 – ANTE
8 – NVFY
9 – ABVX
10 – ISTKF
Lowest Technical Rated General Stocks Per 9/10/2025’s Close:
1 – CJET
2 – BINI
3 – ORGS
4 – SMX
5 – RAYA
6 – YYGH
7 – NXTT
8 – CDT
9 – OP
10 – EXROF
Highest Volume Rated General Stocks Per 9/10/2025’s Close:
1 – CCTG
2 – HUDI
3 – TOP
4 – DEA
5 – TRSG
6 – SLG
7 – CAMP
8 – OUT
9 – AEHL
10 – WLDS
Lowest Volume Rated General Stocks Per 9/10/2025’s Close:
1 – OMQS
2 – CNND
3 – FCSMF
4 – PFHO
5 – DTEGF
6 – CDUAF
7 – RUPRF
8 – FNTB
9 – CULL
10 – MGHCF
*** THE LIST ABOVE IS STRICTLY FOR INFORMATIONAL PURPOSES – I MAY OR MAY NOT HAVE OR INITIATE A LONG, SHORT, OR LONG/SHORT POSITION IN ANY NAME ABOVE AT ANY TIME ***
The VIX closed at 15.04, indicating an implied one day move of +/-0.95% & an implied one month move of +/-4.35% for the S&P 500.
Highest Technical Rated S&P 500 Components Per 9/9/2025’s Close:
1 – WDC
2 – STX
3 – AVGO
4 – NEM
5 – GLW
6 – APH
7 – GOOGL
8 – GOOG
9 – ANET
10 – PLTR
Lowest Technical Rated S&P 500 Components Per 9/9/2025’s Close:
1 – LULU
2 – IT
3 – TTD
4 – ALGN
5 – CHTR
6 – CMG
7 – CNC
8 – MOH
9 – MRNA
10 – FI
Highest Volume Rated S&P 500 Components Per 9/9/2025’s Close:
1 – NWS
2 – FOX
3 – NWSA
4 – ALB
5 – HUM
6 – ORCL
7 – UNH
8 – NCLH
9 – SBAC
10 – TDG
Lowest Volume Rated S&P 500 Components Per 9/9/2025’s Close:
1 – WYNN
2 – INTC
3 – PSKY
4 – TDY
5 – WSM
6 – ON
7 – EL
8 – NSC
9 – MCHP
10 – ED
Highest Technical Rated ETFs Per 9/9/2025’s Close:
1 – JNUG
2 – NUGT
3 – AVL
4 – AVGX
5 – GGLL
6 – GOOX
7 – BABX
8 – MSOX
9 – MSOS
10 – WEED
Lowest Technical Rated ETFs Per 9/9/2025’s Close:
1 – ETHD
2 – ETQ
3 – UVIX
4 – JDST
5 – DUST
6 – AIYY
7 – MSTX
8 – CONI
9 – MSTU
10 – UVXY
Highest Volume Rated ETFs Per 9/9/2025’s Close:
1 – AGGS
2 – ROPE
3 – VLLU
4 – HWSM
5 – TOKE
6 – LIAY
7 – SEIV
8 – SEIQ
9 – SEIM
10 – DHSB
Lowest Volume Rated ETFs Per 9/9/2025’s Close:
1 – CCNR
2 – NUGO
3 – PIPE
4 – PABD
5 – GPRF
6 – GSID
7 – BUFI
8 – MMAX
9 – ZAUG
10 – QBUL
Highest Technical Rated General Stocks Per 9/9/2025’s Close:
1 – QMMM
2 – OCTO
3 – SOGP
4 – ZEPP
5 – STEC
6 – EPSM
7 – ANTE
8 – SUPX
9 – FORD
10 – ABVX
Lowest Technical Rated General Stocks Per 9/9/2025’s Close:
1 – SOS
2 – CJET
3 – BINI
4 – SMX
5 – RAYA
6 – CDT
7 – WAI
8 – OP
9 – HWNID
10 – QVCBG
Highest Volume Rated General Stocks Per 9/9/2025’s Close:
1 – SOS
2 – CNFR
3 – CDTG
4 – MMA
5 – BON
6 – STEC
7 – CNEY
8 – CHR
9 – GLXG
10 – TRML
Lowest Volume Rated General Stocks Per 9/9/2025’s Close:
1 – AZURF
2 – CDUAF
3 – MBXBF
4 – CULL
5 – GLGI
6 – STCB
7 – CTXDF
8 – AGSS
9 – PAANF
10 – HMENF
*** THE LIST ABOVE IS STRICTLY FOR INFORMATIONAL PURPOSES – I MAY OR MAY NOT HAVE OR INITIATE A LONG, SHORT, OR LONG/SHORT POSITION IN ANY NAME ABOVE AT ANY TIME ***