NVIDIA Corp. stock trades under the ticker NVDA & has had an astounding year, advancing +191.63%, gaining +226.62% since their 52-week low in December of 2023 & sitting just -1.84% below their 52-week high from 11/8/2024 (all figures ex-dividends).
NVDA has been no stranger to our posts here this past year due to their high flying performance & the AI/Data Center Boom, which makes today’s earnings report very important as it will dictate if the major market indexes that are near all-time highs can maintain their current explosive performance.
In the event of disappointment there may be broader corrections & a pivot from the technology names & into more “concrete” names, such as the companies that build their data centers & supply the builders, as well as the utilities companies as a flight to safety & for their better dividend yields, while maintaining a focus on the future data center needs (see this post from April 2024 for some names that might make up a Synthetic A.I. ETF that excludes the technology sector).
Below is a brief technical analysis of NVDA, as well as a price level:volume sentiment analysis of the price levels NVDA has traded at over the ~8 months.
Included in this data is also their recent support & resistance levels so that readers can gain insight into how strong/weak these support/resistance levels may be in the future, based on past investor behavior.
It is not intended to serve as financial advice, but rather as an additional tool to reference while performing your own due diligence on NVDA.
NVIDIA Corp. NVDA Stock’s Technical Performance Broken Down
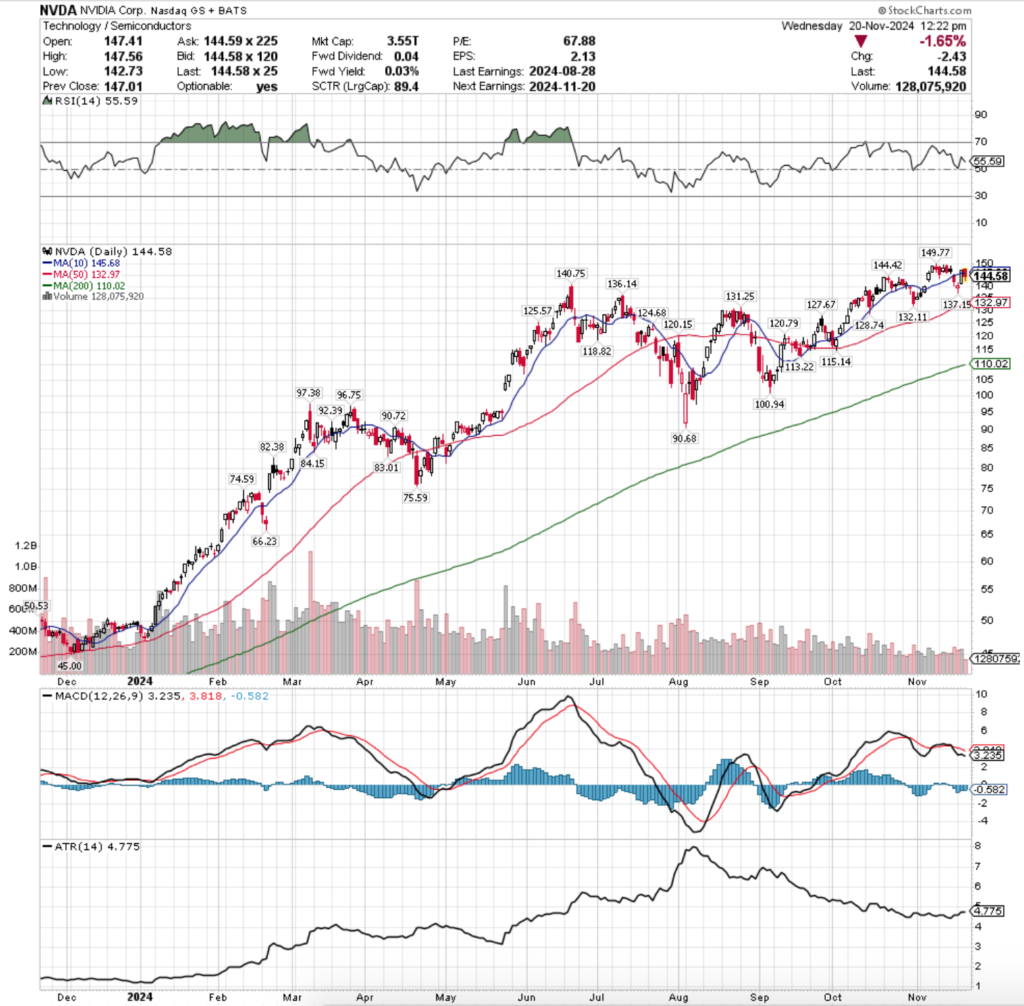
NVIDIA Corp. NVDA Stock’s Technical Performance Over The Past Year
Their RSI is currently trending down & approaching the neutral level of 50 & currently sits at 55.59, while their MACD crossed over bearishly last week & continues to trend lower & further from the signal line.
Volumes have been -47.42% below the previous year’s average levels over the past week & a half (209,592,857.14 vs. 398,617,103.17) as market participants eagerly await to see if they can continue their steep ascent or if the AI-mania may be taking a breather/coming to an end.
From a high level it seems at least by volume that many folks are remaining content to wait & see, as there has not been much outsized declining volume in relation to advancing volume.
However, the fact that the participation rate has been effectively cut in half vs. the prior year in the last week & a half should raise an eyebrow of skepticism as it shows that either folks are sensing danger on the horizon & or are realizing that they’re near a perfect valuation & have become content, neither of which tend to be good things, especially near an earnings report.
On the same high level track note that the tops & bottoms of their price charts have been contracting (bearish) since mid-October & prices stalled out at the all-time high only 3.7% higher than the prior ATH from mid-October.
The past two weeks have also been flashing mixed signals, but the brake lights have remained on for seven of the last eleven sessions.
Two weeks ago on Wednesday NVDA gapped up along with the rest of the markets in the wake of the U.S. Presidential Election results & continued higher Thursday.
It should be noted that these volumes were muted compared to the rest of the prior year though, not indicating as much enthusiasm as most other indexes/securities.
That Friday’s declining session on a spinning top set the stage for the next week of declines, as it showed market participants were taking profits on the day of the all-time high, and there was clear uncertainty as to where the price should be.
Volume was low that day, but the seller sentiment carried on into Monday of the new week, when a bearish engulfing candle set up a three-day consolidation that took place mostly within the range of its candle’s real body.
Tuesday’s candle would constitute as a shooting star had it followed an uptrend (bearish), Wednesday’s candle formed a bearish engulfing pattern on Tuesday’s & a bearish harami was formed when Thursday’s candle advanced, but closed lower than it opened & the entire day’s range was contained within Wednesday’s real body.
None of this inspired enthusiasm among market participants, as Friday opened on a gap down in-line with the 10 day moving average’s support, before continuing lower & the lower shadow of the day’s range flirted with the $140/share level.
Monday opened lower & below the $140 mark, tested lower, but was able to close above its open, but still for a loss.
Those two days also featured some of the strongest volume of November, indicating that there was a bit of a switch in sentiment.
Yesterday featured an advancing session that was able to close above the resistance of the 10 DMA, but today has featured an open higher than yesterday that has fallen apart quickly as prices have only continued lower throughout the day since the open.
As of this writing (1:45pm) volume is roughly half of yesterday’s low level, so market participants are still sitting in anticipation of tonight’s results.
After NVDA’s aggressive gap ups in May 2024 they have somewhat traded in a consolidated range & gradually shifted higher in a similar manner to how IWM trades, which is peculiar given their market cap vs. the highest market cap in the Russell 2000.
This will be one of the most anticipated earnings reports of the past few years & there are lots of warning signs/brake lights flashing as we approach it.
I won’t get into the upside potential given how close we are to their ATH, but the downside is where more focus should be given it is relatively measurable.
The section below lays out how the buyers & sellers have met at each price level NVDA has traded at over the past ~8 months.
While it is not indicative of future performance, history repeats itself & or rhymes & this can be used as a barometer to anticipate how market participants may behave when faced with these price levels again.
Price Level:Volume Sentiment Analysis For NVIDIA Corp. NVDA Stock
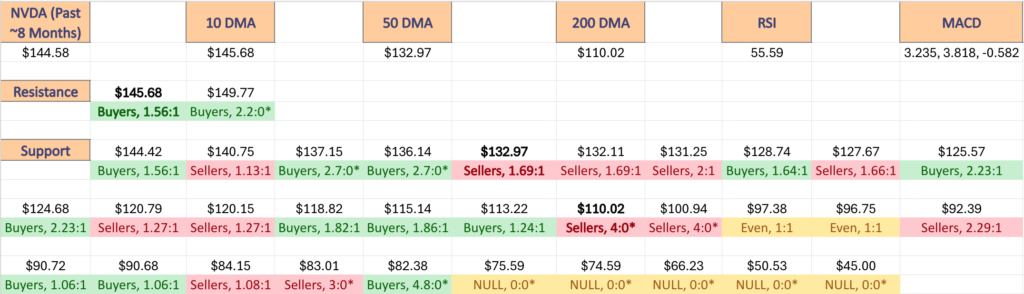
The top table below shows the support & resistance levels of NVDA from the past year’s chart, as well as their price level:volume sentiment at each from data covering the past ~8 months, using Wednesday 11/20/24’s mid-session price for their price & moving averages/other technicals.
The moving averages are denoted with bold.
The next charts show the volume sentiment at each individual price level NVDA has traded at over the past ~8 months.
Beneath them is a copy & pasteable list of the same data, where the support/resistance levels are denoted in bold.
All ratios with “0” in the denominator are denoted with a “*”.
NULL values are price levels that had limited trading volume, whether it be due to gaps, quick advances or they are at price extremes; in the event that they are retested & there is more data they would have a distinct “Buyers”, “Sellers” or “Even” title.
This is not intended as financial advice, but rather another tool to consider when performing your own research & due diligence on NVDA.
NVIDIA Corp. NVDA Stock’s Price Level:Volume Sentiment Over The Past ~8 Months At One Year Support & Resistance Levels
NVIDIA Corp. NVDA Stock’s Price Level:Volume Sentiment Over The Past ~8 Months
NVDA Stock’s Price Level:Volume Sentiment Over The Past ~8 Months
NVDA Stock’s Price Level:Volume Sentiment Over The Past ~8 Months
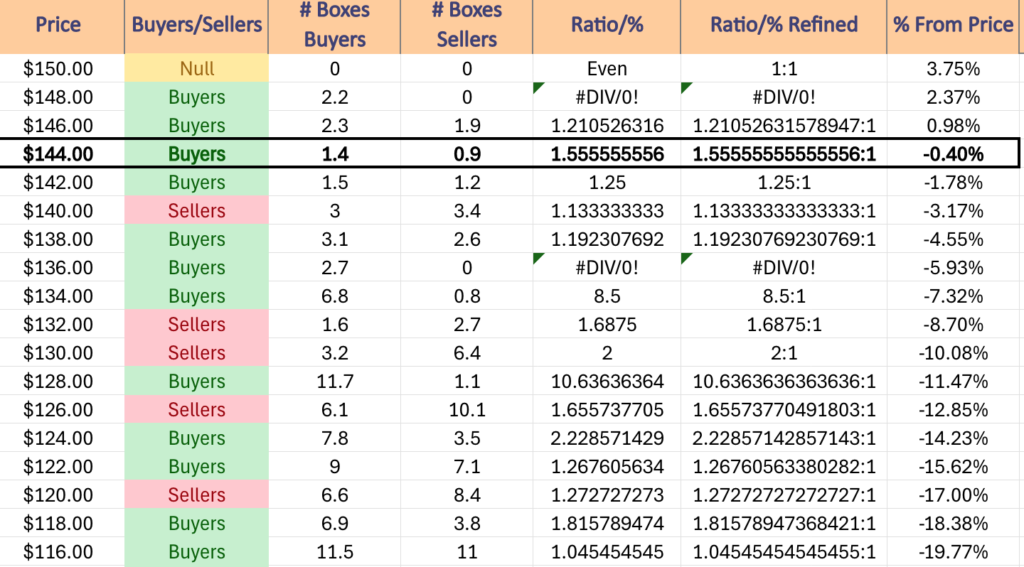
$150 – NULL – 0:0*, +3.75% From Current Price Level
$148 – Buyers – 2.2:0*, +2.37% From Current Price Level– All Time High*
$146 – Buyers – 1.21:1, +0.98% From Current Price Level
$144 – Buyers – 1.56:1, -0.4% From Current Price Level – Current Price Level & 10 Day Moving Average**
$142 – Buyers, 1.25:1, -1.78% From Current Price Level
$140 – Sellers – 1.13:1. -3.17% From Current Price Level
$138 – Buyers – 1.19:1, -4.55% From Current Price Level
$136 – Buyers – 2.7:0*, -5.93% From Current Price Level
$134 – Buyers – 8.5:1, -7.32% From Current Price Level
$132 – Sellers – 1.69:1, -8.7% From Current Price Level – 50 Day Moving Average*
$130 – Sellers – 2:1, -8.7% From Current Price Level
$128 – Buyers – 10.64:1, -10.08% From Current Price Level
$126 – Sellers – 1.66:1, -11.47% From Current Price Level
$124 – Buyers – 2.23:1, -12.85% From Current Price Level
$122 – Buyers – 1.27:1, -14.23% From Current Price Level
$120 – Sellers – 1.27:1, -15.62% From Current Price Level
$118 – Buyers – 1.82:1, -17% From Current Price Level
$116 – Buyers – 1.05:1, -18.38% From Current Price Level
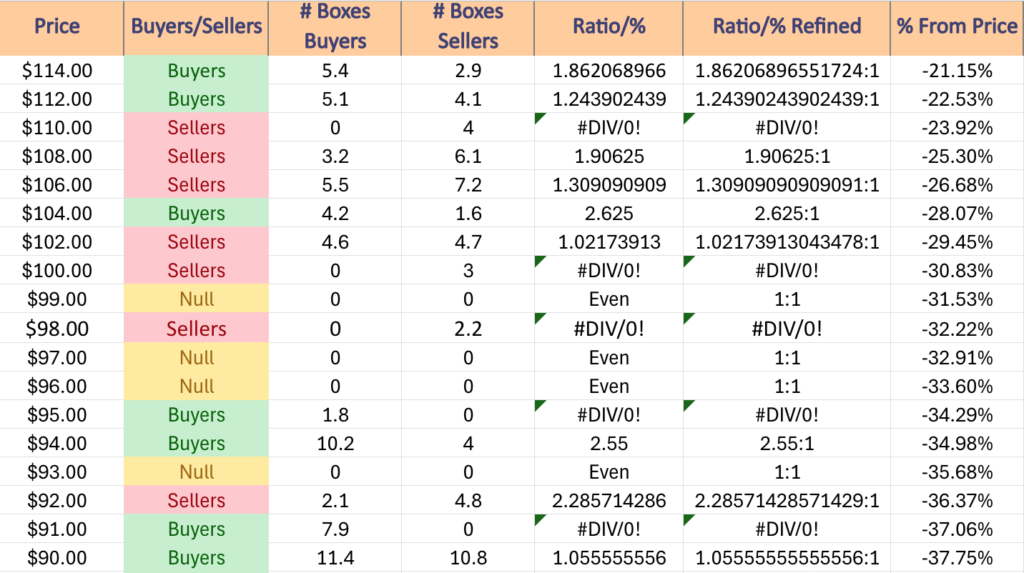
$114 – Buyers – 1.86:1, -21.15% From Current Price Level
$112 – Buyers – 1.24:1, -22.53% From Current Price Level
$110 – Sellers – 0.4:0*, -23.92% From Current Price Level – 200 Day Moving Average*
$108 – Sellers – 1.91:1, -25.3% From Current Price Level
$106 – Sellers – 1.31:1, -26.68% From Current Price Level
$104 – Buyers – 2.63:1, -28.07% From Current Price Level
$102 – Sellers – 1.02:1, -29.45% From Current Price Level
$100 – Sellers – 3:0*, -30.83% From Current Price Level
$99 – NULL – 0:0*, -31.53% From Current Price Level
$98 – Sellers – 2.2:0*, -32.22% From Current Price Level
$97 – NULL – 0:0*, -32.91% From Current Price Level
$96 – NULL – 0:0*, -33.6% From Current Price Level
$95 – Buyers – 1.8:0*, -34.29% From Current Price Level
$94 – Buyers – 2.55:1, -34.98% From Current Price Level
$93 – NULL – 0:0*, -35.68% From Current Price Level
$92 – Sellers – 2.29:1, -36.37% From Current Price Level
$91 – Buyers – 7.9:0*, -37.06% From Current Price Level
$90 – Buyers – 1.06:1, -37.75% From Current Price Level
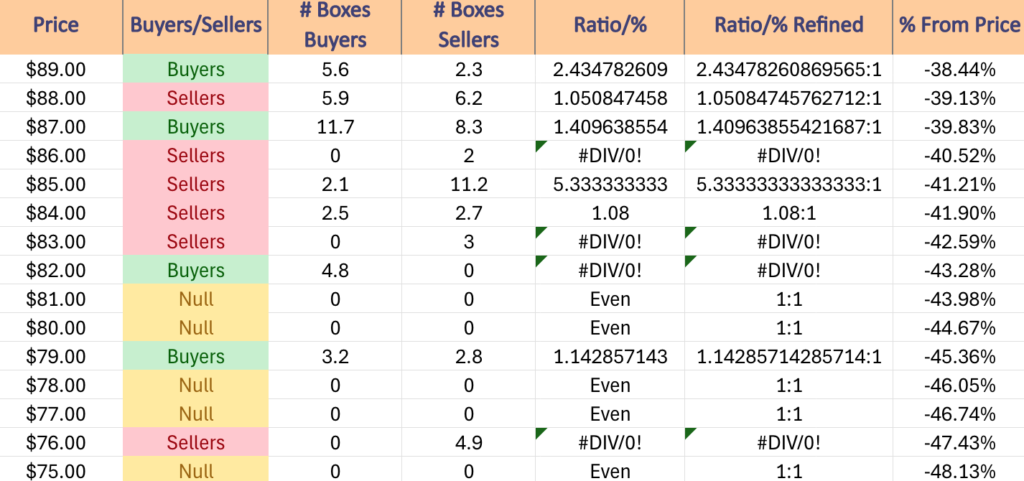
$89 – Buyers – 2.43:1, -38.44% From Current Price Level
$88 – Sellers – 1.05:1, -39.13% From Current Price Level
$87 – Buyers – 1.41:1, -39.83% From Current Price Level
$86 – Sellers – 2:0*, -40.52% From Current Price Level
$85 – Sellers – 5.33:1, -41.21% From Current Price Level
$84 – Sellers – 1.08:1, -41.9% From Current Price Level
$83 – Sellers – 3:0*, -42.59% From Current Price Level
$82 – Buyers – 4.8:0*, -43.28% From Current Price Level
$81 – NULL – 0:0*, -43.98% From Current Price Level
$80 – NULL – 0:0*, -44.67% From Current Price Level
$79 – Buyers – 1.14:1, -45.36% From Current Price Level
$78 – NULL – 0:0*, -46.05% From Current Price Level
$77 – NULL – 0:0*, -46.74% From Current Price Level
$76 – Sellers – 4.9:0*, -47.43% From Current Price Level
$75 – NULL – 0:0*, -48.13% From Current Price Level
*** I DO NOT OWN SHARES OR OPTIONS CONTRACTS IN NVDA AT THE TIME OF PUBLISHING THIS ARTICLE ***
The VIX closed at 16.35, indicating an implied one day move of +/-1.03% & an implied one month move of +/-4.73% for the S&P 500.
Highest Technical Rated S&P 500 Components Per 11/1/2024’s Close:
1 – PLTR
2 – UAL
3 – AXON
4 – VST
5 – TSLA
6 – TRGP
7 – RCL
8 – CCL
9 – FICO
10 – DAL
Lowest Technical Rated S&P 500 Components Per 11/19/2024’s Close:
1 – MRNA
2 – CE
3 – ENPH
4 – SMCI
5 – QRVO
6 – EL
7 – WBA
8 – MPWR
9 – APTV
10 – REGN
Highest Volume Rated S&P 500 Components Per 11/19/2024’s Close:
1 – AMCR
2 – INCY
3 – SMCI
4 – CE
5 – J
6 – WMT
7 – TMO
8 – TGT
9 – EFX
10 – JNPR
Lowest Volume Rated S&P 500 Components Per 11/19/2024’s Close:
1 – UDR
2 – FRT
3 – WY
4 – WRB
5 – PH
6 – MTB
7 – MNST
8 – DG
9 – BK
10 – USB
Highest Technical Rated ETFs Per 11/19/2024’s Close:
1 – MSTX
2 – TSLR
3 – TSLL
4 – TSLT
5 – CONL
6 – BITW
7 – VCAR
8 – TSL
9 – BITX
10 – DAPP
Lowest Technical Rated ETFs Per 11/19/2024’s Close:
1 – TSLZ
2 – TSDD
3 – MSOX
4 – TSLQ
5 – MRNY
6 – NVDQ
7 – NVD
8 – SMST
9 – TSLS
10 – SKRE
Highest Volume Rated ETFs Per 11/19/2024’s Close:
1 – GPOW
2 – FDTS
3 – HAPR
4 – UJUN
5 – BJUN
6 – DIVS
7 – LUX
8 – CMDT
9 – UNOV
10 – SMCF
Lowest Volume Rated ETFs Per 11/19/2024’s Close:
1 – CLOX
2 – EQLS
3 – IQSU
4 – SHRT
5 – BUFF
6 – IWLG
7 – IQSI
8 – ESGB
9 – FDGR
10 – GGUS
Highest Technical Rated General Stocks Per 11/19/2024’s Close:
1 – BTCT
2 – AGFY
3 – DRUG
4 – ACRS
5 – ZNOG
6 – MNPR
7 – SEZL
8 – WLGS
9 – NXL
10 – QUBT
Lowest Technical Rated General Stocks Per 11/19/2024’s Close:
1 – EFSH
2 – SYRS
3 – GCTK
4 – DEVS
5 – CETX
6 – TFFP
7 – ADTX
8 – ADD
9 – TCBP
10 – PET
Highest Volume Rated General Stocks Per 11/19/2024’s Close:
1 – PRFX
2 – OUT
3 – SOAR
4 – SYRS
5 – TRNR
6 – OIBZQ
7 – WHLR
8 – TFFP
9 – SNOA
10 – ARBV
Lowest Volume Rated General Stocks Per 11/19/2024’s Close:
1 – RSCF
2 – SGNLF
3 – BNPQF
4 – NSRCF
5 – FLMMF
6 – DBIN
7 – PTRUF
8 – FNRN
9 – INBP
10 – CHXMF
*** THE LIST ABOVE IS STRICTLY FOR INFORMATIONAL PURPOSES – I MAY OR MAY NOT HAVE OR INITIATE A LONG, SHORT, OR LONG/SHORT POSITION IN ANY NAME ABOVE AT ANY TIME ***
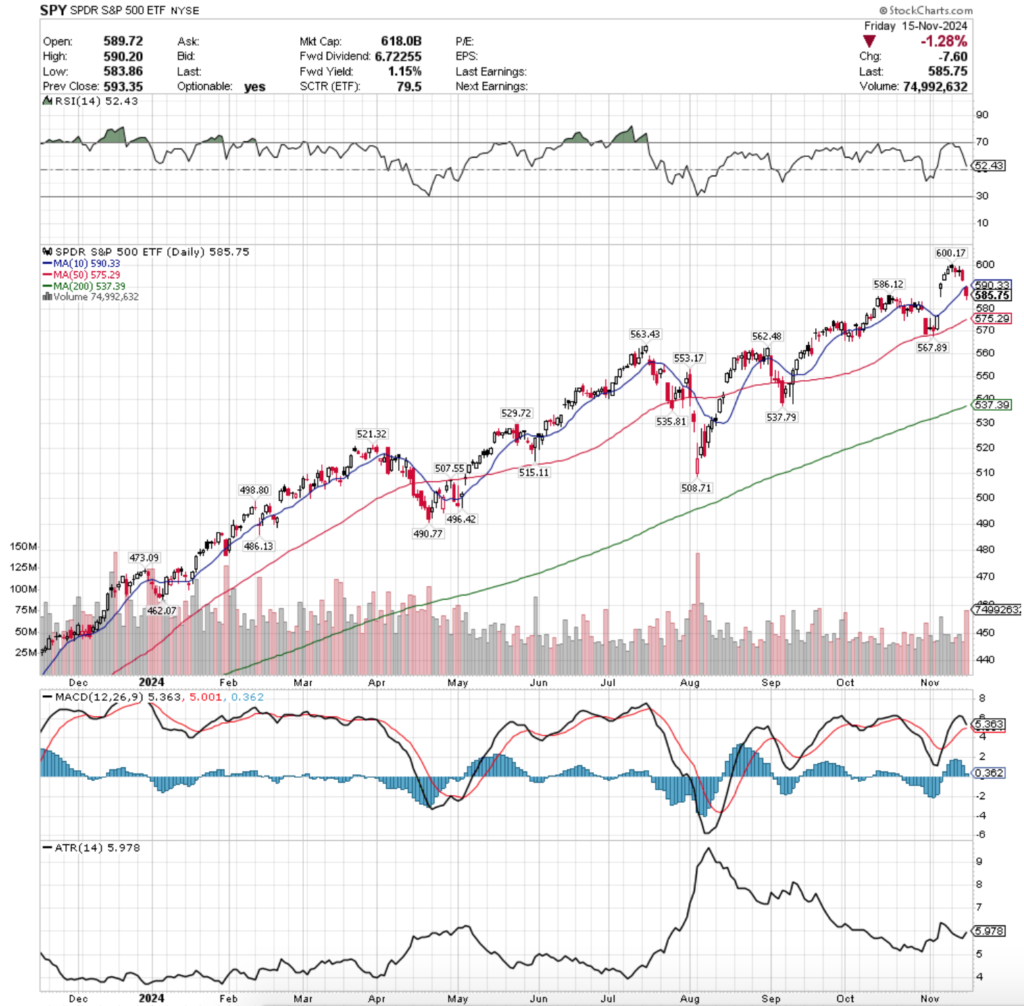
SPY, the SPDR S&P 500 ETF slid -2.08% this week, while the VIX closed at 16.14, indicating an implied one day move of +/-1.02% & an implied one month move of +/-4.67% for the S&P 500.
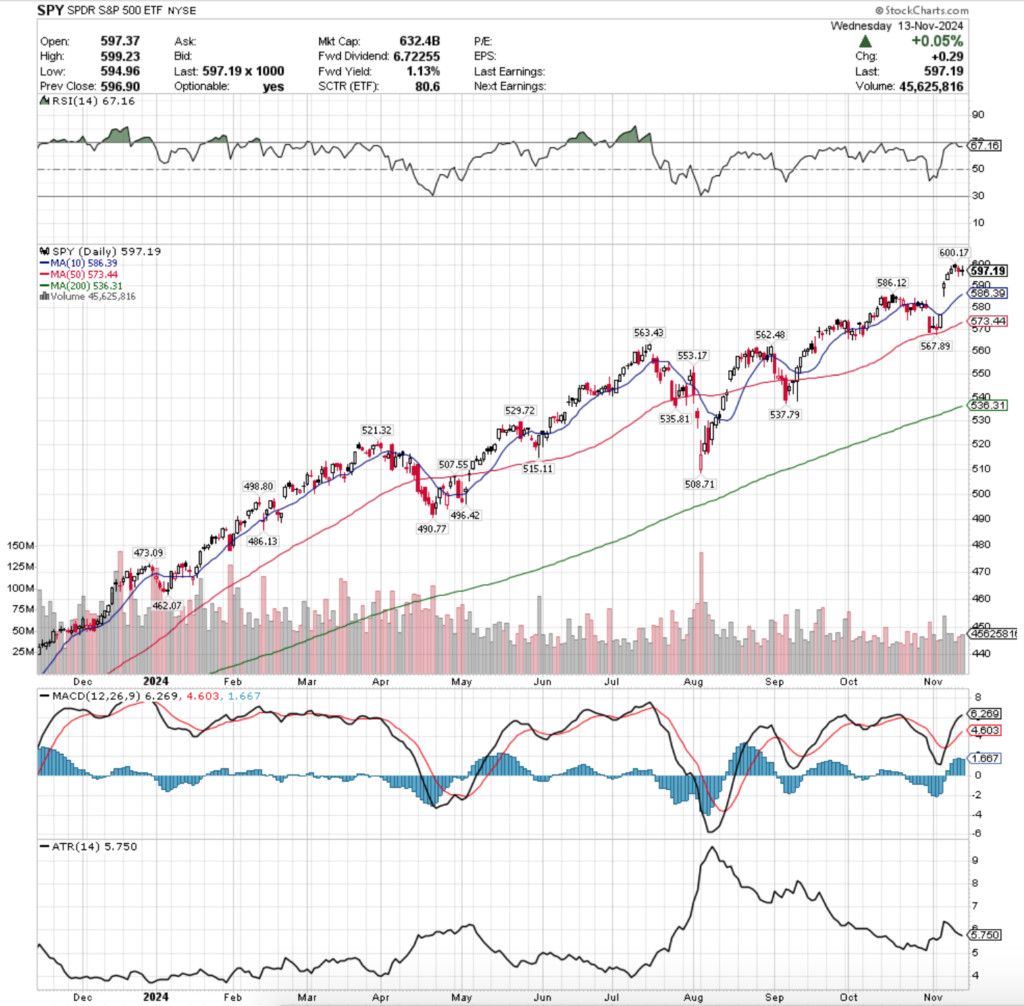
SPY ETF – SPDR S&P 500 ETF’s Technical Performance Over The Past Year
Their RSI is trending back down toward the neutral level & currently sits at 52.43, while their MACD has curled over bearishly & will likely cross the signal line within the first day or two of the week.
Volumes were -23.98% lower than the prior year’s average level (46,144,000 vs. 60,703,202), as investors are still timid near all-time highs for SPY.
For over seven months now volumes have been drastically lower than they had been in the years prior, which brings up questions regarding is it hesitancy due to the high price levels & valuations, or is there something else out there that is keep money on the sidelines.
Last Monday SPY kicked the week off on a foreboding note, as despite an advancing session that hit their current all-time high, the day resulted in a hanging man candle that closed lower than it opened (bearish).
It should also be noted that this was the lowest volume session of the day, which makes the move even more alarming.
Tuesday the bad times continued, as the day opened lower, tested slightly higher, only to decline & reinforce the negative sentiment that Monday began the week with.
Wednesday the market temporarily found equilibrium as the day resulted in a doji candle that closed slightly higher than the day prior’s on the second highest volume of the week.
Things resumed heading south on Thursday with a declining session that began filling in the window created by the previous Thursday’s gap up session.
Friday was a risk off into the weekend type of day, opening on a gap down near the 10 day moving average & blowing through the support level to close lower on the day on the highest volume of the week.
This coming week should be interesting (this note is late as I was OOO Monday) as there are a handful of Fed speakers & NVDIA’s earnings report is due out Wednesday.
The Fed speakers aren’t likely to tell us anything we don’t already know & it seems that SPY is consolidating within Friday’s candle’s range while waiting to see what comes from that report.
In the event it moves us to the upside the $600.17/share mark will be where all eyes focus to see if the resistance level can be broken.
In the event it’s a downside surprise the window that is at the $580/share level from October will be in focus, as it was gapped both below & over & because the $575-579.99 level is a seller dominated price zone which will likely cause further declines.
This will be problematic as there are not many local support levels for SPY from its current price & may mean it struggles to find footing until after a loss of 3-5%.
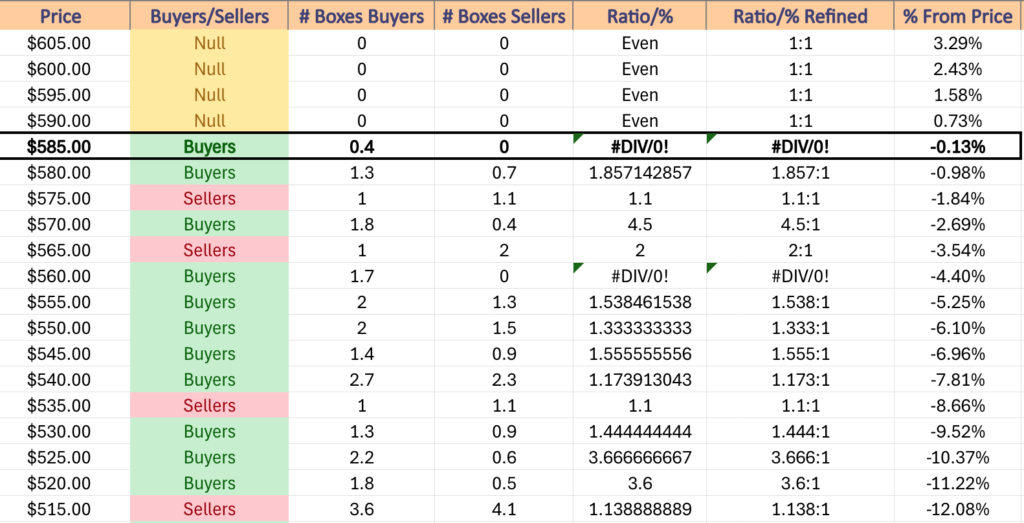
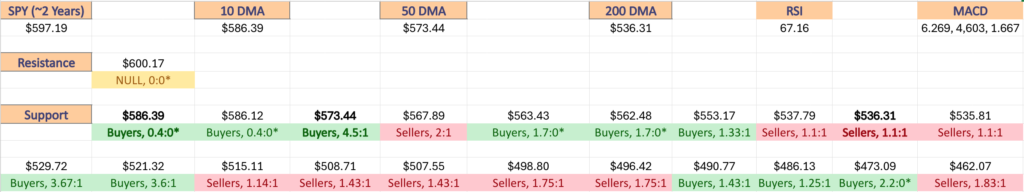
SPY has support at the $586.12 (Volume Sentiment: Buyers, 0.4:0*), $575.29 (50 Day Moving Average, Volume Sentiment: Sellers, 1.1:1), $567.89 (Volume Sentiment: Sellers, 2:1) & $563.43/share (Volume Sentiment: Buyers, 1.7:0*) price levels, with resistance at the $590.33 (10 Day Moving Average, Volume Sentiment: NULL, 0:0*) & $600.17/share (All-Time High, Volume Sentiment: NULL, 0:0*) price levels.
SPY ETF’s Price Level:Volume Sentiment Over The Past ~2 Years
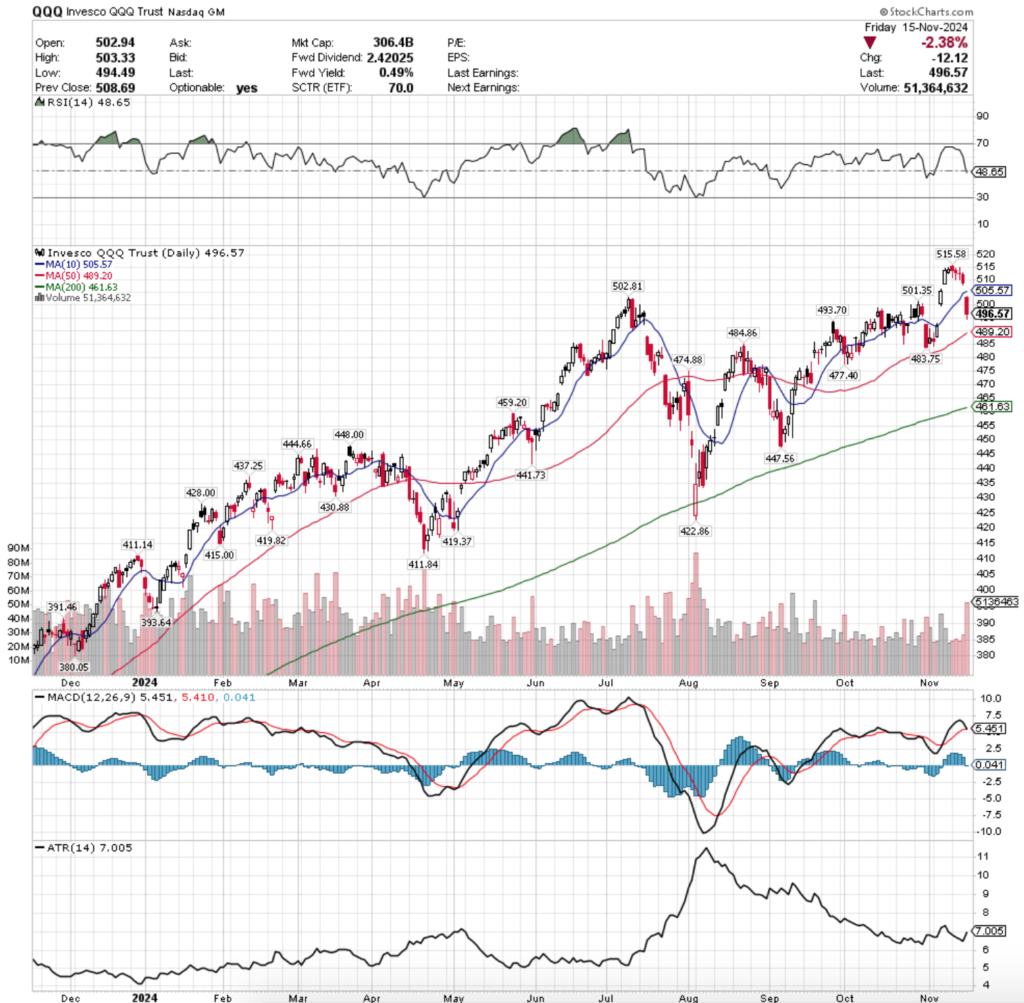
QQQ, the Invesco QQQ Trust ETF dropped -3.42% last week, as market participants were taking some profits after the prior week’s gap up sessions.
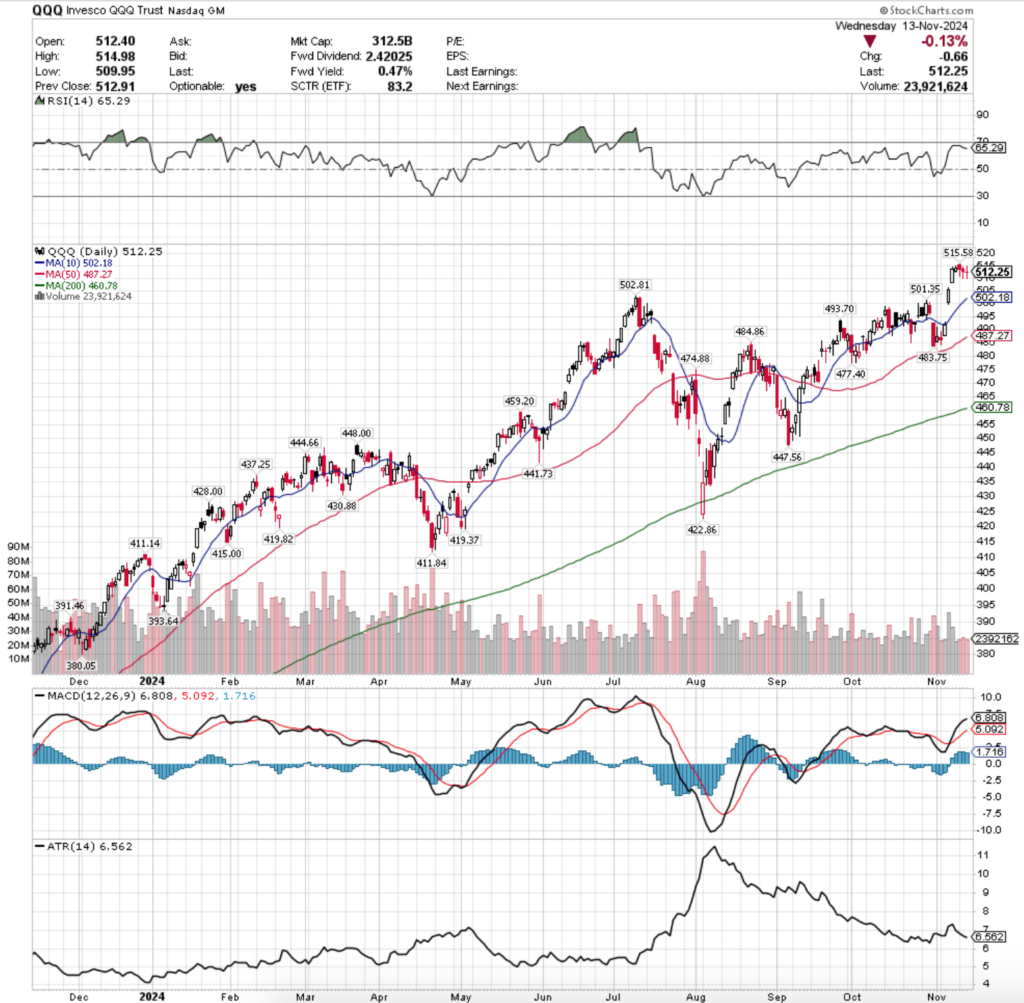
QQQ ETF – Invesco QQQ Trust ETF’s Technical Performance Over The Past Year
Their RSI is has just passed bearishly through the neutral level of 50 & sits currently at 48.65, while their MACD is set to cross the signal line bearishly during Monday’s session.
Volumes were -21.76% below the previous year’s average level (30,342,000 vs. 38,782,885), which like SPY means that they were dramatically lower than the prior year’s average from seven months ago, begging the question of where this money is & why.
QQQ’s week looks awfully similar to SPY’s, except that all of QQQ’s candles are red, while SPY had some that were filled black as they closed lower than they opened but advanced on the open.
Monday resulted in a new all-time high for QQQ on low volume that also was a hanging man candle, predicting the bearishness the rest of the week followed with.
Tuesday continued lower, but the $510/share level was not broken through as investors seemed to think that was a fair valuation again on Wednesday when prices approached it, but did not break down through it.
Wednesday closed in a doji, indicating that there was temporary equilibrium in the eyes of market participants, before Thursday finally broke down the $510/share level to close beneath it.
Friday everything fell apart as QQQ gapped down to open below the 10 day moving average’s support & only continued lower throughout the day on the week’s highest volume.
Profits from the prior week’s gaps were taken 0ff of the table as investors await NVDA’s earnings report on Wednesday, as it will lend clues into the state of technology names.
In the event of a good report, QQQ has a few resistance levels to break through before they reach their all-time high, as like SPY so far this week they’ve just consolidated into the range set by Friday’s candle’s real body.
In the event they break out above the $502.81 mark the 10 DMA’s resistance will be interesting, given how hard they fell through it on Friday as a support level.
On the downside the 50 DMA is the second nearest support level, with the $493.70 one occurring in a price level that has been overwhelming strong for the buyers historically.
While Friday’s high volume may be viewed as some as ammunition getting ready to be reemployed in the market, based on how low volumes have been in the past seven months & how high Friday’s bearish session’s volume was we may be looking at more declining behavior in the near-term.
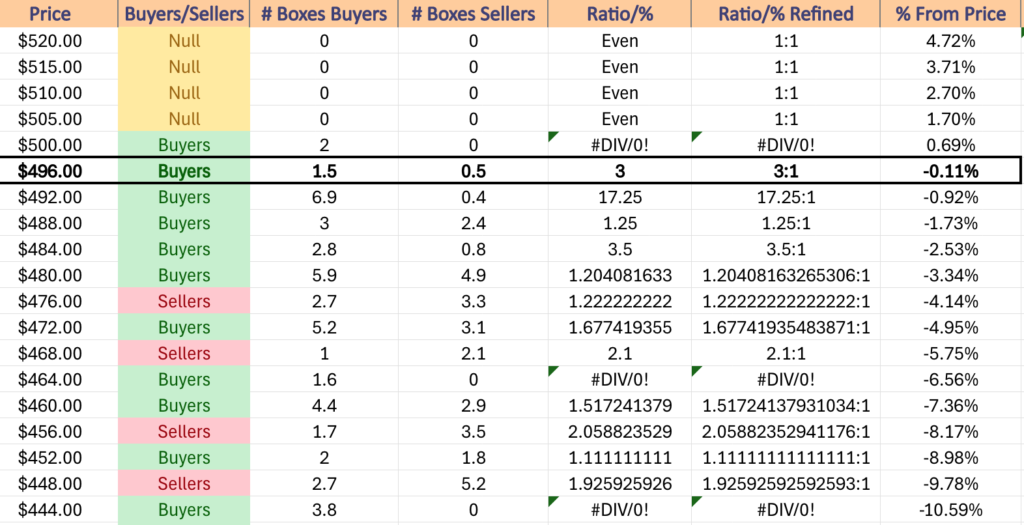
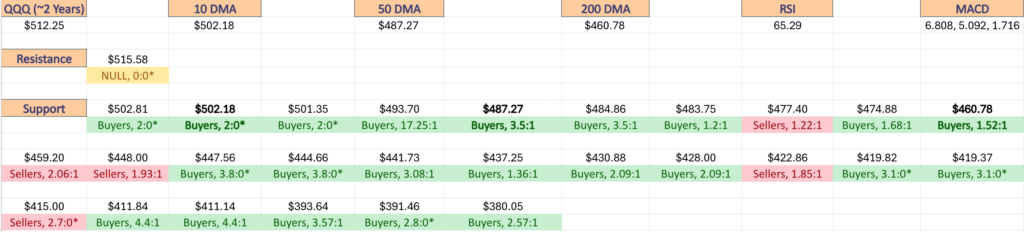
QQQ has support at the $493.70 (Volume Sentiment: Buyers, 17.25), $489.20 (50 Day Moving Average, Volume Sentiment: Buyers, 1.25:1), $484.86 (Volume Sentiment: Buyers, 3.5:1) & $483.75/share (Volume Sentiment: Buyers, 1.2:1) price levels, with resistance at the $501.35 (Volume Sentiment: Buyers, 2:0*), $502.81 (Volume Sentiment: Buyers, 2:0*), $505.57 (10 Day Moving Average, Volume Sentiment: NULL, 0:0*) & $515.58/share (All-Time High, Volume Sentiment: NULL, 0:0*) price levels.
QQQ ETF’s Price Level:Volume Sentiment Over The Past ~2 Years
IWM, the iShares Russell 2000 ETF had the worst week of the major four index ETFs, declining -4.05% as investors took profits on the heels of their outperformance from last week.
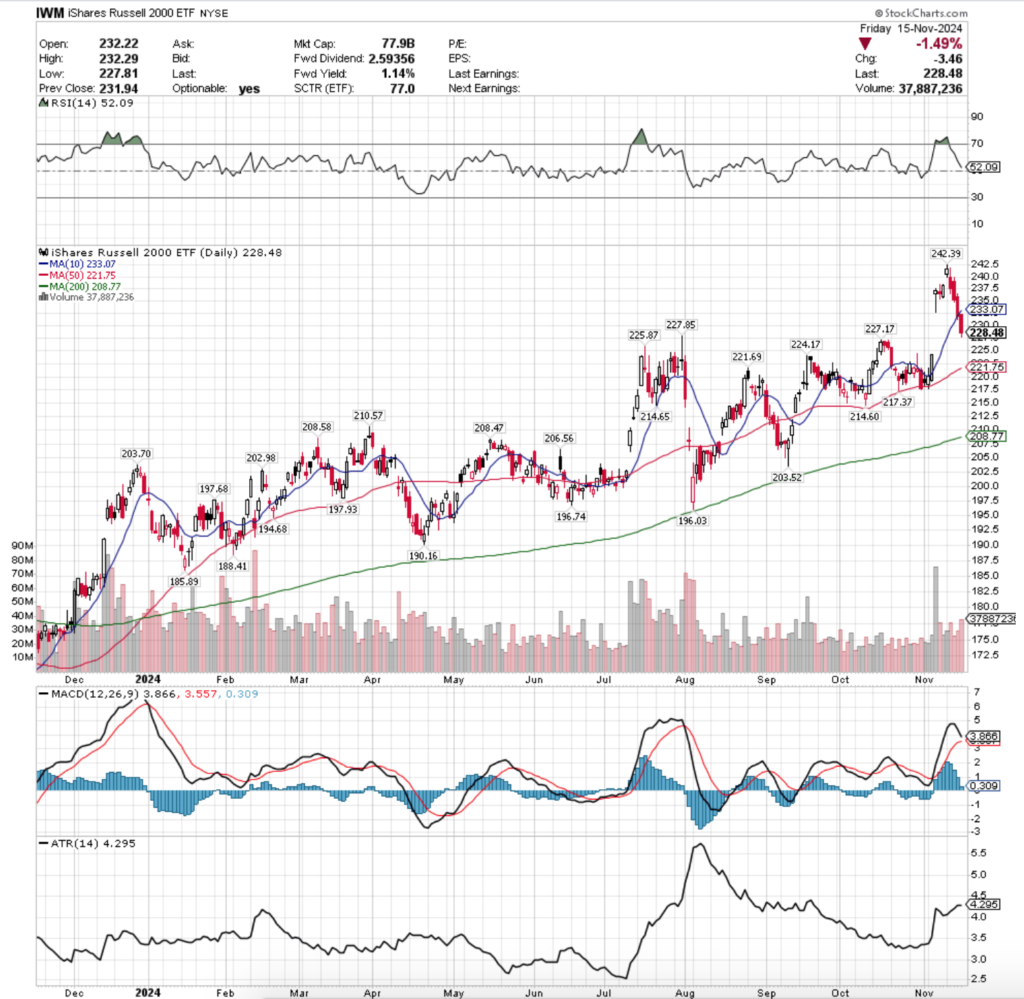
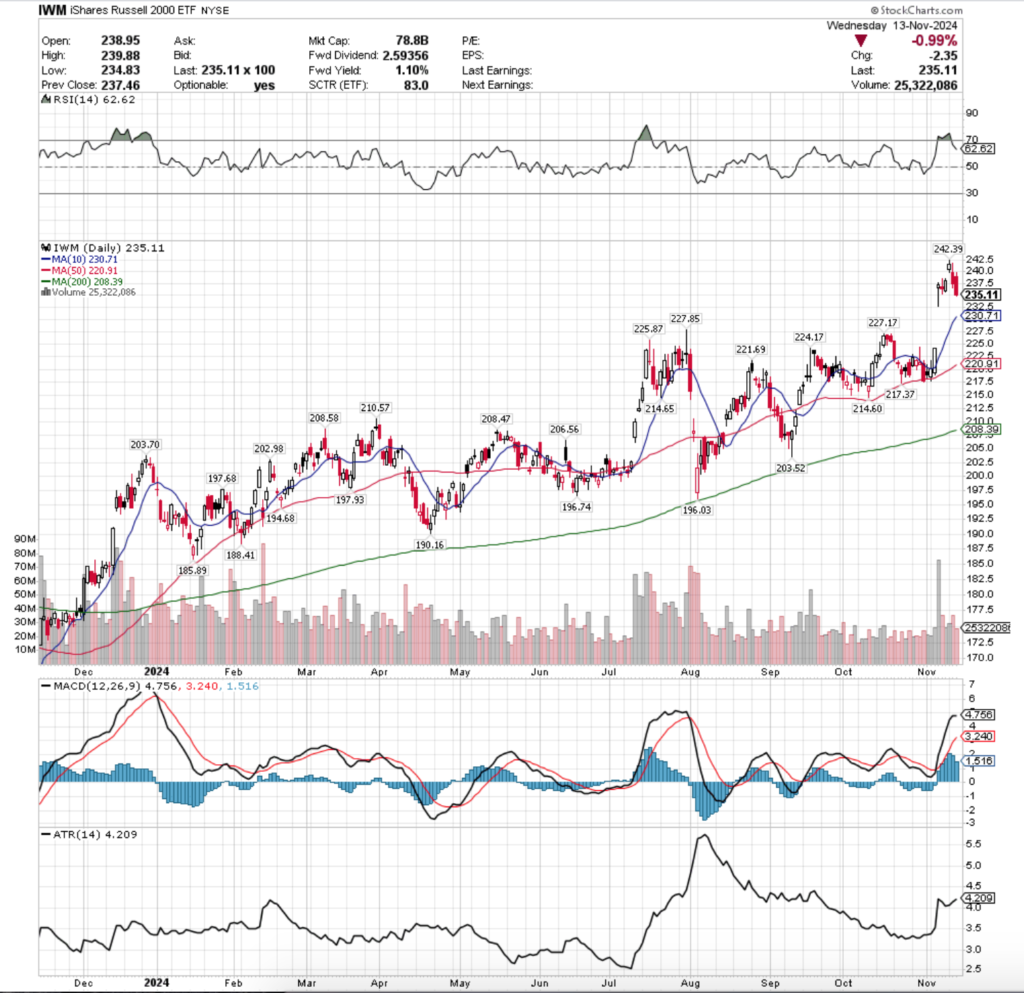
IWM ETF – iShares Russell 2000 ETF’s Technical Performance Over The Past Year
Their RSI is near the neutral 50 mark & sits at 52.09, while their MACD is bearishly approaching the signal line & looks set to cross over it early this week.
Volumes were -7.19% below the previous year’s average level (30,872,000 vs. 33,265,375), which is rare to see these days, as IWM has been trading at higher volume levels than it had been seven months ago (unlike SPY & QQQ).
Unlike SPY & QQQ, WM’s week kicked off on an advancing session that reached a new all-time high, but it was on low volume & resulted in a spinning top candle which means that there was a bit of uncertainty among market participants.
This led to the avalanche of tall red candles that came throughout the rest of the week, as investors took their profits from the previous week & went running.
Thursday’s session saw a temporary breakdown of the 10 DMA’s support, which led to Friday’s open below it & continued move downward towards near the $227.50/share level ($227.81).
IWM’s closing level on Friday sits right atop the $227/share support zone, but the window created by last Wednesday is still sitting open & the past couple of weeks have shown both the tops & bottoms of IWM’s trading begin to close up & narrow, indicating that there is an added degree of uncertainty in the market right now.
Should the window continue to close, the 50 Day Moving Average will become the place of focus as it continues moving higher & will likely be near the bottom of the window by the time a test comes.
The first four support levels from Friday’s close have been seller dominated 2:1 over the past 3-4 years.
As for the upside, if IWM breaks above its 10 DMA the only resistance level above it is the all-time high, which it will need some strong volume to break above.
This may prove difficult, given that IWM’s current average prior year’s volume is already higher than it was seven months ago, which is not the case for SPY or QQQ.
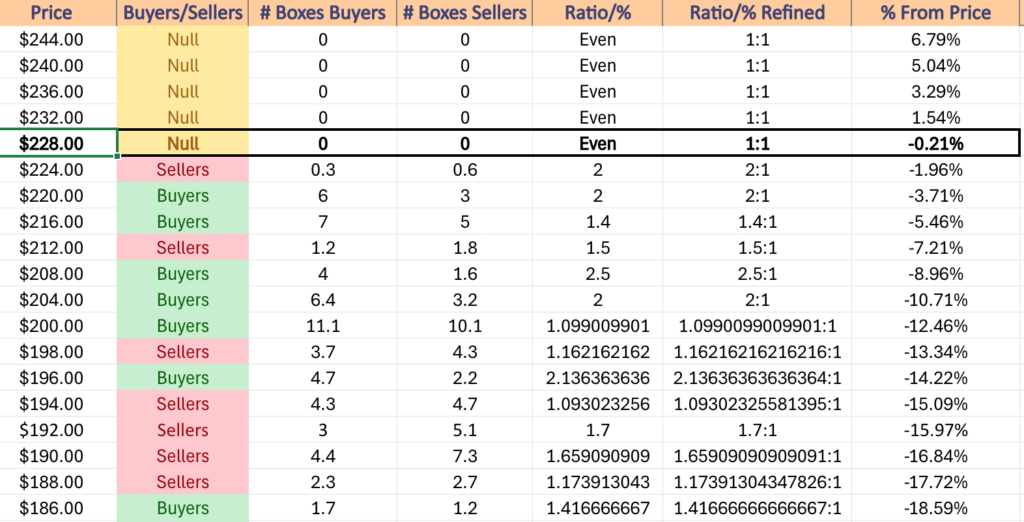
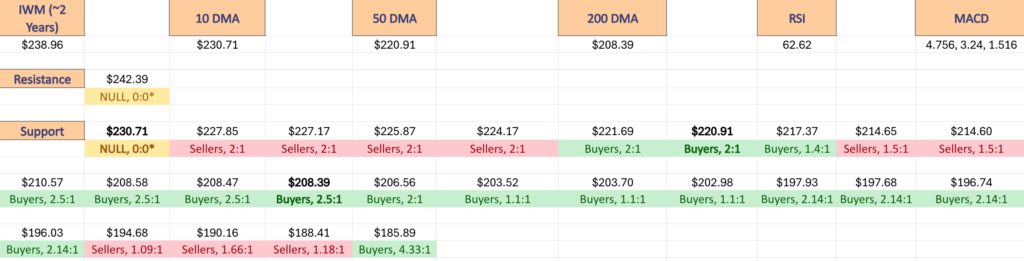
IWM has support at the $227.85 (Volume Sentiment: Sellers, 2:1), $227.17 (Volume Sentiment: Sellers, 2:1), $225.87 (Volume Sentiment: Sellers, 2:1) & $224.17/share (Volume Sentiment: Sellers, 2:1) price levels, with resistance at the $233.07 (10 Day Moving Average, Volume Sentiment: NULL, 0:0*) & $243.39/share (All-Time High, Volume Sentiment: NULL, 0:0*) price levels.
IWM ETF’s Price Level:Volume Sentiment Over The Past ~2 Years
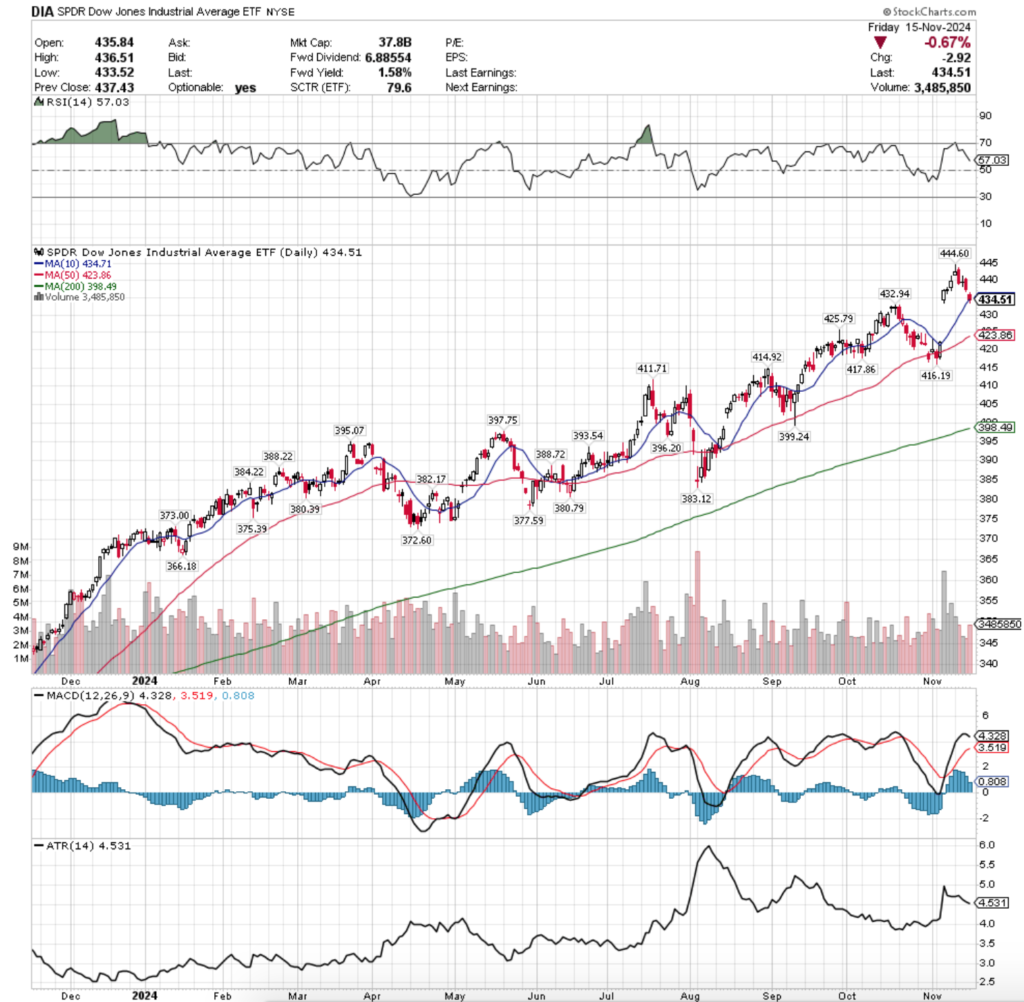
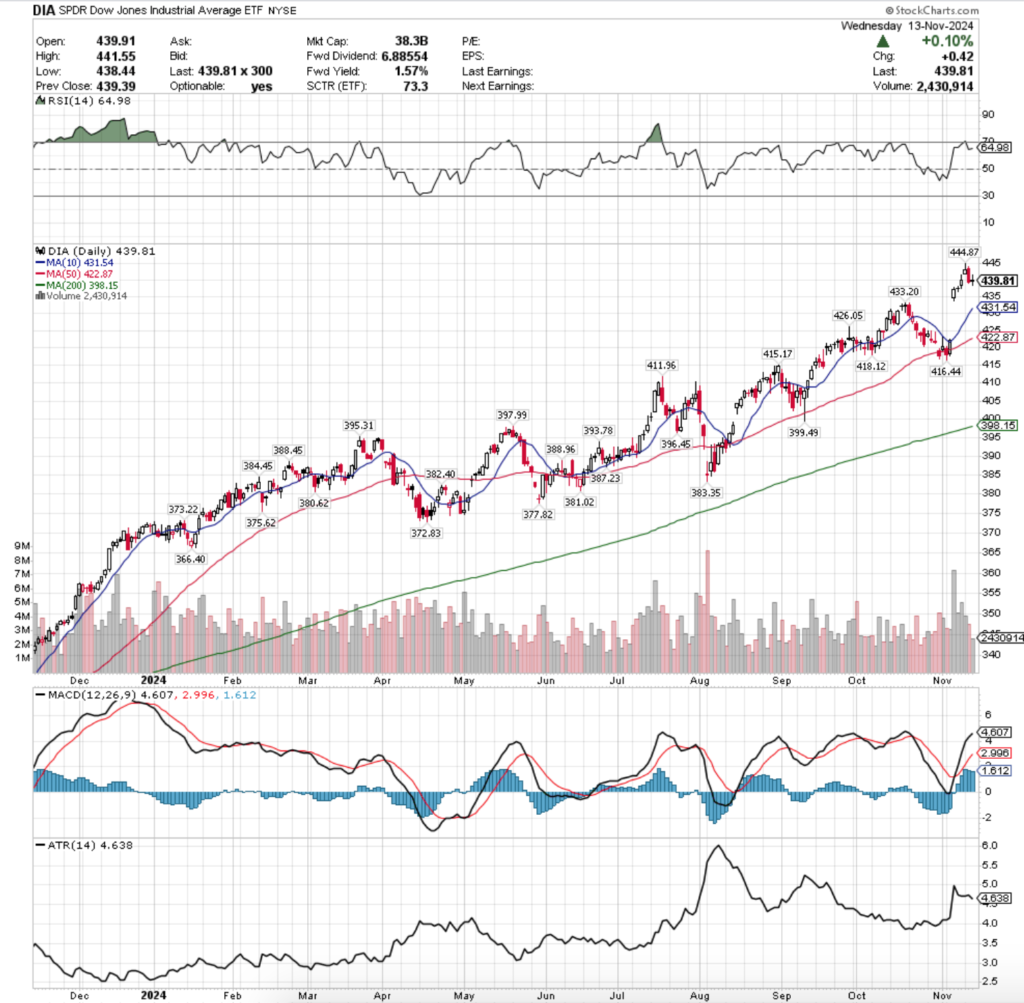
DIA ETF – SPDR Dow Jones Industrial Average ETF’s Technical Performance Over The Past Year
Their RSI is trending back down towards neutral & sits currently at 57.03, while their MACD has curled over bearishly & looks primed to cross through the signal line by mid-week.
Volumes were -8.4% below the prior year’s average (3,162,000 vs. 3,451,937), as investors are skittish, but still wetting their beaks on the blue chip index’s components.
Monday kicked off the week with a shooting star candle (bearish) with a new all-time high for DIA.
Tuesday set the stage for some hard times to come, when a bearish engulfing candle sent DIA below the $440/share level before Wednesday’s doji candle that finished relatively in line with Tuesday’s close.
Wednesday the pain continued, as DIA opened higher before another wide-range bearish engulfing candle came from the day’s session, which led to the pain DIA felt Friday when prices gapped down & continued lower after the open to close just below the resistance of the 10 day moving average.
Tomorrow will be an interesting day, as NVDA’s earnings do not directly impact DIA or IWM as they are not a component of those indexes, which will be something for folks to keep in mind over the coming two days of trading.
DIA has a large window from the previous week to fill in on the downside, with their all-time high being the only resistance level, but one that will be a formidable level to break above.
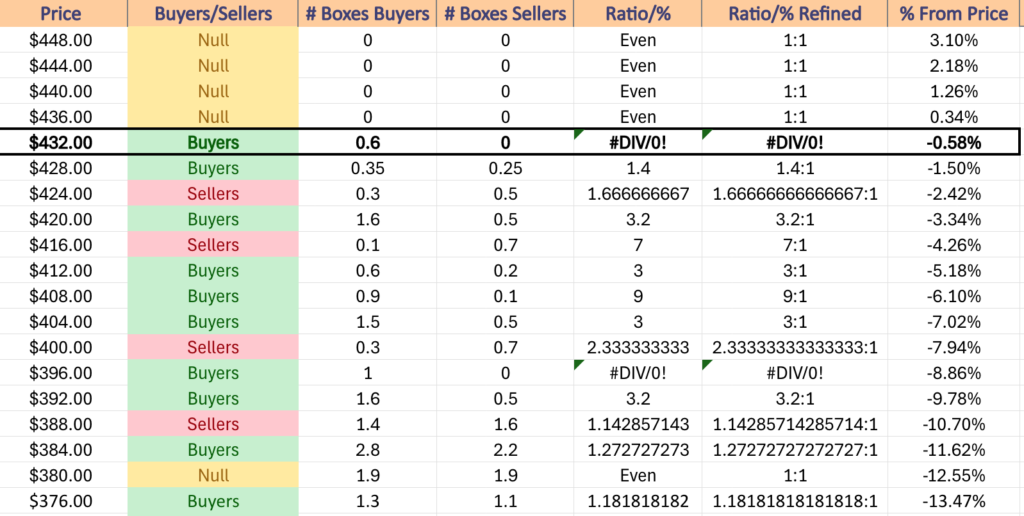
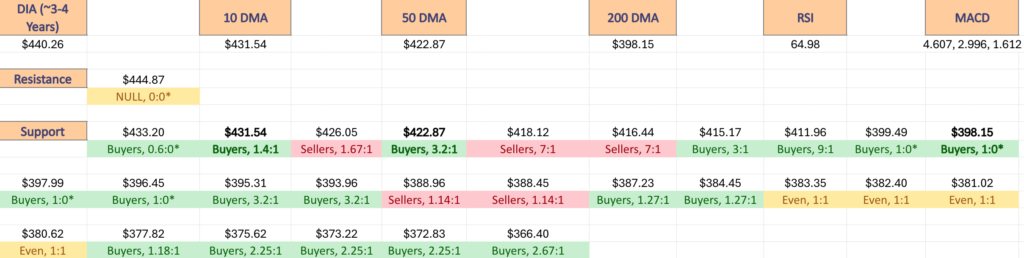
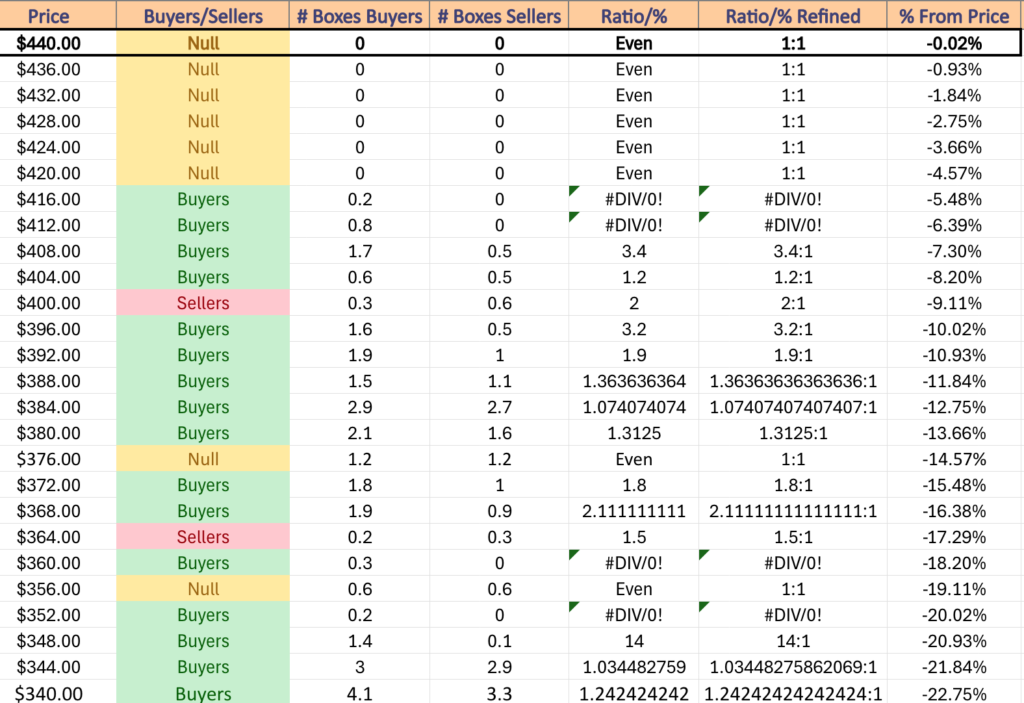
DIA has support at the $432.94 (Volume Sentiment: Buyers, 0.6:0*), $425.79 (Volume Sentiment: Sellers, 1.67:1), $423.86 (50 Day Moving Average, Volume Sentiment: Buyers, 3.2:1) & $417.86/share (Volume Sentiment: Sellers, 7:1) price levels, with resistance at the $434.71 (10 Day Moving Average, Volume Sentiment: Buyers, 0.6:0*) & $444.60/share (All-Time High, Volume Sentiment: NULL, 0:0*) price levels.
DIA ETF’s Price Level:Volume Sentiment Over The Past 3-4 Years
The Week Ahead
Home Builder Confidence Index data & Fed President Goolsbee speaking are Monday morning’s big market data, each coming in at 10 am.
Monday morning kicks off with reports from Brady (BRC) & Twist Bioscience, followed by AECOM, BellRing Brands & Symbiotic after the session’s close.
Tuesday morning features Housing Starts & Building Permits data at 8:30 am, followed by Fed President Goolsbee speaking again at 12:25 pm.
Walmart, Amer Sports, Energizer, Jacobs Solutions, Lowe’s, Medtronic, Oaktree Specialty Lending Corp, Viking Holdings, Vipshop & Weibo report earnings before the opening bell on Tuesday, with Alcon, AZEK, Dolby Labs, Golub Capital, Keysight, La-Z-Boy, Powell Industries, Varex Imaging & ZTO Express set to report after the closing bell.
Wednesday is another Fed speaker day, with Governor Cooks speaking at 11 am & Governor Bowman speaking at 12:15 pm.
Wednesday morning’s earnings reports include Berry Global, Dycom, Global-E Online, Nio, Spire, Target, TJX Companies & Wix.com, followed by NVDA, Copa Holdings, Jack In The Box, Maximus, Palo Alto Networks, Snowflake & Sociedad Quimica y Minera after the session’s closing bell.
Thursday begins with Initial Jobless Claims & Philadelphia Fed Manufacturing Survey Data at 8:30 am, Fed President Hammack speaking at 8:45 am, Existing Home Sales & Leading Economic Index data reported at 10 am, Fed President Schmid speaking at 1:10 pm & Fed Vice Chair For Supervision Barr speaking at 4:40 pm.
Deere & Company, Atkore International, BJ’s Wholesale, KE Holdings, Shoe Carnival, Vestis & Warner Music Group report earnings on Thursday morning before the session’s open, with Copart, Elastic, Gap, Intuit, Ross Stores & UGI Group reporting after the close.
S&P Flash U.S. Services PMI & S&P Flash U.S. Manufacturing PMI data come out Friday morning at 9:45 am, followed by Consumer Sentiment (final) data at 10 am & Fed Governor Bowman speaking at 6:15 pm.
Friday’s primary earnings report is Buckle before the session’s open.
See you back here next week!
*** I DO NOT OWN SHARES OR OPTIONS CONTRACT POSITIONS IN SPY, QQQ, IWM OR DIA AT THE TIME OF PUBLISHING THIS ARTICLE ***
The VIX closed at 16.14, indicating an implied one day move of +/-1.02% & an implied one month move of +/-4.67% for the S&P 500.
Highest Technical Rated S&P 500 Components Per 11/15/2024’s Close:
1 – PLTR
2 – AXON
3 – UAL
4 – VST
5 – TSLA
6 – TRGP
7 – RCL
8 – CCL
9 – FICO
10 – SYF
Lowest Technical Rated S&P 500 Components Per 11/15/2024’s Close:
1 – SMCI
2 – MRNA
3 – CE
4 – ENPH
5 – EL
6 – QRVO
7 – MPWR
8 – WBA
9 – DG
10 – REGN
Highest Volume Rated S&P 500 Components Per 11/15/2024’s Close:
1 – OMC
2 – LDOS
3 – DLTR
4 – JNPR
5 – FRT
6 – MRNA
7 – REG
8 – IEX
9 – JKHY
10 – PFE
Lowest Volume Rated S&P 500 Components Per 11/15/2024’s Close:
1 – VST
2 – MMM
3 – DECK
4 – CMG
5 – UAL
6 – DELL
7 – LULU
8 – EQT
9 – RL
10 – WDC
Highest Technical Rated ETFs Per 11/15/2024’s Close:
1 – TSLR
2 – TSLL
3 – TSLT
4 – CONL
5 – BITW
6 – BITX
7 – VCAR
8 – MSTX
9 – DPST
10 – PTIR
Lowest Technical Rated ETFs Per 11/15/2024’s Close:
1 – TSLZ
2 – TSDD
3 – MSOX
4 – TSLQ
5 – MRNY
6 – NVDQ
7 – NVD
8 – TSLS
9 – SMCX
10 – SMST
Highest Volume Rated ETFs Per 11/15/2024’s Close:
1 – GNOV
2 – SNOV
3 – QLVD
4 – SPUC
5 – XHYC
6 – AGIH
7 – IPDP
8 – DJAN
9 – RODE
10 – RHTX
Lowest Volume Rated ETFs Per 11/15/2024’s Close:
1 – EMCS
2 – OVLH
3 – CPNJ
4 – VMAX
5 – FDCE
6 – USCA
7 – BHYB
8 – FDTB
9 – QMMY
10 – FDVL
Highest Technical Rated General Stocks Per 11/15/2024’s Close:
1 – BTCT
2 – DRUG
3 – QUBT
4 – PULM
5 – AGFY
6 – NXL
7 – BTCS
8 – MNPR
9 – SEZL
10 – IONQ
Lowest Technical Rated General Stocks Per 11/15/2024’s Close:
1 – EFSH
2 – SYRS
3 – TRNR
4 – GCTK
5 – ADTX
6 – TFFP
7 – YELLQ
8 – TCBP
9 – PET
10 – JTAI
Highest Volume Rated General Stocks Per 11/15/2024’s Close:
1 – CYCN
2 – AREN
3 – OUT
4 – SLG
5 – BENF
6 – MAMA
7 – GREE
8 – TFFP
9 – ASST
10 – MI
Lowest Volume Rated General Stocks Per 11/15/2024’s Close:
1 – BBSRF
2 – VASO
3 – VRDR
4 – WVMDF
5 – VLERF
6 – ARESF
7 – BREA
8 – VSME
9 – MTLFF
10 – CNFN
*** THE LIST ABOVE IS STRICTLY FOR INFORMATIONAL PURPOSES – I MAY OR MAY NOT HAVE OR INITIATE A LONG, SHORT, OR LONG/SHORT POSITION IN ANY NAME ABOVE AT ANY TIME ***
Markets have continued to grind higher though in the face of the US Presidential Election, bad weather events causing widespread damage & today’s PPI print coming in hotter than expected after two straight consecutive rate cuts & all of the major index ETFs sit near their all-time highs.
The VIX is currently at 14.13 after remaining elevated for the month of October & now shows an implied one day move of +/-0.89% & an implied one month move of +/-4.08%.
With the election results seeming to have calmed the market’s nerves quite a bit it is time to run through the Buyer:Seller sentiment at each price level that the major indexes have traded at over the past few years.
This may shed light into how market participants will behave if the same price levels are entered/re-tested again in the near future.
As noted in the last note, due to the markets being near all-time highs there are many price levels that lack enough information to make a reading on, but that have been traded at, which will be denoted as “NULL”, most of which occur near the extreme highs & lows of the listed ranges below.
Each section below contains a view of each index ETF’s chart (for a technical breakdown of each ETF’s chart please see this past weekend’s market review note), as well as a list of their current one year support & resistance levels with the volume sentiment noted beneath it on the table.
There is an additional table beneath this table with each price level’s sentiment, as well as a typed text version below that is able to be copied & pasted.
Note that “NULL, 0:0*” values denote areas that each name has traded at but with limited volume data to work with from a comparison standpoint in terms of creating a ratio of buyers:sellers (or vice versa).
Also, prices that do have a ratio of Buyers:Sellers (Sellers:Buyers) where the denominator is 0 are denoted with an asterisk “*” as well.
In the written lists of the price levels & volume sentiments the price levels that contain support & resistance levels are marked in BOLD.
Recall that at price extremes such as the highs that we have recently hit there will tend to be skewed data due to the small sample size & factor that into how you interpret each price level’s reported sentiment.
This is intended to serve as an additional tool, similar to a barometer to use during your due diligence process & is not meant to replace doing your own research & is not financial advice.
Price Level:Volume Sentiment Analysis For SPY, The SPDR S&P 500 ETF
SPY ETF – SPDR S&P 500 ETF’s Technical Performance Over The Past Year
SPY, the SPDR S&P 500 ETF enjoyed a massive gap up following the election after spending most of October straddling its 10 day moving average.
Since Tuesday it has shown that folks are beginning to take profits following the move upward, which has all eyes looking at the window created by the post-election gap up.
There are two support levels near the lower end of the gap, one of which being the 10 day moving average which continues higher on a daily basis.
While this may help slow any declines, should the support & the $586-level be broken the next stop is the 50 DMA’s support.
With this in mind, it is worth looking at how investors have behaved over the past few years at each price level to see if it lends clues into how they may choose to behave again in the near-future.
Below is a list of the volume sentiments at each price level SPY has traded at over the past 2-3 years.
SPY ETF’s Price Level:Volume Sentiment Over The Past ~2 Years At One Year Support/Resistance Levels
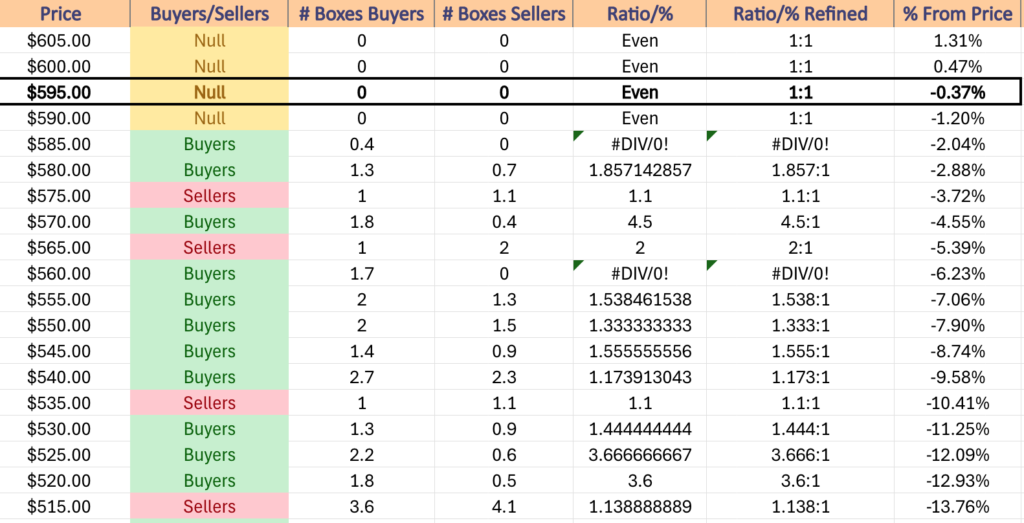
SPY ETF’s Price Level:Volume Sentiment Over The Past ~2 Years
Price Level:Volume Sentiment For SPY ETF Over The Past ~2 Years
Price Level:Volume Sentiment For SPY ETF Over The Past ~2 Years
SPY ETF’s Price Level:Volume Sentiment Over The Past ~2 Years
$605 -NULL – 0:0*, +1.31% From Current Price Level
$600 – NULL – 0:0*, +0.47% From Current Price Level – All-Time High*
$595 – NULL – 0:0*, -0.37% From Current Price Level – Current Price Level*
$590 – NULL – 0:0*, -1.2% From Current Price Level
$585 – Buyers – 0.4:0*, -2.04% From Current Price Level – 10 Day Moving Average*
$580 – Buyers – 1.86:1, -2.88% From Current Price Level
$575 – Sellers – 1.1:1, -3.72% From Current Price Level
$570 – Buyers – 4.5:1, -4.55% From Current Price Level – 50 Day Moving Average*
$565 – Sellers – 2:1, -5.39% From Current Price Level
$560 – Buyers – 1.7:0*, -6.23% From Current Price Level
$555 – Buyers – 1.54:1, -7.06% From Current Price Level
$550 – Buyers – 1.33:1, -7.9% From Current Price Level
$545 – Buyers – 1.56:1, -8.74% From Current Price Level
$540 – Buyers – 1.17:1, -9.58% From Current Price Level
$535 – Sellers – 1.1:1, -10.41% From Current Price Level – 200 Day Moving Average*
$530 – Buyers – 1.44:1, -11.25% From Current Price Level
$525 – Buyers – 3.67:1, -12.09% From Current Price Level
$520 – Buyers – 3.6:1, -12.93% From Current Price Level
$515 – Sellers – 1.14:1, -13.76% From Current Price Level
$510 – Buyers – 1.67:1, -14.6% From Current Price Level
$505 – Sellers – 1.43:1, -15.44% From Current Price Level
$500 – Buyers – 1.04:1, -16.27% From Current Price Level
$496 – Sellers – 1.75:1, -16.94% From Current Price Level
$492 – Buyers – 1.14:1, -17.61% From Current Price Level
$488 – Buyers – 1.43:1, -18.28% From Current Price Level
$484 – Buyers – 1.25:1, -18.95% From Current Price Level
$480 -Buyers – 2.17:1, -19.62% From Current Price Level
$476 – Buyers – 1.5:1, -20.29% From Current Price Level
$472 – Buyers – 2.2:0*, -20.96% From Current Price Level
$468 – Sellers – 1.38:1, -21.63% From Current Price Level
$464 – Even – 1:1, -22.3% From Current Price Level
$460 – Sellers – 1.83:1, -22.97% From Current Price Level
$456 – Buyers – 0.4:0*, -23.64% From Current Price Level
$452 – Buyers – 2.9:0*, -24.31% From Current Price Level
$448 – Buyers – 1.22:1, -24.98% From Current Price Level
$444 – Buyers – 3.25:1, -25.65% From Current Price Level
$440 – Buyers – 1.7:1, -26.32% From Current Price Level
$436 – Buyers 1.03:1, -26.99% From Current Price Level
$432 – Buyers – 1.22:1, -27.66% From Current Price Level
$428 – Buyers – 1.38:1, -28.33% From Current Price Level% From Current Price Level
$424 – Sellers – 1.63:1, -29% From Current Price Level
$420 – Sellers – 1.23:1, -29.67% From Current Price Level
$416 – Buyers – 2.5:1, -30.34% From Current Price Level
$412 – Buyers – 2.18:1, -31.01% From Current Price Level
$408 – Buyers – 1.03:1, -31.68% From Current Price Level
$404 – Buyers – 2.42:1, -32.35% From Current Price Level
$400 – Buyers – 1.15:1, -33.02% From Current Price Level
$396 – Sellers – 2.31:1, -33.69% From Current Price Level
$392 – Buyers – 1.4:1, -34.36% From Current Price Level
$388 – Buyers – 1.72:1, -35.03% From Current Price Level
$384 – Buyers – 1.73:1, -35.7% From Current Price Level
$380 – Sellers – 1.53:1, -36.37% From Current Price Level
$376 – Sellers – 2.68:1, -37.04% From Current Price Level
$372 – Sellers – 1.97:1, -37.71% From Current Price Level
$368 – Sellers – 1.41:1, -38.38% From Current Price Level
$364 – Sellers – 1.73:1, -39.05% From Current Price Level
$360 – Sellers – 2.1:1, -39.72% From Current Price Level
$356 – Buyers – 1.73:1, -40.39% From Current Price Level
$352 – Sellers – 2.35:1, -41.06% From Current Price Level
$348 – Sellers – 0.6:0*, -41.73% From Current Price Level
$344 – Sellers – 0.8:0*, -42.4% From Current Price Level
$340 – NULL – 0:0*, -43.07% From Current Price Level
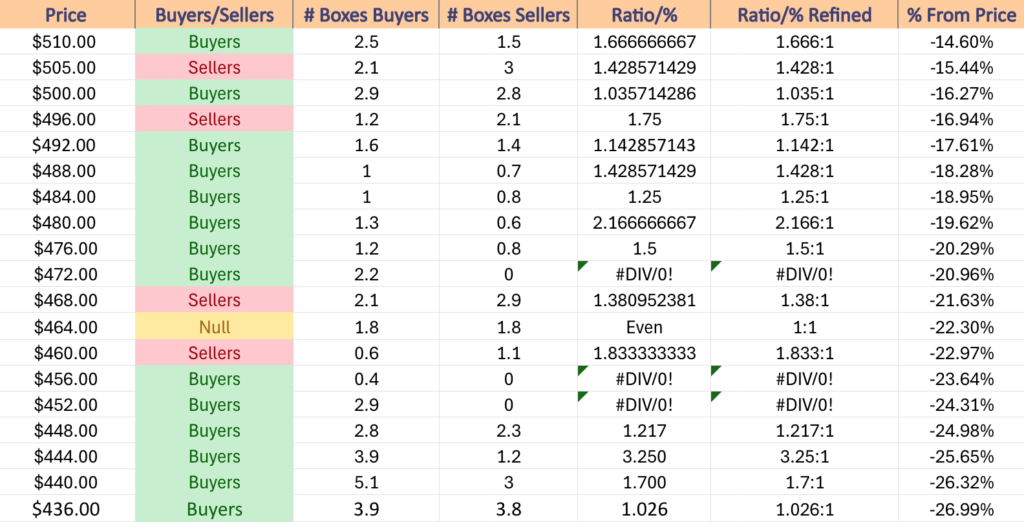
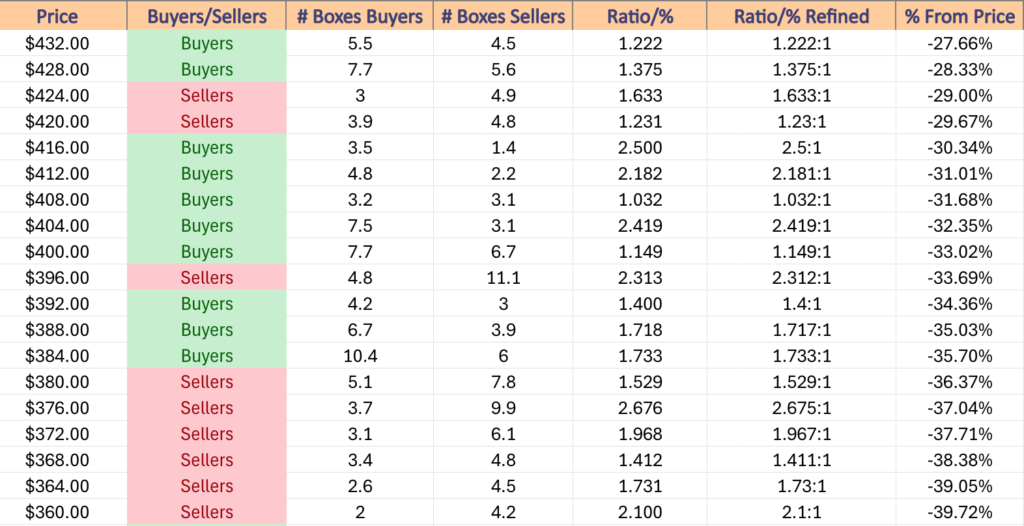
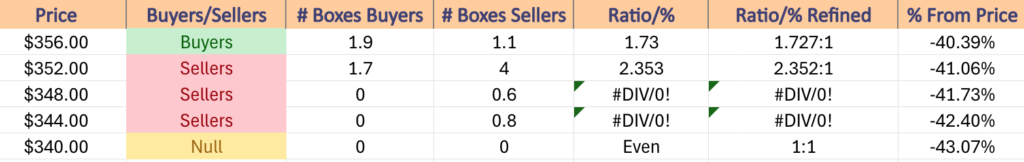
Price Level:Volume Sentiment Analysis For QQQ, The Invesco QQQ Trust ETF
QQQ ETF – Invesco QQQ ETF’s Technical Performance Over The Past Year
QQQ, the Invesco QQQ Trust ETF that tracks the NASDAQ 100 has enjoyed a similar post-election jump to SPY & also sits just off of all-time highs that were set on Monday.
Much like SPY they have also traded on weak volume recently, as there is indeed a bit of hesitancy among market participants to dive into the pool near such high price levels.
QQQ has more local support levels than SPY after the declines of July forced a slower recovery & consolidations that created more support/resistance touch-points.
Still, it is important to understand how they’ve traded historically at the price levels of the past few years, especially given the two gap ups that created two windows last week.
Below is QQQ’s volume sentiment at each price level it has traded at for the past 2-3 years, as well as their support & resistance levels with the sentiments noted.
QQQ ETF’s Price Level:Volume Sentiment Over The Past ~2 Years At One Year Support/Resistance Levels
QQQ ETF’s Price Level:Volume Sentiment Over The Past ~2 Years
Price Level:Volume Sentiment For QQQ ETF Over The Past ~2 Years
Price Level:Volume Sentiment For QQQ ETF Over The Past ~2 Years
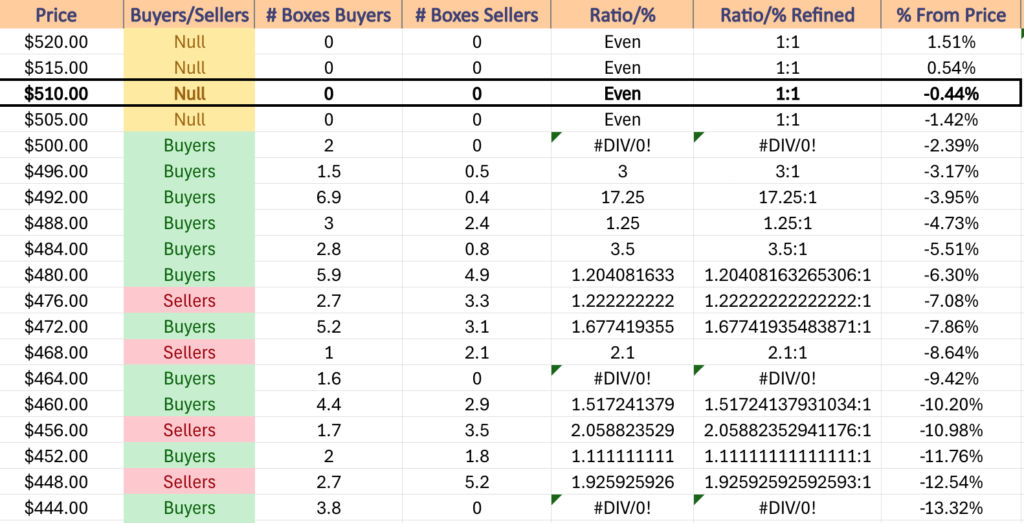
QQQ ETF’s Price Level:Volume Sentiment Over The Past ~2 Years
$520 – NULL – 0:0*, +1.51% From Current Price Level
$515 – NULL – 0:0*, +0.54% From Current Price Level – All-Time High*
$510 – NULL – 0:0*, -0.44% From Current Price Level – Current Price Level*
$505 – NULL – 0:0*, -1.42% From Current Price Level
$500 – Buyers – 2:0*, -2.39% From Current Price Level – 10 Day Moving Average*
$496 – Buyers – 3:1, -3.17% From Current Price Level
$492 – Buyers – 17.25:1, -3.95% From Current Price Level
$488 – Buyers – 1.25:1, -4.73% From Current Price Level
$484 – Buyers – 3.5:1, -5.51% From Current Price Level – 50 Day Moving Average*
$480 – Buyers – 1.2:1, -6.3% From Current Price Level
$476 – Sellers – 1.22:1, -7.08% From Current Price Level
$472 – Buyers – 1.68:1, -7.86% From Current Price Level
$468 – Sellers – 2.1:1, -8.64% From Current Price Level
$464 – Buyers – 1.6:0*, -9.42% From Current Price Level
$460 – Buyers – 1.52:1, -10.2% From Current Price Level – 200 Day Moving Average*
$456 – Sellers – 2.06:1, -10.98% From Current Price Level
$452 – Buyers – 1.11:1, -11.76% From Current Price Level
$448 – Sellers – 1.93:1, -12.54% From Current Price Level
$444 – Buyers – 3.8:0*, -13.32% From Current Price Level
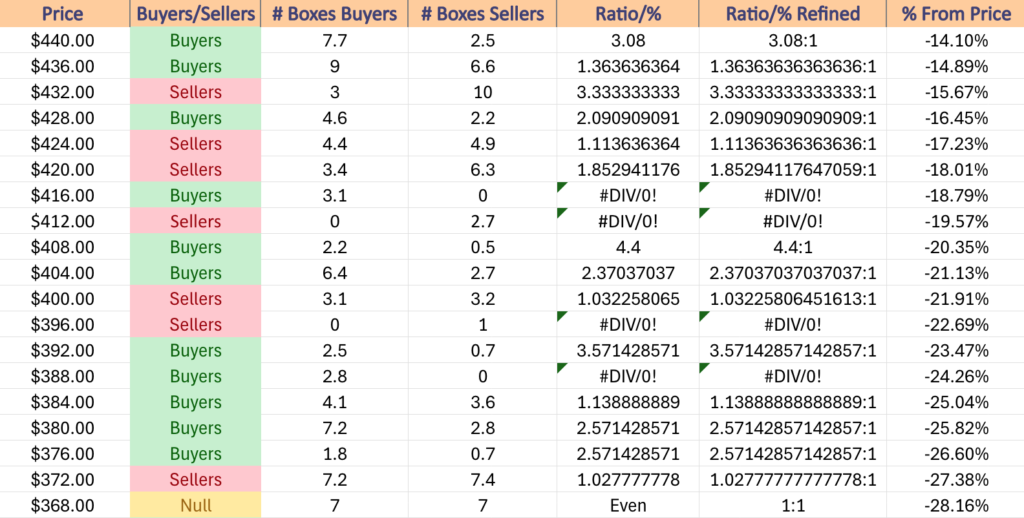
$440 – Buyers – 3.08:1, -14.1% From Current Price Level
$436 – Buyers – 1.36:1, -14.89% From Current Price Level
$432 – Sellers – 3.33:1, -15.67% From Current Price Level
$428 – Buyers – 2.09:1, -16.45% From Current Price Level
$424 – Sellers – 1.11:1, -17.23% From Current Price Level
$420 – Sellers – 1.85:1, -18.01% From Current Price Level
$416 – Buyers – 3.1:0*, -18.79% From Current Price Level
$412 – Sellers – 2.7:0*, -19.57% From Current Price Level
$408 – Buyers – 4.4:1, -20.35% From Current Price Level
$404 – Buyers – 2.37:1, -21.13% From Current Price Level
$400 – Sellers – 1.03:1, -21.91% From Current Price Level
$396 – Sellers – 1:0*, -22.69% From Current Price Level
$392 – Buyers – 3.57:1, -23.47% From Current Price Level
$388 – Buyers – 2.8:0*, -24.26% From Current Price Level
$384 – Buyers – 1.14:1, -25.04% From Current Price Level
$380 – Buyers – 2.57:1, -25.82% From Current Price Level
$376 – Buyers – 2.57:1, -26.6% From Current Price Level
$372 – Sellers – 1.03:1, -27.38% From Current Price Level
$368 – Even – 1:1, -28.16% From Current Price Level
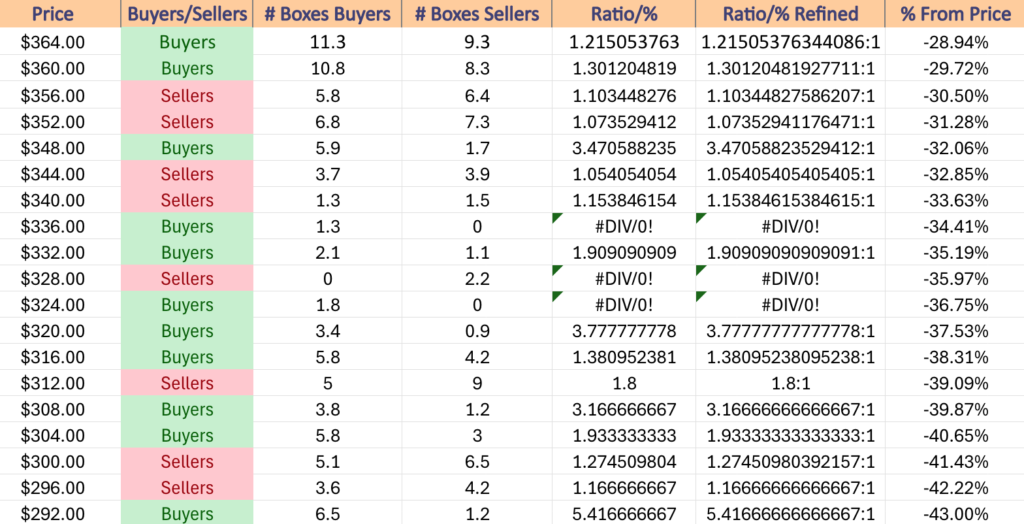
$364 – Buyers – 1.22:1, -28.94% From Current Price Level
$360 – Buyers – 1.3:1, -29.72% From Current Price Level
$356 – Sellers – 1.1:1, -30.5% From Current Price Level
$352 – Sellers – 1.07:1, -31.28% From Current Price Level
$348 – Buyers – 3.47:1, -32.06% From Current Price Level
$344 – Sellers – 1.05:1, -32.85% From Current Price Level
$340 – Sellers – 1.15:1, -33.63% From Current Price Level
$336 – Buyers – 1.3:0*, -34.41% From Current Price Level
$332 – Buyers – 1.91:1, -35.19% From Current Price Level
$328 – Sellers – 2.2:0*, -35.97% From Current Price Level
$324 – Buyers – 1.8:0*, -36.75% From Current Price Level
$320 – Buyers – 3.78:1, -37.53% From Current Price Level
$316 – Buyers – 1.38:1, -38.31% From Current Price Level
$312 – Sellers – 1.8:1, -39.09% From Current Price Level
$308 – Buyers – 3.17:1, -39.87% From Current Price Level
$304 – Buyers – 1.93:1, -40.65% From Current Price Level
$300 – Sellers – 1.28:1, -41.43% From Current Price Level
$296 – Sellers – 1.17:1, -42.22% From Current Price Level
$292 – Buyers – 5.42:1, -43% From Current Price Level
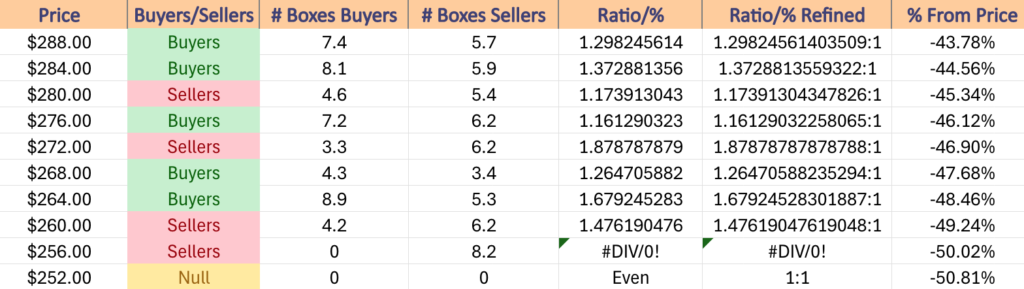
$288 – Buyers – 1.3:1, -43.78% From Current Price Level
$284 – Buyers – 1.37:1, -44.56% From Current Price Level
$280 – Sellers – 1.17:1, -45.34% From Current Price Level
$276 – Buyers – 1.16:1, -46.12% From Current Price Level
$272 – Sellers – 1.88:1, -46.9% From Current Price Level
$268 – Buyers – 1.27:1, -47.68% From Current Price Level
$264 – Buyers – 1.68:1, -48.46% From Current Price Level
$260 – Sellers – 1.48:1, -49.24% From Current Price Level
$256 – Sellers – 8.2:0*, -50.02% From Current Price Level
$252 – NULL – 0:0*, -50.81% From Current Price Level
Price Level:Volume Sentiment Analysis For IWM, The iShares Russell 2000 ETF
IWM ETF – iShares Russell 2000 ETF’s Technical Performance Over The Past Year
IWM, the iShares Russell 2000 ETF was the biggest winner of the major four index ETFs over the past week in terms of their post-election gap up.
They enjoy a number of support levels just below the window that was created by that gap which will benefit them in the face of a decline.
Unlike the prior two ETFs, IWM’s recently weekly volumes have been higher when compared to their prior year’s average volume vs. seven months ago when the same comparison was made, indicating that there has been a rotation towards smaller cap names vs. SPY & QQQ components.
Still, this doesn’t make them immune to any drawdowns & it is worth reviewing the tables below to understand how market participants have felt at the price levels they’ve traded at.
This index trades in a much more consolidated range-bound fashion & slowly advances while oscillating around a price range compared to how SPY & QQQ trade, so their list of price levels for the past 2-3 years is shorter than the previous two ETFs.
IWM ETF’s Price Level:Volume Sentiment Over The Past ~2 Years At One Year Support/Resistance Levels
IWM ETF’s Price Level:Volume Sentiment Over The Past ~2 Years
Price Level:Volume Sentiment For IWM ETF Over The Past ~2 Years
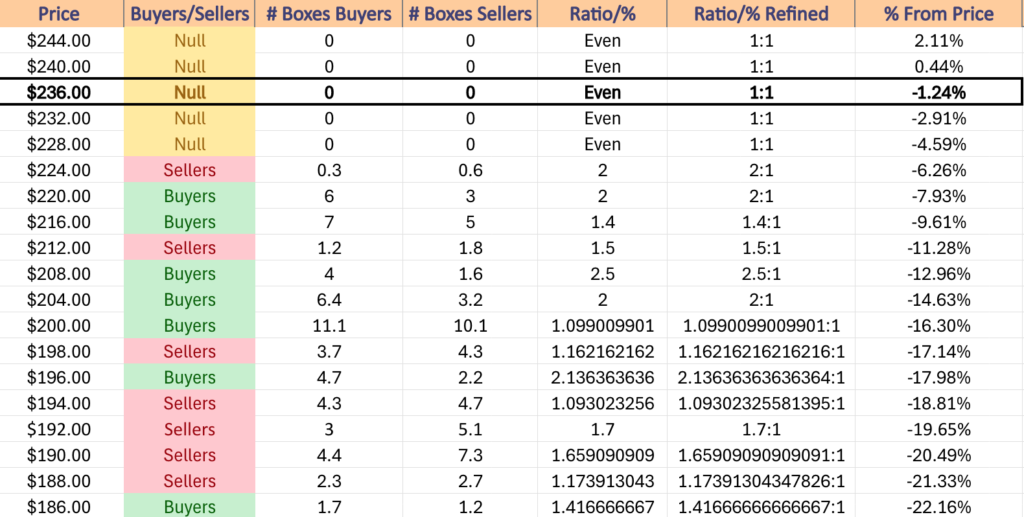
$244 – NULL – 0:0*, +2.11% From Current Price Level
$240 – NULL – 0:0*, +0.44% From Current Price Level – All Time High*
$236 – NULL – 0:0*, -1.24% From Current Price Level – Current Price Level*
$232 – NULL – 0:0*, -2.91% From Current Price Level
$228 – NULL – 0:0*, -4.59% From Current Price Level – 10 Day Moving Average*
$224 – Sellers – 2:1, -6.26% From Current Price Level
$220 – Buyers – 2:1,-7.93% From Current Price Level – 50 Day Moving Average*
$216 – Buyers – 1.4:1, -9.61% From Current Price Level
$212 – Sellers – 1.5:1, -11.28% From Current Price Level
$208 – Buyers – 2.5:1, -12.96% From Current Price Level – 200 Day Moving Average*
$204 – Buyers – 2:1, -14.63% From Current Price Level
$200 – Buyers – 1.1:1, -16.3% From Current Price Level
$198 – Sellers – 1.16:1, -17.14% From Current Price Level
$196 – Buyers – 2.14:1, -17.98% From Current Price Level
$194 – Sellers – 1.09:1, -18.81% From Current Price Level
$192 – Sellers – 1.7:1, -19.65% From Current Price Level
$190 – Sellers – 1.66:1, -20.49% From Current Price Level
$188 – Sellers – 1.17:1, -21.33% From Current Price Level
$186 – Buyers – 1.42:1, -22.16% From Current Price Level
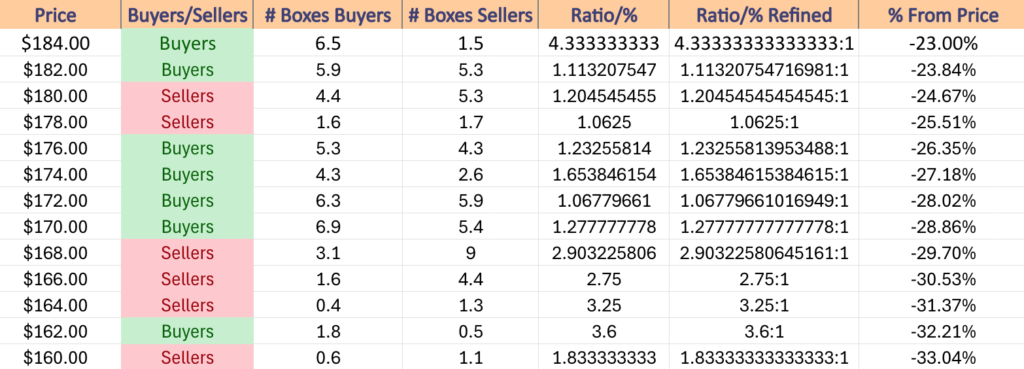
$184 – Buyers – 4.33:1, -23% From Current Price Level
$182 – Buyers – 1.11:1, -23.84% From Current Price Level
$180 – Sellers – 1.2:1, -24.67% From Current Price Level
$178 – Sellers – 1.06:1, -25.51% From Current Price Level
$176 – Buyers – 1.23:1, -26.35% From Current Price Level
$174 – Buyers – 1.65:1, -27.18% From Current Price Level
$172 – Buyers – 1.07:1, -28.02% From Current Price Level
$170 – Buyers – 1.28:1, -28.86% From Current Price Level
$168 – Sellers – 2.9:1, -29.7% From Current Price Level
$166 – Sellers – 2.75:1, -30.53% From Current Price Level
$164 – Sellers – 3.25:1, -31.37% From Current Price Level
$162 – Buyers – 3.6:1, -32.21% From Current Price Level
$160 – Sellers – 1.83:1, -33.04% From Current Price Level
Price Level:Volume Sentiment Analysis For DIA, The SPDR Dow Jones Industrial Average ETF
DIA ETF – SPDR Dow Jones Industrial Average ETF’s Technical Performance Over The Past Year
For much of the past year DIA, the SPDR Dow Jones Industrial Average ETF has traded in a more similar, oscillating with steady growth upwards manner than IWM, vs. the more rapid ascents of SPY & QQQ.
While they do not share as many local support levels as IWM, the resiliency of the blue chip DIA index shows that there are plenty of places for it to find footing in the face of a decline.
Investors have continued to buy into the blue chip names forcing DIA higher, which will be interesting to see the reactions to in the event of some type of sell-off in the near-future.
For now though, it is important to understand where the Buyers have met the Sellers over the past few years & in what capacity in order to formulate how strong support levels may be in the event of declines.
DIA ETF’s Price Level:Volume Sentiment Over The Past 3-4 Years At One Year Support/Resistance Levels
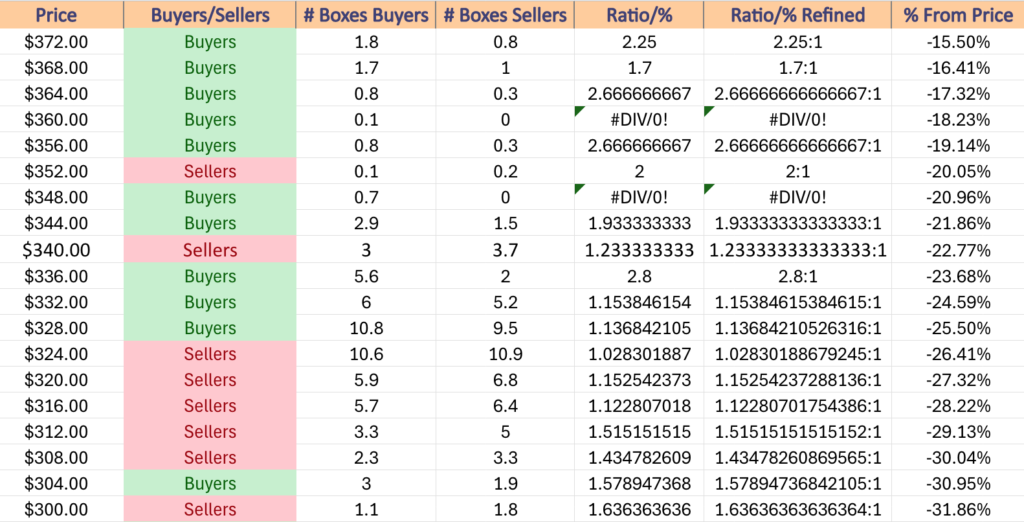
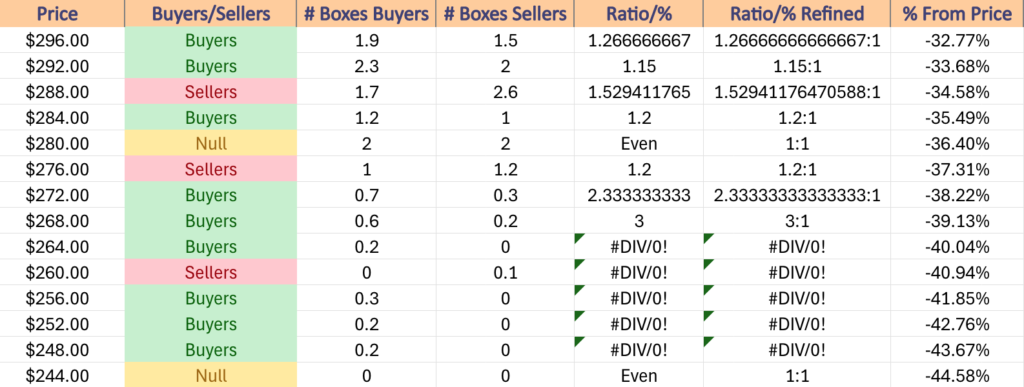
DIA ETF’s Price Level:Volume Sentiment Over The Past 3-4 Years
Price Level:Volume Sentiment For DIA ETF Over The Past 3-4 Years
Price Level:Volume Sentiment For DIA ETF Over The Past 3-4 Years
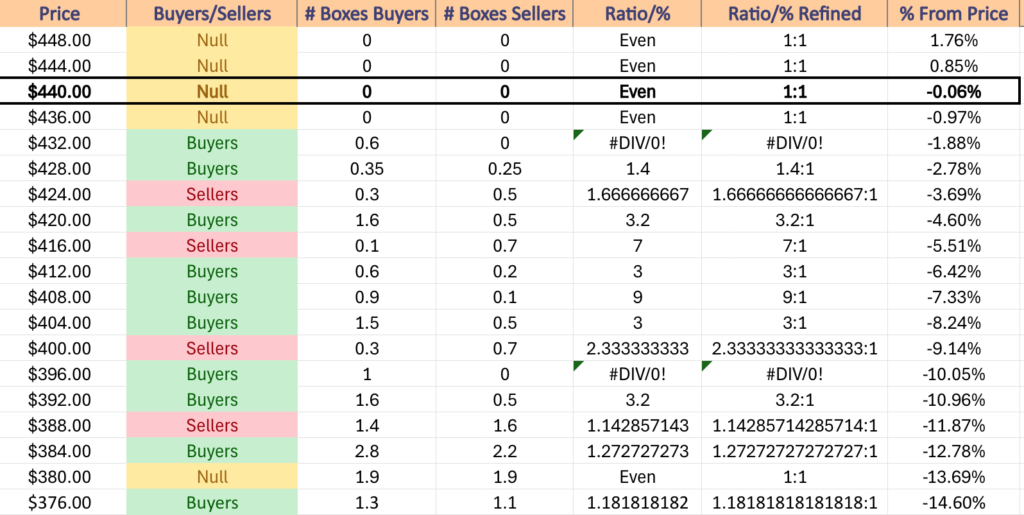
$448 – NULL – 0:0*, +1.76% From Current Price Level
$444 – NULL – 0:0*, +0.85% From Current Price Level – All-Time High*
$440 – NULL – 0:0*, +0.85% From Current Price Level – Current Price Level*
$436 – NUL – 0:0*, -0.06% From Current Price Level
$432 – Buyers – 0.6:0*, -0.97% From Current Price Level
$428 – Buyers – 1.4:1, -1.88% From Current Price Level – 10 Day Moving Average*
$424 – Sellers – 1.67:1, -2.78% From Current Price Level
$420 – Buyers – 3.2:1, -3.69% From Current Price Level – 50 Day Moving Average*
$416 – Sellers – 7:1, -4.6% From Current Price Level
$412 – Buyers – 3:1, -5.51% From Current Price Level
$408 – Buyers – 9:1, -6.42% From Current Price Level
$404 – Buyers – 3:1, -7.33% From Current Price Level
$400 – Sellers – 2.33:1, -9.14% From Current Price Level
$396 – Buyers – 1:0*, -10.05% From Current Price Level – 200 Day Moving Average*
$392 – Buyers – 3.2:1, -10.96% From Current Price Level
$388 – Sellers – 1.14:1, -11.87% From Current Price Level
$384 – Buyers – 1.27:1, -12.78% From Current Price Level
$380 – Even – 1:1, -13.69% From Current Price Level
$376 – Buyers – 1.18:1, -14.6% From Current Price Level
$372 – Buyers – 2.25:1, -15.5% From Current Price Level
$368 – Buyers – 1.7:1, -16.41% From Current Price Level
$364 – Buyers – 2.67:1, -17.32% From Current Price Level
$360 – Buyers – 0.1:0*, -18.23% From Current Price Level
$356 – Buyers – 2.67:1, -19.14% From Current Price Level
$352 – Sellers – 2:1, -20.05% From Current Price Level
$348 – Buyers – 0.7:0*, -20.96% From Current Price Level
$344 – Buyers – 1.93:1, -21.86% From Current Price Level
$340 – Sellers – 1.23:1, -22.77% From Current Price Level
$336 – Buyers – 2.8:1, -23.68% From Current Price Level
$332 – Buyers – 1.15:1, -24.59% From Current Price Level
$328 – Buyers – 1.14:1, -25.5% From Current Price Level
$324 – Sellers – 1.03:1, -26.41% From Current Price Level
$320 – Sellers – 1.15:1, -27.32% From Current Price Level
$316 – Sellers – 1.12:1, -28.22% From Current Price Level
$312 – Sellers – 1.52:1, -29.13% From Current Price Level
$308 – Sellers – 1.44:1, -30.04% From Current Price Level
$304 – Buyers – 1.58:1, -30.95% From Current Price Level
$300 – Sellers – 1.64:1, -31.86% From Current Price Level
$296 – Buyers – 1.27:1, -32.77% From Current Price Level
$292 – Buyers – 1.15:1, -33.68% From Current Price Level
$288 – Sellers – 1.53:1, -34.58% From Current Price Level
$284 – Buyers – 1.2:1, -35.49% From Current Price Level
$280 – Even – 1:1, -36.4% From Current Price Level
$276 – Sellers – 1.2:1, -37.31% From Current Price Level
$272 – Buyers – 2.33:1, -38.22% From Current Price Level
$268 – Buyers – 3:1, -39.13% From Current Price Level
$264 – Buyers – 0.2:0*, -40.04% From Current Price Level
$260 – Sellers – 0.1:0*, -40.94% From Current Price Level
$256 – Buyers – 0.3:0*, -41.85% From Current Price Level
$252 – Buyers – 0.2:0*, -42.76% From Current Price Level
$248 – Buyers – 0.2:0*, -43.67% From Current Price Level
$244 – NULL – 0:0*, -44.58% From Current Price Level
*** I DO NOT OWN SHARES OR OPTIONS CONTRACT POSITIONS IN SPY, QQQ, IWM OR DIA AT THE TIME OF PUBLISHING THIS ARTICLE ***
The VIX closed at 14.02, indicating an implied one day move of +/-0.88% & an implied one month move of +/-4.05% for the S&P 500.
Highest Technical Rated S&P 500 Components Per 11/13/2024’s Close:
1 – PLTR
2 – AXON
3 – UAL
4 – TSLA
5 – VST
6 – RCL
7 – FICO
8 – TRGP
9 – FTNT
10 – CCL
Lowest Technical Rated S&P 500 Components Per 11/13/2024’s Close:
1 – SMCI
2 – CE
3 – MRNA
4 – ENPH
5 – EL
6 – QRVO
7 – MPWR
8 – DG
9 – DLTR
10 – WBA
Highest Volume Rated S&P 500 Components Per 11/13/2024’s Close:
1 – SWKS
2 – IQV
3 – CDW
4 – CAH
5 – CE
6 – OXY
7 – CHTR
8 – CARR
9 – CSCO
10 – DIS
Lowest Volume Rated S&P 500 Components Per 11/13/2024’s Close:
1 – K
2 – VST
3 – DELL
4 – DPZ
5 – KR
6 – RTX
7 – LW
8 – FITB
9 – ERIE
10 – PAYC
Highest Technical Rated ETFs Per 11/12/2024’s Close:
1 – TSLR
2 – TSLL
3 – TSLT
4 – VCAR
5 – BITX
6 – TSL
7 – DPST
8 – MSTX
9 – DEFG
10 – CRPT
Lowest Technical Rated ETFs Per 11/13/2024’s Close:
1 – TSLZ
2 – TSDD
3 – TSLQ
4 – MSOX
5 – NVDQ
6 – NVD
7 – MRNY
8 – UVIX
9 – TSLS
10 – SKRE
Highest Volume Rated ETFs Per 11/13/2024’s Close:
1 – SRHQ
2 – ONEO
3 – EMCS
4 – GVLU
5 – GSPY
6 – BKGI
7 – EFAS
8 – CSA
9 – FSZ
10 – IDEC
Lowest Volume Rated ETFs Per 11/13/2024’s Close:
1 – BHYB
2 – QCAP
3 – DTSRF
4 – FDGR
5 – UJB
6 – JULH
7 – OVT
8 – FDTB
9 – RBUF
10 – IQSU
Highest Technical Rated General Stocks Per 11/13/2024’s Close:
1 – BTCT
2 – DRUG
3 – FOXO
4 – MFH
5 – MNPR
6 – QBUT
7 – BTCS
8 – EEGI
9 – NXL
10 – WLGS
Lowest Technical Rated General Stocks Per 11/13/2024’s Close:
1 – EFSH
2 – IONM
3 – SYRS
4 – ADTX
5 – CETX
6 – GCTK
7 – SMX
8 – UAVS
9 – PET
10 – VCIG
Highest Volume Rated General Stocks Per 11/13/2024’s Close:
1 – SLG
2 – PULM
3 – MAMA
4 – PET
5 – KXIN
6 – BTCS
7 – GCTK
8 – SYRS
9 – QUBT
10 – EFOI
Lowest Volume Rated General Stocks Per 11/13/2024’s Close:
1 – DBIN
2 – YBGJ
3 – VRDR
4 – BNPQF
5 – STEC
6 – SNANF
7 – AMBZ
8 – CRECF
9 – BREA
10 – ASAPF
*** THE LIST ABOVE IS STRICTLY FOR INFORMATIONAL PURPOSES – I MAY OR MAY NOT HAVE OR INITIATE A LONG, SHORT, OR LONG/SHORT POSITION IN ANY NAME ABOVE AT ANY TIME ***
The VIX closed at 14.71, indicating an implied one day move of +/-0.93% & an implied one month move of +/-4.25% for the S&P 500.
Highest Technical Rated S&P 500 Components Per 11/12/2024’s Close:
1 – PLTR
2 – AXON
3 – UAL
4 – TSLA
5 – VST
6 – RCL
7 – FICO
8 – TRGP
9 – FTNT
10 – NCLH
Lowest Technical Rated S&P 500 Components Per 11/12/2024’s Close:
1 – SMCI
2 – CE
3 – MRNA
4 – ENPH
5 – EL
6 – QRVO
7 – DLTR
8 – DG
9 – AES
10 – MPWR
Highest Volume Rated S&P 500 Components Per 11/12/2024’s Close:
1 – TSN
2 – AMGN
3 – MPWR
4 – LYV
5 – HON
6 – CE
7 – GEV
8 – JNPR
9 – MOS
10 – AXON
Lowest Volume Rated S&P 500 Components Per 11/12/2024’s Close:
1 – K
2 – DECK
3 -ERIE
4 – BRO
5 – PNR
6 – DPZ
7 – LW
8 – CTSH
9 – DOV
10 – CDNS
Highest Technical Rated ETFs Per 11/12/2024’s Close:
1 – CONL
2 – TSLR
3 – TSLL
4 – TSLT
5 – MSTX
6 – CRPT
7 – DPST
8 – BITX
9 – DAPP
10 – VCAR
Lowest Technical Rated ETFs Per 11/12/2024’s Close:
1 – MSOX
2 – TSLZ
3 – TSDD
4 – TSLQ
5 – NVDQ
6 – NVD
7 – MRNY
8 – UVIX
9 – TSLS
10 – SMST
Highest Volume Rated ETFs Per 11/12/2024’s Close:
1 – IQSM
2 – EMCR
3 – SECR
4 – IBGA
5 – INDH
6 – JGLO
7 – VCLN
8 – JAVA
9 – SFEB
10 – UPGR
Lowest Volume Rated ETFs Per 11/12/2024’s Close:
1 – BHYB
2 – OVLH
3 – FDGR
4 – ZHDG
5 – OVT
6 – CPRJ
7 – GSID
8 – CPNJ
9 – PSMR
10 – TOK
Highest Technical Rated General Stocks Per 11/12/2024’s Close:
1 – JTAI
2 – BTCT
3 – DRUG
4 – FOXO
5 – WLGS
6 – MNPR
7 – INOD
8 – NXL
9 – SEZL
10 – SGMO
Lowest Technical Rated General Stocks Per 11/12/2024’s Close:
1 – EFSH
2 – CETX
3 – TRNR
4 – SMX
5 – UAVS
6 – VCIG
7 – CIPI
8 – HAO
9 – MTNB
10 – YELLQ
Highest Volume Rated General Stocks Per 11/12/2024’s Close:
1 – BTCT
2 – OUT
3 – TWO
4 – BTCS
5 – GNS
6 – XBP
7 – NXTT
8 – MNOV
9 – AE
10 – LIFW
Lowest Volume Rated General Stocks Per 11/12/2024’s Close:
1 – LIANY
2 – CRSFX
3 – CNND
4 – OIIIF
5 – GDTC
6 – BNPQF
7 – WEGYF
8 – STEC
9 – MRM
10 – INBP
*** THE LIST ABOVE IS STRICTLY FOR INFORMATIONAL PURPOSES – I MAY OR MAY NOT HAVE OR INITIATE A LONG, SHORT, OR LONG/SHORT POSITION IN ANY NAME ABOVE AT ANY TIME ***
The VIX closed at 14.97, indicating an implied one day move of +/-0.94% & an implied one month move of +/-4.33%.
Highest Technical Rated S&P 500 Components Per 11/11/2024’s Close:
1 – PLTR
2 – AXON
3 – TSLA
4 – UAL
5 – VST
6 – RCL
7 – FICO
8 – TRGP
9 – NCLH
10 – CCL
Lowest Technical Rated S&P 500 Components Per 11/11/2024’s Close:
1 – SMCI
2 – MRNA
3 – CE
4 – ENPH
5 – EL
6 – QRVO
7 – DLTR
8 – DG
9 – MPWR
10 – AES
Highest Volume Rated S&P 500 Components Per 11/11/2024’s Close:
1 – MPWR
2 – ABBV
3 – CE
4 – A
5 -MRNA
6 – LYV
7 – CRM
8 – AXON
9 – MTD
10 – BMY
Lowest Volume Rated S&P 500 Components Per 11/11/2024’s Close:
1 – SW
2 – IP
3 – LW
4 – BEN
5 – RJF
6 – VMC
7 – CDNS
8 – DOV
9 – FFIV
10 – CTSH
Highest Technical Rated ETFs Per 11/11/2024’s Close:
1 – TSLR
2 – TSLL
3 – TSLT
4 – CONL
5 – VCAR
6 – MSTX
7 – TSL
8 – CRPT
9 – DPST
10 – DAPP
Lowest Technical Rated ETFs Per 11/11/2024’s Close:
1 – MSOX
2 – TSLZ
3 – TSDD
4 – TSLQ
5 – NVDQ
6 – NVD
7 – MRNY
8 – WEED
9 – MSOS
10 – TSLS
Highest Volume Rated ETFs Per 11/11/2024’s Close:
1 – DECP
2 – EMC
3 – IWX
4 – MVAL
5 – KJAN
6 – SYNB
7 – IMAR
8 – PBMR
9 – ARKD
10 – EWO
Lowest Volume Rated ETFs Per 11/11/2024’s Close:
1 – BHYB
2 – GSID
3 – EFIX
4 – OVLH
5 – ESGB
6 – OVL
7 – NUGO
8 – IVVB
9 – JUNT
10 – BBEM
Highest Technical Rated General Stocks Per 11/11/2024’s Close:
1 – DRUG
2 – SEZL
3 – WLGS
4 – FOXO
5 – INOD
6 – BSGM
7 – MNPR
8 – SGMO
9 – APP
10 – NXL
Lowest Technical Rated General Stocks Per 11/6/2024’s Close:
1 – ADTX
2 – CETX
3 – SMX
4 – UAVS
5 – SEEL
6 – APDN
7 – MDJH
8 – TCBP
9 – MTNB
10 – PEGY
Highest Volume Rated General Stocks Per 11/11/2024’s Close:
1 – BECG
2 – MFH
3 – LEDS
4 – SUGP
5 – BTM
6 – JNVR
7 – HOVR
8 – CERO
9 – REVB
10 – PWM
Lowest Volume Rated General Stocks Per 11/11/2024’s Close:
1 – ASAPF
2 – FETM
3 – CYSNF
4 – REPYF
5 – TC
6 – BKYI
7 – NWYF
8 – SFES
9 – NHYKF
10 – CLST
*** THE LIST ABOVE IS STRICTLY FOR INFORMATIONAL PURPOSES – I MAY OR MAY NOT HAVE OR INITIATE A LONG, SHORT, OR LONG/SHORT POSITION IN ANY NAME ABOVE AT ANY TIME ***
SPY, the SPDR S&P 500 ETF gained +4.75% last week, while the VIX closed the week at 14.94, indicating an implied one day move of +/-0.94% & an implied one month move of +/-4.32% for the S&P 500.
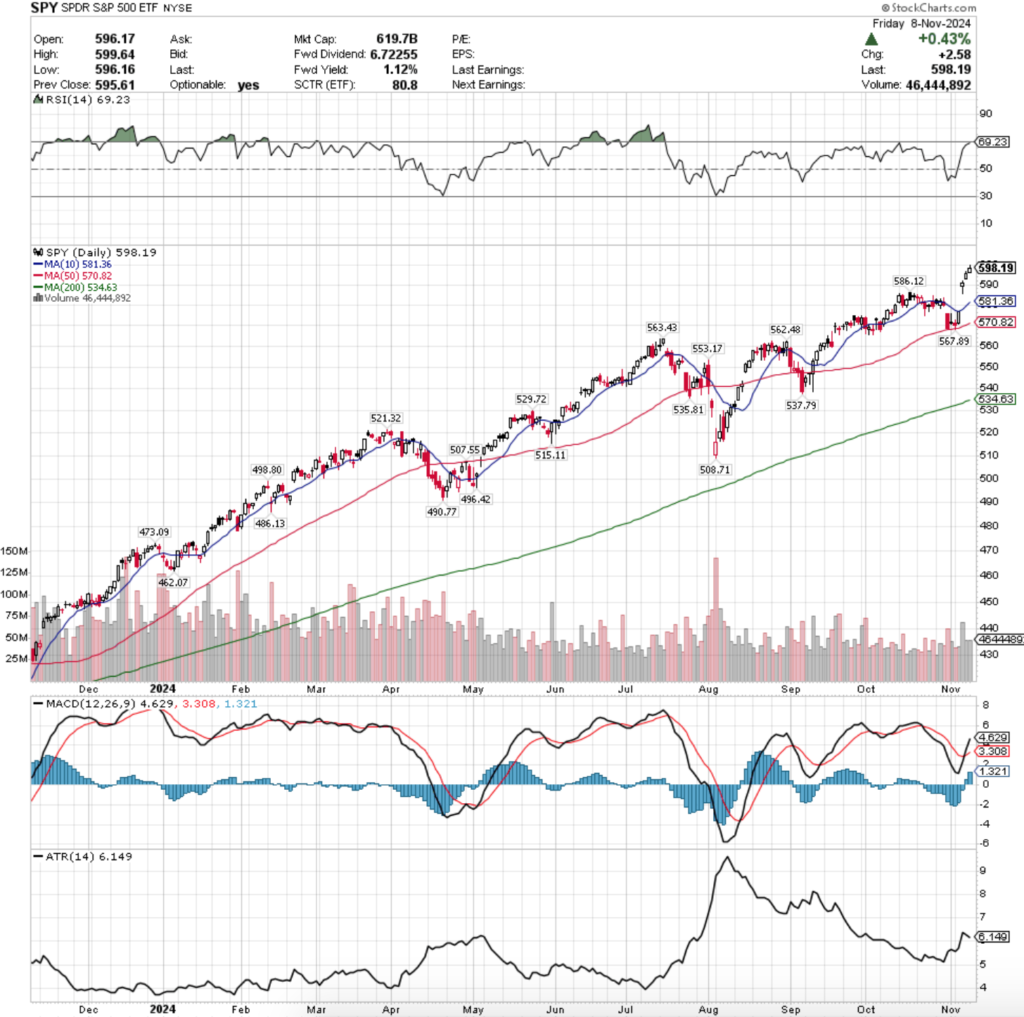
SPY ETF – SPDR S&P 500 ETF’s Technical Performance Over The Past Year
Their RSI is trending into overbought territory in the wake of last week’s performance & currently sits just below it at 69.23, while their MACD crossed over bullishly on Thursday morning.
Volumes were still extremely light though, coming in -21.85% below the prior year’s average (47,910,000 vs. 61,308,656), which as we’ve highlighted in prior weeks’ notes is down drastically from even just seven month’s ago’s prior year’s average volume.
While there was some enthusiasm as a result of the US Presidential election & the FOMC Interest Rate decision the participation rate is still low following mid-April.
Last week opened on a note of uncertainty, as the session’s candle stayed within the range of the previous Thursday’s candle & the support of the 50 day moving average held up, although volumes were light.
Tuesday the low volume continued, but the session resulted in an advance that closed in line with the resistance of the 10 day moving average as folks anxiously awaited the results of the US election.
Wednesday saw enthusiasm rush through the markets, as the highest volume of the week led to a 2.5% gap up for SPY that opened well above the 10 day moving average’s resistance, but it came with a note of caution.
The day’s candle resulted in a hanging man, which has bearish implications & signals that there was a bit of downside appetite despite the day’s higher close.
The good times rolled on into the weekend when Thursday opened on another gap up session higher & Friday produced a +0.43% gain.
Friday’s candle offered another glimmer of caution as well, as while the upper shadow on the day’s candle is not long enough for the candle to be a shooting star, the day’s open & close were concentrated on the lower end of the candle.
Heading into the new week it will be interesting to see if there is enough momentum to continue SPY’s climb higher, or if there will be a cool off period.
Their MACD suggests that there may still be some fuel in the tank to the upside, but their RSI is nearing the overbought level, which is something investors should be mindful of in the days to come.
Another key area of interest will be how price behaves in regards to the window that was created by Wednesday’s gap up.
Due to the fact that we’re near all-time highs there is not enough volume sentiment data to assess the strength of the nearby support levels for SPY, as the $586.12 & 10 day moving average at $581.36 both fall within the window.
In the event it begins to fill then the strength of the 50 DMA’s support will be something else to keep an eye on to see if it can provide stable enough footing for SPY to consolidate & broaden.
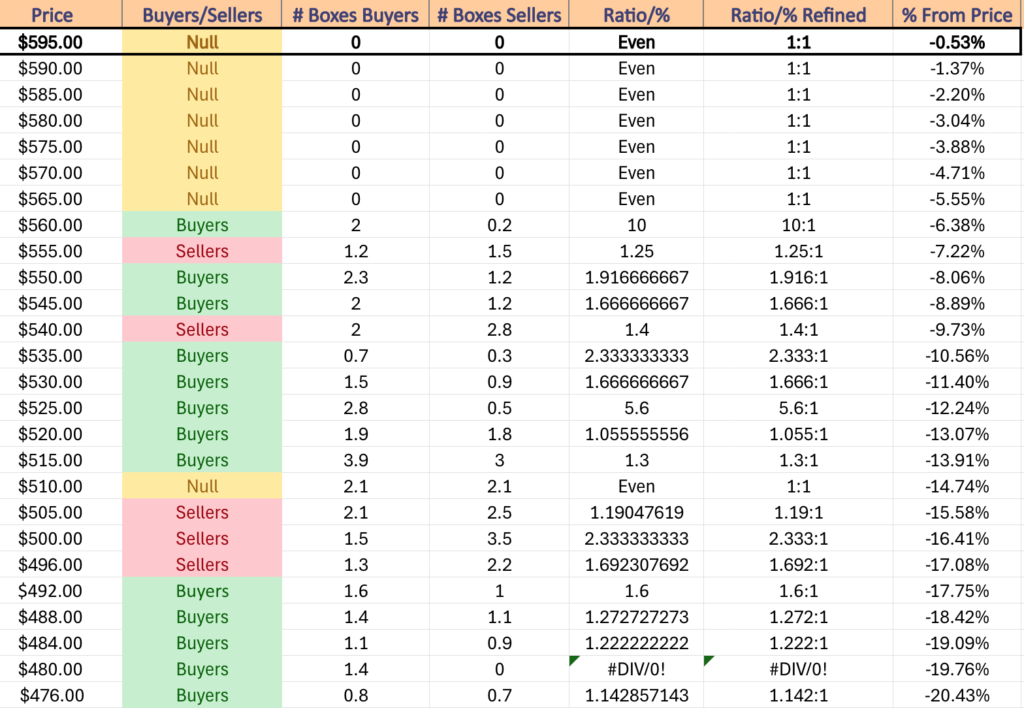
SPY has support at the $586.12 (Volume Sentiment: NULL, 0:0*), $581.36 (10 Day Moving Average, Volume Sentiment: NULL, 0:0*), $570.82 (50 Day Moving Average, Volume Sentiment: NULL, 0:0*) & $567.89/share (Volume Sentiment: NULL, 0:0*) price levels, with resistance at the $599.64/share (All-Time High, Volume Sentiment: NULL, 0:0*) price levels.
SPY ETF’s Price Level:Volume Sentiment Over The Past ~2 Years
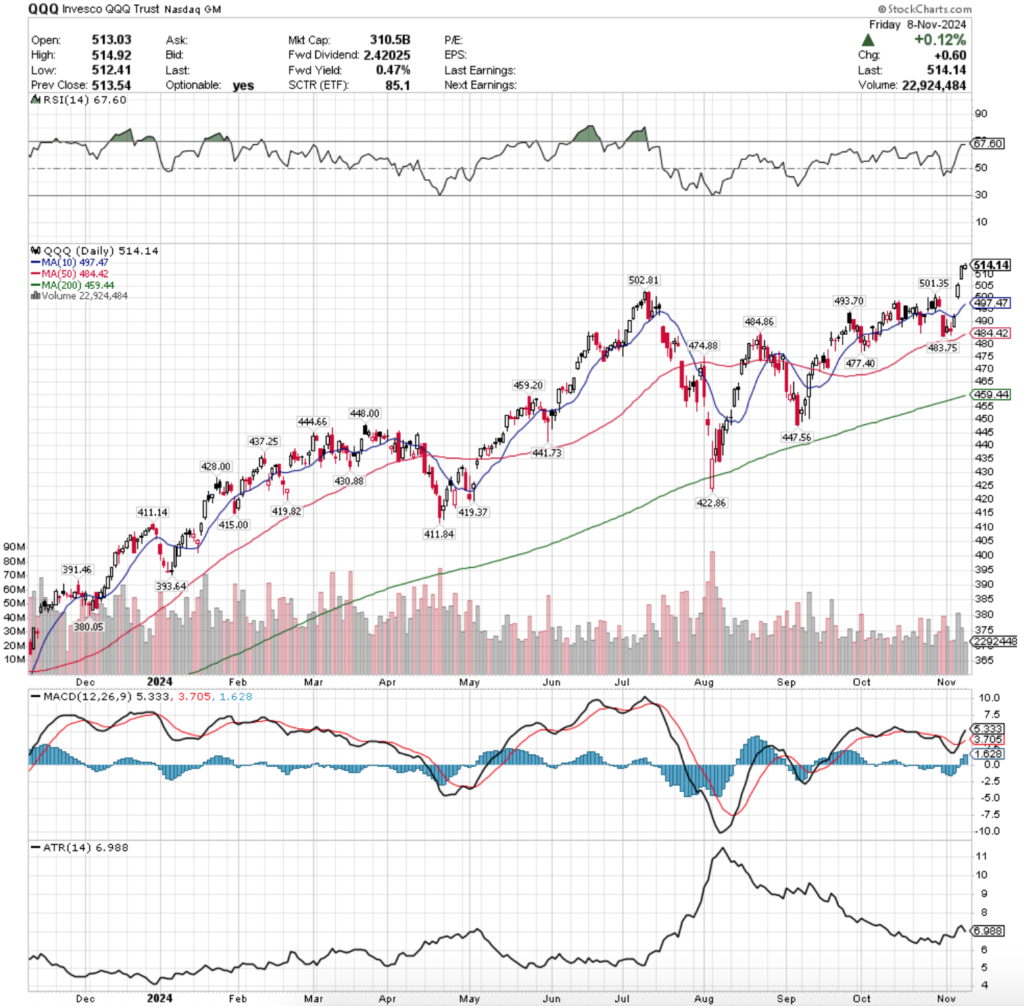
QQQ, the Invesco QQQ Trust ETF that tracks the NASDAQ 100 climbed +5.48% last week, as investors were eager to get into the tech focused index.
QQQ ETF – Invesco QQQ Trust ETF’s Technical Performance Over The Past Year
Their RSI has flattened out after advancing towards the overbought level & currently sits at 67.6, while their MACD crossed over bullishly on Thursday.
Volumes were -25.25% below the previous year’s average volume (29,298,000 vs. 39,196,719), indicating that there is still a severe lack of participation much like SPY.
SPY & QQQ have both benefitted dramatically from the AI/Data Center/Semiconductor trades of the past couple of years & it now appears as though investors are pivoting away in favor of the small cap names in IWM & the blue chip index of DIA.
Accordingly, QQQ’s week went very similar to SPY’s, starting off on an uncertain note Monday when the session resulted in a slight decline & a high wave spinning top candle that formed a bearish harami pattern with the day prior’s candle on low volume.
The next day opened in a gap up & ran up to test the resistance of the 10 day moving average, which was briefly broken but was unable to close above it.
Wednesday opened on a large gap up & the session continued higher, setting a new all-time high & closing above the $505/share price level on the highest volume of the week as investors were excited about the results of the election.
Thursday followed suit with another gap up day & all-time high as market participants were still pleased by Wednesday’s news.
Friday the week wound down on another high note, but the day’s candle did flash signal for caution ahead.
Friday’s candle opened lower than Thursday’s close but was able to push slightly higher, adding +0.12% for the day & setting a new all-time high, but it appears that the $514.92/share level is where investors lost enthusiasm & may signal the top in the near-term.
Entering this week it will be interesting to see if there are some profits taken which would push prices down to begin filling in the gaps of last week.
QQQ has more local support than SPY did that may help keep prices propped up & from declining too low below the window, but that will be heavily dependent on how much volume we see on declining days.
The $502.81 & $501.35/share points will be interesting to follow, as they were only broken through on account of gaps, which could make for a false breakout based on the low volume levels.
Any decline will be worth keeping an eye on as well to see if the 10 & 50 DMAs hold up, especially now that the 200 DMA sits just -7.64% below the 10 DMA & -5.16% below the 50 DMA.
Prices tested against the 200 DMA in August & were able to rebound & climb higher, but the appetite to dip below it has already been shown once in the past year & can’t be ruled out again.
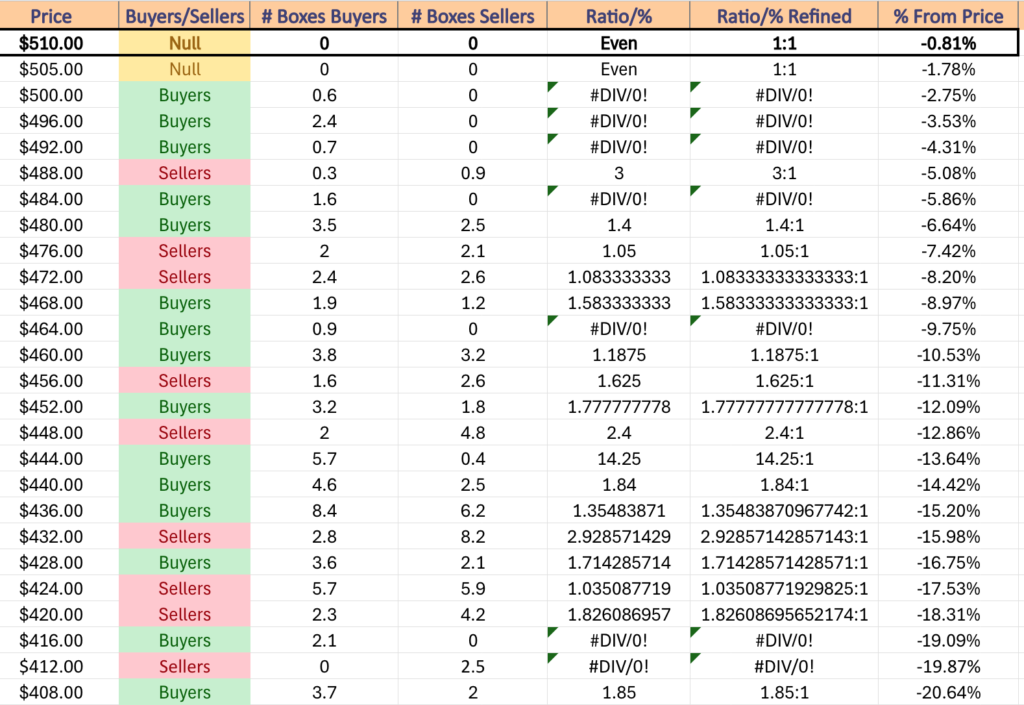
QQQ has support at the $502.81 (Volume Sentiment: Buyers, 0.6:0*), $501.35 (Volume Sentiment: Buyers, 0.6:0*), $497.47 (Volume Sentiment: Buyers, 2.4:0*) & $493.70/share (Volume Sentiment: Buyers, 0.7:0*) price levels, with resistance at the $514.92/share (Volume Sentiment: NULL, 0:0*) price levels.
QQQ ETF’s Price Level:Volume Sentiment Over The Past ~2 Years
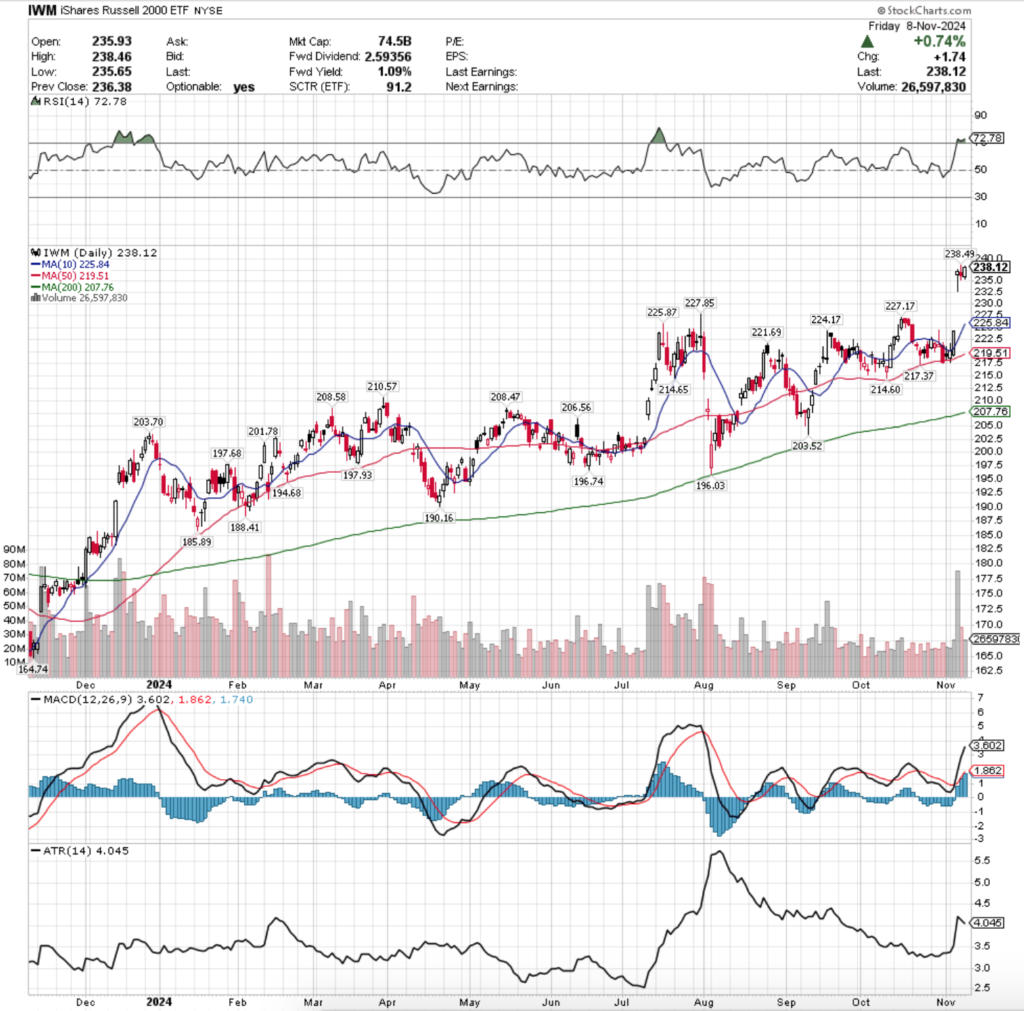
IWM ETF – iShares Russell 2000 ETF’s Technical Performance Over The Past Year
Their RSI has also flattened out, but in overbought territory & sits at 72.78, while their MACD crossed over bullishly on Wednesday.
Volumes were +9.69% above the previous year’s average levels (36,796,000 vs. 33,544,150), as investors were eager to get into small cap names following the US election & FOMC Interest Rate decision.
IWM’s week began on an interesting note, opening lower than Friday’s close, testing to below the support of the 50 DMA before breaking out upwards & crossing the resistance of the 10 DMA briefly before closing in-line with it.
Tuesday opened slightly lower before taking off running through the resistance of the 10 DMA & closing firmly above it.
IWM had a phenomenal Wednesday which accounted for +5.8% of the week’s gains as IWM gapped up, tested down to near the $232.50/share level before roaring back on high volume to close the session higher.
It should be noted that the day resulted in a hanging man candle which carries bearish implications with it, as despite the day’s gain there showed to be plenty of appetite for prices to head to the downside as well.
Despite most of it likely coming from profit taking after the gap, it is still something to consider moving forward, particularly if IWM is unable to continue higher as it will then give a rough idea as to the near-term range it may trade in.
Thursday flashed more warning signs for IWM though, as the session opened lower, tested higher to hit a new all-time high, before collapsing down to near the $235/share mark & settling down for the day.
While Friday’s +0.74% gain created a bullish engulfing candle, the volume sentiment behind it was severely lackluster & does not show much strength & conviction behind the move.
This coming week will be important to track the direction of volume to assess whether or not the current island that was set up last week will be sustainable & if not, how far the declines may be.
The $227-227.85/share level will be the first line of defense for IWM in terms of support, unless the 10 DMA moves higher in the meantime before those levels are tested.
In the event of a breakdown, IWM has many more local support levels than SPY or QQQ due to the rangebound oscillations it advances in vs. the latter two indexes more steep ascents & rapid growth.
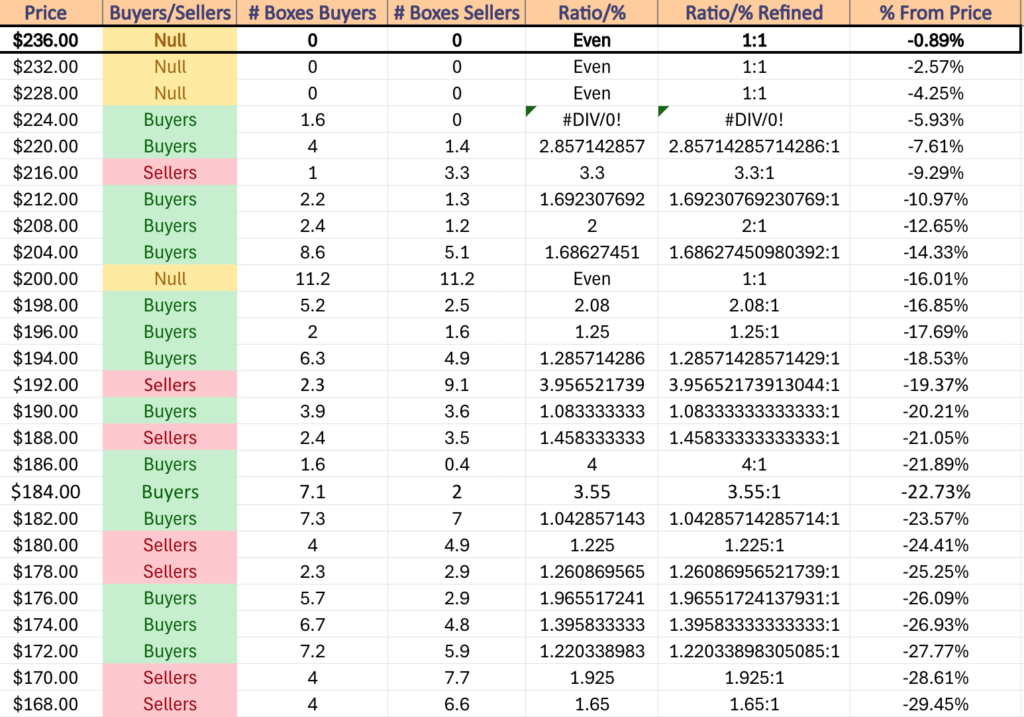
IWM has support at the $227.85 (Volume Sentiment: Buyers, 1.6:0*), $227.17 (Volume Sentiment: Buyers, 1.6:0*), $225.87 (Volume Sentiment: Buyers, 1.6:0*) & $225.84/share (10 Day Moving Average, Volume Sentiment: Buyers, 1.6:0*) price levels, with resistance at the $238.49/share (All-Time High, Volume Sentiment: NULL, 0:0*) price levels.
IWM ETF’s Price Level:Volume Sentiment Over The Past ~2 Years
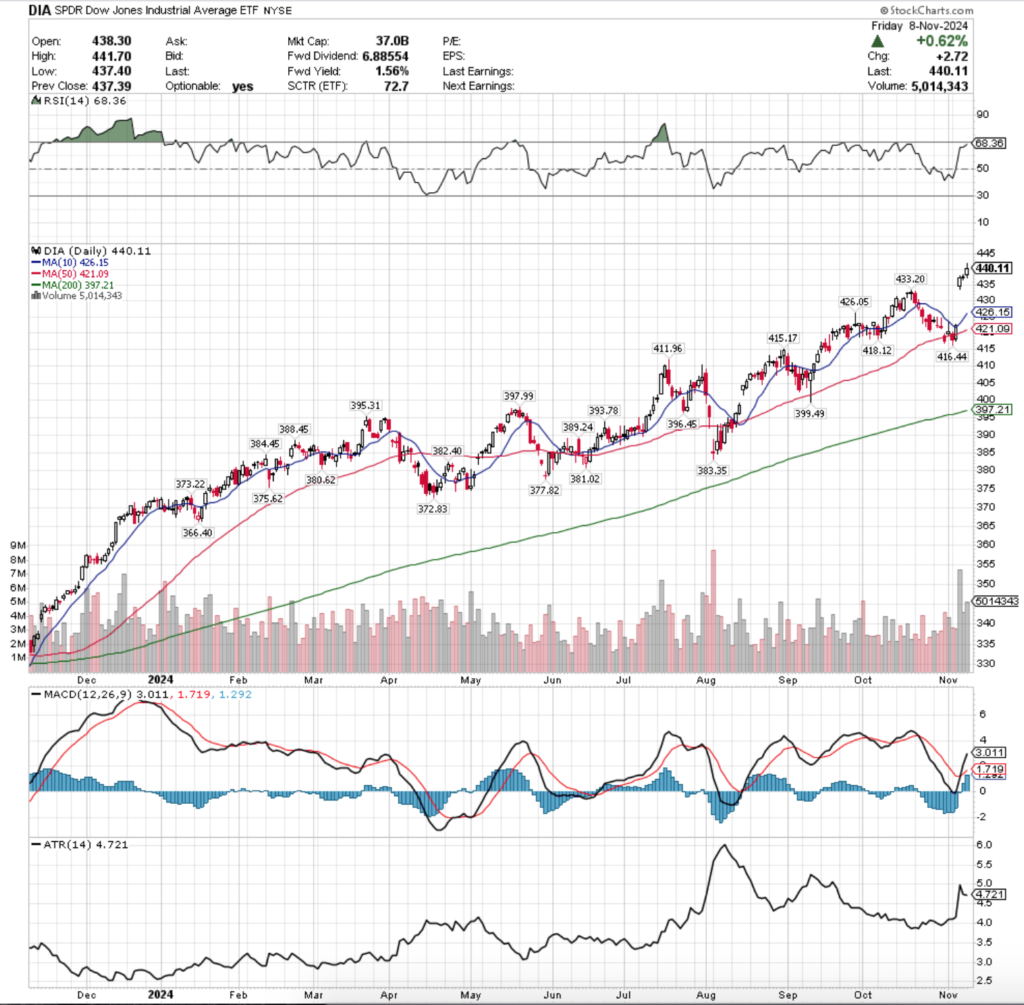
DIA ETF – SPDR Dow Jones Industrial Average ETF’s Technical Performance Over The Past Year
Their RSI is trending towards overbought levels & is currently at 68.36, while their MACD crossed over bullishly on Thursday.
Volumes were +31.68% above the previous year’s average (4,554,000 vs. 3,458,379), as investors showed that they clearly were seeking the protection of the blue chip names while at all-time highs.
Monday opened the week up the same as SPY & QQQ with a declining day where DIA opened lower, briefly tested higher before plunging through its 50 DMA’s support & recovered to close just below it.
Volumes were weak, a trend that continued into Tuesday when the session opened higher & powered above both the 50 & 10 DMA’s resistance levels to close above each, but again, on weak volume.
Wednesday saw a +3.5% advance on the heaviest volume of the week as DIA opened on a gap up & little profit taking took place based on the size of the lower shadow of the session’s candle.
Thursday’s price action began to show some doubt in the strength of the new all-time high set on Wednesday, as though the session advanced on solid volume, it closed lower than it opened & had a very narrow range (between a spinning top & a doji, but not entirely one or the other) between the day’s open & close.
This indicates that there was enough fuel to keep active participation going, but that there was not much appetite to take things higher & that market participants felt like they were at equilibrium.
Friday the gains continued with DIA advancing +0.62% on the day on the second highest volume of the week, but the size of the upper shadow on the day’s candle is cause for concern.
Bears clearly took the reigns back at $441.70 & forced the price back down to $440.11 & following the message of the prior day’s candle it appears that investors might be nearing the end of their rope on the near-term upside for DIA.
Much like the prior three index ETFs, this week all eyes will be on the window created Wednesday & whether or not it gets filled in the near-term.
Whether the above average volume continues for DIA will also be something to be aware of this coming week, as should it begin to falter there will likely be some risk-off movements by market participants that would force a test of the support of the 10 & possibly 50 DMAs.
Otherwise, in the event of decline the $426-426.50 level will be a zone to keep an eye on for support, as there is currently not much volume data about these price levels to gauge historic sentiment yet.
DIA has support at the $443.20 (Volume Sentiment: NULL, 0:0*), $426.15 (10 Day Moving Average, Volume Sentiment: NULL, 0:0*), $426.05 (Volume Sentiment: NULL, 0:0*) & $421.09/share (50 Day Moving Average, Volume Sentiment: NULL, 0:0*) price levels, with resistance at the $441.70/share (All-Time High, Volume Sentiment: NULL, 0:0*) price levels.
DIA ETF’s Price Level:Volume Sentiment Over The Past 3-4 Years
The Week Ahead
Monday is Veteran’s Day & the bond market will be closed.
Aramark & Monday.com report earnings on Monday morning before the opening bell, followed by Archrock, Assured Guaranty, James River Group, Kyverna Therapuetics, Luminar Technologies, Nevro, Talos Energy & Zeta Global after the session’s close.
Tuesday brings us NFIB Optimism Index data at 6am.
Home Depot kicks off Tuesday morning’s earnings calls, along with Alight, Alumis, AstraZeneca, Avadel Pharmaceuticals, Camtek, Endava, EVgo Inc., First Advantage, Genius Sports, Hertz Global, Hudbay Minerals, HUYA, IAC Inc., IHS Holding Limited, International Game Technology, Legend Biotech, Live Nation, Mirum Pharmaceuticals, Mosaic, Neumora Therapeutics, Northwest Natural, Novavax, On Holding, Pactiv Evergreen, Pagaya, Piedmont Lithium, Plug Power, Repligen, Roivant Sciences, Scholar Rock, Schrodinger, Sea Limited, Shift4 Payments, Shoals Technologies, Smith Douglas Homes, Sphere Entertainment, SpringWorks Therapeutics, Sunstone Hotel, Surgery Partners, Sylvamo, Target Hospitality, Tencent Music, TreeHouse Foods, Triumph Group & Tyson Foods, followed by Amdocs, American Healthcare REIT, Azenta, CAE, Cannae Holdings, CAVA Group, Chegg, Crinetics Pharmaceuticals, DHT, EverCommerce, Grab, Hudson Pacific Properties, ICU Medical, Instacart, Integral Ad Science, Light & Wonder, MARA Holdings, Natera, NCR Atleos, NeuroPace, Occidental Petroleum, OUTFRONT Media, Paragon 28, Paymentus, Perdoceo Education, Progyny, Prothena, PubMatic, Rackspace Technology, Repay Holdings, Rocket Lab USA, Seadrill Ltd, Skyworks Solutions, SoundHound AI, Spotify, Suncor Energy, TechTarget, Topgolf Callaway Brands, Xenon Pharmaceuticals & ZoomInfo after the closing bell.
Consumer Price Index, CPI Year-over-Year, Core CPI & Core CPI Year-over-Year data is all due for release Wednesday at 8:30 am, followed by the Monthly U.S. Federal Budget data at 2pm.
Thursday brings us Initial Jobless Claims, Producer Price Index, PPI Year-over-Year, Core PPI & Core PPI Year-over-Year data at 8:30 am.
Walt Disney, Advance Auto Parts, Bilibili, JD.com, NetEase, NICE, Nomad Foods, Sally Beauty, Sally Beauty & ZEEKR Intelligent Technology Holding are all due to report earnings on Thursday morning before Applied Materials, ESCO Technologies, Globant, Mitek Systems & Post report after the session’s close.
Import Price Index, Import Price Index minus Fuel, Empire State Manufacturing Survey, U.S. Retail Sales & Retail Sales minus Autos data are all scheduled for release on Friday at 8:30 am, followed by Industrial Production, & Capacity Utilization data at 9:15 am & Business Inventories data at 10 am.
Friday morning’s major earnings call is Alibaba Group Holding.
See you back here next week!
*** I DO NOT OWN SHARES OR OPTIONS CONTRACT POSITIONS IN SPY, QQQ, IWM OR DIA AT THE TIME OF PUBLISHING THIS ARTICLE ***
The VIX closed at 14.94, indicating an implied one day move of +/-0.94% & an implied one month move of +/-4.32% for the S&P 500.
Highest Technical Rated S&P 500 Components Per 11/8/2024’s Close:
1 – PLTR
2 – AXON
3 – UAL
4 – VST
5 – TSLA
6 – FICO
7 – TRGP
8 – NCLH
9 – RCL
10 – CCL
Lowest Technical Rated S&P 500 Components Per 11/8/2024’s Close:
1 – SMCI
2 – MRNA
3 – CE
4 – ENPH
5 – EL
6 – QRVO
7 – DLTR
8 – DG
9 – AES
10 – WBA
Highest Volume Rated S&P 500 Components Per 11/8/2024’s Close:
1 – AXON
2 – AKAM
3 – ABNB
4 – ANET
5 – GEHC
6 – CE
7 – FTNT
8 – EXPE
9 – PODD
10 – ENPH
Lowest Volume Rated S&P 500 Components Per 11/8/2024’s Close:
1 – LUV
2 – K
3 – DAL
4 – WRB
5 – EW
6 – HSIC
7 – UAL
8 – BEN
9 – CDNS
10 – NFLX
Highest Technical Rated ETFs Per 11/8/2024’s Close:
1 – TSLR
2 – TSLL
3 – TSLT
4 – TSL
5 – VCAR
6 – DPST
7 – CONL
8 – CRPT
9 – NVDU
10 – NVDL
Lowest Technical Rated ETFs Per 11/8/2024’s Close:
1 – TSLZ
2 – TSDD
3 – MSOX
4 – TSLQ
5 – NVDQ
6 – NVD
7 – MRNY
8 – YANG
9 – UVIX
10 – TSLS
Highest Volume Rated ETFs Per 11/8/2024’s Close:
1 – GLOW
2 – GSID
3 – GGUS
4 – CLOX
5 – GVUS
6 – IGEB
7 – PIZ
8 – HKND
9 – XEMD
10 – BUYZ
Lowest Volume Rated ETFs Per 11/8/2024’s Close:
1 – UNIY
2 – MVFD
3 – MCSE
4 – SEPZ
5 – BMDL
6 – MCHS
7 – IMAY
8 – LJUL
9 – PSFM
10 – PSCW
Highest Technical Rated General Stocks Per 11/8/2024’s Close:
1 – DRUG
2 – SEZL
3 – NXL
4 – SGMO
5 – MNPR
6 – INOD
7 – WLGS
8 – RAASY
9 – APP
10 – BSGM
Lowest Technical Rated General Stocks Per 11/8/2024’s Close:
1 – EFSH
2 – SMX
3 – MTNB
4 – MULN
5 – SEEL
6 – UAVS
7 – VCIG
8 – PEGY
9 – PRPH
10 – MDJH
Highest Volume Rated General Stocks Per 11/8/2024’s Close:
1 – BNPQF
2 – NCL
3 – TIVC
4 – SBET
5 – VMAR
6 – GV
7 – PRPH
8 – TRUG
9 – FOXO
10 – MTNB
Lowest Volume Rated General Stocks Per 11/8/2024’s Close:
1 – NSFDF
2 – TSKFF
3 – PRMNF
4 – SCZC
5 – FETM
6 – AIHS
7 – LANV
8 – DSNY
9 – RGLSF
10 – PYRGF
*** THE LIST ABOVE IS STRICTLY FOR INFORMATIONAL PURPOSES – I MAY OR MAY NOT HAVE OR INITIATE A LONG, SHORT, OR LONG/SHORT POSITION IN ANY NAME ABOVE AT ANY TIME ***