Weekly Stock & ETF Market Review 2/5/2023

Last week we continued to hear earnings calls, including from tech giants Alphabet, Amazon & Apple, as well as from pharmaceutical companies & more.

We also received updated numbers on home prices, construction spending, employment numbers, manufacturing & of course, the Federal Reserves rate announcement.

SPY, the SPDR S&P 500 ETF gained 1.64% after a week with losses on Monday & Friday, with gains in the middle of the week.

SPY ETF - SPDR S&P 500 ETF's Technical Performance Over The Past Year
SPY ETF – SPDR S&P 500 ETF

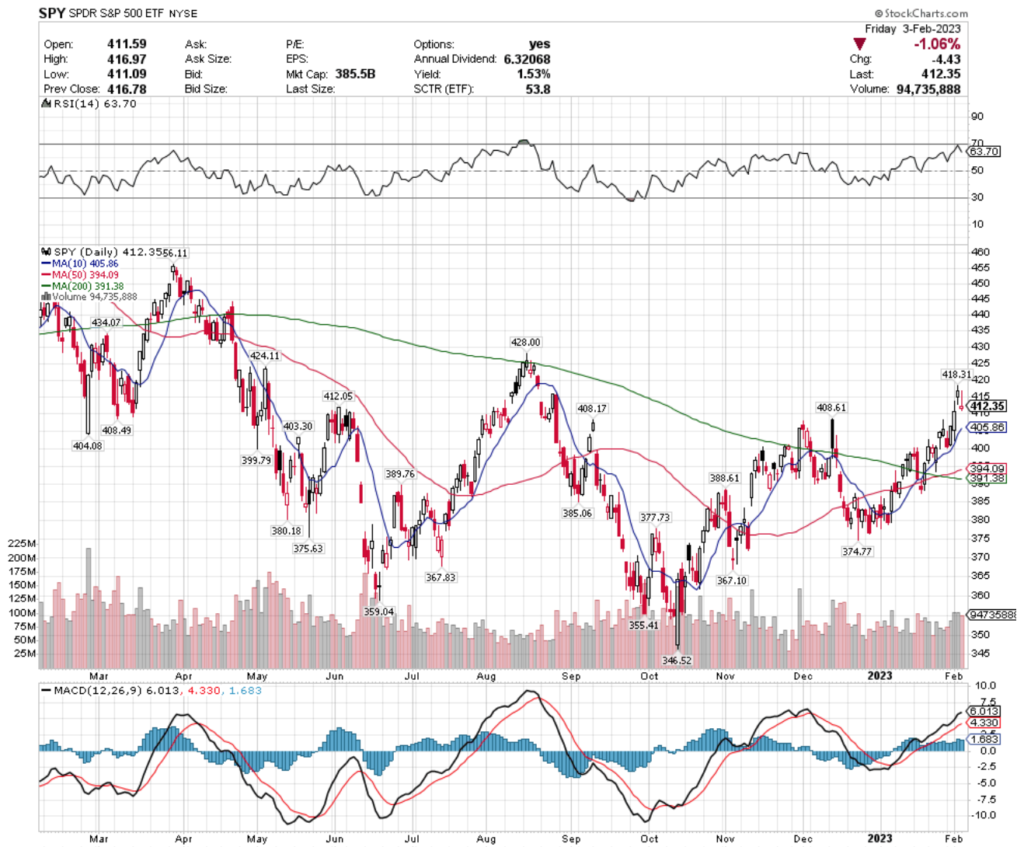
It has support at $412.05, followed by the $408 price zone, as well as support points at $405.86, $404.08 & $403.30.

The RSI is beginning to look weaker, signaling that there will be near-term weakness before they hit the $418.31 resistance level.

QQQ, the Invesco QQQ Trust ETF climbed 3.35% this week, but it is also signaling that there will be a near-term cool down period based on their RSI retreating from overbought territory.

QQQ ETF - Invesco QQQ Trust ETF's Technical Performance Over The Past Year
QQQ ETF – Invesco QQQ Trust ETF

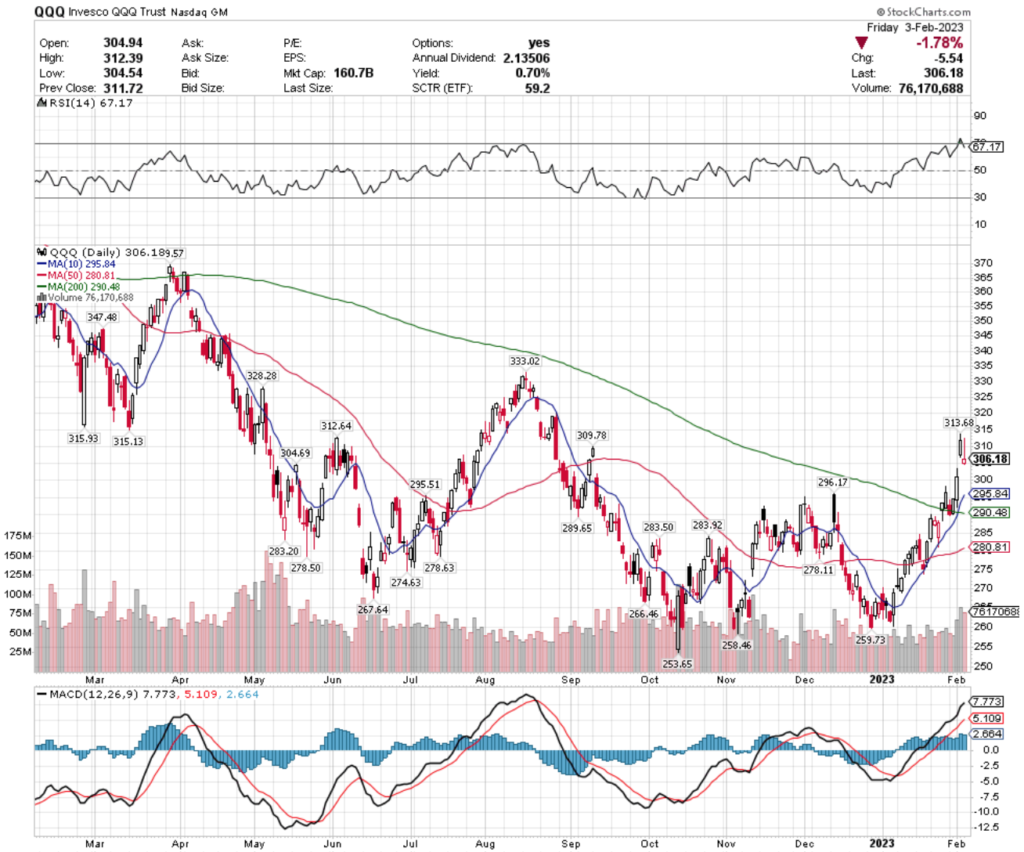
They have support at the $304.69, $296.17, $295.84 & $295.51, with resistance at the $309.78, $312.64 & $313.68/share price level.

IWM, the iShares Russell 2000 ETF gained 3.91% this week, signaling that smaller cap stocks were favorites of the week.

IWM ETF - iShares Russell 2000 ETF's Technical Performance Over The Last Year

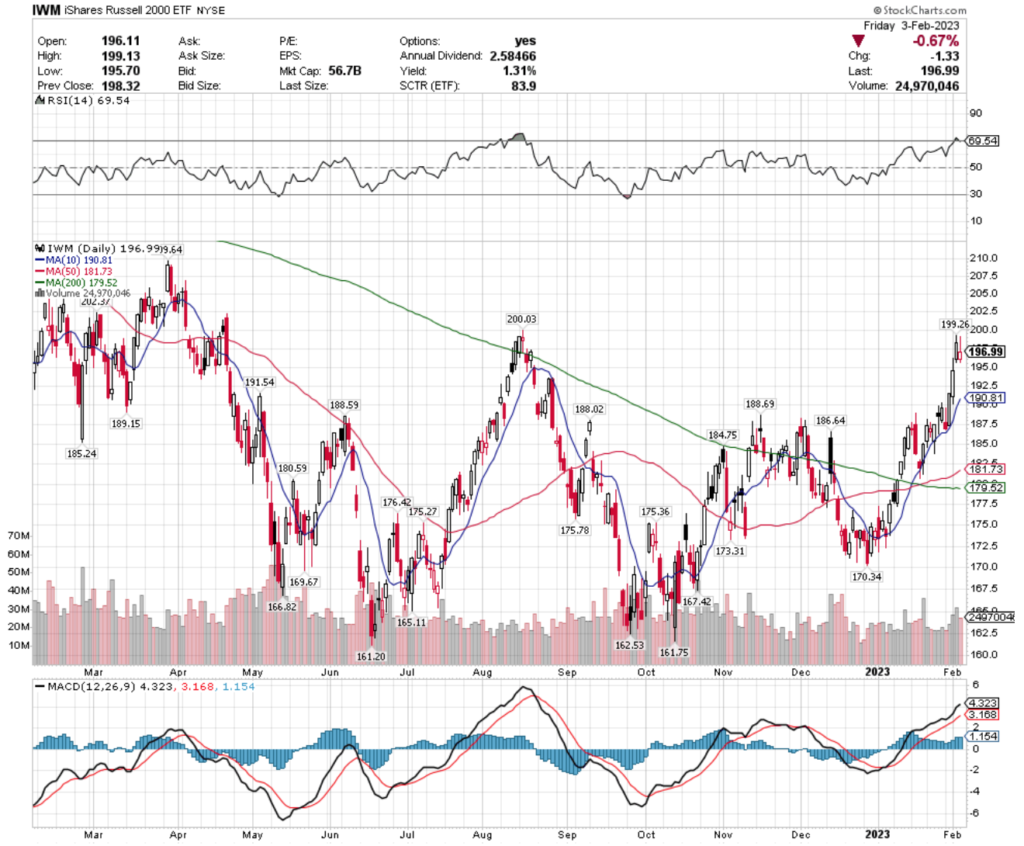
IWM ETF – iShares Russell 2000 ETF

They too are signaling a near-term cool off, with an RSI that has just dipped back underneath overbought territory.

IWM has support at $191.54, $190.81, $189.15 & multiple touch-points in the $188-range, with resistance at the $199.26, $200.03 & $202.37/share price levels.

S&P Homebuilders (XHB), S&P High Beta (SPHB), France (EWQ) & Global Copper Miners (COPX) All Bullishly Leading The Market

XHB, the SPDR S&P Homebuilders ETF is still 1% below where it was a year ago, however they have climbed 40.2% since their low in June 2022.

XHB ETF - SPDR S&P Homebuilders ETF's Technical Performance Over The Past Year
XHB ETF – SPDR S&P Homebuilders ETF

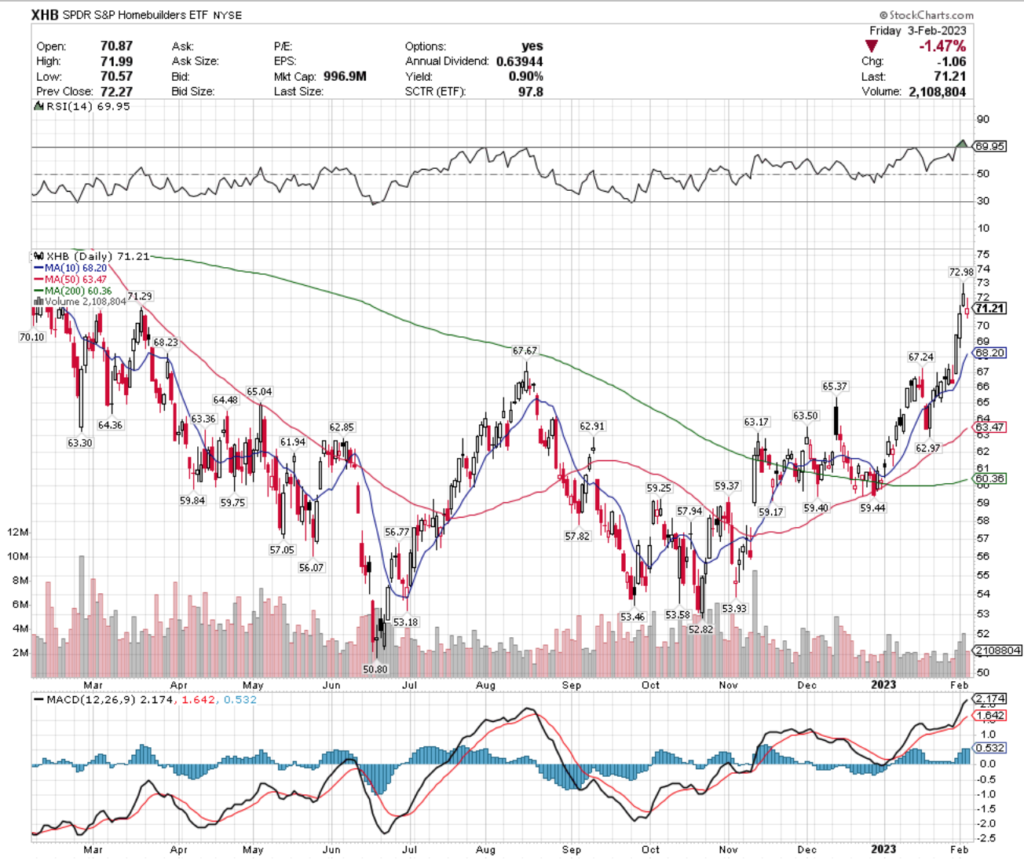
While XHB offers a slight cushion in the form of a 0.90% dividend, investors would be wise to wait for their price to correct more.

XHB has overhead resistance at $71.29 & $72.98/share, when looking at the past 52 weeks.

They have support at the $70.10, $68.23, $68.20 & $67.67/share price levels, which are where it will be interesting to see how they behave at.

SPHB, the Invesco S&P 500 High Beta ETF has also posted a strong recovery from their mid-2022 lows.

SPHB ETF - Invesco S&P 500 High Beta ETF's Technical Performance Over The Past Year
SPHB ETF – Invesco S&P 500 High Beta ETF

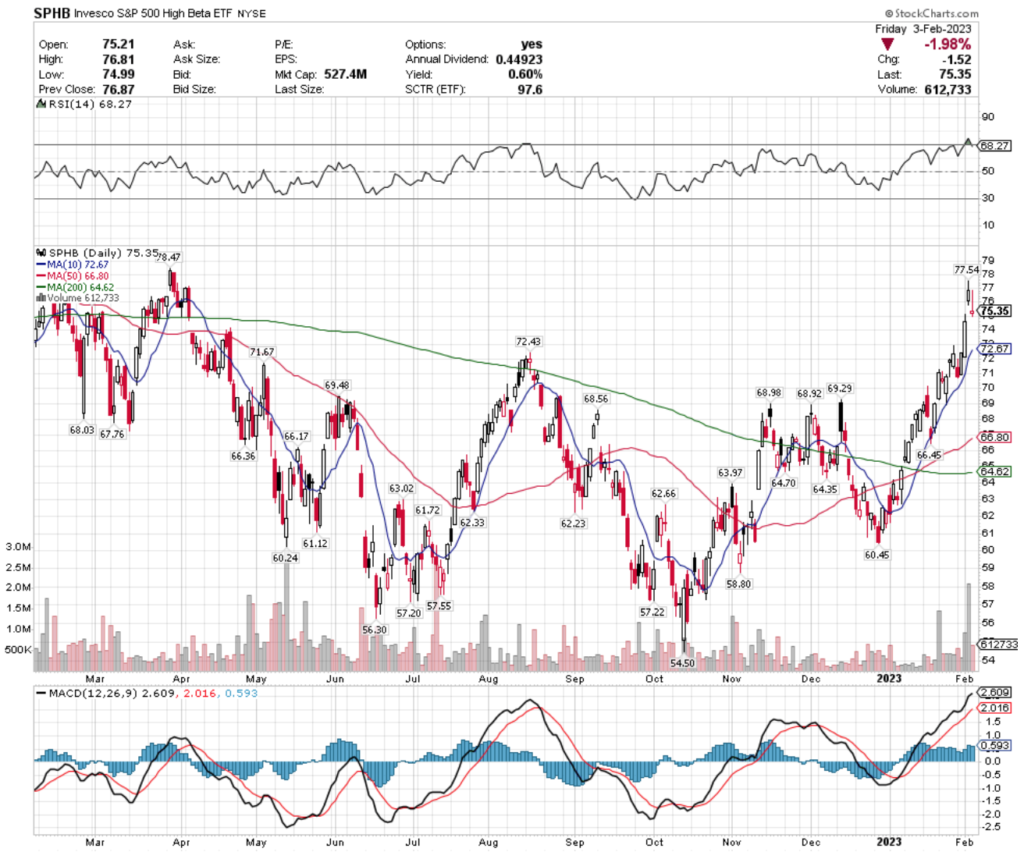
Their RSI & MACD are both signaling that they’re cooling off, and their 0.6% dividend yield does not provide an adequate cushion against losses.

EWQ, the iShares MSCI France ETF has gained 2.81% over the last year, but has climbed 188% since their lowest point in September 2022.

EWQ ETF- iShares MSCI France ETF's Technical Performance Over The Past Year
EWQ ETF- iShares MSCI France ETF

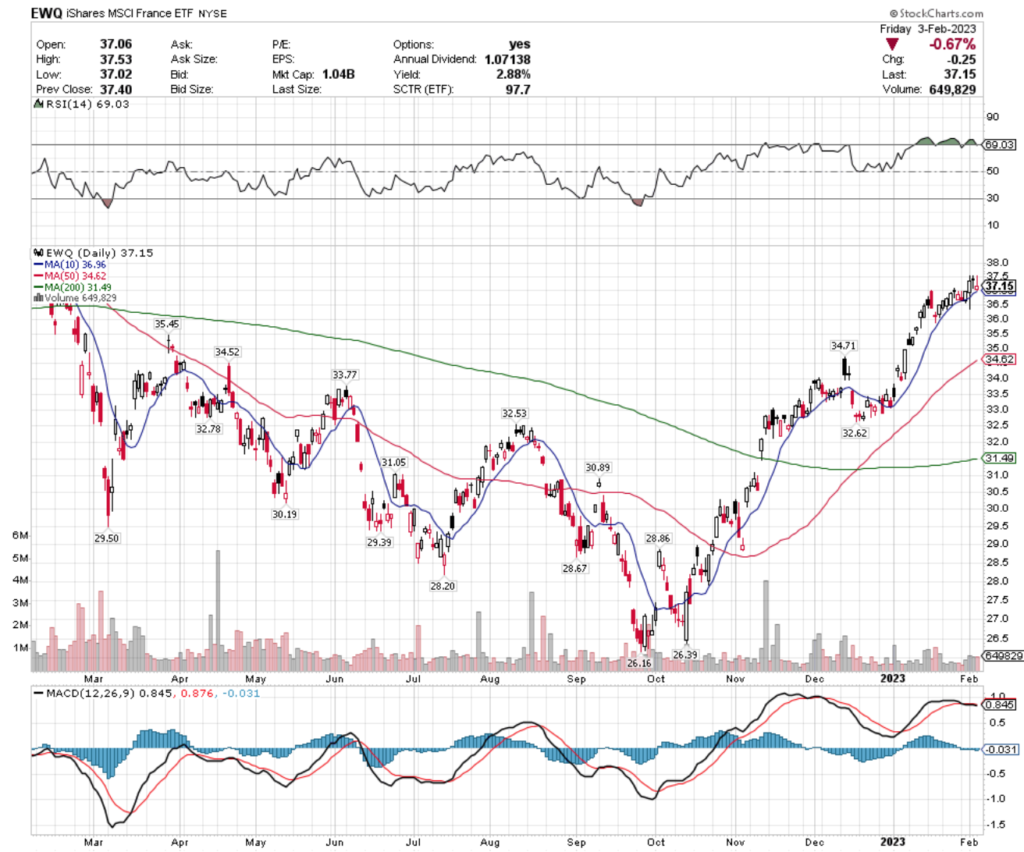
Offering a better cushion than the former mentioned ETFs with their 2.88% dividend, EWQ also looks set to drop in the near-term.

Before investing or adding to a position, it would be wise to watch how EWQ behaves at their support levels, which are $36.96, $35.45, $34.71, $34.62 & $34.52.

COPX, the Global X Copper Miners ETF has gained 9% since a year ago, with a 54.6% improvement from their low in July 2022.

COPX ETF - Global X Copper Miners ETF's Technical Performance Over The Past Year
COPX ETF – Global X Copper Miners ETF

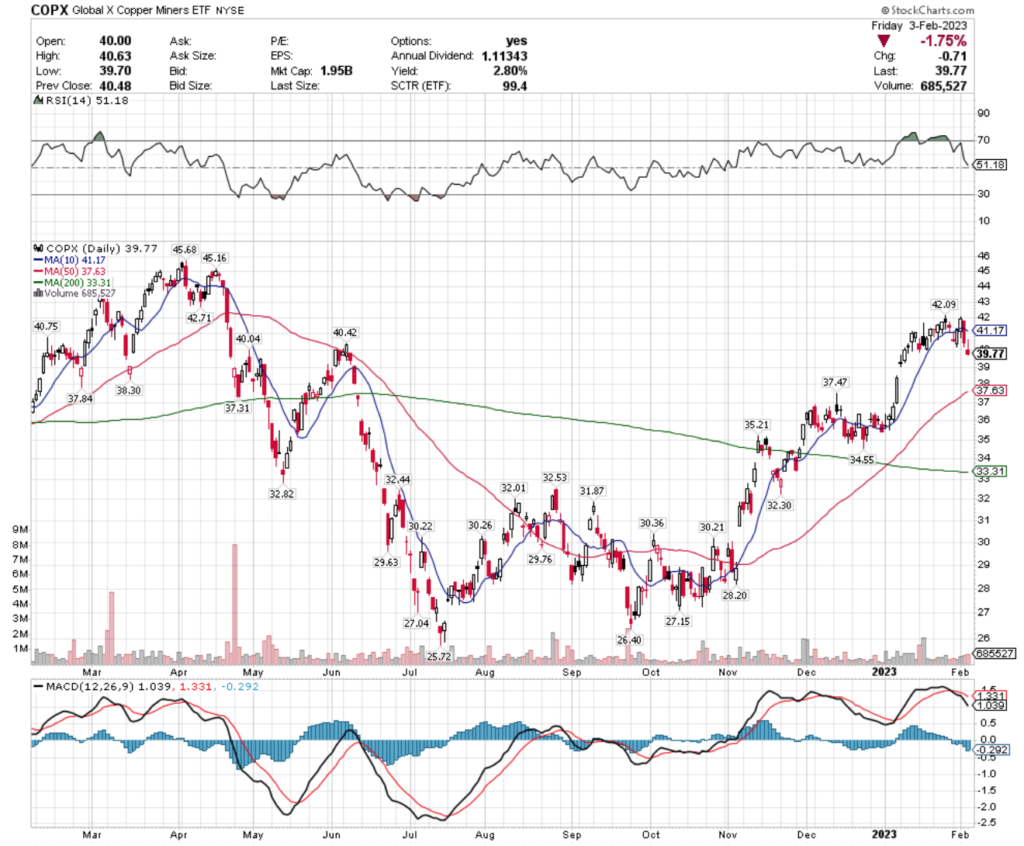
They also provide a decent cushion of 2.8% in the form of dividends for investors who hold the ETF for a year.

However, given their RSI & MACD it would be wise to wait & see how they react around their support levels in the near-term.

COPX has support at the $38.30, $37.84, $37.63, $37.47 & $37.41/share price levels.

DB Energy Fund (DBE), Japan (HEWJ), Colombia (GXG) & Wheat (WEAT) All Bearishly Lagging The Market

DBE, the Invesco DB Energy Fund ETF has gained 2.62% since a year ago, however they have dropped -32.71% from their high in June 2022.

DBE ETF - Invesco DB Energy Fund ETF's Technical Performance Over The Last Year
DBE ETF – Invesco DB Energy Fund ETF

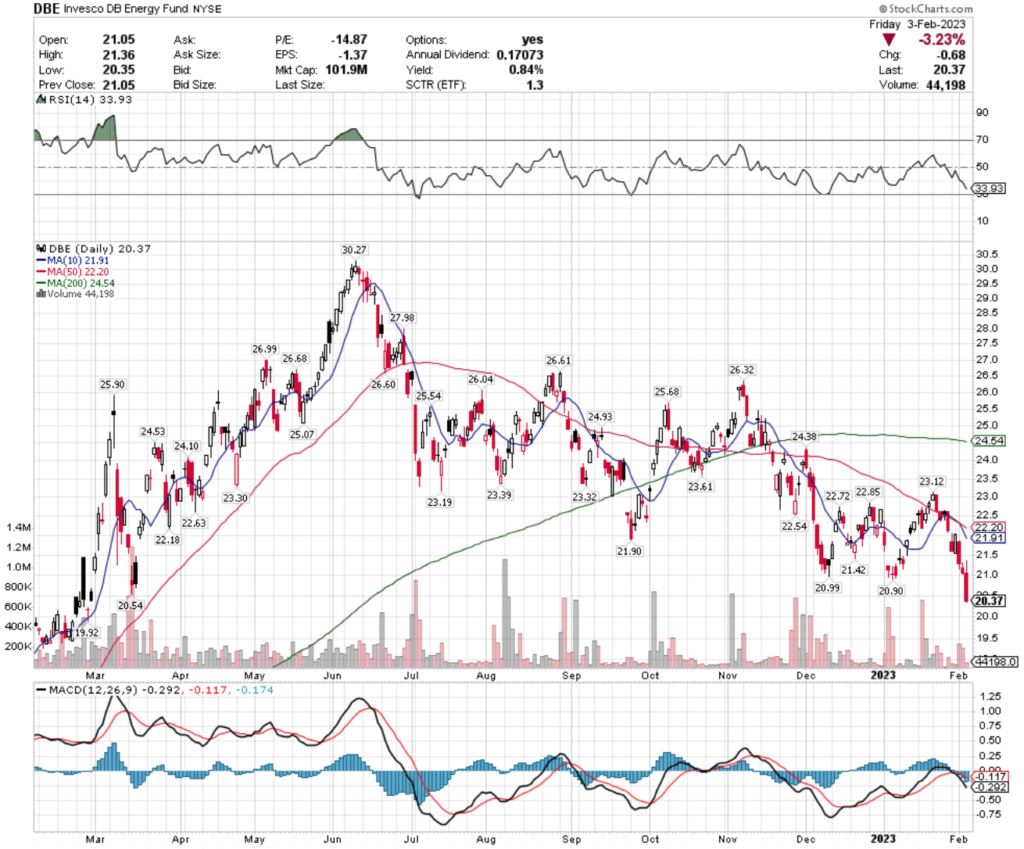
While their RSI is approaching oversold & their MACD is bearish, investors would be wise to wait to see how they react to their $19.92 support level.

With a low 0.84% dividend, there is little cushion against additional losses should they break through support bearishly.

HEWJ, the iShares Currency Hedged MSCI Japan ETF has gained 7.2% in the past year, despite falling -2.64% since their high in December 2022.

HEWJ ETF - iShares Currency Hedged MSCI Japan ETF's Technical Performance Over The Past Year
HEWJ ETF – iShares Currency Hedged MSCI Japan ETF

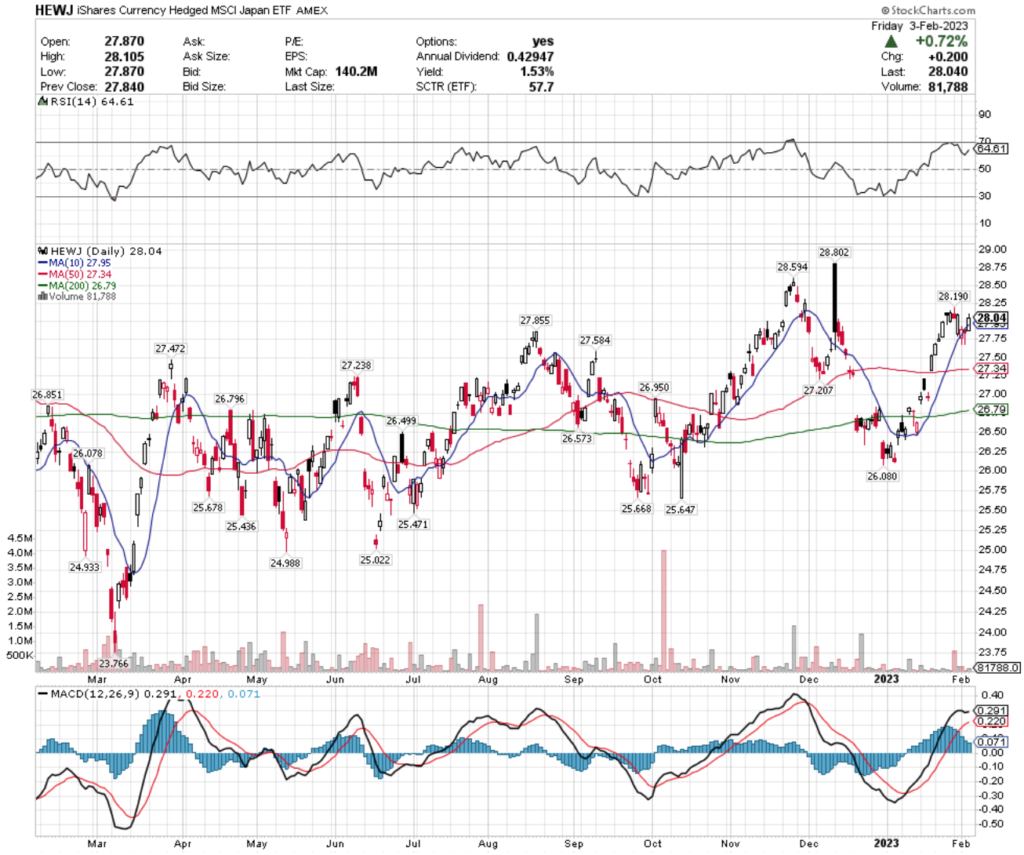
Their MACD has begun to curl over bearishly, and their RSI is approaching overbought conditions, signaling that there is more near-term pain to come.

HEWJ has a lot of support in the $27 & $26 range, including $27.95, $27.86, $27.58 & $27.47.

While they offer a 1.53% dividend, it would be wise to watch how they behave around their support zones before investing.

GXG, the Global X MSCI Colombia ETF has fallen 25.6% over the last year, with a -35.3% decrease from their April 2022 high.

GXG ETF - Global X MSCI Colombia ETF's Technical Performance Over The Past Year
GXG ETF – Global X MSCI Colombia ETF

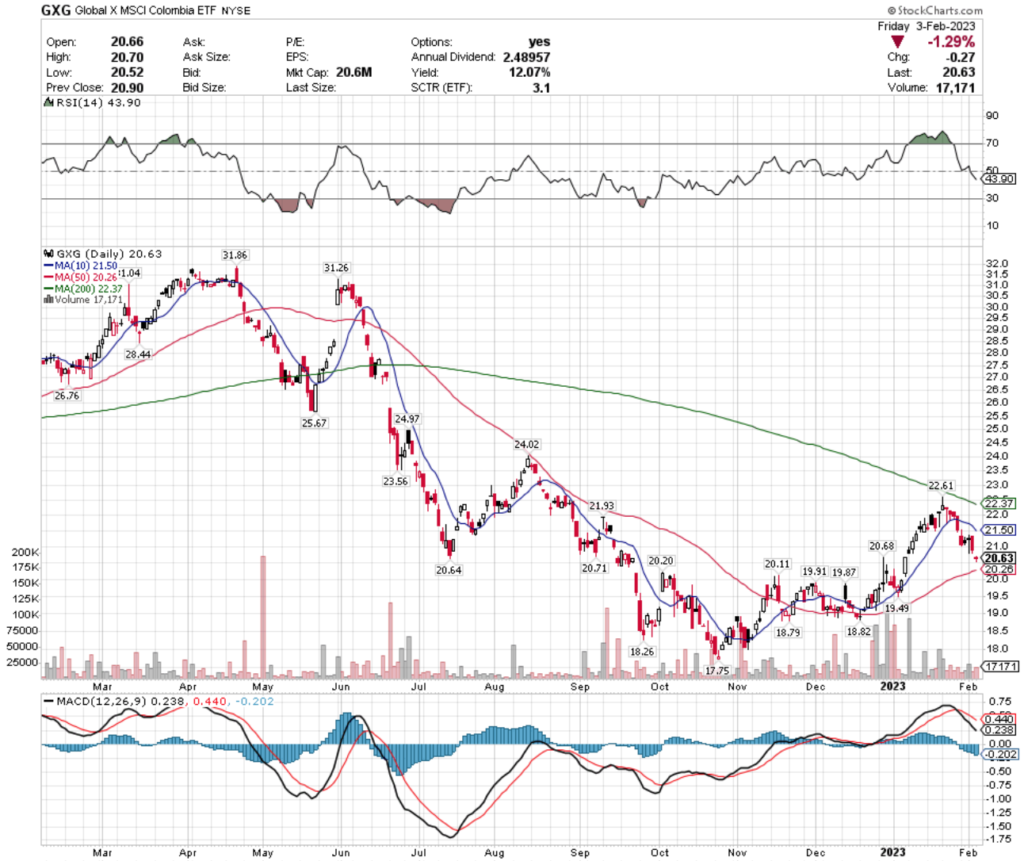
Investors intent on holding GXG for a year or longer may be able to begin making a position, as their 12% dividend will protect them for losses up to $18.15/share.

GXG has support at the $20.26, $20.20 & $20.11/share.

WEAT, the Teucrium Wheat Fund ETF has gained 5.49% since a year ago, however they have dropped -35.4% since their high in March of 2022.

WEAT ETF - Teucrium Wheat Fund ETF's Technical Performance Over The Last Year
WEAT ETF – Teucrium Wheat Fund ETF

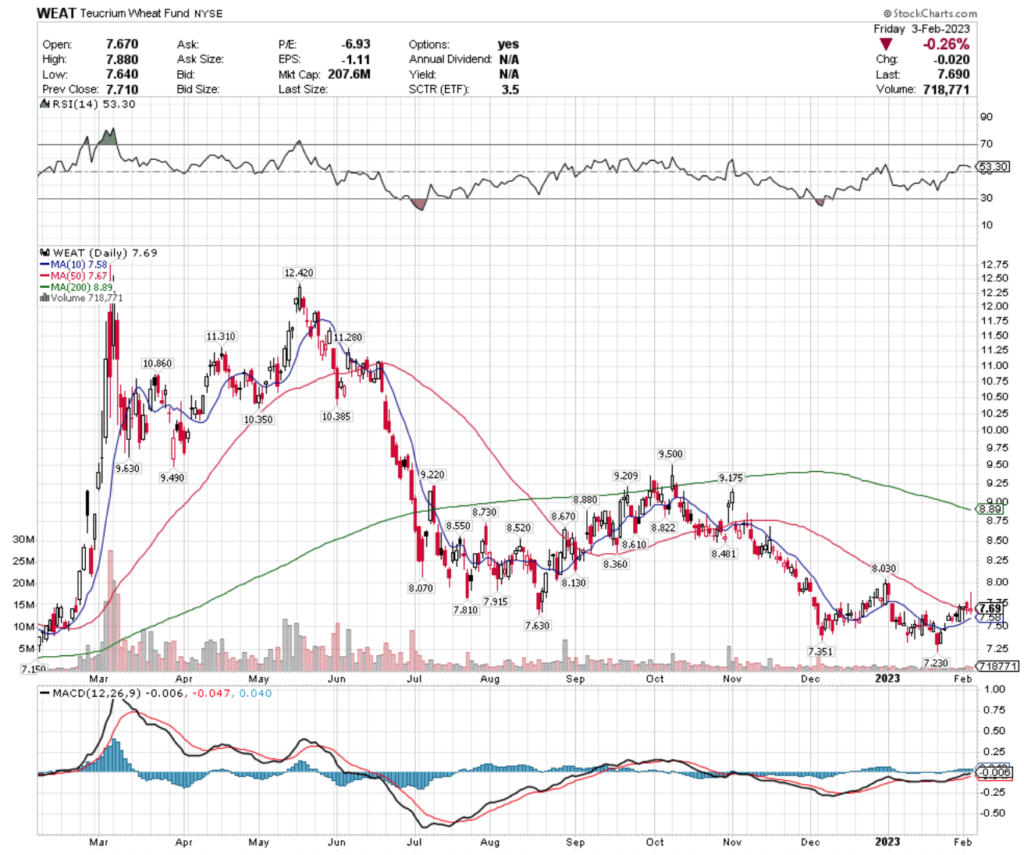
They do not offer a dividend & are very close to their 52 week low, signaling that investors should wait to see how they behave at their support levels before buying shares.

WEAT has support at the $7.63, $7.35 & $7.23/share price levels.

Tying It All Together

This week we will continue to hear earnings reports, which will likely contribute to near-term weakness in markets.

Additionally, there are a number of Federal Reserve speakers lined up for the week, which should give more insight into how dovish or hawkish policymakers really are.

Tuesday will also feature international trade deficit & consumer credit numbers, Wednesday we will get wholesale inventories revised numbers, jobless claims data on Thursday & UMich consumer sentiment & inflation expectations data.

One thing to watch will be how the market reacts to earnings & Fed speakers after a year that has been volatile & on a week with limited data being reported.

*** I DO NOT OWN SHARES OR OPTIONS POSITIONS IN SPY, QQQ, IWM, XHB, SPHB, EWQ, COPX, DBE, HEWJ, GXG & WEAT AT THE TIME OF PUBLISHING THIS ARTICLE ***

Toro Co. TTC Stock Analysis

Toro Co. stock trades under the ticker TTC & has shown recent bullishness that traders & investors should research further into.

TTC stock closed at $114.15/share on 2/2/2023.

Toro Co. TTC Stock’s Technical Performance Broken Down

Toro Co. TTC Stock's Technical Performance Over The Last Year
Toro Co. TTC Stock’s Technical Performance Over The Last Year

TTC Stock Price: $114.15

10 Day Moving Average: $110.51

50 Day Moving Average: $111.77

200 Day Moving Average: $93.10

RSI: 58.38

MACD: -0.105

Yesterday, TTC stock completed a bullish MACD crossover, gaining 1.67% on the day’s session.

Recent trading volumes have been above average compared to the year prior & their RSI is on the overbought end of neutral, signaling there may be more near-term strength to come.

TTC stock has support at the $111.77 (50 Day Moving Average) & $110.51 (10 Day Moving Average) as they try to break out above the $115.22 & $117.66/share resistance levels.

Toro Co. TTC Stock As A Long-Term Investment

Long-term oriented investors will like TTC stock’s 25.87 P/E (ttm), but may find their 8.36 P/B (mrq) to be too high.

They recently reported 22% Quarterly Revenue Growth Y-o-Y, with 95.6% Quarterly Earnings Growth Y-o-Y.

Their balance sheet will require a more thorough examination, with $188.25M of Total Cash (mrq) & $1.07B of Total Debt (mrq).

TTC stock pays a 1.07% dividend, which appears to be sustainable in the long-run as their payout ratio is 28.57%.

89.2% of TTC stock’s outstanding share float is owned by institutional investors.

Toro Co. TTC Stock As A Short-Term Trade Using Options

Traders with a shorter time horizon can use options to profit from TTC stock’s price, while hedging against volatility.

I am looking at the contracts with the 3/17 expiration date.

The $110, $100 & $105 call options are all in-the-money, listed from highest to lowest level of open interest.

The $115 & $120 puts are also all in-the-money, with the former being more liquid than the latter strike price.

Tying It All Together

TTC stock has many interesting characteristics that traders & investors should find appealing.

Investors will like their dividend yield & P/E (ttm), but may want to review their balance sheet in more detail.

Traders will like their technical set up, but should keep an eye out for increasing open interest in the March contracts after February’s expiration date.

Overall, it is worth taking a closer look into TTC stock to see how it fits into your portfolio strategy.

*** I DO NOT OWN SHARES NOR OPTIONS POSITIONS AROUND TTC STOCK AT THE TIME OF PUBLISHING THIS ARTICLE ***

PepsiCo, Inc. PEP Stock Analysis

PepsiCo, Inc. stock trades under the ticker PEP & has shown recent bullishness that traders & investors should research further into.

PEP stock closed at $169.97/share on 2/2/2023.

PepsiCo, Inc. PEP Stock’s Technical Performance Broken Down

PepsiCo, Inc. PEP Stock's Technical Performance Over The Last Year
PepsiCo, Inc. PEP Stock’s Technical Performance Over The Last Year

PEP Stock Price: $169.97

10 Day Moving Average: $170.35

50 Day Moving Average: $178.79

200 Day Moving Average: $171.65

RSI: 37.33

MACD: -2.518

Yesterday, PEP stock completed a bullish MACD crossover, despite dropping 0.93% on the day’s session.

Recent trading volumes have been roughly average compared to the year prior & their RSI is on the oversold end at 37.33, signaling there may be near-term declines that can be used to enter or add to a position.

They have support at the $168.43 & $167.46/share price level, as they try to break out above their $170.35 & $170.96/share resistance levels.

PepsiCo, Inc. PEP Stock As A Long-Term Investment

Long-term oriented investors will like PEP stock’s 24.25 P/E (ttm), but will likely find their 12.3 P/B (mrq) to be higher than they’d prefer.

They recently reported 8.8% Quarterly Revenue Growth Y-o-Y, with 21.5% Quarterly Earnings Growth Y-o-Y.

Their balance sheet will require a more thorough examination before investing, with $6.74B of Total Cash (mrq) & $39.25B of Total Debt (mrq).

PEP stock pays a 2.59% dividend, which may not be sustainable in the long-run, as their payout ratio is 63.66%.

75.45% of PEP stock’s outstanding share float is owned by institutional investors.

PepsiCo, Inc. PEP Stock As A Short-Term Trade Using Options

Traders with a shorter time horizon can use options to profit from price movements in PEP stock, while protecting their portfolio from volatility.

I am looking at the contracts with the 3/17 expiration date.

The $165, $160 & $155 call options are all in-the-money, with the former having more open interest than the latter strikes.

The $170, $175 & $180 puts are also all in-the-money, listed from most to least liquid strike.

Tying It All Together

PEP stock has many interesting characteristics that traders & investors are sure to find appealing.

Investors will like their dividend yield & P/E (ttm), but may want to look at their balance sheet to see how sustainable their yield is in the longer-run.

Traders will like their current technical positioning & liquid options.

Overall, it is worth taking a closer look into PEP stock to see how it fits into your portfolio strategy.

*** I DO NOT OWN SHARES OR OPTIONS POSITIONS AROUND PEP STOCK AT THE TIME OF PUBLISHING THIS ARTICLE ***

Altria Group, Inc. MO Stock Analysis

Altria Group, Inc. stock trades under the ticker MO & has shown recent bullishness that traders & investors should take a closer look into.

MO stock closed at $47.54/share on 2/1/2023.

Altria Group, Inc. MO Stock’s Technical Performance Broken Down

Altria Group, Inc. MO Stock's Technical Performance Over The Past Year
Altria Group, Inc. MO Stock’s Technical Performance Over The Past Year

MO Stock Price: $47.54

10 Day Moving Average: $44.95

50 Day Moving Average: $45.36

200 Day Moving Average: $44.80

RSI: 67.38

MACD: -0.006

Yesterday, MO stock completed a bullish MACD crossover, gapping up 5.55%.

Recent trading volumes have been about average compared to the year prior & heir RSI is approaching overbought territory, and it’s best to see if they fill yesterday’s gap in the coming days.

MO stock has support at the $47.34 & $46.94/share price levels, as they try to break out above the $47.57 & $48.21 resistance levels.

Altria Group, Inc. MO Stock As A Long-Term Investment

Long-term oriented investors will like MO stock’s 17.18 P/E (ttm).

They recently reported -2.2% Quarterly Revenue Growth Y-o-Y.

Their balance sheet will require a more thorough review, with $2.48B of Total Cash (mrq) & $26.29B of Total Debt (mrq).

MO stock offers an 8.08% dividend, which may not be sustainable in the long-run, as their payout ratio is over 100%.

59% of MO stock’s outstanding share float is owned by institutional investors.

Altria Group, Inc. MO Stock As A Short-Term Trade Using Options

Traders with shorter time horizons can trade options to profit from MO stock price’s movements, while hedging against market volatility.

I am looking at the contracts with the 3/17 expiration date.

The $47.50, $42.50 & $45 call options are all in-the-money, with the former having more open interest than the latter strikes.

The $42.50, $45 & $47.50 puts are also all in-the-money, listed from highest to lowest levels of open interest.

Tying It All Together

MO stock has many interesting characteristics that traders & investors will find appealing.

Long-term investors seeking dividends may find them appealing, however they should be mindful that their yield could be cut & should be aware of their other fundamentals.

Traders will like their recent technical performance, as well as how liquid their options are.

Overall, it is worth taking a closer look into MO stock to see how it fits into your portfolio strategy.

*** I DO NOT OWN SHARES OF MO STOCK AT THE TIME OF PUBLISHING THIS ARTICLE ***

Deere & Co. DE Stock Analysis

Deere & Co. stock trades under the ticker DE & has shown recent bullishness that traders & investors should take a closer look into.

DE stock closed at $426.99/share on 2/1/2023.

Deere & Co. DE Stock’s Technical Performance Broken Down

Deere & Co. DE Stock's Technical Performance Over The Last Year
Deere & Co. DE Stock’s Technical Performance Over The Last Year

DE Stock Price: $426.99

10 Day Moving Average: $416.87

50 Day Moving Average: $429.39

200 Day Moving Average: $373.43

RSI: 52.81

MACD: -1.839

Yesterday, DE stock completed a bullish MACD crossover, gaining 0.98% on the day’s session.

Recent trading volumes have been below average compared to the year prior & their RSI is neutral, signaling that there is currently some uncertainty about the value of their shares.

DE stock has support at the $420.48 & $416.87/share price levels, as they try to break out above their $429.39 (50 Day Moving Average) & $432.64/share resistance levels.

Deere & Co. DE Stock As A Long-Term Investment

Long-term oriented investors will like DE stock’s 18.09 P/E (ttm), but their 6.18 P/B (mrq) may be a bit higher than what many investors like.

DE stock recently reported 37.2% Quarterly Revenue Growth Y-o-Y, with 75.1% Quarterly Earnings Growth Y-o-Y.

Their balance sheet will require a more thorough examination, with $4.13B of Total Cash (mrq) & $53.31B of Total Debt (mrq).

DE stock pays a 1.03% dividend, which appears to be sustainable in the long-run, as their payout ratio is 18.73%.

79.57% of DE stock’s outstanding share float is owned by institutional investors.

Deere & Co. DE Stock As A Short-Term Trade Using Options

Short-term focused traders can use options to profit from price movements in DE stock, while protecting their portfolio from volatility.

I am looking at the contracts with the 3/17 expiration date.

The $400, $410 & $390 call options are all in-the-money, listed from highest to lowest level of open interest.

The $440, $450 & $430 puts are also all in-the-money, with the former strike prices being more liquid than the latter.

Tying It All Together

DE stock has many interesting attributes that traders & investors will find appealing.

Investors will like their dividend yield, as well as their valuation metrics, but may want to review their balance sheet further before buying.

Traders will like their recent technical performance, as well as how liquid their options are.

All-in-all, it is worth taking a closer look into DE stock to see how it fits into your portfolio strategy.

*** I DO NOT OWN SHARES OR OPTIONS CONTRACT POSITIONS AROUND DE STOCK AT THE TIME OF PUBLISHING THIS ARTICLE ***

Coca Cola Co. KO Stock Analysis

Coca Cola Co. stock trades under the ticker KO & has shown recent bullishness that traders & investors should research further into.

KO stock closed at $61.32/share on 1/31/2023.

Coca Cola Co. KO Stock’s Technical Performance Broken Down

Coca Cola Co. KO Stock's Technical Performance Over The Last Year
Coca Cola Co. KO Stock’s Technical Performance Over The Last Year

KO Stock Price: $61.32

10 Day Moving Average: $60.46

50 Day Moving Average: $62.39

200 Day Moving Average: $61.16

RSI: 48.63

MACD: -0.502

Yesterday, KO stock completed a bullish MACD crossover, gaining 1.12% on the day’s session.

Recent trading volumes have been about average compared to the year prior & their RSI is neutral, signaling that there is still uncertainty around the current value of KO shares.

Yesterday’s candle was a hanging man, signaling near-term bearish sentiment.

KO stock has support at the $61.25 & $61.21/share price levels, as they attempt to break out above their $62.39 & $63.26/share resistance levels.

Coca Cola Co. KO Stock As A Long-Term Investment

Investors with long time horizons will like KO stock’s 26.67 P/E (ttm), but will find their 11.53 P/B (mrq) to be a bit high.

They recently reported 10.2% Quarterly Revenue Growth Y-o-Y, with 14.3% Quarterly Earnings Growth Y-o-Y.

Their balance sheet will require a more thorough examination, with $13.22B of Total Cash (mrq) & $41.19B of Total Debt (mrq).

KO stock pays a 2.87% dividend, which may not be sustainable in the long-run, as their payout ratio is 76.32%.

71.45% of KO stock’s outstanding share float is owned by institutional investors.

Coca Cola Co. KO Stock As A Short-Term Trade Using Options

Traders with a shorter time horizon can trade options to profit from KO stock’s price movements, while protecting their portfolio from volatility.

I am looking at the contracts with the 3/17 expiration date.

The $60, $55 & $57.50 call options are all in-the-money, with the former strike prices being more liquid than the latter.

The $62.50, $65 & $67.50 puts are also all in-the-money, listed from highest to lowest level of open interest.

Tying It All Together

KO stock has many interesting characteristics that investors & traders are sure to like.

Investors will like their dividend yield, as well as their P/E (ttm), but may want to review their balance sheet in more detail before investing.

Traders will like their recent technical performance & how liquid their options are.

Overall, it is worth taking a closer look into KO stock to see how it fits into your portfolio strategy.

*** I DO NOT OWN SHARES OR OPTIONS POSITIONS AROUND KO STOCK AT THE TIME OF PUBLISHING THIS ARTICLE ***

Kellogg Co. K Stock Analysis

Kellogg Co. stock trades under the ticker K & has shown recent bullishness that traders & investors should take a closer look into.

K stock closed at $68.58/share on 1/31/2021.

Kellogg Co. K Stock’s Technical Performance Broken Down

Kellogg Co. K Stock's Technical Performance Over The Last Year
Kellogg Co. K Stock’s Technical Performance Over The Last Year

K Stock Price: $68.58

10 Day Moving Average: $67.69

50 Day Moving Average: $71.03

200 Day Moving Average: $70.74

RSI: 43.29

MACD: -1.008

Yesterday, K stock completed a bullish MACD crossover, gaining 0.72% on the day.

Recent trading volumes have been below average compared to the year prior, and their RSI is still on the oversold side at 43, signaling that there is still uncertainty as to the near-term market valuation of K stock.

Yesterday’s candlestick is a hanging man, signaling bearish sentiment.

K stock has support at the $68.50 & $68.26/share price levels as they try to break out above their $68.66-8 & $68.93/share resistance levels.

Kellogg Co. K Stock As A Long-Term Investment

Long-term oriented investors will like K stock’s 15.52 P/E (ttm), but may find their 5.38 P/B (mrq) to be a bit rich.

They recently reported 8.9% Quarterly Revenue Growth Y-o-Y, with 1% Quarterly Earnings Growth Y-o-Y.

Their balance sheet will warrant a more thorough review before investing, with a reported $375M of Total Cash (mrq) & $7.39B of Total Debt (mrq).

K stock pays a 3.42% dividend, which appears to be sustainable in the long-run as their payout ratio is 53.56%.

85.4% of K stock’s outstanding share float is owned by institutional investors.

Kellogg Co. K Stock As A Short-Term Trade Using Options

Traders focused on a shorter time horizon can trade options to profit from K stock’s price movements, while protecting their portfolio from volatility.

I am looking at the contracts with the 3/17 expiration date.

The $67.50, $65 & $62.50 call options are all in-the-money, listed from highest to lowest level of open interest.

The $75, $70 & $72.50 puts are also all in-the-money, with the former being more liquid than the latter strikes.

Tying It All Together

K stock has many interesting attributes that traders & investors are sure to like.

Investors will like their dividend yield, but may want to get a more thorough understanding of the structure of their balance sheet before investing.

Traders will like how liquid their options are, as well as their recent technical performance.

All-in-all, it is worth taking a closer look at K stock to see how it fits into your portfolio strategy.

*** I DO NOT OWN SHARES OR HAVE OPTIONS CONTRACTS IN K STOCK AT THE TIME OF PUBLISHING THIS ARTICLE ***

Domino’s Pizza Group LTD DPZ Stock Analysis

Domino’s Pizza Group LTD’s stock trades under the ticker DPZ & has shown recent bullish behavior that traders & investors should look closer into.

DPZ stock closed at $44.25/share on 1/18/2023.

Domino’s Pizza Group LTD DPZ Stock’s Technical Performance Broken Down

Domino's Pizza Group LTD DPZ Stock's Technical Performance Over The Last Year
Domino’s Pizza Group LTD DPZ Stock’s Technical Performance Over The Last Year

DPZ Stock Price: $346.48

10 Day Moving Average: $341.50

50 Day Moving Average: $359.20

200 Day Moving Average: $363.16

RSI: 48.28

MACD: -4.774

Yesterday, DPZ stock completed a bullish MACD crossover, rising +0.67% for the session.

Recent trading volumes are slightly below their annual average & their RSI is about neutral, signaling uncertainty on where the market values their share price.

This volatility will provide entry points for traders & investors to build upon or begin a DPZ stock position.

DPZ stock has support at the $341.50 & $340.44/share price levels, as they try to break out above their $351.01 & $353.82/share resistance levels.

Domino’s Pizza Group LTD DPZ Stock As A Long-Term Investment

Long-term oriented investors will like DPZ stock’s 27.32 P/E (ttm), but will be disappointed by their P/B (mrq).

They recently reported 7.1% Quarterly Revenue Growth Y-o-Y, with -16.5% Quarterly Earnings Growth Y-o-Y.

Their balance sheet will also require a more thorough examination, with $114.78M of Total Cash (mrq) & $5.38B of Total Debt (mrq).

DPZ stock pays a 1.23% dividend, which appears to be sustainable in the long-run, as their payout ratio is 34.33%.

93.83% of DPZ stock’s outstanding share float is owned by institutional investors.

Domino’s Pizza Group LTD DPZ Stock As A Short-Term Trade Using Options

Traders who have shorter time frames can trade options to profit from DPZ stock’s price movements, while also protecting their portfolios from broader market volatility.

I am looking at the contracts with the 2/17 expiration date.

The $330, $340 & $320 call options are all in-the-money, listed from highest to lowest level of open interest.

The $350, $360 & $370 puts are also all in-the-money, listed from most to least liquid strike.

Tying It All Together

DPZ stock has many interesting attributes that investors and traders are sure to like.

Investors will like their dividend yield, but may want to review their balance sheet structure in more detail before investing.

Traders will like their recent technical performance & how liquid their options are.

All-in-all, it is worth taking a closer look into DPZ stock to see how it fits into your portfolio strategy.

*** I DO NOT OWN SHARES NOR OPTIONS CONTRACT POSITIONS AROUND DPZ STOCK AT THE TIME OF PUBLISHING THIS ARTICLE ***

Caseys General Store, Inc. CASY Stock Analysis

Caseys General Store, Inc. stock trades under the ticker CASY & has shown recent bullishness that traders & investors should research further into.

CASY stock closed at $229.95/share on 1/17/2023.

Caseys General Store, Inc. CASY Stock’s Technical Performance Broken Down

Caseys General Store, Inc. CASY Stock's Technical Performance Over The Last Year

CASY Stock Price: $229.95

10 Day Moving Average: $222.04

50 Day Moving Average: $233.55

200 Day Moving Average: $212.08

RSI: 52.53

MACD: -3.046

Yesterday, CASY stock completed a bullish MACD crossover, gapping up +2.3% for the day’s session.

Recent trading volumes have been about average compared to the year prior, and their RSI is neutral, signaling that they may have more short-term momentum to come.

CASY stock has support at the $227.49 & $223.53/share price level, as they try to break out above the $233.55 & $234.14/share resistance levels.

Caseys General Store, Inc. CASY Stock As A Long-Term Investment

Long-term oriented investors will like CASY stock’s 20.3 P/E (ttm), but will find their 3.33 P/B (mrq) to be a bit higher than they’d like.

They recently reported 21.9% Quarterly Revenue Growth Y-o-Y, with 42.1% Quarterly Earnings Growth Y-o-Y.

Their balance sheet will require a more thorough examination, with $414.8M of Total Cash (mrq) & $1.67B of Total Debt (mrq).

CASY stock pays a 0.65% dividend, which appears to be sustainable in the long-run, as their payout ratio is 13.19%.

87.24% of CASY stock’s outstanding share float is owned by institutional investors.

Caseys General Store, Inc. CASY Stock As A Short-Term Trade Using Options

Traders with shorter time horizons can trade options to profit from CASY stock’s price movements, while protecting their portfolios from volatility.

I am looking at the contracts with the 2/17 expiration date.

The $220, $210 & $195 call options are all in-the-money, listed from highest to lowest level of open interest.

The $230, $240 & $260 puts are also all in-the-money, with the former strikes being more liquid than the latter.

Tying It All Together

CASY stock has many interesting characteristics that traders & investors will find appealing.

Investors will like their recent growth & dividend yield, but may want to look closer into the makeup of their balance sheet.

Traders will like their recent technical performance, but may wish their options were a bit more liquid.

Overall, it is worth taking a closer look into CASY stock to see how it fits into your portfolio strategy.

*** I DO NOT OWN SHARES OR OPTIONS POSITIONS AROUND CASY STOCK AT THE TIME OF PUBLISHING THIS ARTICLE ***

Microsoft Corp. MSFT Stock Analysis

Microsoft Corp. stock trades under the ticker MSFT & has shown recent bullish behavior that traders & investors should research deeper into.

MSFT stock closed at $239.23/share on 1/14/2023.

Microsoft Corp. MSFT Stock’s Technical Performance Broken Down

Microsoft Corp. MSFT Stock's Technical Performance Over The Last Year
Microsoft Corp. MSFT Stock’s Technical Performance Over The Last Year

MSFT Stock Price: $239.23

10 Day Moving Average: $232.52

50 Day Moving Average: $239.84

200 Day Moving Average: $256.79

RSI: 51.68

MACD: -2.601

On Friday, MSFT stock completed a bullish MACD crossover, closing +0.3% on the day.

Despite having decent volume compared to the year prior & 6 straight days of gains, Friday’s hanging man candle implies a bearish movement on the horizon for them, which may offer new entries into positions.

MSFT stock has support at the $233.87 & $232.52/share price level, as they try to break out above the $239.84 & $240.32/share resistance levels.

Microsoft Corp. MSFT Stock As A Long-Term Investment

Long-term oriented investors will like MSFT stock’s 25.75 P/E (ttm), but will find their 10.27 P/B (mrq) to be higher than they’d normally like.

They recently reported 10.6% Quarterly Revenue Growth Y-o-Y, with -14.4% Quarterly Earnings Growth Y-o-Y.

Their balance sheet looks strong, with $107.24B of Total Cash (mrq) & $77.14B of Total Debt (mrq).

MSFT stock pays a 1.06% dividend, which appears to be sustainable in the long-run, with a 26.7% payout ratio.

73.35% of MSFT stock’s outstanding share float is owned by institutional investors.

Microsoft Corp. MSFT Stock As A Short-Term Trade Using Options

Traders who are interested in shorter time frames can use options to profit from MSFT stock’s price movements, while hedging their portfolio against broader market volatility.

I am looking at the contracts with the 2/17 expiration date.

The $235, $230 & $225 calls are all in-the-money, listed in order of highest to lowest level of open interest.

The $240, $245 & $250 puts are also all in-the-money, with the former being more liquid than the latter strikes.

Tying It All Together

MSFT stock has many interesting characteristics that traders & investors should find appealing.

Investors will like their healthy balance sheet & dividend yield.

Traders will like their recent technical performance & their liquid options market.

All-in-all, it is worth taking a closer look into how MSFT stock fits into your portfolio strategy.

*** I DO NOT OWN SHARES OF NOR OPTIONS POSITIONS AROUND MSFT STOCK AT THE TIME OF PUBLISHING THIS ARTICLE ***