KB Financial Group Inc. stock trades under the ticker KB & has shown bullishness that traders & investors should take a closer look into.
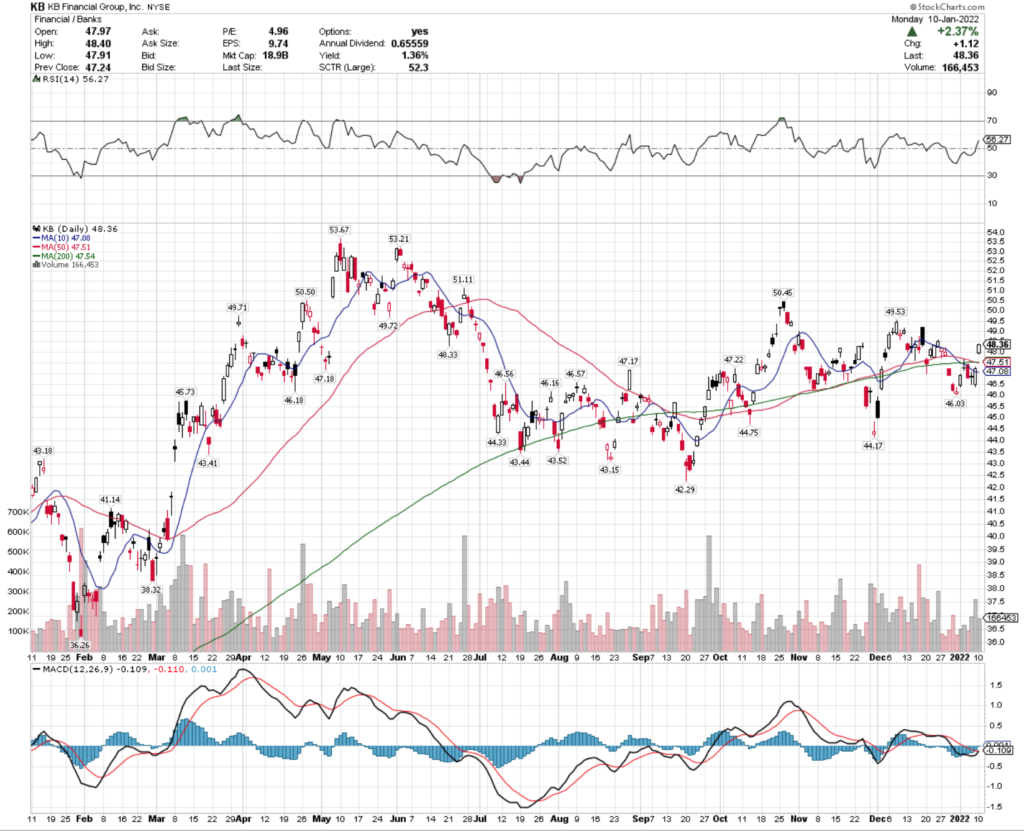
KB stock closed at $48.36/share on 1/11/22, after a 2.4% gap up, on above average trading volume.
KB Financial Group, Inc. KB Stock’s Technicals Broken Down
KB Stock Price: $48.36
10 Day Moving Average: $47.08
50 Day Moving Average: $47.51
200 Day Moving Average: $47.54
RSI: 56.3
MACD: 0.34
Yesterday, KB stock completed a bullish MACD crossover, while also gapping up 2.4% & breaking out above all of their major moving averages.
Their trading volume has been stronger than average for the past year so far going into 2022.
Their next test of resistance will be at the $49.03-level, followed by the $50.45-level.
KB Financial Group, Inc. KB Stock As A Long-Term Investment
Investors may find KB Financial Group, Inc. stock’s valuation metrics appealing, with a P/E (ttm) of 5.34 & a P.B (mrq) of 0.48.
KB stock had 14.4% Quarterly Revenue Growth Y-o-Y.
Their Balance Sheet will require a deeper dive to sort through thought, with Total Cash (mrq) of $77.41T & Total Debt (mrq) of $133.3T.
KB pays a 4.6% dividend yield, which should be safe, although their payout ratio is a bit rich at 57%, which could indicate a need to cut the yield in the future possibly.
KB stock only has 5.9% of its share float held by institutional investors.
KB Financial Group, Inc. KB Stock As A Short-Term Trade Using Options
KB Financial Group, Inc. has options that traders can use to take advantage of price movement in either direction.
I am looking at the contracts with the 1/21 expiration date.
The $50 calls look appealing, although very illiquid with 22 contracts of open interest.
The $50 puts also look appealing, but illiquid as well.
There is more liquidity in the $45 puts, indicating that the sentiment for KB stock has changed recently regarding its near-term sentiment from more bearish to being more bullish.
Tying It All Together
KB Financial Group, Inc. has many interesting attributes that traders & investors may be interested in.
Investors will like their international banking exposure & valuation metrics, although be slightly weary about their balance sheet.
Traders will like their current momentum, but be troubled by the lack of open interest in their options contracts.
However, their put volume shows either people were hedging at the $45/share mark, or the sentiment has changed for them in the near-term to a more bullish tune.
Overall, it is worth taking a closer look at KB stock.
One week into 2022 & its already been a hell of a time.
Broader indexes are already having difficulties in the new year, as investors try to make sense of what the Fed’s policies for the year & how that will impact inflation & investing strategies, all while trying to understand what Omicron’s impact on life will be.
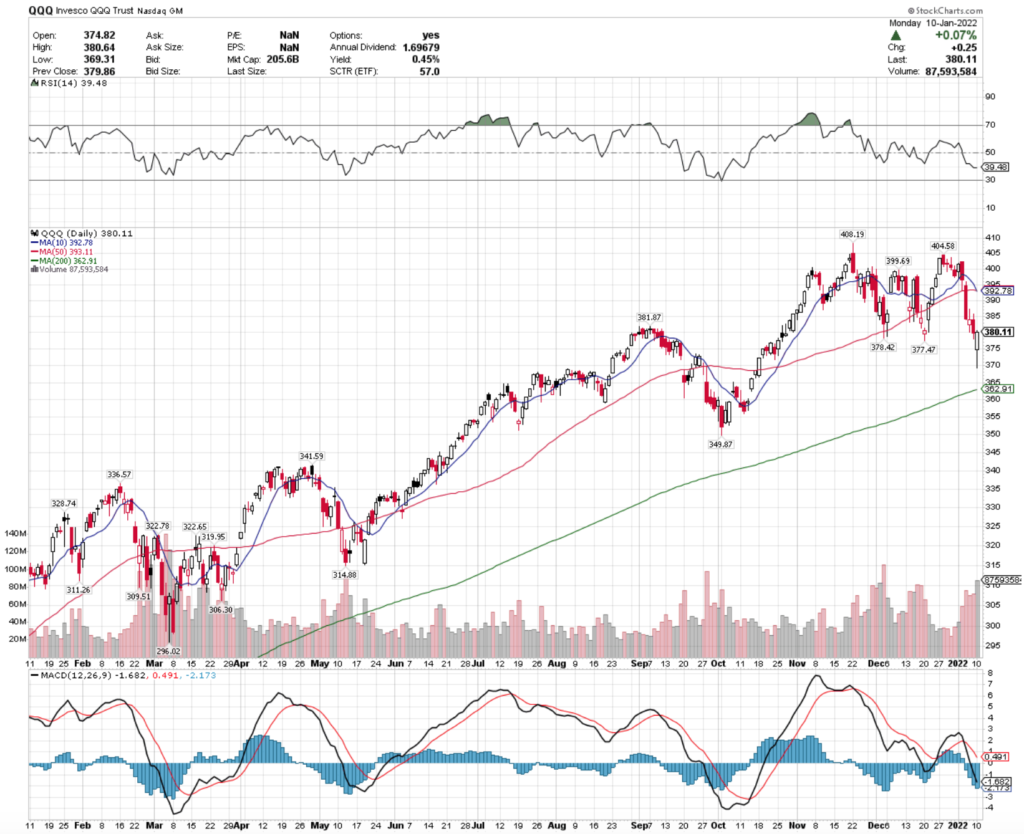
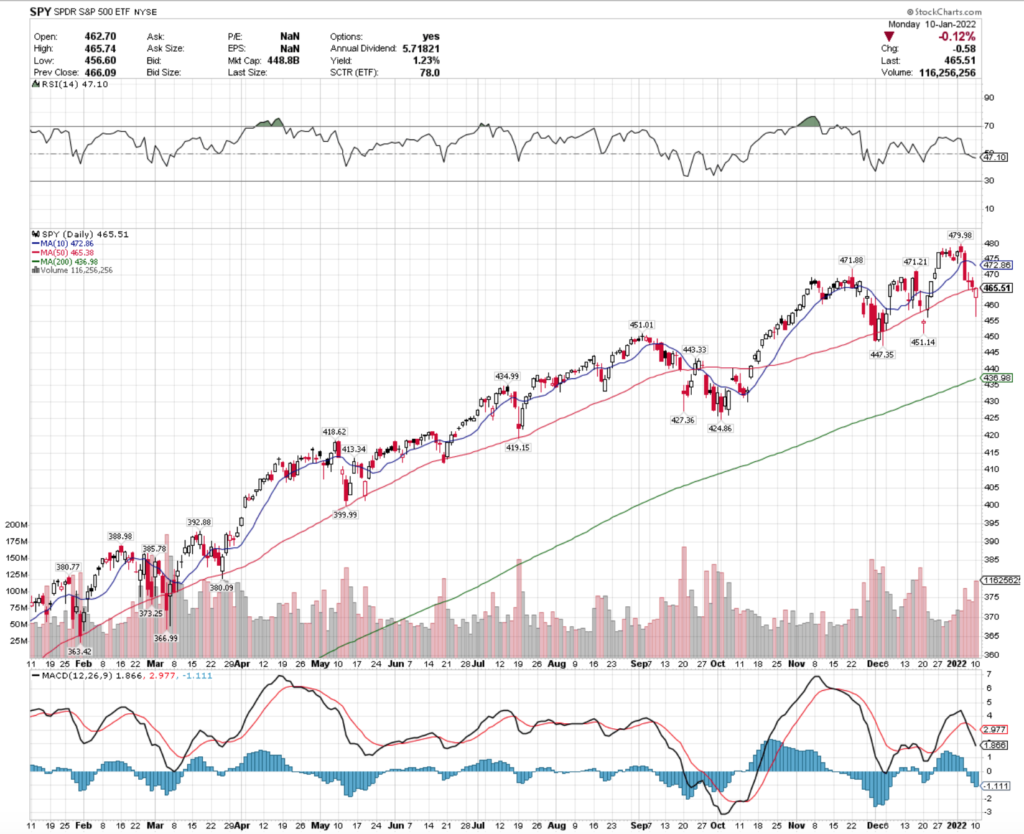
QQQ, an ETF that tracks the NASDAQ is down 5.4% in the first days of trading, while SPY, an ETF that tracks the S&P 500 is down 2.6% for the same period.
QQQ ETF – Invesco QQQ Trust ETF’s Performance Over The Last Year
SPY ETF – SPDR S&P500 ETF’s Performance Over The Last Year
It’s still awfully early on in the year to be making major assumptions & expectations, but the technicals on the charts signal that there will be more volatility & moves downward this year, with the last week only being a taste of what’s to come.
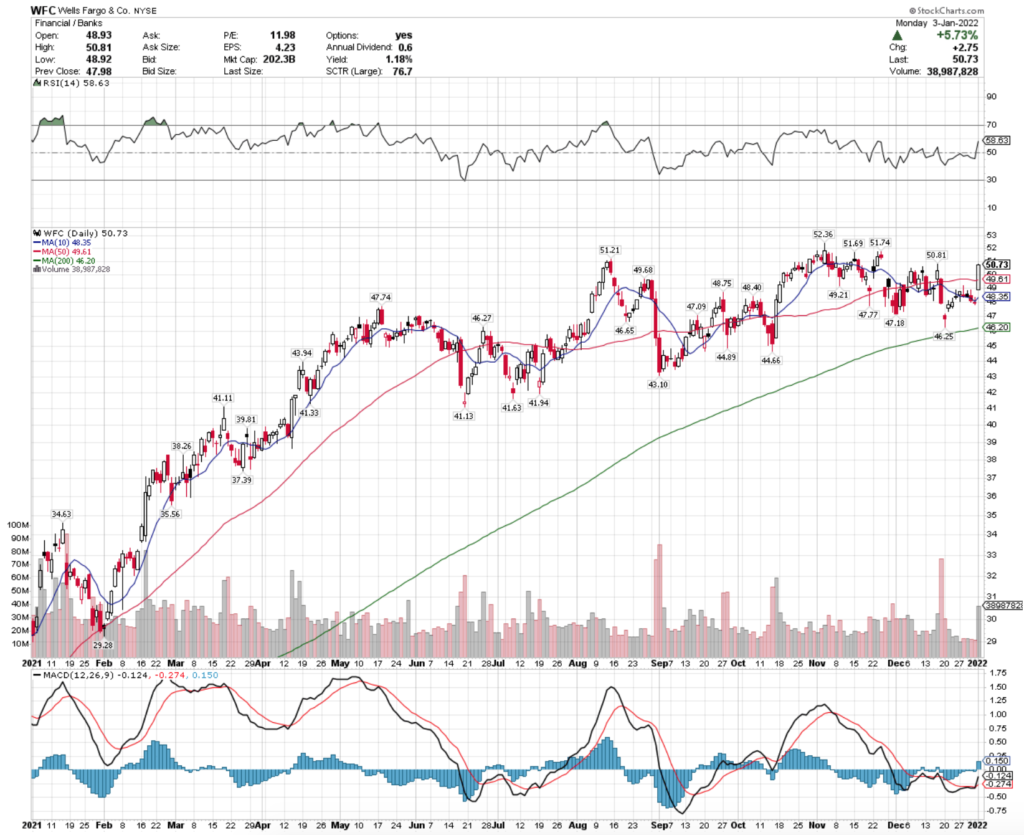
Regional Banks (DPST), Natural Gas (FCG), Peruvian Equities (EPU) & Consumer Staples (XLP) All Are Performing Well On Strength
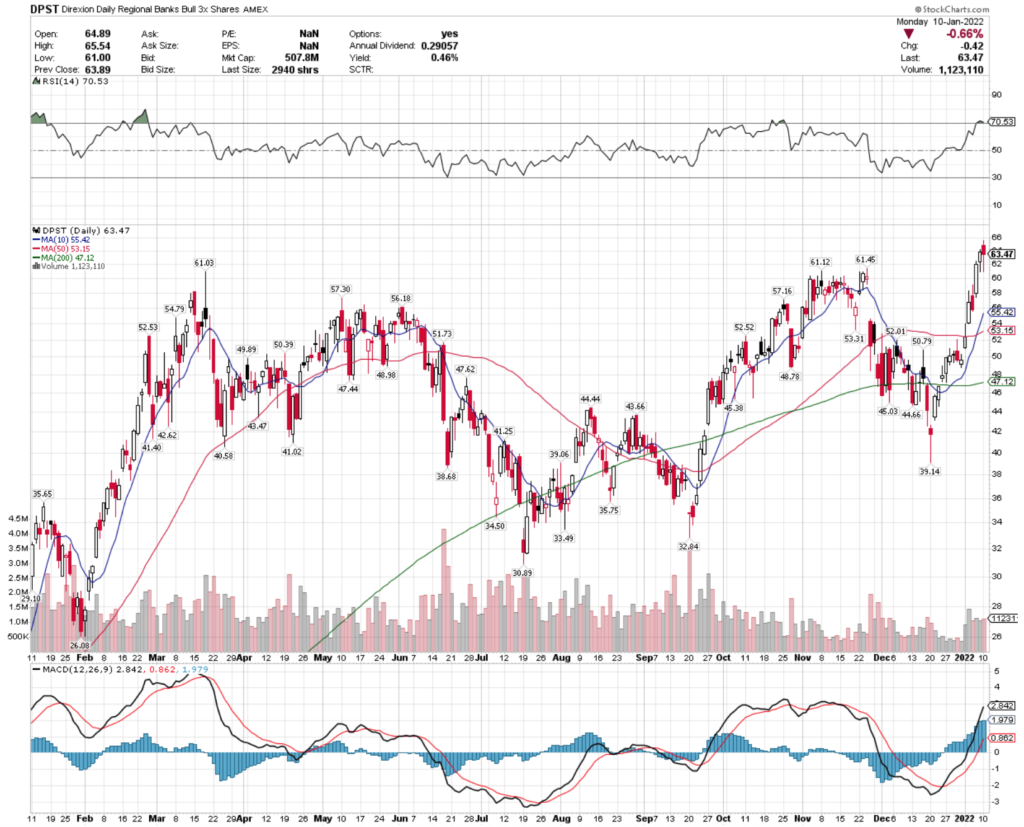
Regional Banks have had quite the turnaround since July of 2021.
DPST, the Direxion Daily Regional Banks Bull 3X Shares ETF has nearly doubled in price since then.
While their moving averages look appealing, I may keep an eye on DPST’s RSI, which is in overbought territory, as well as the angle of their MACD.
This may be an opportunity for beginning or adding to an existing position coming in the near-term as it begins to establish a new price range.
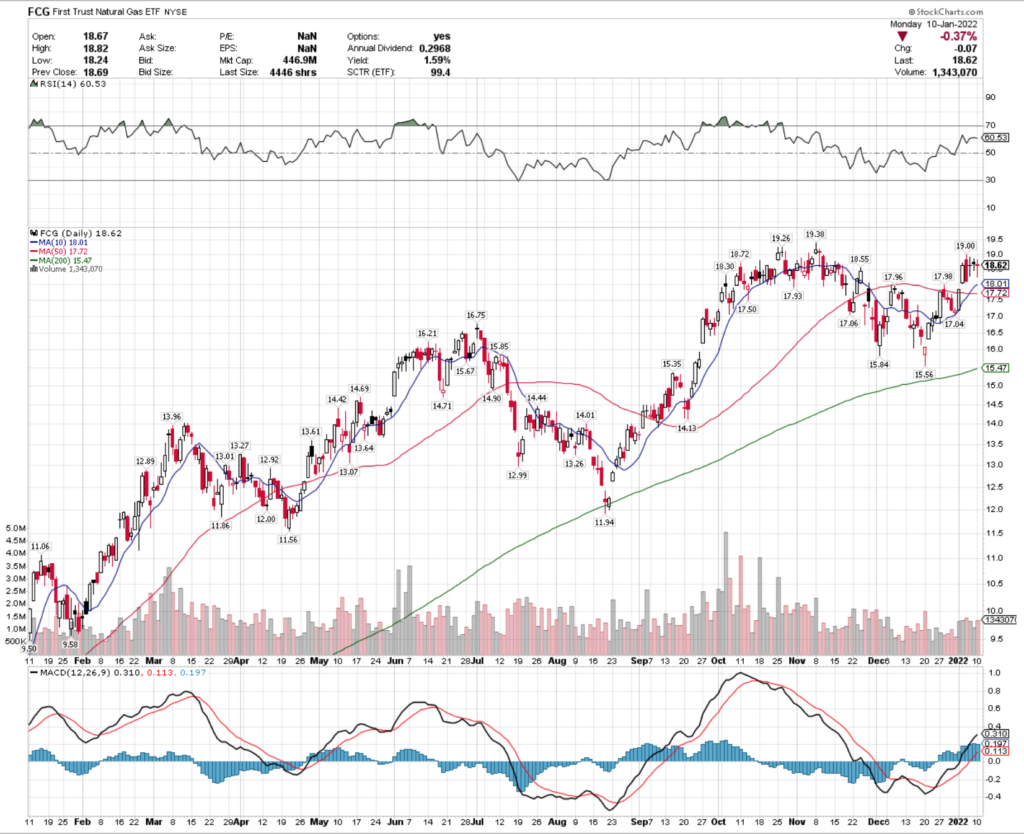
FCG ETF, which is the First Trust Natural Gas ETF has also rebounded from the troubles that it saw in July.
FCG ETF – First Trust Natural Gas ETF
With their RSI back around 60 & a bullish MACD, there may be more momentum to power through the $19.38-level, which was their high from November 2021.
FCG’s technical growth over the last year has looked very consistent though.
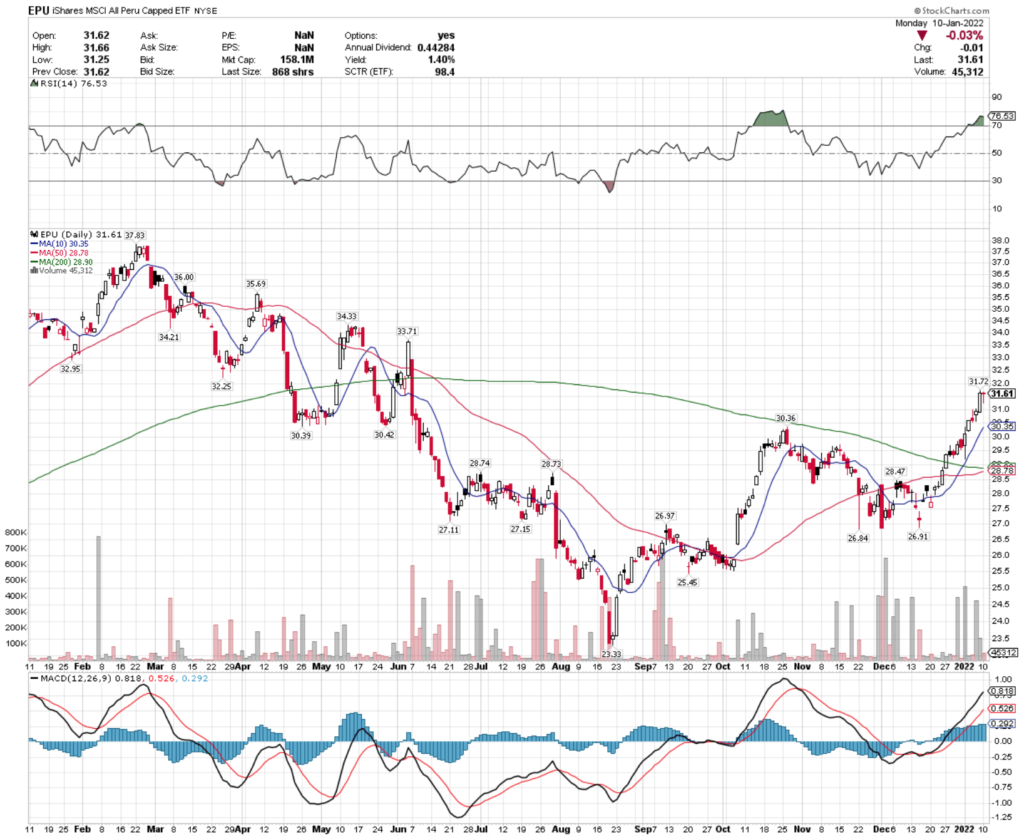
EPU, an ETF that tracks Peruvian Equities has also been performing very well recently, reversing a months-long slide in August to recover most of its lost gains.
EPU EFT – iShares MSCI All Peru Capped ETF
Their RSI is a bit rich at 76.5, which may lead to entry-points for new position or adding to existing positions as it begins to establish a new range after a period of high price growth.
How consistent their volume remains will be key in determining this, with positive, above average volumes being better than weaker volume & limited price movement.
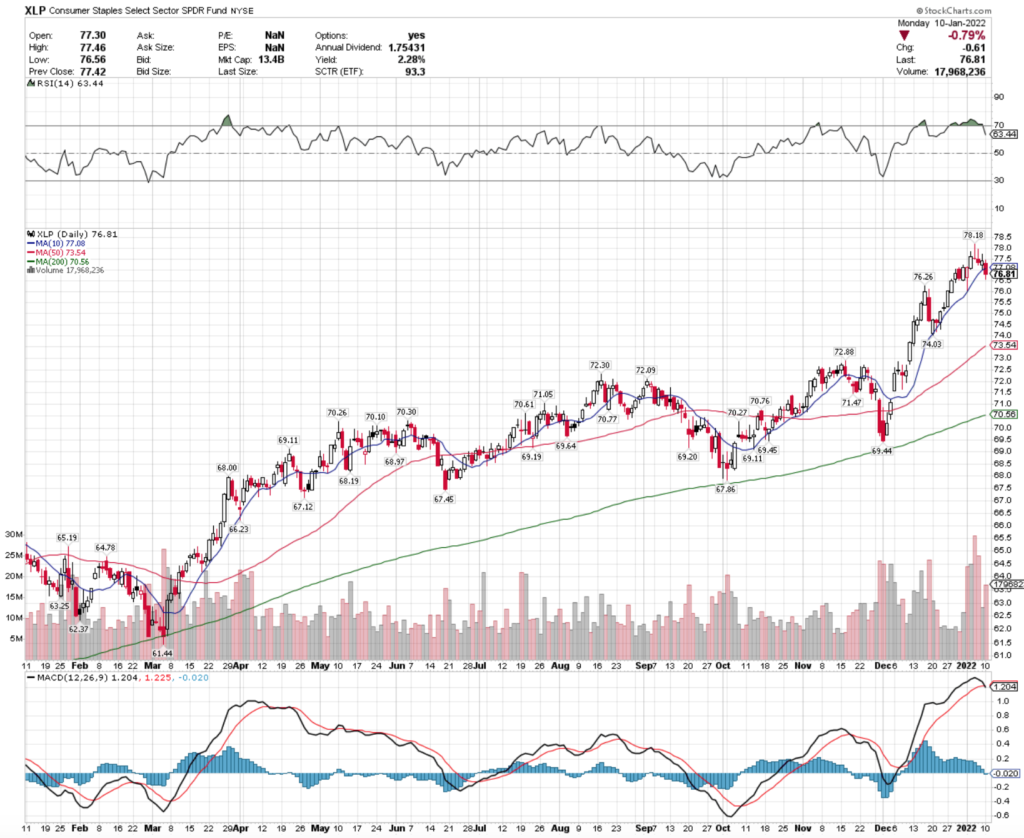
XLP ETF tracks consumer staples stocks, and has also had a very strong performance this year.
XLP ETF – Consumer Staples Select Sector SPDR Fund ETF
XLP’s recent volume has been stronger than the year’s average & with a bearish MACD crossover taking place there may be some weakness to buy into in the near future as their RSI cools off from overbought levels.
Cannabis (TOKE), Moonshot Innovators (MOON), Gig Economy (GIGE) & China (PGJ) ETFs Are All Bearish Laggards
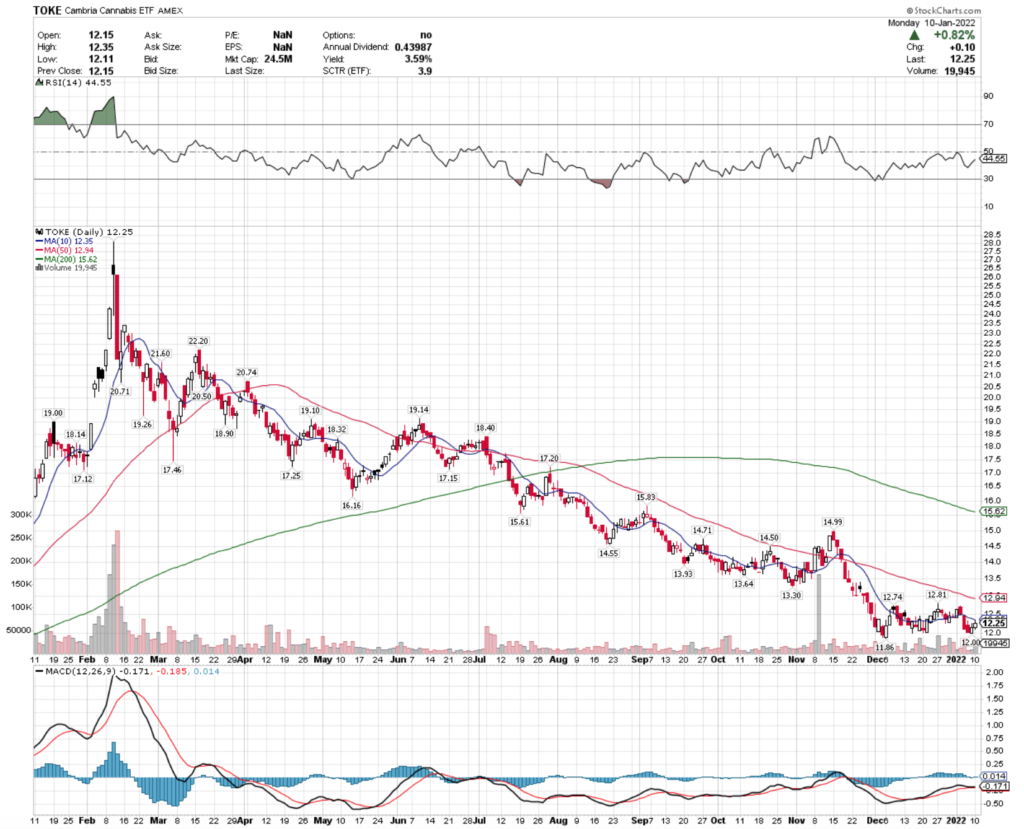
TOKE, the Cambria Cannabis ETF has had a tough 2021, losing over half of its price since February of last year.
TOKE ETF – Cambria Cannabis ETF
While TOKE’s MACD trend looks like it could cross bearish soon, their RSI implies that there should be more strength to come.
Looking at their near & mid term moving averages, this could be ripe to reverse course in 2022.
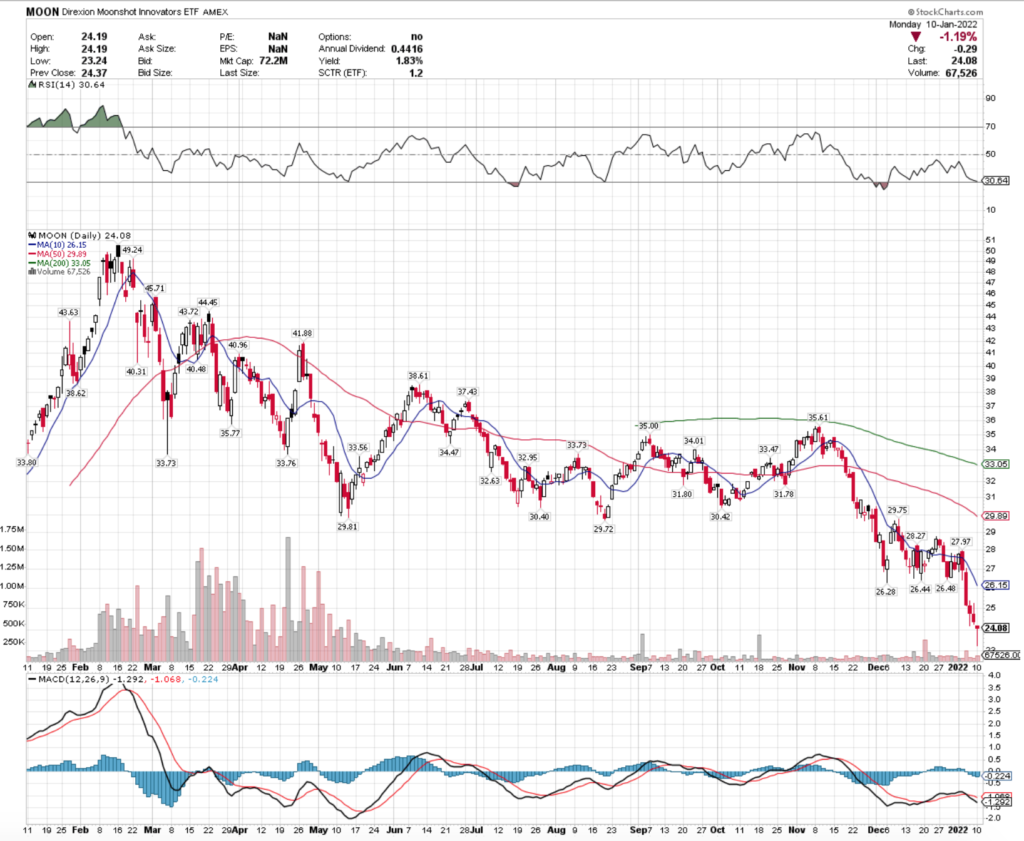
MOON, an ETF that tracks moonshot innovators & related companies has also had a poor year.
Unfortunately, that looks to get worse in 2022 when we consider the rate hike path that so far has speculated 2-4+ hikes in interest rates this year.
MOON ETF – Direxion Moonshot Innovators ETF
RSI is oversold, but MACD implies more falling to come & their moving averages don’t seem to offer much help.
On less than average volume, this one may not be worth looking too deeply at just yet for a turnaround.
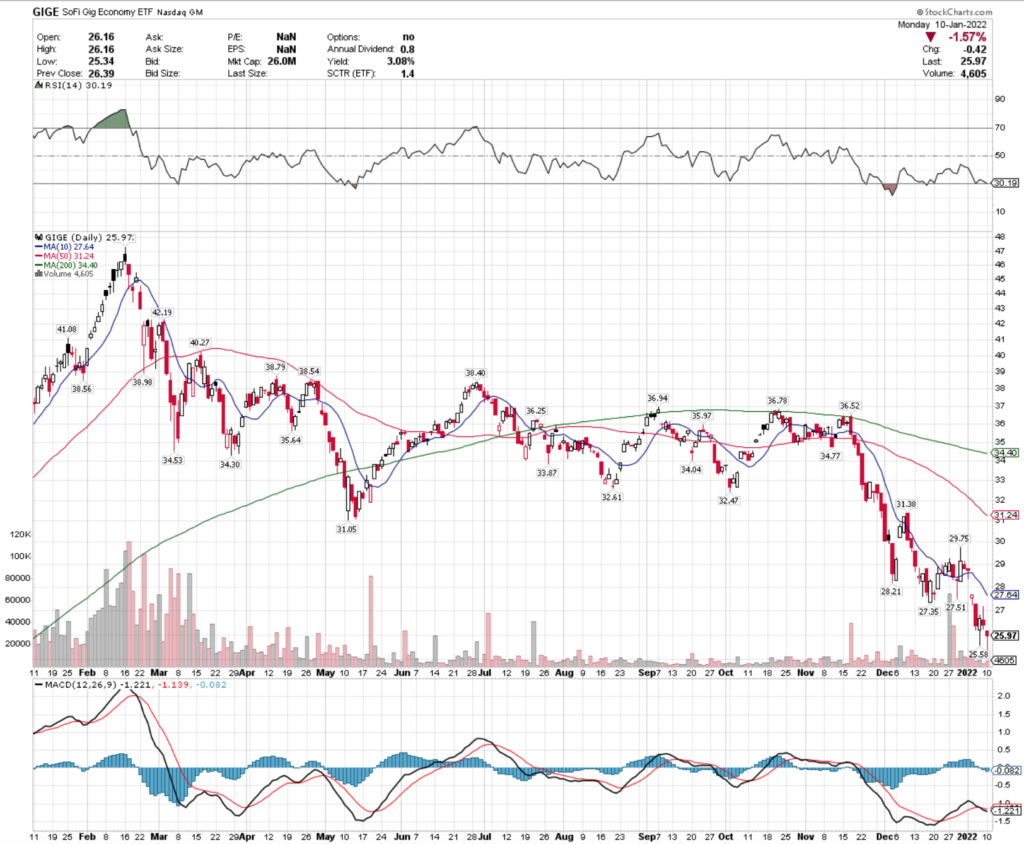
GIGE, an ETF that is tracking the Gig Economy has seen a steady falling since mid-February of 2021.
This is another one that you may want to sit tight on trying to find the bottom, as there isn’t much signaling that the losses are done just yet.
GIGE ETF – SoFi Gig Economy ETF
They’ve already gone into oversold RSI territory & continued to fall, so this one looks best to wait on trying to build a position.
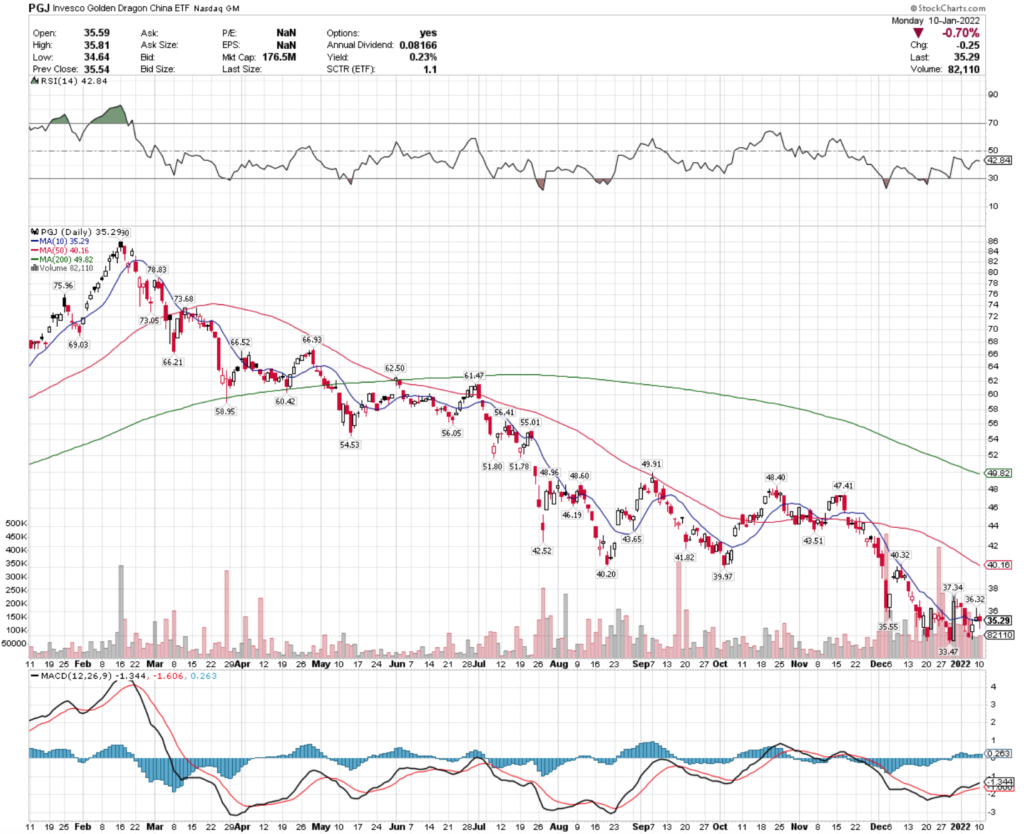
Lastly, we look at PGJ, an ETF that tracks companies that receive large portions of their revenues from business with China.
PGJ ETF – Invesco Golden Dragon China ETF
PGJ looks to be trying to establish a bottom as we enter a new year, based on the 2021 lows.
With their 10 Day Moving Average & price even when I took the above screenshot, it is a step in the right direction.
A word of caution though, is their RSI is back up to almost 43 & trading volumes have been well above average recently.
People seem to be finding consensus that the past month’s range seems like fair pricing, but with so many variables at play it is tough to guess what’ll happen next week.
Tying It All Together
All-in-all there looks to be an exciting week ahead in the markets as we rumble into the 2022 trading year.
It’ll be interesting to see how data reported this week compares to previous periods, as there still seem to be a variety of responses by governments & businesses to omicron.
Inflation & supply chain issues are also another area of interest, as again these seem to vary greatly based on locations, both in the US & abroad.
Of course the question that is on all of our minds is, looking at the current technical status of the major indexes, when is the rug finally going to get pulled out from under this market?
*** I DO NOT OWN SHARES OF ANY TICKER MENTIONED IN THIS ARTICLE, WITH THE EXCEPTION OF A SMALL POSITION IN TOKE***
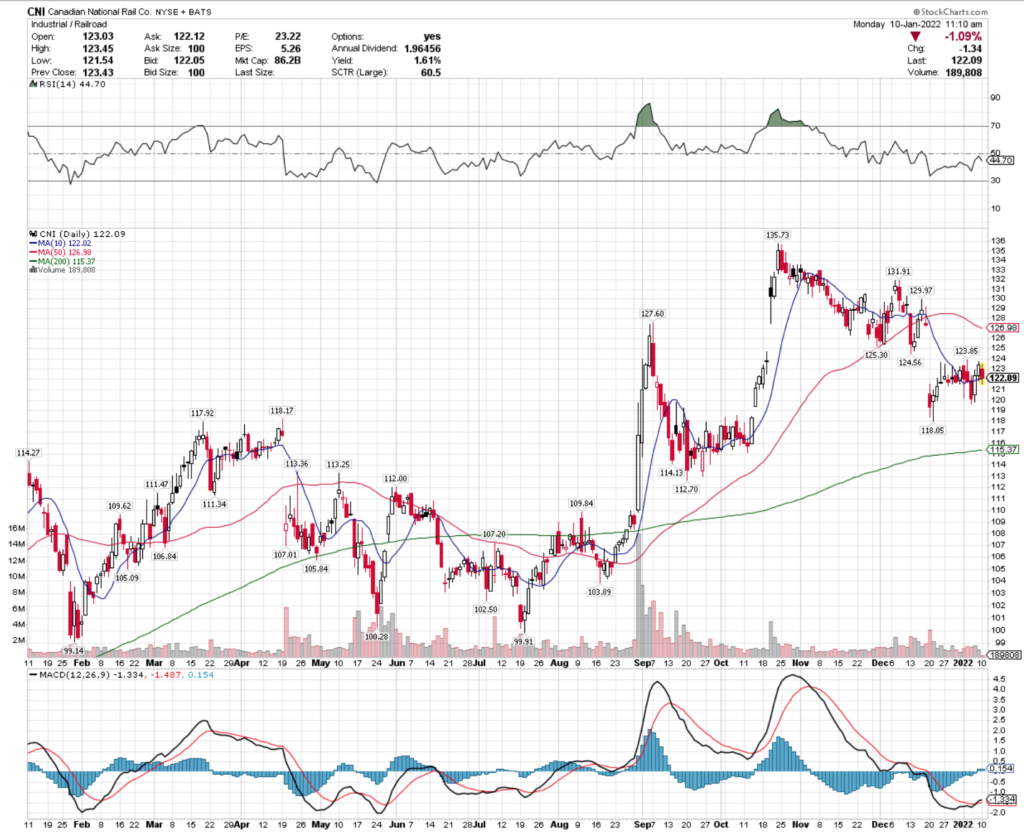
Canadian National Rail Co. stock trades under the ticker CNI & has shown recent bullishness that traders & investors should take a closer look at.
CNI stock closed at $123.43/share on 1/7/2022.
Canadian National Rail Co. CNI Stock’s Technicals Broken Down
CNI Stock Price: $122.09 (at time of chart above’s screenshot)
10 Day Moving Average: $122.02
50 Day Moving Average: $126.98
200 Day Moving Average: $115.37
RSI: 44.7
MACD: -1.4
CNI stock completed a bullish MACD crossover on Friday, on relatively average trading volume compared to the year prior.
The broader market volatility is not going to exclude them, which may open up entry opportunities for investors, and trade opportunities for traders.
CNI stock will need to break through the $123.85 & $124.56 levels of resistance to carry on momentum.
Canadian National Rail Co. CNI Stock As A Long-Term Investment
CNI stock may be an appealing fit for some investor’s portfolios.
Their P/E (ttm) is 24.7, with a P/B of 5.34.
CNI stock saw a 5.3% increase in Quarterly Revenue Growth Y-o-Y.
Their balance sheet will need some further review though, with $2.19B in Total Cash (mrq) & $13.99B in Total Debt (mrq).
CNI stock offers a 1.96% dividend yield, that looks safe with a 36.5% payout ratio.
78% of CNI’s total share float is held by institutional investors.
Canadian National Rail Co. CNI Stock As A Short-Term Trade Using Options
Canadian National Rail Co. stock has options, which enable traders to benefit from changes in price in either direction, which can be beneficial durring market volatility.
I am looking at the contracts with the 1/21 expiration date.
The $115, $120 & $125 call options are all appealing, although somewhat illiquid with open interest for each strike price being in the 400-700 range.
The $125 puts have the most open interest, with 2,251 contracts outstanding, showing traders are not bullish beyond the $125/share point.
The $130 & $135 puts also look appealing, although much less liquid than the $125’s.
Tying It All Together
Canadian National Rail Co. stock is certainly worth taking a closer look at, regardless of your trading or investing style.
Investors will like their dividend structure, although it is advised to look closer at their balance sheet before determining if it is investment-worthy for you or not.
Traders will like their current momentum, as well as the volatility that has been kicking up in 2022, increasing the opportunities to earn profits.
All-in-all, CNI stock is worth doing some more homework on.
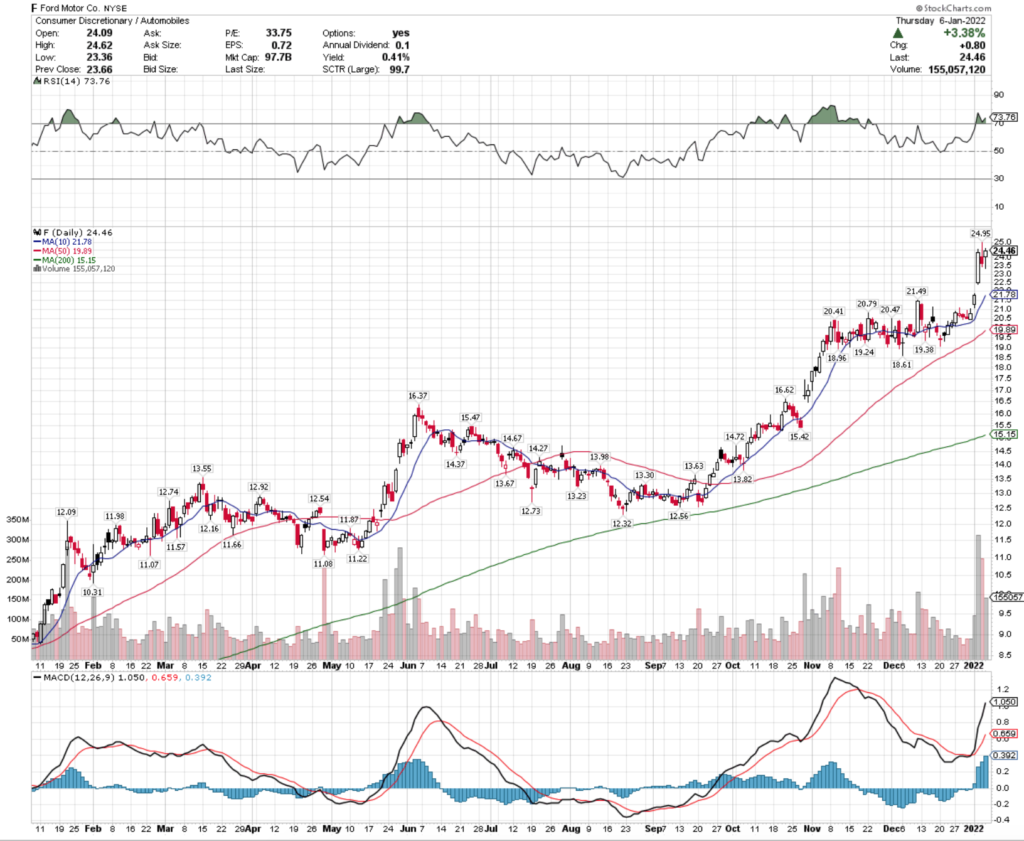
Ford Motor Co. stock trades under the ticker F & has recently shown bullishness that traders & investors should take a closer look at.
F stock closed at $24.46/share on 1/6/2022 & looks set to continue climbing in the near-term.
Ford Motor Co. F Stock’s Technicals Broken Down
F Stock Price: $24.46
10 Day Moving Average: $21.78
50 Day Moving Average: $19.89
200 Day Moving Average: $15.15
RSI: 73.8
Ford Motor Co. stock has been on a steady uptrend since November, with higher than average volume for the last year so far in 2022.
Although their RSI is overbought, they look at have more momentum to come, although that may be cut short by broader market volatility that we have been experiencing.
I will be keeping an eye on their MACD lines to see how the trend slows while the look to establish a new price range for F shares.
Ford Motor Co. F Stock As A Long-Term Investment
As noted above, this post was begun on Friday, 1/7/2022, so some of the data below will reflect today, Monday 1/10/2022’s updated information as the markets are open as of me writing this & the following section.
F stock’s P/E (ttm) is 30.64, with a P/B (mrq) of 2.34, which investors may find appealing from a valuation perspective, given the nature of other, higher multiples we are seeing.
Ford saw -4.8% Quarterly Revenue Growth Y-o-Y, which was somewhat to be expected based on news reports during COVID times.
F stock’s balance sheet may be concerning to investors, with Total Cash (mrq) of $31.42B & Total Debt (mrq) of $145.87B.
Ford stock’s dividend yield has resumed payment, at ~1.68% based on the projected amount seen in 2022.
Only 53% of F stock’s share float is held by institutional investors.
Ford Motor Co. F Stock As A Short-Term Trade Using Options
Traders can use options to take advantage of Ford Motor Company’s current momentum, while hedging against a broader market downturn.
I am looking at the contracts with the 1/21/22 expiration date.
The $23.50 & $24 strike price call options all look appealing & highly liquid, as they have high levels of open interest.
The $24.50 & $25 puts also look interesting, and very liquid as well, although slightly less than calls, indicating that there is a stronger bullish sentiment in the near-term than bearish.
Tying It All Together
Overall, investors & traders should take a closer look at Ford Motor Co.’s stock.
They currently are on a long bullish streak, and have crossed into new highs in 2022.
While they are trying to establish a new price range to trade in there may be opportunities for traders to make some profits on the up & downside.
Long-term oriented investors may also use this as a means of timing a good entry, which can be difficult when a stock is at its highest levels in over a year.
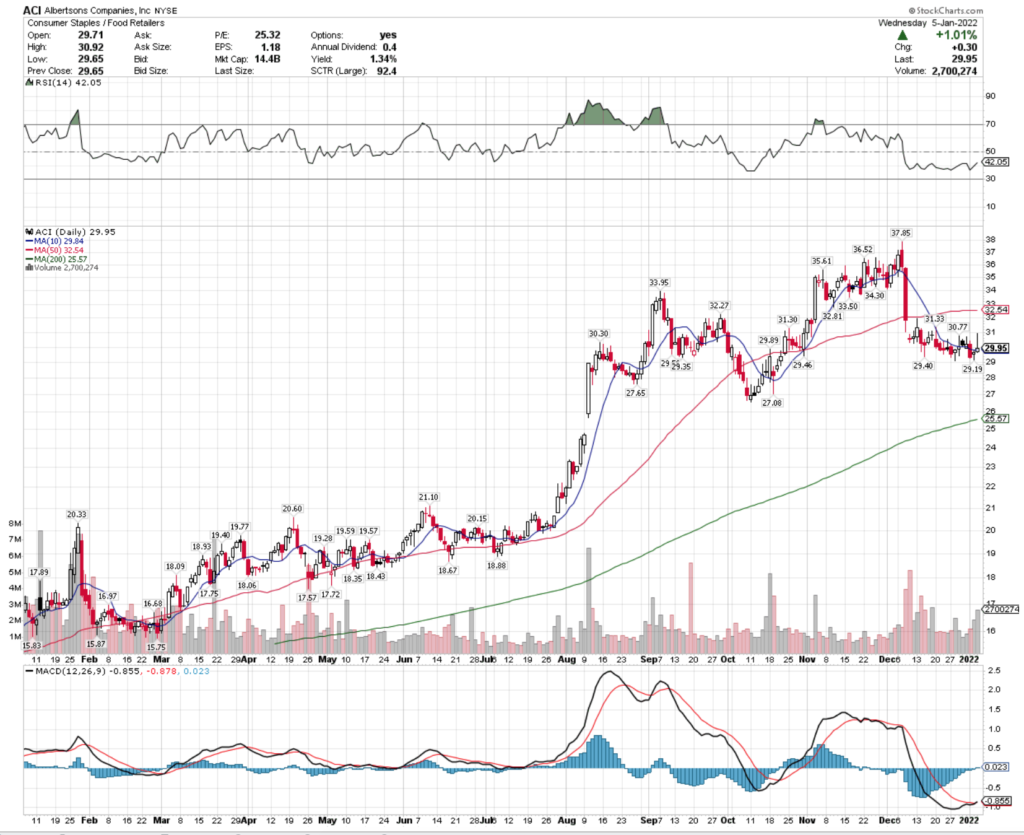
Albertsons Companies, Inc. stock is a food retailer stock that traders & investors should take a closer look at in this time of market volatility.
Albertsons Companies, Inc. stock trades under the ticker ACI & closed at $29.95/share on 1/5/2022.
Albertson’s Companies, Inc. ACI Stock’s Technicals Broken Down
ACI Stock Price: $29.95
10 Day Moving Average: $29.84
50 Day Moving Average: $32.54
200 Day Moving Average: $25.57
RSI: 42
MACD: -0.855
ACI stock completed a bullish MACD crossover yesterday, and it still has a relatively oversold RSI, making it possible to minimize losses.
Their trading volume was also above average for the last month.
ACI stock’s price is looking to establish a new range, where the $31.95-level will be the next test of resistance.
Albertsons Companies, Inc. ACI Stock As A Long-Term Investment
Long-term focused investors may find ACI stock’s valuation appealing, with a P/E(ttm) of 24.96 & a P/B of 7.32 (which is a bit high).
Their Quarterly Revenue Growth Y-o-Y was 4.7%.
ACI stock’s balance sheet looks a bit concerning, with only $2.86B in Total Cash (mrq) & Total Debt (mrq) of $14.45B.
ACI offers a 1.35% dividend yield, which looks to be safe with a 32% payout ratio.
73.6% of ACI’s share float is held by institutional investors.
Albertsons Companies, Inc. ACI Stock As A Short-Term Trade Using Options
Traders who are interested in the short-term performance of ACI stock can use options to capture their momentum, while fending off broader market volatility.
I am looking at the contracts with the 1/21 expiration date.
The $28 & $29 call options look appealing, although relatively illiquid with their combined open interest being ~600 contracts between the two.
The $30 & $31 puts also look interesting, and have a bit more liquidity, signaling that there is more hedging being done in anticipation of the markets continuing to fall for the rest of this month.
Tying It All Together
All-in-all ACI stock looks to have many interesting characteristics that traders & investors should be interested in.
Their industry is going to have consistent demand regardless of what happens with COVID measures, as they are a grocer & pharmacy company.
Their P/E(ttm) & Dividend Yield also look appealing for investors looking to safely accumulate interest.
From a technical perspective, they have already been trying to find a new range after a large gap down in early December, which when paired with their RSI in the 40’s may help limit how much further they can decline in relation to the broader markets.
Overall, ACI stock is worth taking a closer look at.
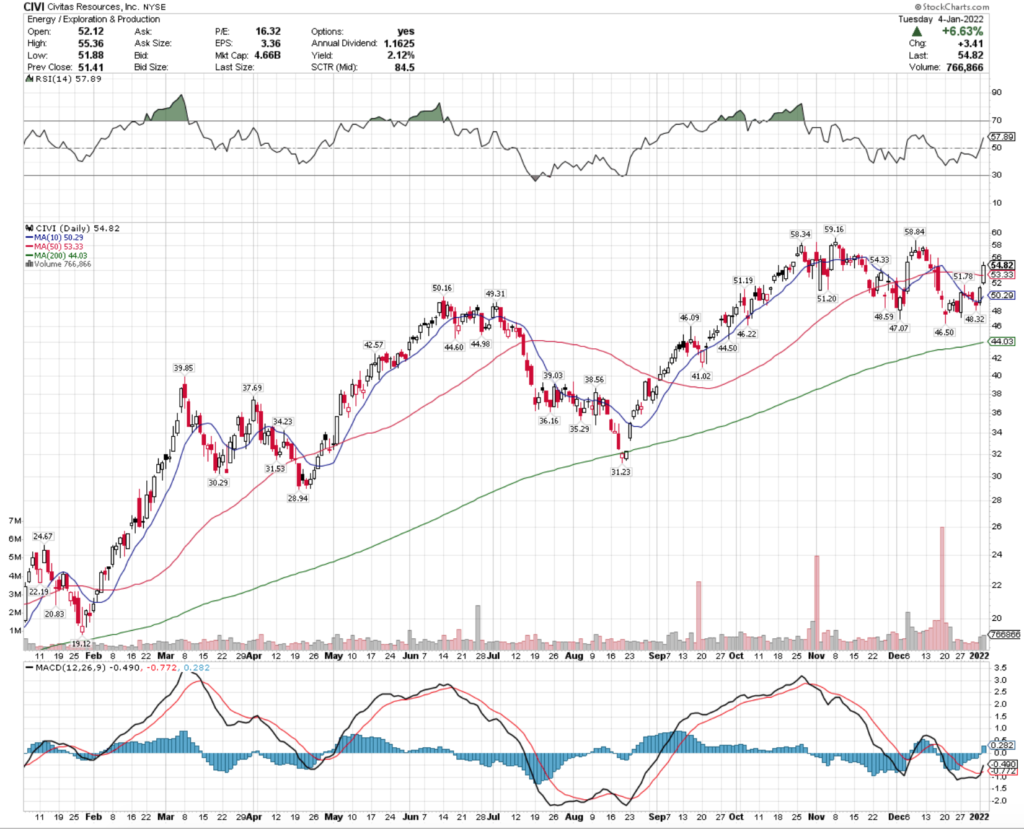
Civitas Resources, Inc. stock trades under the ticker CIVI & has shown recent bullishness that traders & investors should take a closer look at.
CIVI gapped up 6.63% on 1/4/2021, to $54.82/share.
Civitas Resources, Inc. CIVI Stock’s Technicals Broken Down
CIVI Stock Price: $54.82
10 Day Moving Average: $50.29
50 Day Moving Average: $53.33
200 Day Moving Average: $44.03
RSI: 57.9
MACD: -0.49
CIVI completed a bullish MACD crossover yesterday, during their 6%+ gap up, while also breaking out above their 50 Day Moving Average.
While their RSI is almost in the 60’s, there looks to be plenty of additional near-term momentum for CIVI stock.
Their volume has been slightly above average recently as well.
Civitas Resources, Inc. CIVI Stock As A Long-Term Investment
Long-term oriented investors may find CIVI’s valuation metrics to be appealing, with a P/E(ttm) of 16.9 & a P/B (mrq) of 3.46.
CIVI stock had Quarterly Revenue Growth Y-o-Y of 222.7%.
Their balance sheet is a bit questionable though, with Total Cash (mrq) of $40.41M & Total Debt (mrq) of $188.4M.
CIVI stock does offer a 1.36% dividend yield, that looks very safe, with a payout ratio of 20.4%.
81.2% of CIVI’s share float is held by institutional investors.
Civitas Resources, Inc. CIVI Stock As A Short-Term Trade Using Options
CIVI stock has options that can be traded in the short-term to take advantage of their recent momentum, while putting aside risks from the broader market.
I am looking at the contracts with the 1/21 expiration date.
The $50 & $55 calls look appealing, although with open interest in the 200’s for each, they are relatively illiquid.
The $55 puts look interesting, although highly illiquid with open interest of 19, and the $60 strike price would also be appealing, but there is no open interest at this time.
Tying It All Together
All-together, CIVI stock has many appealing characteristics that traders & investors should take a closer look at.
Investors will like their valuation metrics & dividend yield, although they may want to take a closer look at their balance sheet.
Traders will like CIVI stock’s current momentum that looks set to continue on into the coming weeks.
Overall, CIVI stock is worth taking a closer look at, regardless of your trading style.
Clearway Energy, Inc. stock trades under the ticker CWEN & has shown recent bullishness that traders & investors should take a closer look at.
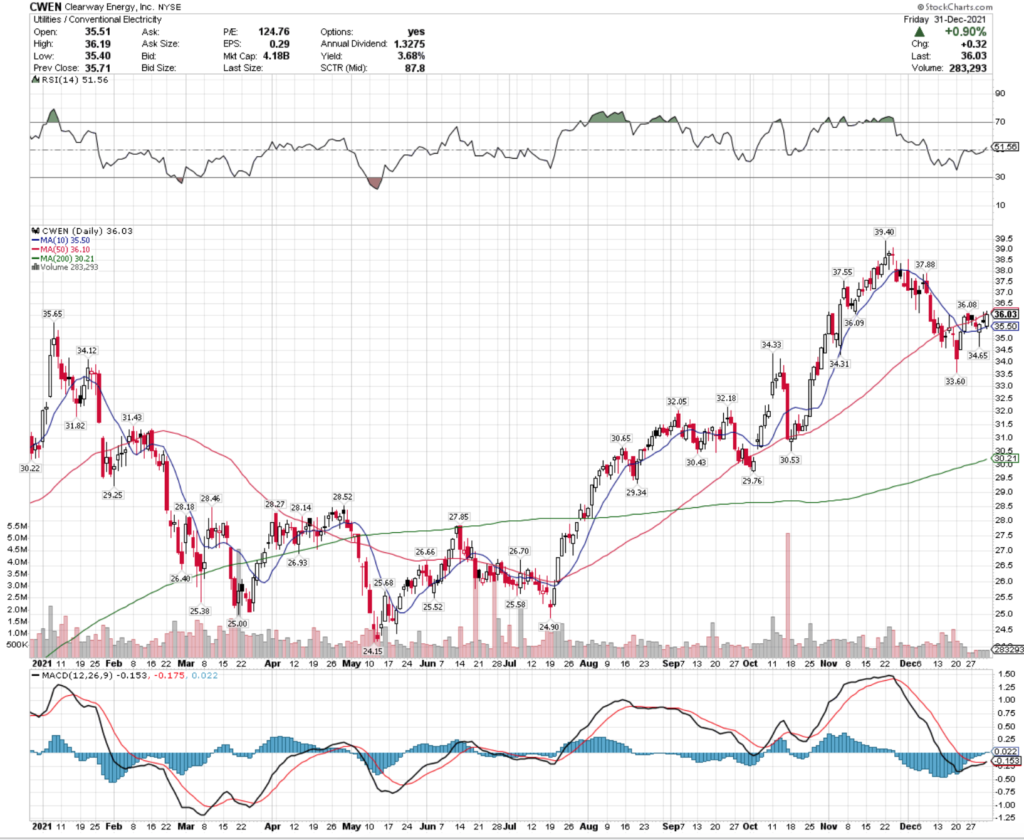
CWEN stock closed at $36.03/share on 12/31/2021.
Clearway Energy, Inc. CWEN Stock’s Technicals Broken Down
CWEN Stock Price: $36.03
10 Day Moving Average: $35.50
50 Day Moving Average: $36.10
200 Day Moving Average: $30.21
RSI: 51.6
MACD: -0.153
CWEN stock completed a bullish MACD crossover on 12/31/2021, and has a relatively neutral RSI, signaling more gains to come in the short-term.
With their price ~0.1% from crossing above their 50 Day MA, their price looks set to continue climbing, until it tests its next level of resistance at the $37-price level.
Clearway Energy, Inc. CWEN Stock As A Long-Term Investment
Investors may find CWEN stock’s valuation a bit rich, with a P/E(ttm) of 119.3 & a P/B of 2.31.
Their Quarterly Revenue Growth Y-o-Y is 5.7%.
Investors also may want to take a close look on CWEN’s balance sheet, with Total Cash (mrq) of $189M & $8.3B in Total Debt (mrq).
However, CWEN does offer an annual dividend yield of 3.65%, with a Payout Ratio of 441%.
This is very high, and suggests that when paired with the balance sheet figures that their dividend may not be sustainable for too long, as typically a healthy ratio is less than 50%.
Still, ~94% of their share float is held by institutional investors.
Clearway Energy, Inc. CWEN Stock As A Short-Term Trade Using Options
Traders can use options in order to take advantage of CWEN’s current momentum, while staving off broader market fears around COVID & inflation.
I am looking at the 1/21 expiration dated contracts.
The $30 & $35 calls look appealing, although very illiquid.
The $35 & $40 puts also look appealing, with the $35 puts having the most open interest of all of the mentioned contracts.
Tying It All Together
Overall, there are some interesting opportunities for traders & investors in CWEN stock.
They do offer a nice looking dividend yield, however it is unknown how stable it will be over the years with their payout ratio & balance sheet.
In the near-term, their price looks set to continue to rise with their current momentum.
Calix Networks Inc. stock trades under the ticker CALX & has shown recent bullishness that traders & investors should take a closer look at.
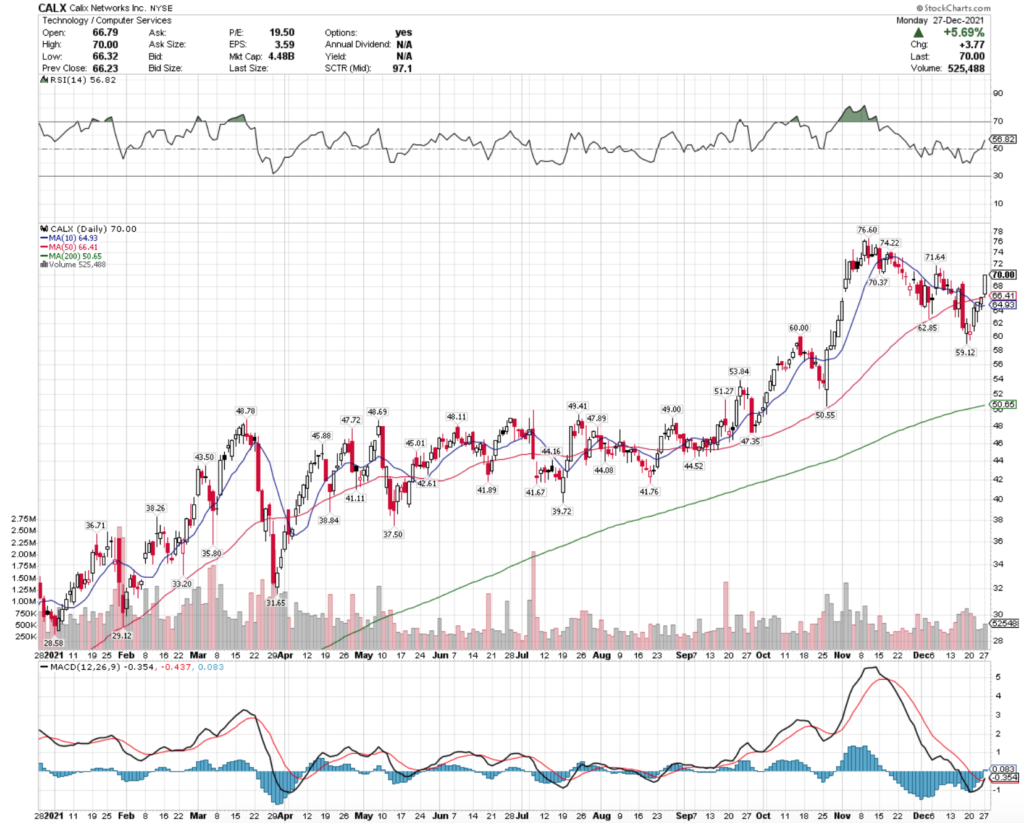
CALX stock closed at $70.00/share on 12/27/2021, with additional near-term momentum signals.
Calix Networks Inc. CALX Stock’s Technicals Broken Down
CALX Stock Price: $70.00
10 Day Moving Average: $64.93
50 Day Moving Average: $66.41
200 Day Moving Average: $50.65
RSI: 56.8
MACD: -0.354
Yesterday, CALX stock completed a bullish MACD crossover, after experiencing higher than average trading volume over the last 2 weeks.
With their 10 Day Moving Average ~2% below the 50 Day MA, there will be additional positive momentum behind it to drive their share price up higher.
A relatively neutral RSI of <57 also looks to be a positive signal for CALX stock in the near-term.
Their next test of resistance will be the $73/share level.
Calix Networks Inc. CALX Stock As A Long-Term Investment
Investors may find CALX’s valuation metrics appealing, with a P/E(ttm) of 18.8 & a P/B of 8.12 (a bit rich on the P/B, but they are in the Computer Services industry).
CALX stock had 14.4% Quarterly Revenue Growth Y-o-Y.
Their balance sheet looks particularly appealing, with Total Cash (mrq) of $188.7M & Total Debt (mrq) of $14.7M.
This is likely a major reason that 81% of their total share float is held by institutional investors.
Calix Networks Inc. CALX Stock As A Short-Term Trade Using Options
Traders can use CALX options in order to benefit from their positive momentum, while hedging against risks of broader market volatility.
I am looking at the contracts with the 1/21 expiration date.
The $65 & $70 call options look appealing, with the latter having better liquidity than the former.
The $75 & $80 puts look interesting, although very illiquid with open interest of <100 for each.
This reiterates the near-term bullish sentiment.
Tying It All Together
Overall, there looks to be many appealing characteristics to CALX stock.
Investors will be pleased with their balance sheet, despite them not paying a dividend yield.
Traders will like their current momentum & technical set up.
CALX stock is worth taking a closer look at, regardless of your trading style.
A10 Networks, Inc. stock trades under the ticker ATEN & has shown recent bullish momentum that traders & investors should take a closer look at.
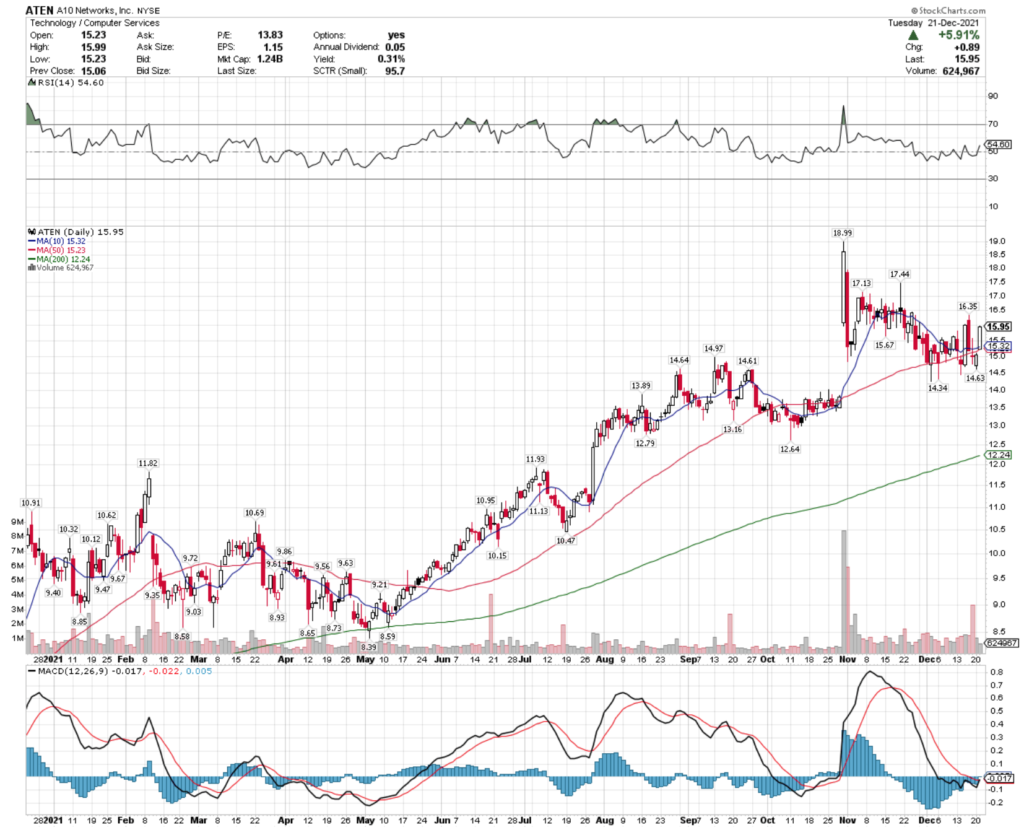
ATEN stock closed at $15.95/share on 12/21/2021.
A10 Networks, Inc. ATEN Stock’s Technicals Broken Down
ATEN Stock Price: $15.95
10 Day Moving Average: $15.32
50 Day Moving Average: $15.23
200 Day Moving Average: $12.24
RSI: 54.6
MACD: -0.017
ATEN stock completed a bullish MACD crossover yesterday & still maintains a relatively neutral RSI at 54.6.
Their price also broke out over both the 10 & 50 Day Moving Averages, on slightly above average trading volume.
The next area to watch for resistance is the $16.35/share level.
A10 Networks, Inc. ATEN Stock As A Long-Term Investment
Long-term oriented investors will find that ATEN stock has many good attributes.
Their valuation is modest, with a P/E(ttm) of 13.6 & a P/B of 5.95.
With a beta of 1.04, they move relatively in line with broader market indexes.
ATEN stock’s Quarterly Revenue Growth Y-o-Y was 15.5%.
ATEN’s balance sheet also looks appealing, with Total Cash (mrq) of $187.5M & Total Debt (mrq) of $24.8M.
They offer a small dividend yield of 0.33%.
A10 Networks, Inc. ATEN Stock As A Short-Term Trade Using Options
Short-term oriented traders can use options to take advantage of ATEN stock’s current momentum, while hedging against market volatility.
I am looking at the contracts with the 1/21 expiration date.
The $15 & $17.50 calls look appealing, although less liquid than we would like.
The $17.50 puts also look interesting, as would the $20 contracts if they had more open interest.
Tying It All Together
Overall, ATEN stock has many interesting attributes that traders & investors should take a closer look at.
Their balance sheet & valuation looks appealing for long-term oriented investors, while their current momentum looks set to continue to the delight of short-term focused traders.
ATEN stock is worth taking a closer look at, regardless of your trading style & timeframes.