Highest Technical Rating S&P 500 Components As Of 6/27/2024’s Close:
1- NVDA
2 – VST
3 – SMCI
4 – CRWD
5 – ANET
6 – FSLR
7 – NTAP
8 – TER
9 – AVGO
10 – LLY
Lowest Technical Rating S&P 500 Components As Of 6/27/2024’s Close:
1 – WBA
2 – ALB
3 – PAYC
4 – EPAM
5 – DAY
6 – LULU
7 – EL
8 – GPN
9 – POOL
10 – WBD
Highest Volume Rated S&P 500 Components As Of 6/27/2024’s Close:
1 – WBA
2 – IP
3 – MKC
4 – MU
5 – COR
6 – APTV
7 – DLTR
8 – CTSH
9 – CZR
10 – FDX
Lowest Volume Rated S&P 500 Components As Of 6/27/2024’s Close:
1 – HES
2 – MNST
3 – IVZ
4 – FMC
5 – UHS
6 – GL
7 – INCY
8 – KKR
9 – TSN
10 – GPN
Highest Technical Rated ETFs As Of 6/27/2024’s Close:
1 – NVDL
2 – USD
3 – WGMI
4 – SOXL
5 – FNGG
6 – HZEN
7 – TECL
8 – TQQQ
9 – GGLL
10 – DAPP
Lowest Technical Rated ETFs As Of 6/27/2024’s Close:
1 – NVD
2 – SSG
3 – UVIX
4 – NVDS
5 – SOXS
6 – MEXX
7 – UVXY
8 – TECS
9 – SQQQ
10 – LABD
Highest Volume Rated ETFs As Of 6/27/2024’s Close:
1 – JIVE
2 – TBJL
3 – MCHS
4 – VIXM
5 – HERD
6 – NSCS
7 – APRQ
8 – USBF
9 – FEMB
10 – CBLS
Lowest Volume Rated ETFs As Of 6/27/2024’s Close:
1 – BHYB
2 – XHYX
3 – ESGB
4 – SBND
5 – SIXF
6 – NUSA
7 – FCSH
8 – FFIV
9 – AGRH
10 – PSMJ
Highest Stock Technical Ratings As Of 6/27/2024’s Close:
1 – RIGL
2 – FTEL
3 – TRITF
4 – NXL
5 – RGS
6 – HQGE
7 – MDIA
8 – FCCN
9 – MLGO
10 – TSSI
Lowest Technical Rated Stocks As Of 6/27/2024’s Close:
1 – TRNR
2 – GWAV
3 – BNED
4 – VLCN
5 – GRI
6 – DSY
7 – NUVO
8 – CRKN
9 – EDBL
10 – NWTN
Highest Volume Rated Stocks As Of 6/27/2024’s Close:
1 – KALA
2 – TWO
3 – OUT
4 – IONM
5 – BSFC
6 – XBP
7 – VIGL
8 – GOVX
9 – BJDX
10 – CASI
Lowest Volume Rated Stocks As Of 6/27/2024’s Close:
1 – SONX
2 – BONXF
3 – CCWOF
4 – RMIOF
5 – CPFXF
6 – EGTYP
7 – FMCXF
8 – MGLD
9 – PTRUF
10 – CCGMF
*** THE LIST ABOVE IS STRICTLY FOR INFORMATIONAL PURPOSES – I MAY OR MAY NOT HAVE OR INITIATE A LONG, SHORT, OR LONG/SHORT POSITION IN ANY NAME ABOVE AT ANY TIME ***
TLT, the iShares 20+ Year Treasury Bond ETF has fallen -6.19% over the past year, declining -10.13% from their 52-week high in June of 2023, but has advanced +13.35% since their 52-week low in October of 2023.
Much like the major index ETFs, TLT has recently experienced weak volumes, with the past week’s volume coming in -31.52% below average compared to the year prior (27,273,649 vs. 39,832,402.55).
With markets near all-time highs but looking set to cool off there has been a lot of talk recently about bonds, making it worth diving into the strength of TLT’s support & resistance levels.
This will provide an understanding about how investors have previously behaved when TLT was at these pivotal price points & may shed insight into how their future behavior may play out if these levels are revisited.
Below is a brief review of TLT’s recent technical performance, followed by the volume sentiments for each of the price levels that they have traded at over the past 4-5 years.
It is not intended to serve as financial advice, but rather as an additional tool to reference while performing your own due diligence into TLT.
Technical Analysis Of TLT, the iShares 20+ Year Treasury Bond ETF
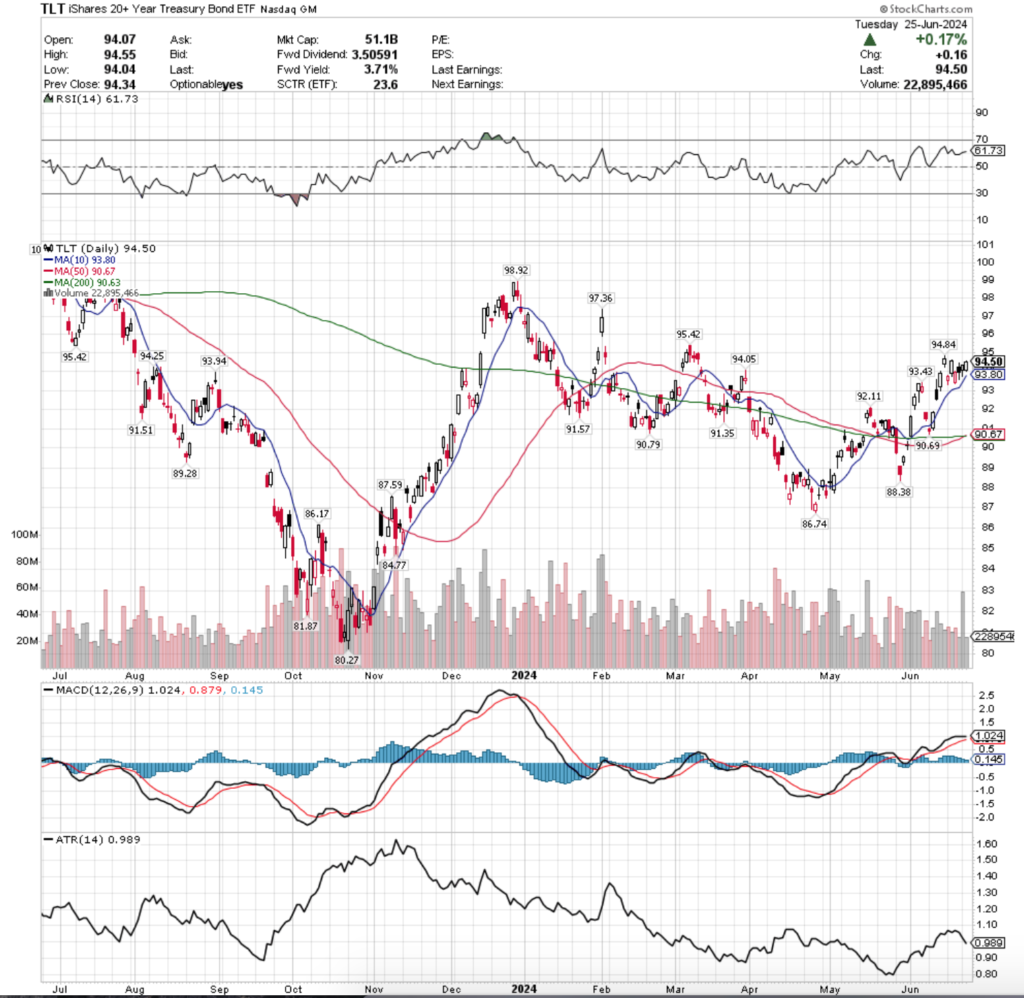
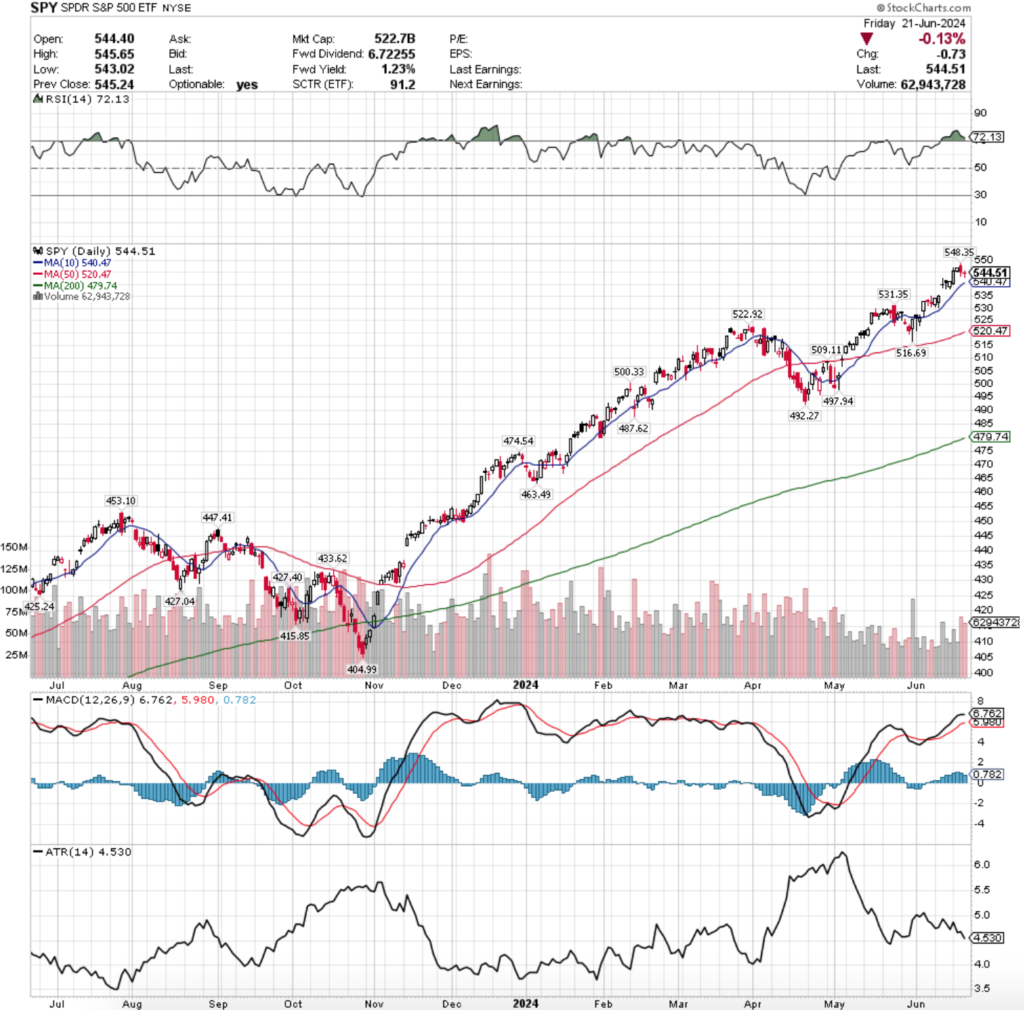
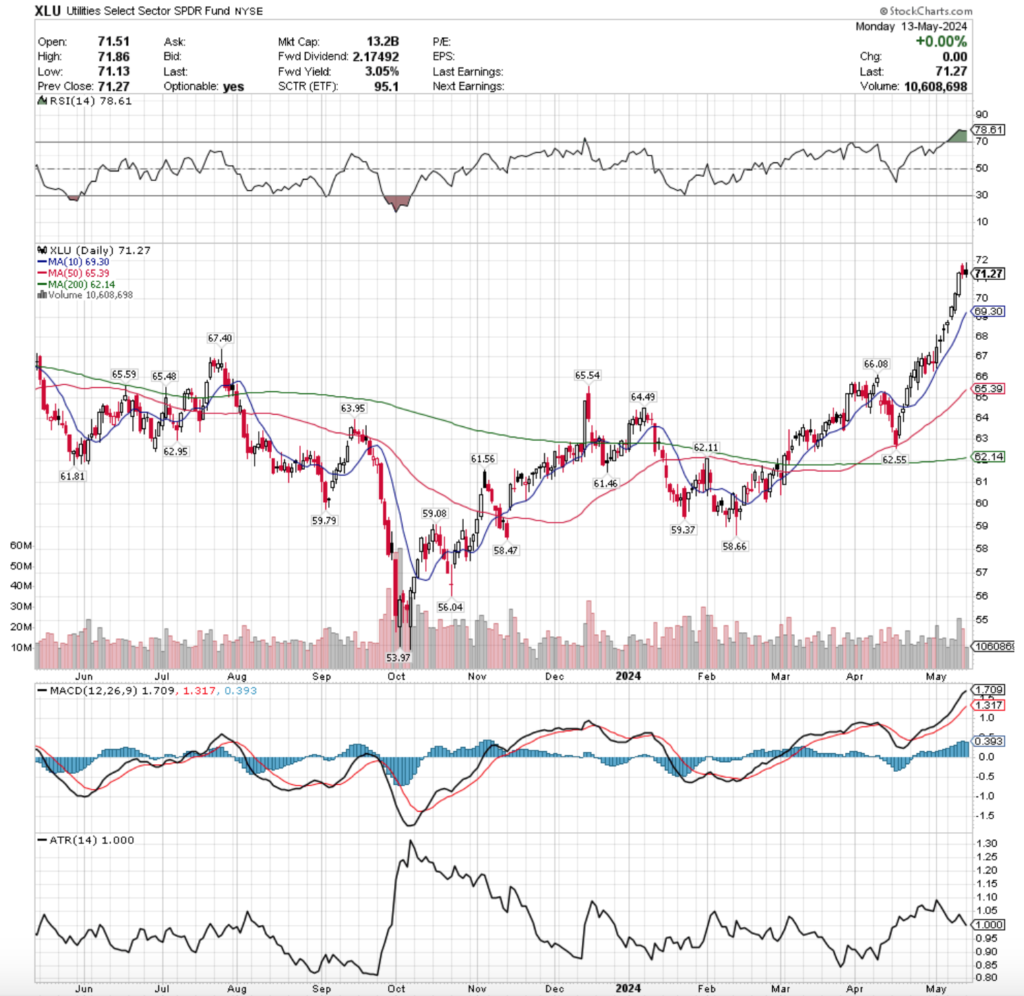
TLT ETF – iShares 20+ Year Treasury Bond ETF’s Technical Performance Over The Past Year
Their RSI is currently above neutral & trending towards overbought levels at 61.73, while their MACD is signaling a near-term cooling off as it looks to cross over bearishly in the next day or two.
As highlighted above, volumes recently have been lacking compared to the previous year, particularly yesterday’s & much of May’s as well.
Their share price has been attempting to rebound following a decline from the end of 2023, which is concerning given that the primary reversal of that downtrend occurred at the end of April, meaning that much of the recovery attempt has happened on the weak volume mentioned above.
Last Monday’s session resulted in a gap down that set up the resulting consolidation range that TLT has been trading in for the past week & a half, with last Tuesday’s session’s high price still being the high water mark that has yet to be broken (using last night’s closing price).
Thursday’s session signaled that there is still a great deal of excess supply, as it declined on a gap down open, but was able to recover to around Tuesday’s opening price.
It should be noted that the two declining sessions had the second & third highest volumes of the past week & a half, with only this past Monday’s being higher.
Friday kicked off on a gap higher & showed that there was some interest to the upside, but ultimately the bears came out stronger & forced prices down towards the 10 day moving average & ultimately settled lower than the open & at $93.96, where it also closed the previous day.
Monday’s open was slightly above Friday’s close, dipped lower, but the 10 DMA’s support proved to be stable & was able to prop prices higher to close the day as an advancing session.
Monday’s high volume indicate that there is still strong belief in the 10 DMA, but given that it occurred in the wake of a somewhat risk-off Friday to kick off a new week it should be viewed skeptically, particularly as it occurred as a golden cross was forming, as the 50 DMA crossed the 200 DMA bullishly.
Yesterday’s session advanced, but the light volume is not convincing in terms of near-term strength, particularly when you factor in that it was unable to break above the recent high set on Tuesday of the week before.
Their Average True Range has been declining over the past couple of weeks, but should be expected to uptick in the near-term as other indicators are signaling that there is volatility on the horizon.
Fortunately for TLT there are many support touch-points nearby due to the consolidation of H1 2024 & August of 2023 which should help in declines, but there still looks to be some near-term declines on the horizon.
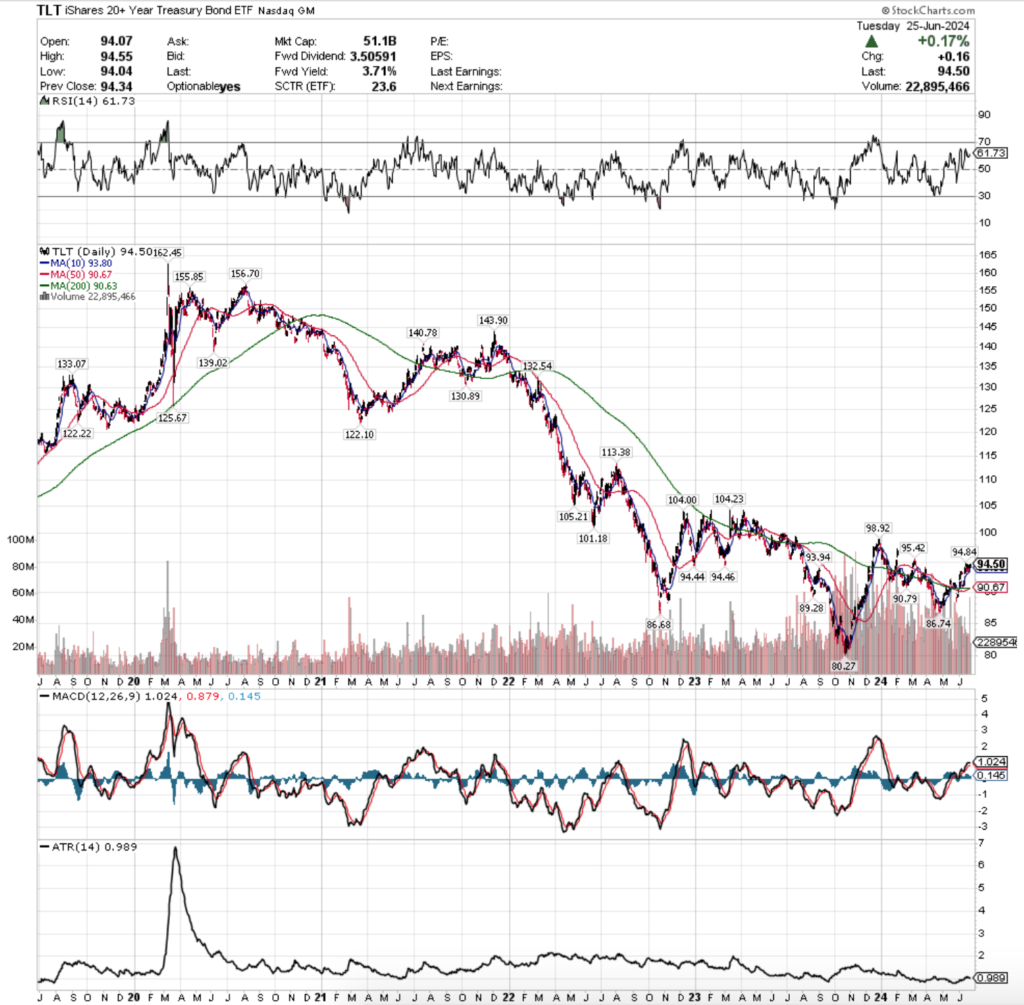
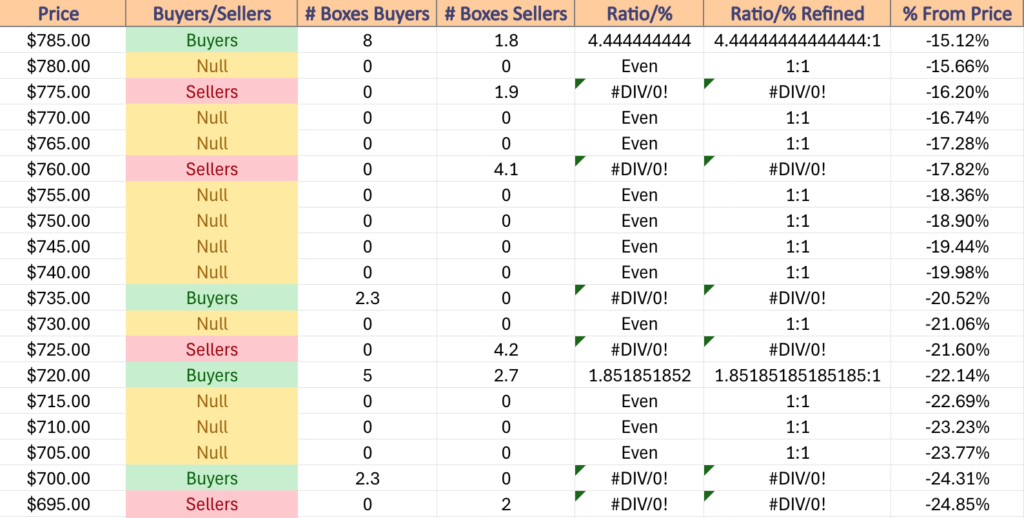
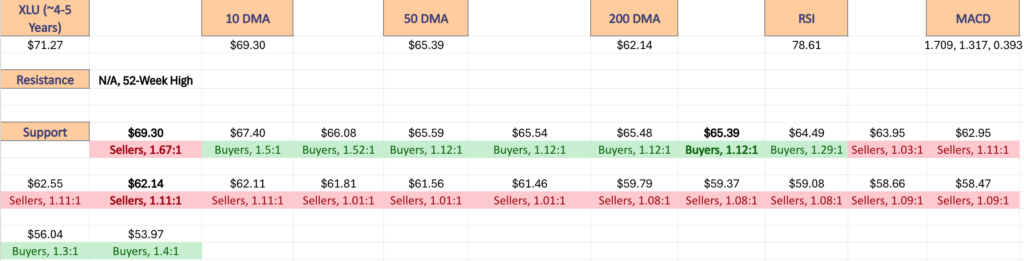
Below is a list of the price levels that TLT has traded at over the past 4-5 years, as well as the ratios of Buyers:Sellers (or Sellers:Buyers) from that time period, as well as a 5 year chart of their price action to reference while reviewing the data.
Pairing the two resources, as well as the near-term outlook just described may prove beneficial in assessing TLT’s price behavior as it encounters support & resistance levels in the near-term, but it should not replace your existing due diligence strategy.
TLT ETF – iShares 20+ Year Treasury Bond ETF’s Technical Performance Over The Past 5 Years
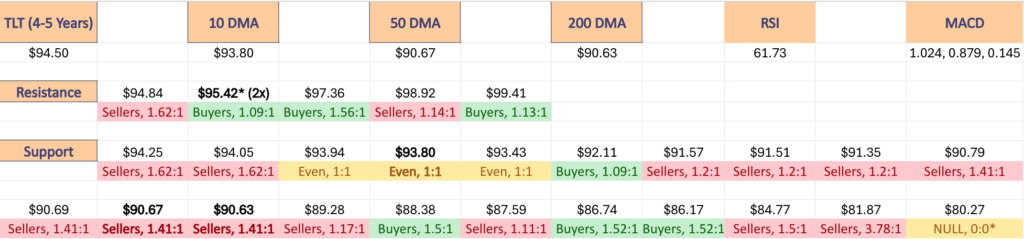
TLT, The iShares 20+ Year Treasury Bond ETF’s Price Level:Volume Sentiment Broken Down
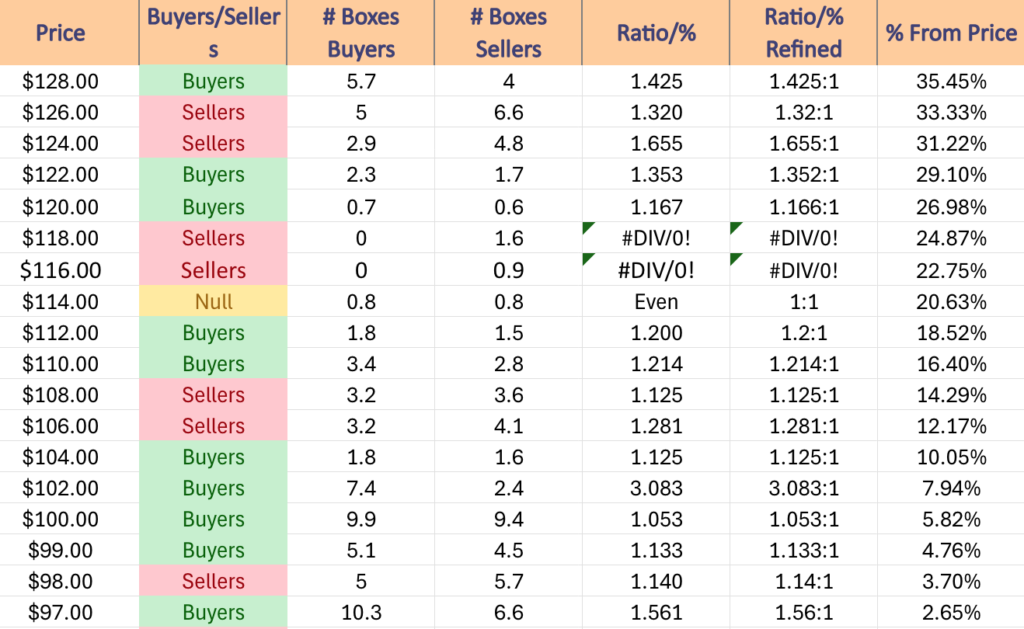
The top table below shows the support & resistance levels of TLT stock from the past year’s chart, as well as their price level:volume sentiment at each, using Friday’s closing price.
The moving averages are denoted with bold.
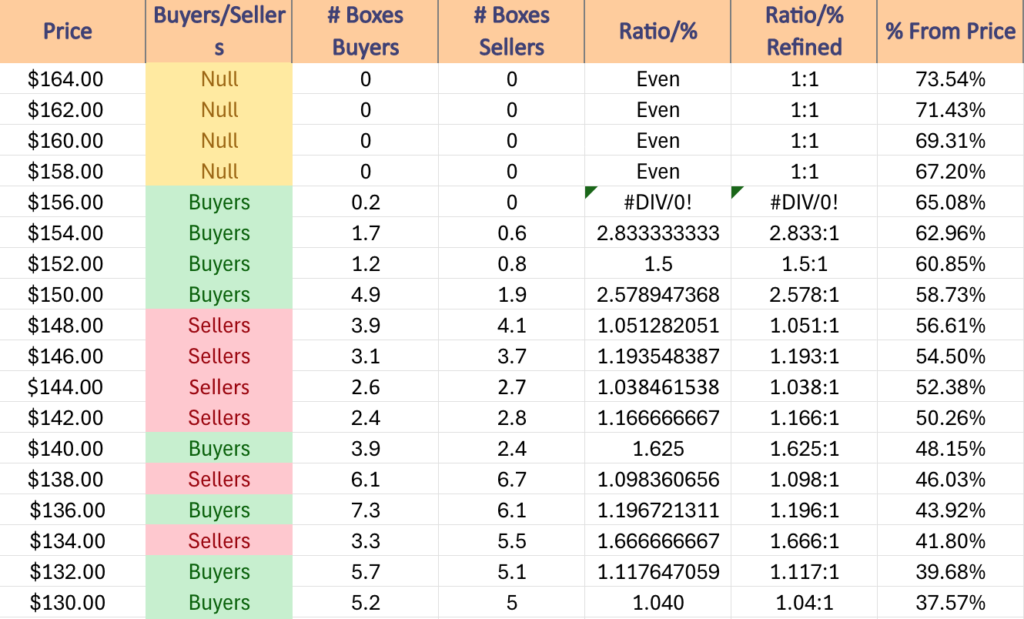
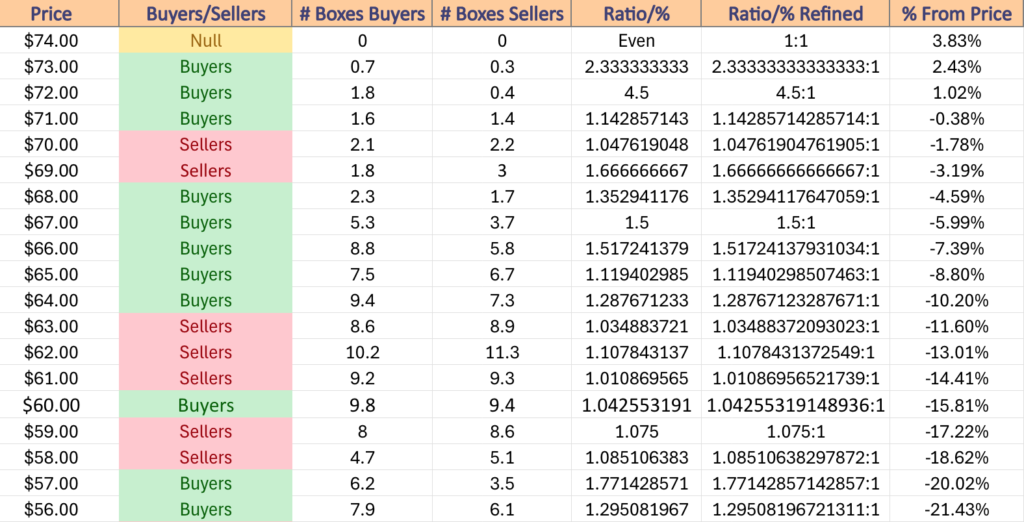
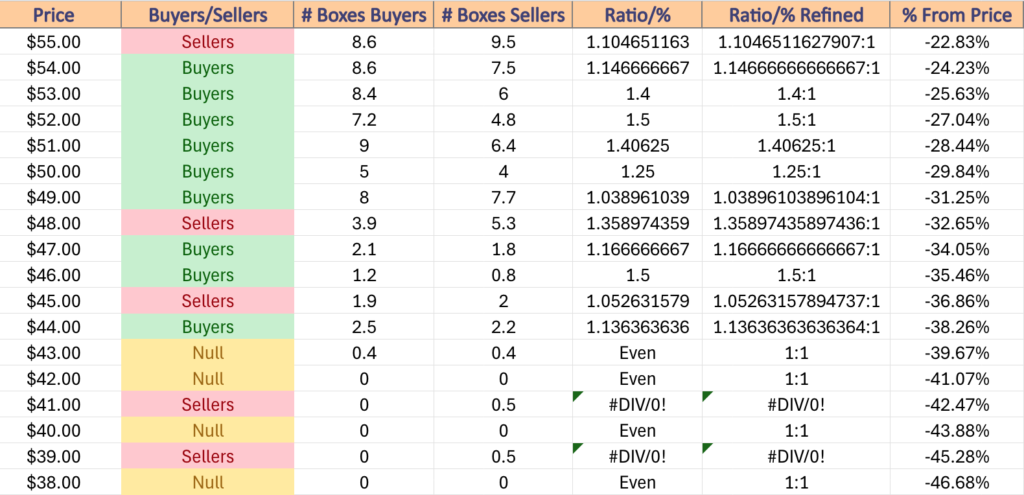
The next charts show the volume sentiment at each individual price level TLT has traded at over the past ~4-5 years.
Beneath them is a copy & pasteable list of the same data, where the support/resistance levels are denoted in bold.
All ratios with “0” in the denominator are denoted with a “*”.
NULL values are price levels that had limited trading volume, whether it be due to gaps, quick advances or they are at price extremes; in the event that they are retested & there is more data they would have a distinct “Buyers”, “Sellers” or “Even” title.
This is not intended as financial advice, but rather another tool to consider when performing your own research & due diligence on TLT stock.
TLT ETF’s Price Level:Volume Sentiment Over The Past 4-5 Years At Key Support & Resistance Levels From The Past Year
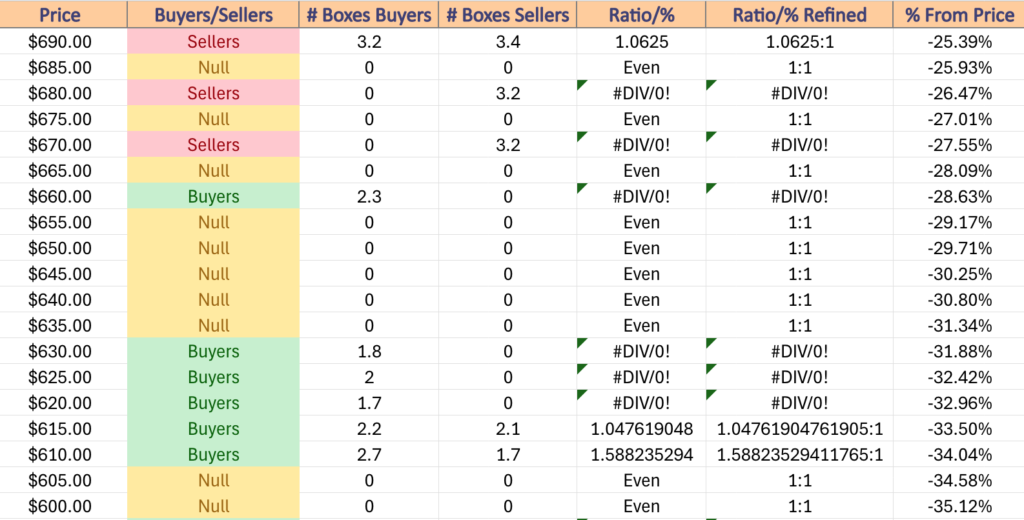
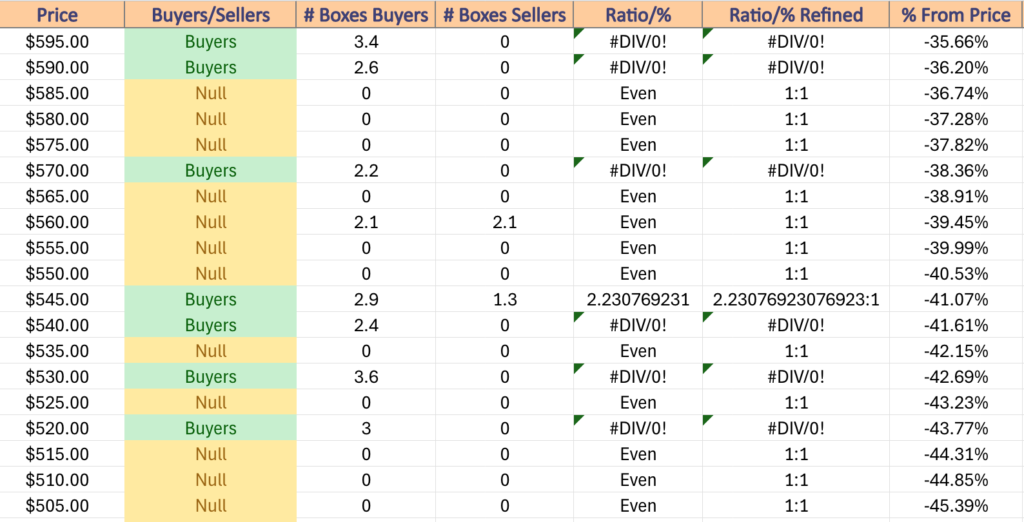
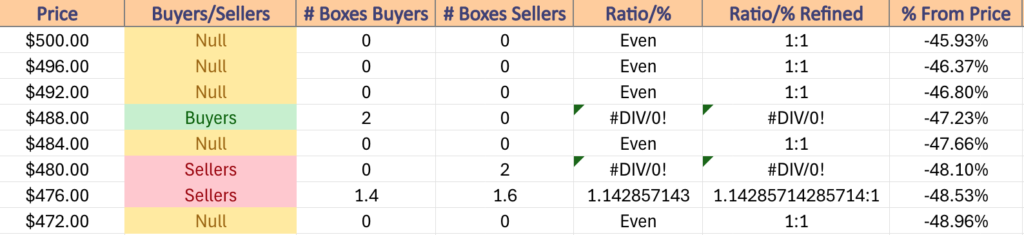
TLT ETF’s Price Level:Volume Sentiment Over The Past 4-5 Years
TLT ETF’s Price Level:Volume Sentiment Over The Past 4-5 Years
TLT ETF’s Price Level:Volume Sentiment Over The Past 4-5 Years
$164 – NULL – 0:0*, +73.54% From Current Price
$162 – NULL – 0:0*, +71.43% From Current Price
$160 – NULL – 0:0*, +69.31% From Current Price
$158 – NULL – 0:0*, +67.2% From Current Price
$156 – Buyers – 0.2:0*, +65.08% From Current Price
$154 – Buyers – 2.83:1, +62.96% From Current Price
$152 – Buyers – 1.5:1, +60.85% From Current Price
$150 – Buyers – 2.58:1, +58.73% From Current Price
$148 – Sellers – 1.05:1, +56.61% From Current Price
$146 – Sellers – 1.19:1, +54.5% From Current Price
$144 – Sellers – 1.04:1, +52.38% From Current Price
$142 – Sellers – 1.17:1, +50.26% From Current Price
$140 – Buyers – 1.63:1, +48.15% From Current Price
$138 – Sellers – 1.1:1, +46.03% From Current Price
$136 – Buyer s- 1.2:1, +43.92% From Current Price
$134 – Sellers – 1.67:1, +41.8% From Current Price
$132 – Buyers – 1.12:1, +39.68% From Current Price
$130 – Buyers – 1.04:1, +37.57% From Current Price
$128 – Buyers – 1.43:1, +35.45% From Current Price
$126 – Sellers – 1.32:1, +33.33% From Current Price
$124 – Sellers – 1.66:1, +31.22% From Current Price
$122 – Buyers – 1.35:1, +29.1% From Current Price
$120 – Buyers – 1.17:1, +26.98% From Current Price
$118 – Sellers – 1.6:0*, +24.87% From Current Price
$116 – Sellers – 0.9:0*, +22.75% From Current Price
$114 – Even – 1:1, +20.63% From Current Price
$112 – Buyers – 1.2:1, +18.52% From Current Price
$110 – Buyers – 1.21:1, +16.4% From Current Price
$108 – Sellers – 1.13:1, +14.29% From Current Price
$106 – Sellers – 1.28:1, +12.17% From Current Price
$104 – Buyers – 1.13:1, +10.05% From Current Price
$102 – Buyers – 3.08:1, +7.94% From Current Price
$100 – Buyers – 1.05:1, +5.82% From Current Price
$99 – Buyers – 1.13:1, +4.76% From Current Price
$98 – Sellers – 1.14:1, +3.7% From Current Price
$97 – Buyers – 1.56:1, +2.65% From Current Price
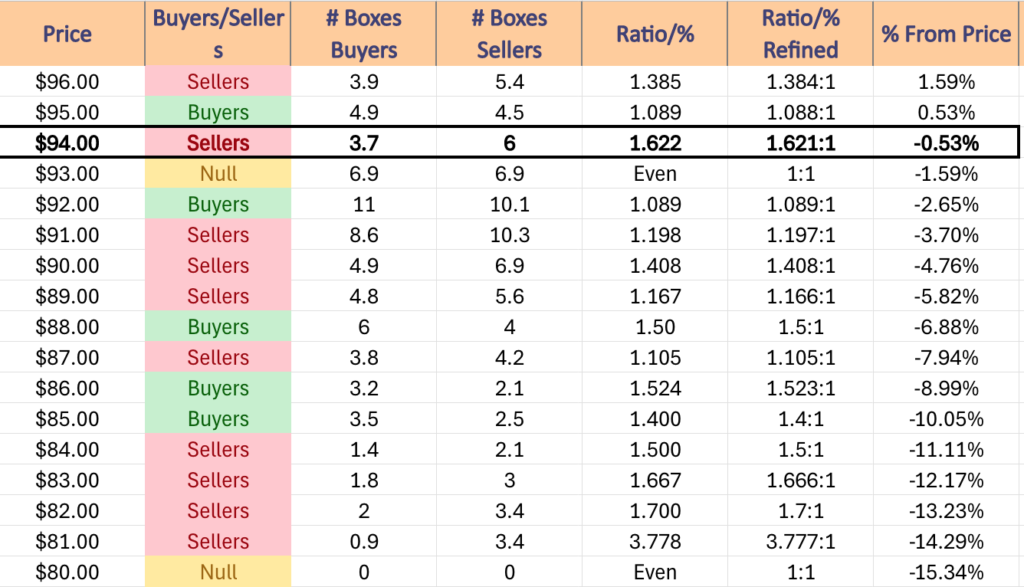
$96 – Sellers – 1.38:1, +1.59% From Current Price
$95 – Buyers – 1.09:1, +0.53% From Current Price – 2 Touch-Points At Same Price*
$94 – Sellers – 1.62:1, -0.53% From Current Price – Current Price Box*
$93 – Even – 1:1, -1.59% From Current Price – 10 Day Moving Average*
$92 – Buyers – 1.09:1, -2.65% From Current Price
$91 – Sellers – 1.2:1, -3.7% From Current Price
$90 – Sellers – 1.41:1, -4.76% From Current Price – 50 & 200 Day Moving Averages**
$89 – Sellers – 1.17:1, -5.82% From Current Price
$88 – Buyers – 1.5:1, -6.88% From Current Price
$87 – Sellers – 1.11:1, -7.94% From Current Price
$86 – Buyers – 1.52:1, -8.99% From Current Price
$85 – Buyers – 1.4:1, -10.05% From Current Price
$84 – Sellers – 1.5:1, -11.11% From Current Price
$83 – Sellers – 1.67:1, -12.17% From Current Price
$82 – Sellers – 1.7:1, -13.23% From Current Price
$81 – Sellers – 3.78:1, -14.29% From Current Price
$80 – NULL – 0:0*, -15.34% From Current Price
*** I DO NOT OWN SHARES OR OPTIONS CONTRACT POSITIONS IN TLT AT THE TIME OF PUBLISHING THIS ARTICLE ***
SPY, the SPDR S&P 500 ETF added +0.64% last week, while the VIX closed at 13.2, implying a one day move of +/-0.83% & a one month move of +/-3.82%.
SPY ETF – SPDR S&P 500 ETF’s Technical Performance Over The Past Year
Their RSI is still in overbought territory at 72.13 while trending back towards neutral, while their MACD is still bullish, but looking like it will roll over & bearishly cross the signal line this week.
Volumes were still muted at -20.55% below average vs. the prior year (57,970,675 vs. 72,969,048), which is low, but still better than previous weeks given that there were only four trading sessions last week.
However, given that this is now the seventh week of abnormally low volumes 13.5% of the weekly volumes for the past year’s calculation are now distorting the calculation lower, which is something to be kept in mind.
Monday the week began on an interesting note, as a wide range candle on mediocre volume advanced SPY higher.
Tuesday also was an advancing session, however it was the weakest volumes of the week & was hardly able to the the high of Monday’s session.
Wednesday the market was closed & when it came back Thursday the lack of enthusiasm continued, with Thursday’s session featuring the highest volume of the week on a decline.
Also important, Thursday’s candle formed a bearish engulfing pattern with Tuesday’s candle, setting the stage for further near-term declines.
Friday confirmed this with another declining session on high volume heading into the weekend.
Friday’s candle resulted in a doji, indicating indecision & that there is a bit of hesitancy on the part of market participants.
Much like last week, this week SPY’s 10 day moving average & MACD will be a key area of focus.
Their MACD is primed for a bearish crossover this week which would result in an uptick in volatility & their Average True Range.
The 10 DMA will be important as it currently sits <1% below the current price of SPY & is inching closer to the price each day, & the next level of support below that is an additional -2% from the current price.
As noted in previous weeks’ notes, there are sparse local support levels for SPY due to the nature of their ascent over the past year & the next level of support beneath that is going to be a -5% decline from the current price.
It is also worth noting that there has been muted volumes around most of these support levels, which as a result is why there is currently still limited data on the strength of each support level’s price level.
Also, keep an eye on whether or not the gap from last week begins to fill, as well as where their RSI is at during any declines in the near-term.
Keeping an eye on where prices are as it begins approaching the neutral level, as well as if it begins to revert back towards overbought conditions will be key in figuring out near-term market direction.
SPY has support at the $540.47 (10 Day Moving Average, Volume Sentiment: NULL, 0:0*), $531.35 (Volume Sentiment: NULL, 0:0*), $522.92 (Volume Sentiment: NULL, 0:0*) & $520.47/share (50 Day Moving Average, Volume Sentiment: NULL, 0:0*) price levels, with resistance at the $548.35/share (All-Time High, Volume Sentiment: NULL, 0:0*) price level.
SPY ETF’s Price Level:Volume Sentiment Over The Past 1-2 Years
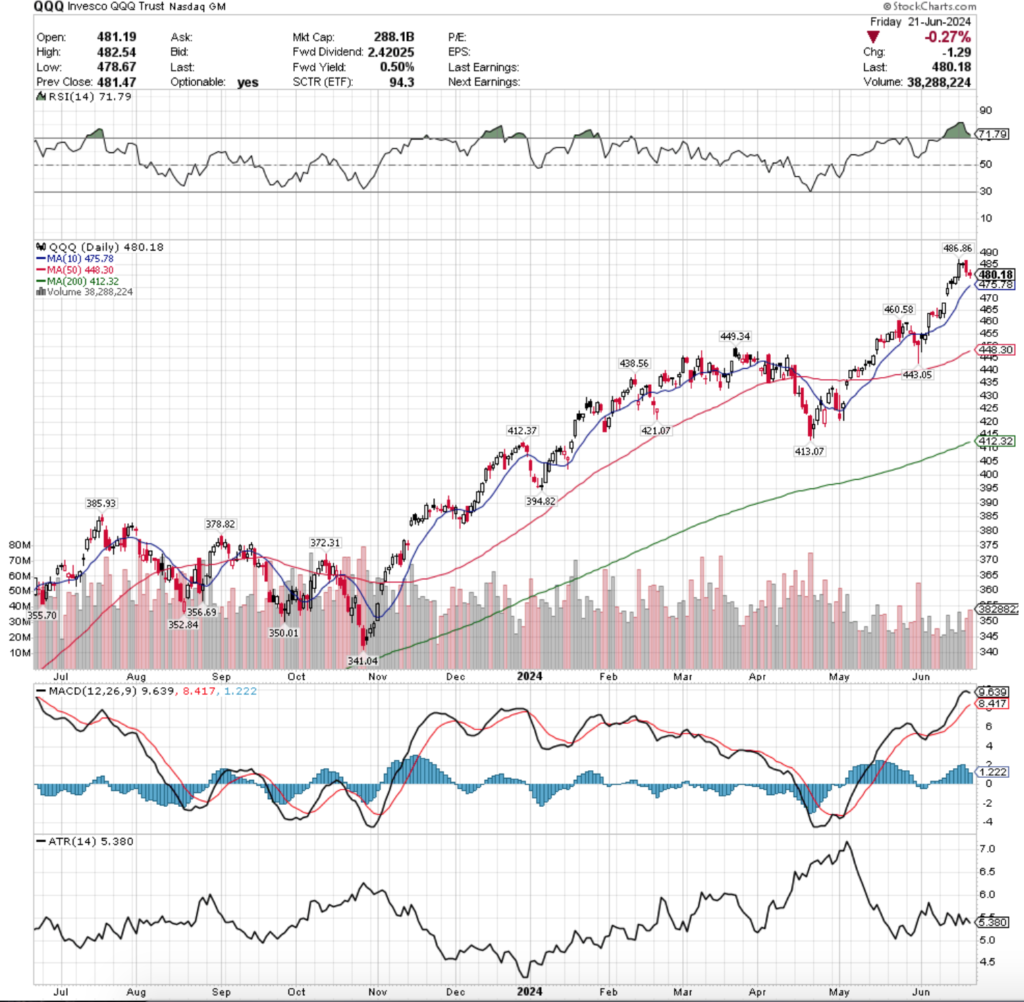
QQQ ETF – Invesco QQQ Trust ETF’s Technical Performance Over The Past Year
Their RSI is still overbought at 71.79, but it is trending back towards neutral, while their MACD is still bullish but showing signs of weakening & a bearish crossover this coming week.
Volumes were -27.21% below average last week compared to the previous year’s average (33,217,150 vs. 45,637,118), which is still weak even aside from the shortened trading week’s impact.
Monday started similarly for QQQ as it did for SPY, as a wide range session kicked off the week on an advancing note.
Tuesday also was similar to SPY, when the lowest volumes of the week nudged the index ETF slightly higher, although QQQ’s resulted in a doji candle, indicating hesitancy & indecision on the part of market participants.
Thursday resumed with bearish sentiment as a bearish engulfing candle let the leg down on a declining session & paved the way for Friday’s declines on the highest volume of the week, as folks wanted risk-off into the weekend.
Friday’s candle indicated that there is even more uncertainty on the horizon, as it resulted in a spinning top for the session.
QQQ has moved in a more similar manner to SPY than the other indexes, and as a result it has the same things to be keeping an eye on this week.
The impending MACD crossover’s actual declines hinge on the strength of the 10 DMA’s support, which is currently <1% from QQQ’s price.
Their next support level is ~4% below their current price, with another ~2% to go until another support level is found (including the 50 day moving average).
Also, like SPY, keep an eye on the RSI of QQQ as it begins a near-term decline, noting how price is behaving as it approaches the neutral level, which will happen should the gap from last week begin to fill.
QQQ has support at the $475.78 (10 Day Moving Average, Volume Sentiment: NULL, 0:0*), $460.58 (Volume Sentiment: NULL, 0:0*), $449.34 (Volume Sentiment: NULL, 0:0*) & $448.30/share (50 Day Moving Average, Volume Sentiment: NULL, 0:0*) price levels, with resistance at the $486.86/share (All-Time High, Volume Sentiment: NULL, 0:0*) price level.
QQQ ETF’s Price Level:Volume Sentiment Over The Past 1-2 Years
IWM, the iShares Russell 2000 ETF climbed +0.82% last week, mostly due to Monday’s bullish session that set the stage for the rest of the week.
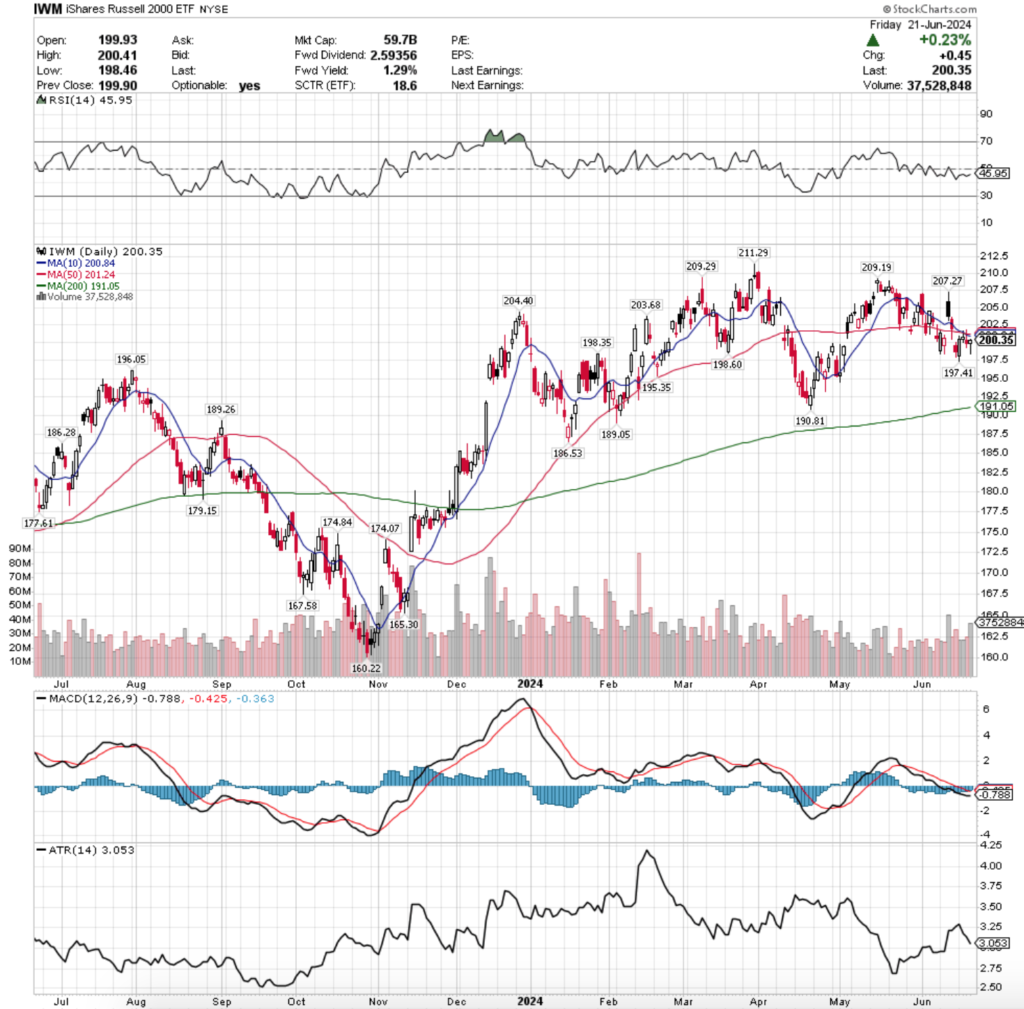
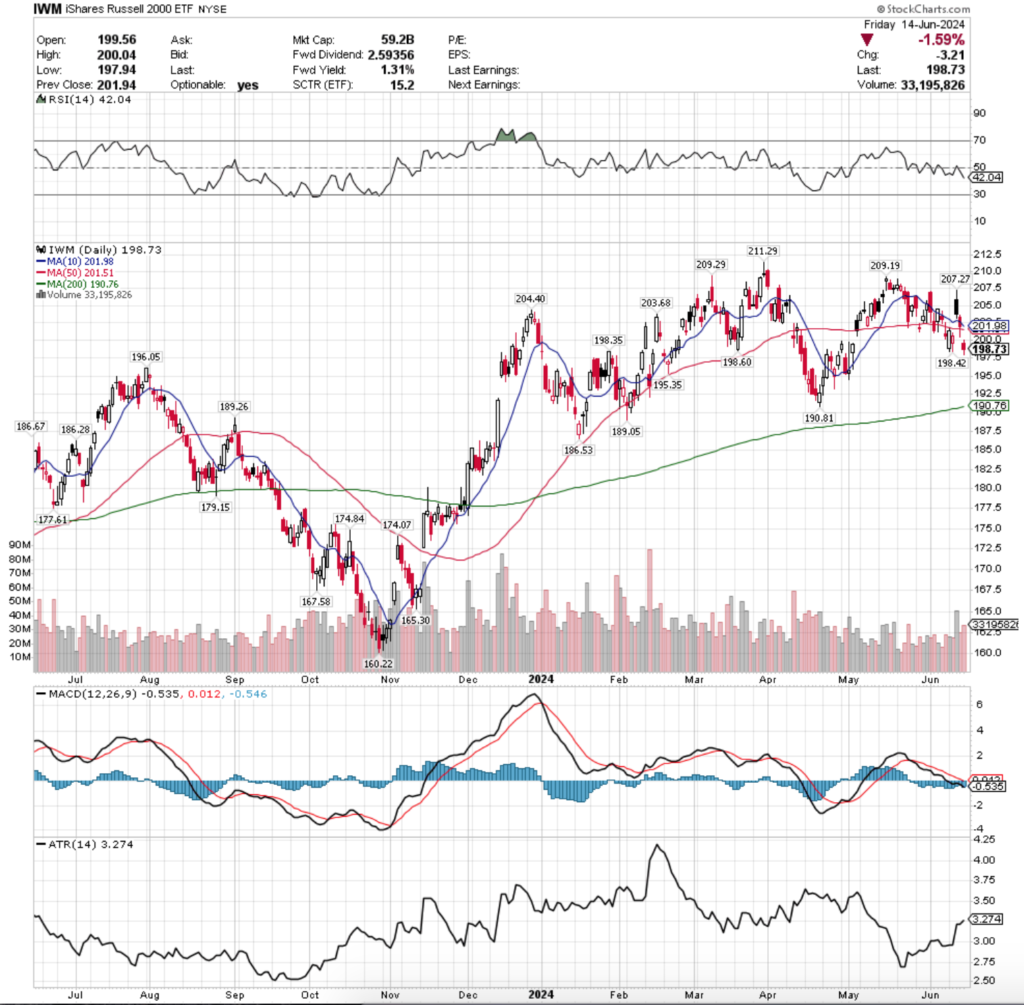
IWM ETF – iShares Russell 2000 ETF’s Technical Performance Over The Past Year
Their RSI is currently at 45.95, trending up towards the neutral 50 mark, while their MACD is still bearish, but beginning to show signs of a potential bullish crossover of the signal line in the near-term.
Volumes were -13.64% below average vs. the prior year (29,124,000 vs. 33,725,106), which were the closest to normal of the major index ETFs.
IWM’s week started off with a wide-range session that spurred the rest of the week’s advances, but the low volume was unable to get it close enough up to test the strength of the 10 or 50 day moving averages.
Tuesday opened higher & tested back into Monday’s range before charging at the 10 & 50 DMA’s resistance, only to get rejected & sent back down to close for a daily gain.
Tuesday’s candle’s long upper shadow does not paint a strong case for the bulls, as despite is showing slight upside appetite, it clearly echoes that there are still more bears in the pool.
Thursday opened lower than Tuesday & ultimately rallied higher to break above the 10 & 50 DMAs’ resistance temporarily, before declining on the day’s session, including some testing lower towards the midway point of Monday morning’s candle’s real body.
Friday wound the week down with a hint of indecision, as the day advanced +0.23% with a spinning top candle, indicating that there is hesitancy on the part of market participants & confirming the strength of the 10 & 50 DMAs’ resistance.
Friday did however have the highest volume of the week for IWM, confirming that there was no appetite to go retest the 10 & 50 DMAs in the near-term.
Given that IWM trades more in a back & forth oscillation than the steep ascending indexes like SPY & QQQ they have more local support levels to help keep their prices up in the near-term.
This week will be focused on seeing if IWM makes another run at the 10 & 50 DMAs’ resistance, particularly as their 200 DMA is ~5% from their current price to the downside, which will cause some pressure to be placed on IWM’s price in the coming weeks.
In the event that IWM does not break for the upside it will most likely continue forward much in the manner it has traded recently, a further consolidation range where the price is walked along by the 10 & 50 DMAs from above.
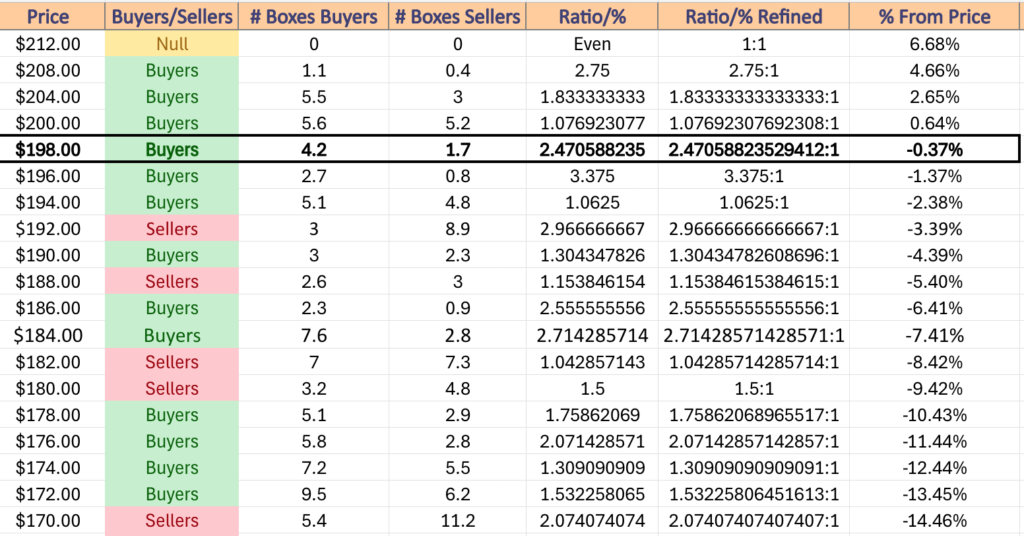
In an outright decline there are many support touch-points nearby that can help slow losses & control the decline, making it worth reviewing the table below that shows the strength of the price levels IWM has traded at over the past 1-2 years.
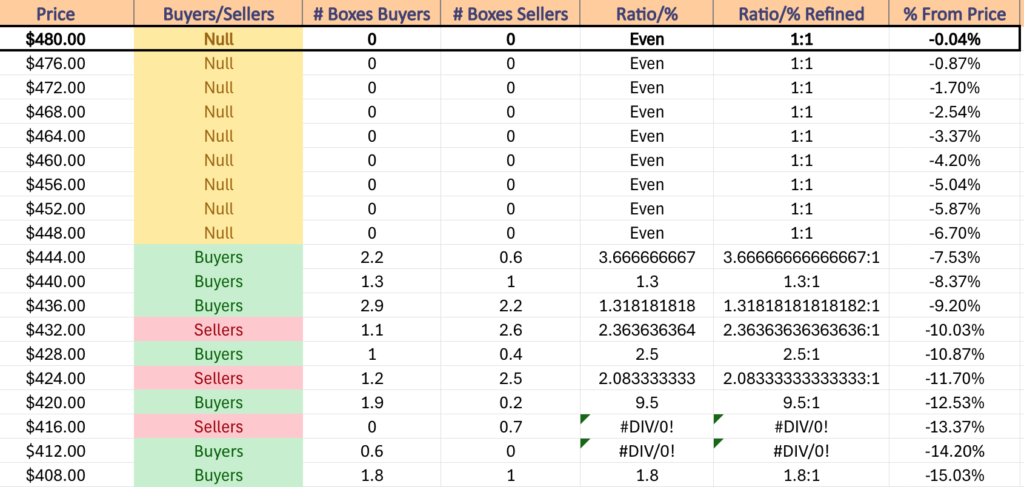
IWM has support at the $198.60 (Volume Sentiment: Buyers, 2.47:1), $198.35 (Volume Sentiment: Buyers, 2.47:1), $197.41 (Volume Sentiment: Buyers, 3.38:1) & $196.05/share (Volume Sentiment: Buyers, 3.38:1) price levels, with resistance at the $200.84 (10 Day Moving Average, Volume Sentiment: Buyers, 1.08:1), $201.24 (50 Day Moving Average, Volume Sentiment: Buyers, 1.08:1), $203.68 (Volume Sentiment: Buyers, 1.08:1) & $204.40/share (Volume Sentiment: Buyers, 1.83:1) price level.
IWM ETF’s Price Level:Volume Sentiment Over The Past 1-2 Years
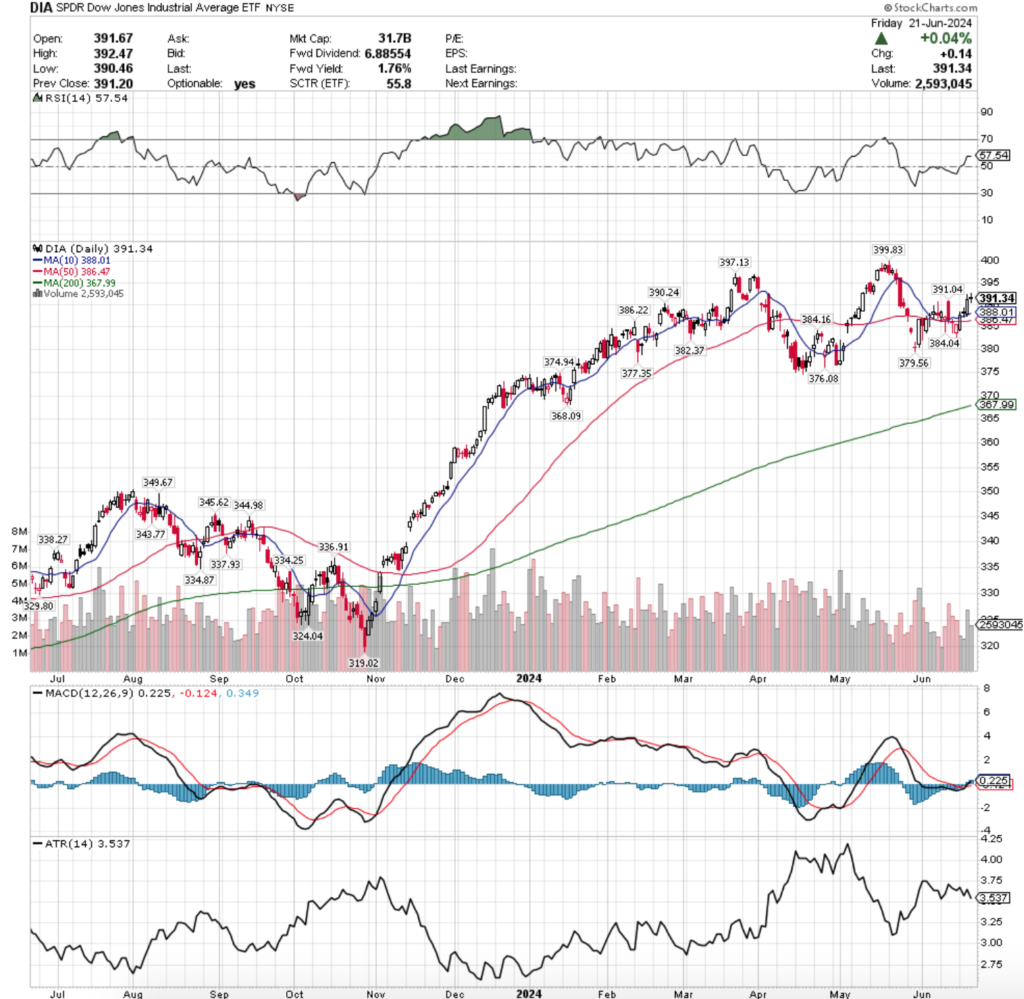
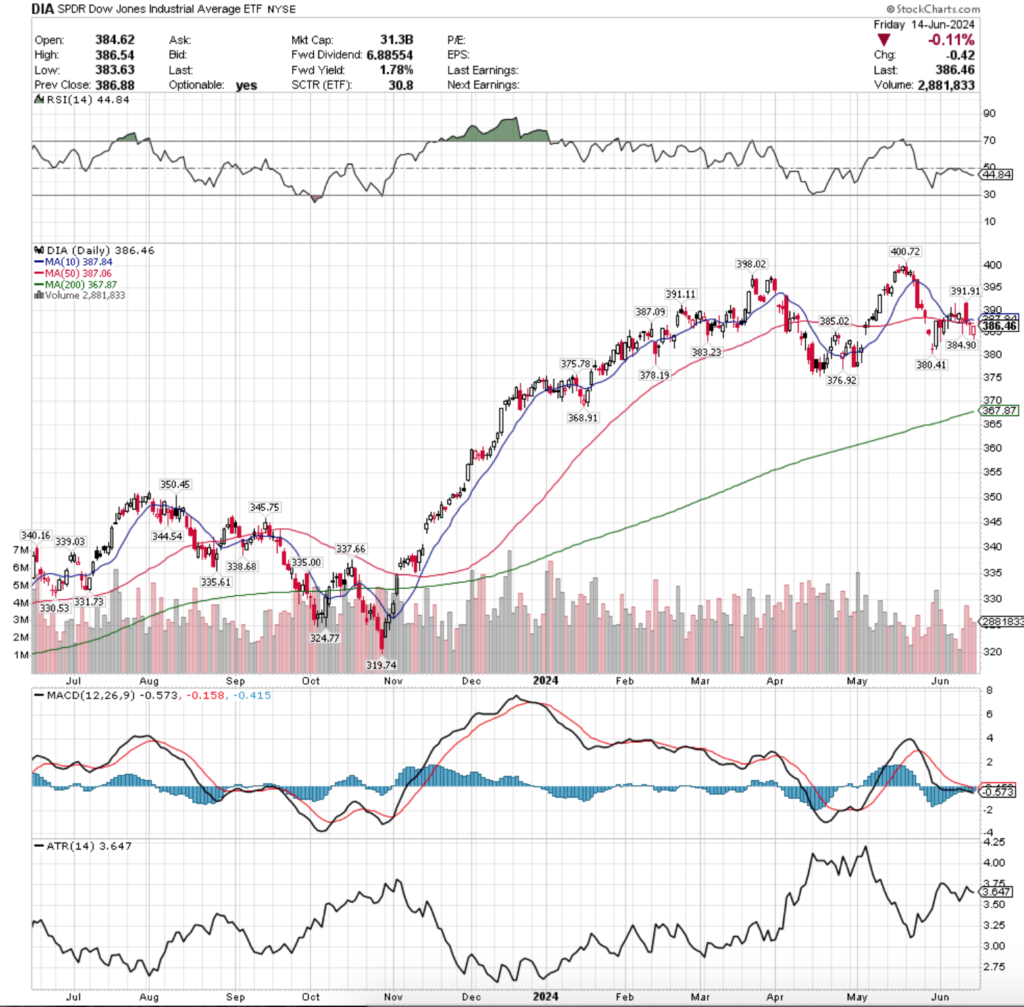
DIA ETF – SPDR Dow Jones Industrial Average ETF’s Technical Performance Over The Past Year
Their RSI is just above the neutral level at 57.54 & has flattened, while their MACD is bullish, but muted.
Volumes were -28.11% lower than the previous year’s average last week (2,513,525 vs. 3,496,240) as there was not a high rate of participation among investors.
DIA advanced during every session last week, beginning on Monday when a low volume day produced a wide-range candle, much like SPY, QQQ & IWM.
It should be noted that Monday’s session broke & stayed above both the 10 & 50 day moving averages.
Tuesday showed a bit of uncertainty as the session was also low volume & resulted in a doji, although it was able to remain above the support of the 10 DMA.
Thursday tested the 10 DMA’s support before rallying up for another wide-range candle on the highest volume of the week.
A key difference between Monday & Wednesday is the length of the candles’ shadows, as both the upper & lower shadow are larger on Thursday’s candle than Mondays.
This indicates that there is less conviction moving into these higher price levels & that neither the bulls nor the bears are completely in control & there is a bit of sentiment for prices to move in either direction at this level.
Friday confirmed this by resulting in a doji candle, indicating that there was a bit of indecision heading into the weekend.
This week will be interesting to see if they can continue higher towards the $397.13/share level, which would possibly set up a head & shoulders pattern in DIA.
In the event that they reach that high it will be beneficial to review where their RSI is at that time, as that will give insight into whether they make a run at their all-time high at $399.83 or if they’ll cool back off & consolidate.
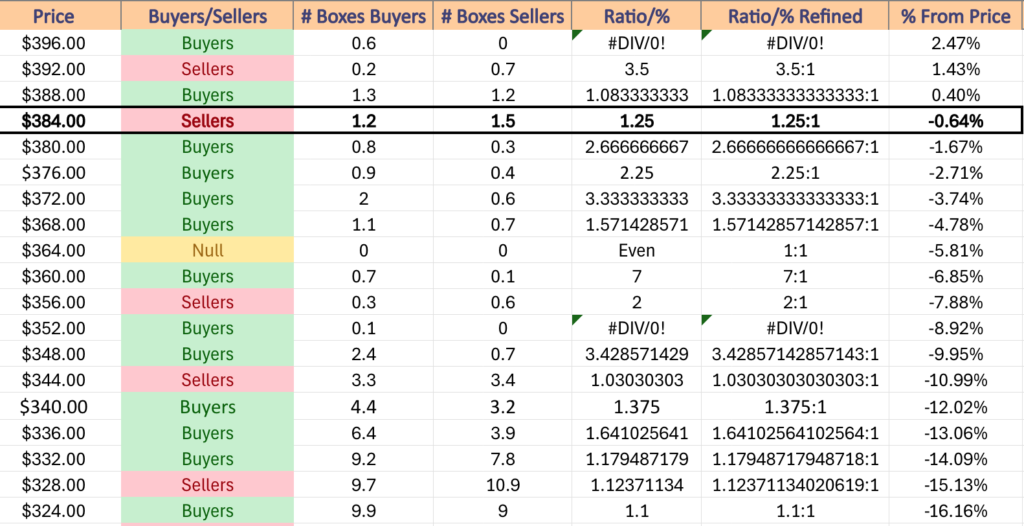
Otherwise, to the downside they do have a fair amount of support near-by & the 10 & 50 DMA’s strength of support will be key to watch.
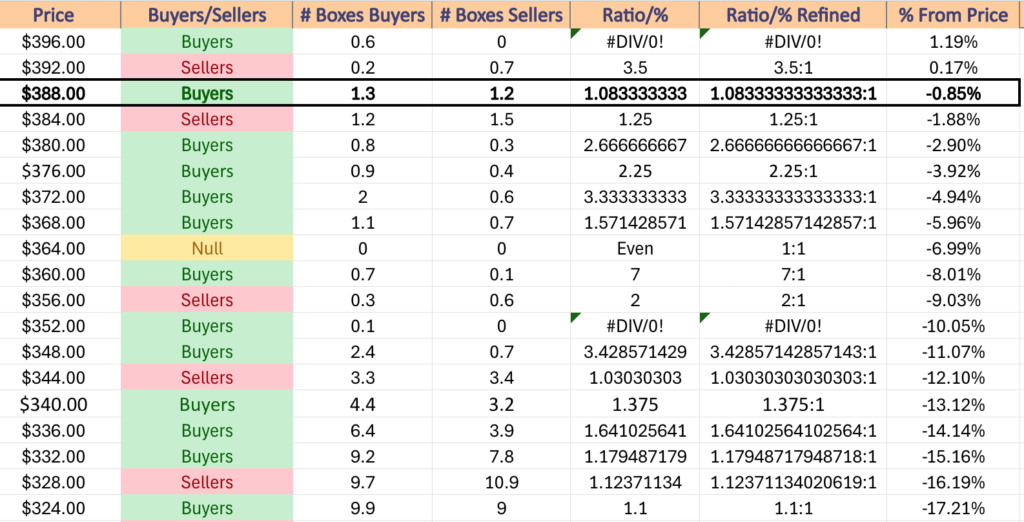
DIA has support at the $391.04 (Volume Sentiment: Buyers, 1.08:1), $390.24 (Volume Sentiment: Buyers, 1.08:1), $388.01 (10 Day Moving Average, Volume Sentiment: Buyers, 1.08:1) & $386.47/share (50 Day Moving Average, Volume Sentiment: Sellers, 1.25:1) price levels, with resistance at the $397.13 (Volume Sentiment: NULL, 0:0*) & $399.83/share (All-Time High, Volume Sentiment: NULL, 0:0*) price level.
DIA ETF’s Price Level:Volume Sentiment Over The Past 3-4 Years
The Week Ahead
Monday the week kicks off with Fed Governor Waller speaking in Rome at 3 am, followed by San Francisco Fed President Daly speaking at 2pm.
There are no noteworthy earnings reports scheduled for Monday.
Fed Governor Bowman speaks at 7am Tuesday morning in London, followed by S&P Case-Schiller Home Price Index (20 Cities) data at 9 am, Consumer Confidence at 10 am & Fed Governor Cook speaking at 12 pm.
Tuesday morning TD Synnex is scheduled to report earnings, with Fed Ex, Progress Software & Worthington Enterprises due to report after the session’s close.
Wednesday morning at 10 am New Home Sales data is released.
General Mills, Paychex & UniFirst report earnings before Wednesday’s opening bell, with Micron Technology, AeroVironment, Concentrix, H.B. Fuller, Levi Strauss, MillerKnoll & Worthington Steel all scheduled to report after the session’s close.
Initial Jobless Claims, GDP (second revision), Durable-Goods Orders & Durable-Goods minus Transportation data are released Thursday at 8:30 am, with Pending Home Sales data after them at 10 am.
Acuity Brands, Apogee Enterprises, Lindsay, McCormick & Company, Simply Good Foods & Walgreens Boot Alliance all report earnings before the opening bell on Thursday, with Nike & Accolade due to report after the session’s closing bell.
Friday is the busiest day of the week on the data front, beginning with Richmond Fed President Barkin speaking at 6 am, Personal Income (nominal), Personal Spending (nominal), PCE Index, PCE Year-over-Year, Core PCE Index & Core PCE Index Year-over-Year at 8:30 am, Chicago Business Barometer (PMI) at 9:45 am, Consumer Sentiment (final) at 10 am & Fed Governor Bowman speaking at 12 pm.
There are no major earnings reports scheduled for Friday.
See you back here next week!
*** I DO NOT OWN SHARES OR OPTIONS CONTRACT POSITIONS IN SPY, QQQ, IWM OR DIA AT THE TIME OF PUBLISHING THIS ARTICLE ***
SPY, the SPDR S&P 500 ETF added +1.64% this week, as the volume drought continued for a sixth consecutive week.
The VIX closed the week at 12.66, implying a one day move of +/-0.80% & a one month move of +/-3.66%, although both of those numbers seem extreme if volumes continue to be so low (I am on vacation & this portion was written before Monday’s open, but I’m not editing it).
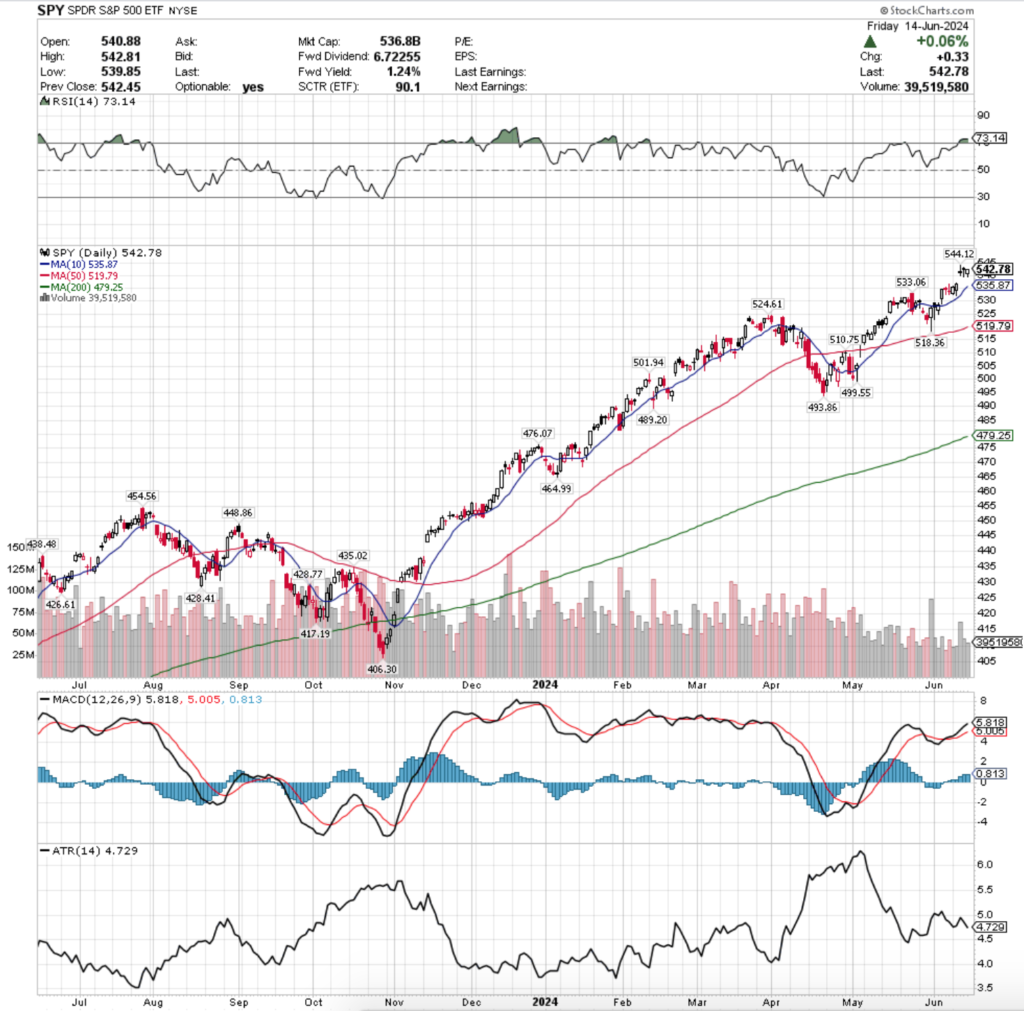
SPY ETF – SPDR S&P 500 ETF’s Technical Performance Over The Past Year
Their RSI is currently overbought at 73.14 & has flatlined in the wake of the consolidation period post-gap up over the past few days, while their MACD extended pointing bullish, but the histogram isn’t signaling extreme strength.
Volumes were -42.39% below average compared to the year prior (42,408,078 vs. 73,612,610), as it appears global warming has even caused a severe 6 week volume drought for the major index ETFs.
Monday opened the week up on a bullish & optimistic note, despite having the weakest volumes of the week & the session closed in a bullish engulfing day-over-day pattern that closed in the top 25% of the prior Friday’s candle’s upper shadow.
The cautious, yet optimistic sentiment carried on into Tuesday, when the session opened at the midway point of Monday’s candle’s real body, checked lower but was supported by the 10 day moving average (which it didn’t test fully) before trending higher to close the day in an advance.
Tuesday’s volumes were also on the lower end of the spectrum last week for SPY, indicating there was still a bit on uneasiness in markets as participants waited for both Wednesday’s CPI announcement & FOMC interest rate announcement.
This is where things took a turn for the interesting for SPY & QQQ in particular (QQQ will be reviewed next), as the CPI report forced SPY to open on a gap up on Wednesday morning & run up higher until about 10:30 am, before settling into a trading range.
Around 1:30 pm SPY began to experience declines in the run-up to Powell’s rate announcement & at 2pm continued lower.
SPY continued to bounce around in that range during Powell’s press conference until near the end when from 2:50-3:15 pm it rallied higher before dumping for the rest of the afternoon & into the close after Powell finished speaking.
This led to the day’s close being lower than the session’s open, on the highest volume of the week.
Given the hawkish nature of the Fed announcement & the dot-plot this appears to be the precursor to a further move downward in the coming weeks.
It is worth noting that 21% of the dot plot currently calls for 0 rate cuts in 2024, which is an increase of 100% from the March meeting.
Additionally, ~53% of the dots from March’s meeting have moved from 3-4 cuts in 2024 to 0,1 or 2 cuts.
In addition to the 0 cuts gaining +100%, it appears as one cut may be the most likely in 2024, as the dots for one cut increased by +250%, while the dots for three cuts only increased by 60% from March’s reading.
This will be something to keep an eye on moving into the second half of the year, especially while trying to navigate the timing estimates of said cuts that folks are saying on the financial news.
It’s also worth noting that Wednesday’s price action & the subsequent consolidation range following the gap up pushed SPY’s RSI into overbought territory.
Thursday brought along the PPI report, which also was slightly better than what was anticipated by markets, yet SPY didn’t seem properly convinced that things are improving.
This makes sense though, as one thing that is not often discussed when the impact of rate hikes has been brought up is how long it took for the desired impacts to take place since they began in March of 2022.
With this in mind, it is something to think about every time you hear someone utter the phrase “higher for longer”, as it’s been ~2.25 years since this process began & it is highly unlikely that this will be as simple as putting ice melt out on your driveway & seeing everything immediately melt away.
While Thursday’s volume was the second highest of the week, it’s still not particularly convincing that there will be folks eager to hop back into the pool in the near-term, particularly when looking at the broader market breadth.
Thursday ultimately opened on a gap up, tested much lower, but ultimately closed on the higher end of the day’s range, but below the opening price level.
This is another indication of market participant hesitancy & reason to take caution in the near-term.
Friday opened lower, tested slightly lower, but was ultimately able to close in a +0.06% advance going into the weekend, which when combined with the low volumes is really not much of a bullish sentiment.
SPY’s Average True Range began the week perking higher as discussed would happen last week, however the gap up of Wednesday’s session caused it to go back to where it began the week.
There are many Fed speakers next week, along with data coming out on the manufacturing front & homebuilding front which will likely play an impact on the week’s overall performance.
It seems that there are more potential downward catalysts in the week ahead than upward ones, but time will tell.
For the past few weeks we have stressed the importance of the relationship of the price to the 10 & 50 day moving averages, which will still be a factor in the week ahead.
However, the window that was created by Wednesday’s gap up will be an area of more interest, as while it provides some support in the near-term that is even closer to the price than the 10 DMA, it is also likely to be filled based on the low participation levels shown by volumes over the past 6 weeks.
While the gap has provided adequate support so far based on the lower shadows of the last three candles of the week, there will be more tests to come of this in the week ahead & the low volumes suggest that many market participants are looking for a reason to abandon ship in the short-term.
Adding further uncertainty to this is that most of the trading at the more recent high price levels has been on such light volume that sentiment analyses of SPY’s most recent price levels produce little signals & data, making it difficult to gauge the strength of the local support levels.
With this in mind, it is best to err to the side of weakness in the near-term when assessing the strength of these support levels, given that there is such little volume in the price ranges SPY has been at recently.
Should the window begin to be filled, it is likely the support of the 10 day moving average will be broken to the downside, making the $533.06 level important in hopes that it can create enough support for a near-term head-and-shoulders pattern using Wednesday’s new all-time high as the headpiece.
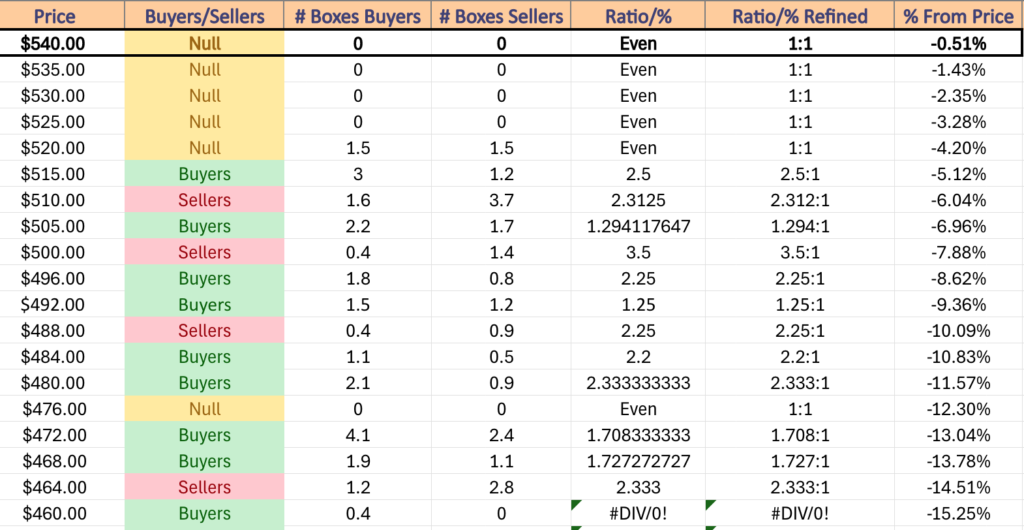
SPY has support at the $535.87 (10 Day Moving Average, Volume Sentiment: NULL, 0:0*), $533.06 (Volume Sentiment: NULL, 0:0*), $524.61 (Volume Sentiment: NULL, 0:0*) & $519.79/share (50 Day Moving Average, Volume Sentiment: Buyers, 2.5:1) price level, with resistance at the $544.12/share (Volume Sentiment: NULL, 0:0*) price level.
SPY ETF’s Price Level:Volume Sentiment Over The Past 1-2 Years
QQQ, the Invesco QQQ Trust ETF that tracks the NASDAQ 100 advanced +3.51% for the week, having the best week of the major index ETFs as NVDA’s +9.09% weekly gain powered the 100 stock component index higher than SPY’s more diluted 500 stock index.
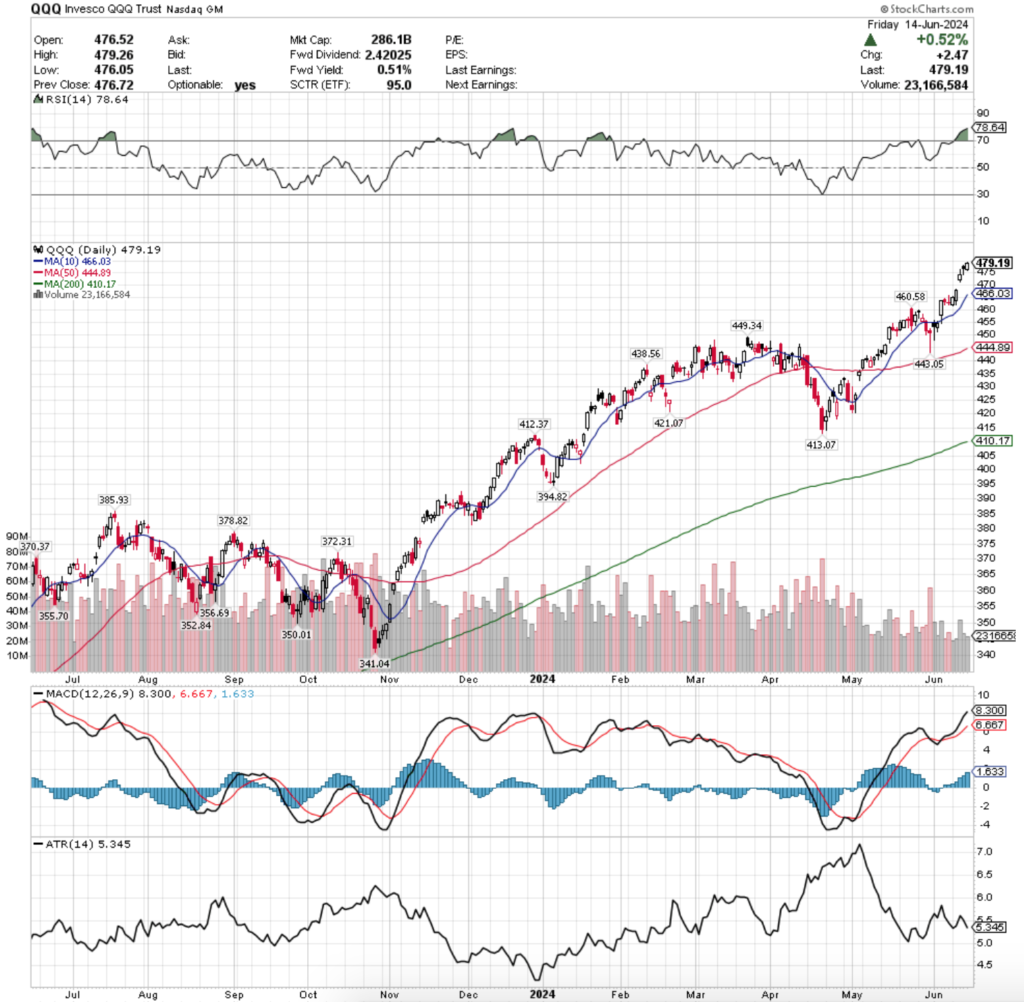
QQQ ETF – Invesco QQQ Trust ETF’s Technical Performance Over The Past Year
Their RSI is currently overbought at 78.64, while their MACD is bullish, but beginning to look to be extended due to lack of volume.
Volumes were worse than SPY’s though, coming in at -45.38% below average compared to the previous year (25,243,192 vs. 46,219,182), as it’s beginning to look like QQQ needs to start offering free pizza with purchase in order to drum up participation.
As we’ve been saying for the last handful of weeks, QQQ & SPY have been trading similarly due to their having NVDA & other semiconductor/AI-focused names as component stocks, which has caused them to perform much more strongly than IWM & DIA, both of which have limited to no exposure in those areas/names.
Monday kicked the week off on a similar bullish note for QQQ as SPY had, where a bullish engulfing candle set the week up for advances, although on the weakest volume of the week (also much like SPY).
Tuesday the advances continued, as did the weak volume (second weakest of the week).
Wednesday’s news events created a gap up situation for QQQ as well, also on the week’s highest volumes, which resulted in a candle with a longer upper shadow than lower shadow, indicating that bulls were not in control, but that there was some appetite to keep pushing higher.
QQQ’s RSI crossed into overbought conditions on Tuesday, leading SPY by a day.
Thursday had a rather ominous tone to the day, as the second highest volumes of the day had a dreary, yet slightly bullish result.
Prices gapped higher on the open as a result of the CPI, FOMC & PPI information releases, but tested much lower during the day to around the neighborhood Wednesday closed in, before staging a slight recovery to still close below the day’s open.
Friday resulted in a bullish engulfing candle & a new all-time high for QQQ, but with the subdued volume levels, high RSI & stretched MACD it is not feeling as bullish as it may normally.
Much like SPY, QQQ’s Average True Range began the week advancing until the gap up session of Wednesday turned it around.
This week will also turn QQQ’s focus onto the strength of the window created on Wednesday’s support, as well as if their 10 day moving average will be of much help should it cross over into the zone before prices reach that low.
The small real bodies of the candles of the past week are another indication that things are not necessarily doing ok under the hood for QQQ & that there is still a great deal of indecision in the air around them.
Many of the concerns regarding the strength of sentiment in support for SPY are also applicable to QQQ & will be areas to keep an eye on moving into the coming week.
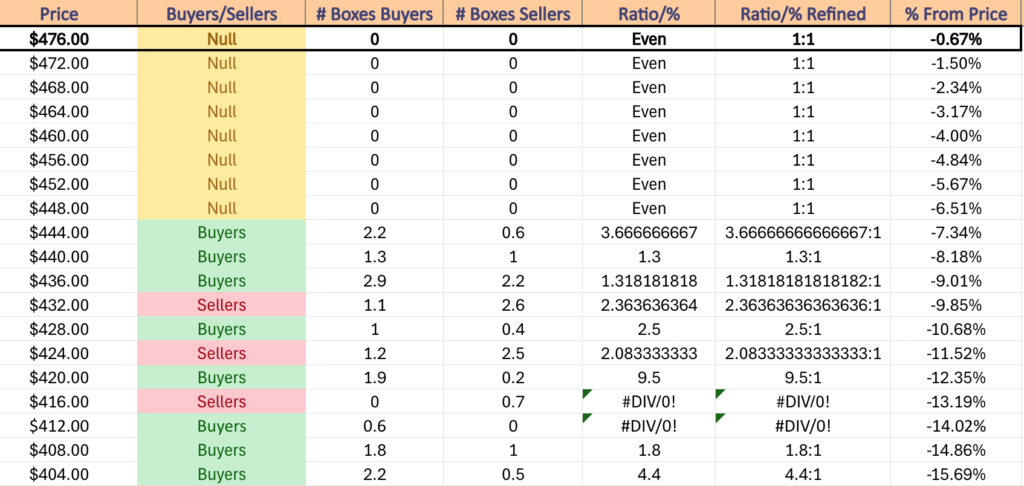
QQQ has support at the $466.03 (10 Day Moving Average, Volume Sentiment: NULL, 0:0*), $460.58 (Volume Sentiment: NULL, 0:0*), $449.34 (Volume Sentiment: NULL, 0:0*) & $444.89/share (50 Day Moving Average, Volume Sentiment: Buyers, 3.67:1) price level, with resistance at the $479.26/share (All-Time High/Friday’s High, Volume Sentiment: NULL, 0:0*) price level.
QQQ ETF’s Price Level:Volume Sentiment Over The Past 1-2 Years
IWM ETF – iShares Russell 2000 ETF’s Technical Performance Over The Past Year
Their RSI is currently at 42.04 & trending lower towards the oversold level of 30 as a result of the consolidation that began in the middle of May, while their MACD is bearish & steadily trending lower away from the signal line, due to the nature of the consolidation range being so stretched out.
Volumes were bad, but better than the other three index ETFs, ending the week only -9.13% below the year prior’s average volume (30,758,209 vs. 33,848,256), making IWM the most actively traded of the major four index ETFs this past week (it’s a participation trophy, but we’ll give it to them).
Monday opened on weak volumes an a bullish engulfing candle, much like SPY & QQQ & set the stage for a week of advances.
Tuesday had different plans however, when a bearish harami pattern emerged during the lowest volume session of the week.
It’s worth noting that this was the lowest volume day of the week, as the session was able to close higher than it opened, despite being a declining session.
This signals that the move was not based off of any actual meaningful strength & that sentiment for IWM was still to the downside.
Wednesday is where things became interesting, as prices gapped higher on the open, tested even higher to the range that IWM traded in’s high from two weeks ago, before ultimately testing much lower & closing lower.
The good news was that the 10 day moving average was just as strong that day as a support level as it has been as a resistance level for the past few weeks.
The next day is where Wednesday’s subtle weakness was confirmed though, as prices gapped lower, broke through the 10 day moving average’s support, before dropping below the 50 DMA’s support & recovering to close just above the 50 DMA.
Thursday’s volume was the third highest of the week, indicating that this pivotal move was relatively supported by market participants & that there is still quite a bit of hesitancy among market participants to dive back into the small cap dominated index.
Friday came through with confirmation of this, when prices gapped lower, made a weak attempt higher, before testing much lower & closing down -1.59% for the day heading into the weekend.
IWM’s Average True Range has behaved differently than SPY & QQQ’s & has continued higher this past week, again likely due to their lack of NVDA & other semiconductor/AI name relevance.
This is going to be an area to keep an eye on in the near future, as these names can’t keep the entire S&P 500/NASDAQ 100 afloat forever & the challenges that IWM & DIA have faced over the past few weeks are likely to occur to SPY & QQQ except much worse as their prices have continued higher irrationally while the other two indexes have taken time to breathe.
As we’ve outlined before, the more range-bound oscillating trading style of IWM has it in the comfort of many local support levels, which will help soften any further declines.
IWM’s 10 day moving average looks primed to bearishly cross their 50 DMA which will queue further near-term declines.
This will be an area to keep a close eye on, but even more important will be to monitor what occurs with SPY & QQQ when this occurs, as they may either continue flying higher while IWM suffers, and or that movement may be the catalyst that begins to let some air out of the balloons & cause folks to take profits from their positions in them.
IWM has support at the $198.60 (Volume Sentiment: Buyers, 2.47:1), $198.42 (Volume Sentiment: Buyers, 2.47:1), $198.35 (Volume Sentiment: Buyers, 2.47:1) & $196.05/share (Volume Sentiment: Buyers, 3.38:1) price level, with resistance at the $201.51 (50 Day Moving Average, Volume Sentiment: Buyers, 1.08:1), $201.98 (10 Day Moving Average, Volume Sentiment: Buyers, 1.08:1), $203.68 (Volume Sentiment: Buyers, 1.08:1) & $204.40/share (Volume Sentiment: Buyers, 1.83:1) price levels.
IWM ETF’s Price Level:Volume Sentiment Over The Past 1-2 Years
DIA, the SPDR Dow Jones Industrial Average ETF dipped -0.52% for the week, further distancing itself from the recent returns of SPY & QQQ & sending signals of weakness to investors & traders.
DIA ETF – SPDR Dow Jones Industrial Average ETF’s Technical Performance Over The Past Year
Their RSI is trending down from the neutral level & sits at 44.84, while their MACD is bearish & looking primed to continue downward for the coming week.
Volumes were -21.91% below average last week vs. the previous year (2,748,875 vs. 3,520,004), as market participants have not been overly eager to jump back into the markets & are more content with taking a breather.
Monday was the only bullish day of the week for DIA, however the bullish engulfing candle came on extremely light volumes which indicated that there was little strength behind the short term bullish signal.
Tuesday began to signal more weakness when the session opened lower, tested below the support of the 10 & 50 DMAs & ultimately closed slightly above its open, but still for a declining daily session.
Wednesday was where the real trouble began though, as the session opened on a gap up following the CPI print, but investors were no enthused about the FOMC decision & pushed prices much lower throughout the day, settling atop/just at the 10 & 50 DMA’s support levels.
This was confirmed Thursday when the session opened & tested lower again, but ultimately closed as a doji on a declining session right at about the 50 DMA’s support on the second lowest volume of the week.
Market participants were eagerly participating on profit taking during these two sessions, which is a theme that will likely carry over into this week for DIA.
Friday confirmed the weakness when prices gapped lower on the open & tested a bit lower before closing above their open, but still down -0.11% for the day.
DIA’s Average True Range has also been declining since Wednesday’s session, but based on their other indicators it looks like volatility will continue to perk up throughout this week.
As outlined many times previously, DIA & IWM have begun trading in a much more of a range-bound style than SPY & QQQ who have advanced at rapid rates over the past seven months, which gives the former more local support levels.
It will be interesting to see how strong the resistance of the 10 & 50 day moving averages are on DIA’s price this week, as well as to see if the emerging bearish head & shoulders pattern actually comes to fruition & what impact that would have on the other major three index ETFs.
It will also be imperative to see if there are any volume spikes & in which direction they occur over the coming week, as this may prove to be indicative of future near-term price movements.
DIA has support at the $385.02 (Volume Sentiment: Sellers, 1.25:1), $384.90 (Volume Sentiment: Sellers, 1.25:1), $383.23 (Volume Sentiment: Buyers, 2.67:1) & $380.41/share (Volume Sentiment: Buyers 2.67:1) price level, with resistance at the $387.06 (50 Day Moving Average, Volume Sentiment: Sellers, 1.25:1), $387.09 (Volume Sentiment: Sellers, 1.25:1), $387.84 (10 Day Moving Average, Volume Sentiment: Sellers, 1.25:1) & $391.11/share (Volume Sentiment: Buyers, 1.08:1) price level.
DIA ETF’s Price Level:Volume Sentiment Over The Past 3-4 Years
The Week Ahead
Monday kicks off with the Empire State Manufacturing Survey data at 8:30 am, followed by Philadelphia Fed President Harker speaking at 1pm.
La-Z-Boy & Lennar are both scheduled to report earnings after Monday’s closing bell.
U.S. Retail Sales & Retail Sales minus Autos are released at 8:30 am on Tuesday, followed by Industrial Production & Capacity Utilization data at 9:15 am, Business Inventories & a Richmond Fed President Barkin interview at 10 am, St. Louis Fed President Musalem speaks at 1:20 pm, Chicago Fed President Goolsbee speaks at 2pm & the day closes with Dallas Fed President Logan speaking at 2:30 pm.
Tuesday morning’s pre-market earnings reports include America’s Car Mart, Cognyte Software & Patterson Companies, with KB Home announcing their results after the session’s close.
Wednesday’s primary area of focus will be the Home Builder Confidence Index at 10am.
Steelcase is scheduled to report earnings on Wednesday.
Initial Jobless Claims, U.S. Current Account, Housing Starts, Building Permits & the Philadelphia Fed Manufacturing Survey data are all released Thursday at 8:30 am.
Thursday morning begins with Darden Restaurants, Accenture, Commercial Metals, GMS, Jabil, Kroger & Winnebego all reporting earnings before the opening bell, with Smith & Wesson Brands reporting after the session’s closing bell.
Friday the week winds down with S&P Flash U.S. Services PMI & S&P Flash U.S. Manufacturing PMI data at 9:45 am, followed by Existing Home Sales & U.S. Leading Economic Indicators data at 10 am.
CarMax & FactSet Research Systems will report earnings before the opening bell on Friday morning.
See you back here next week!
*** I DO NOT OWN SHARES OR OPTIONS CONTRACT POSITIONS IN SPY, QQQ, IWM OR DIA AT THE TIME OF PUBLISHING THIS ARTICLE ***
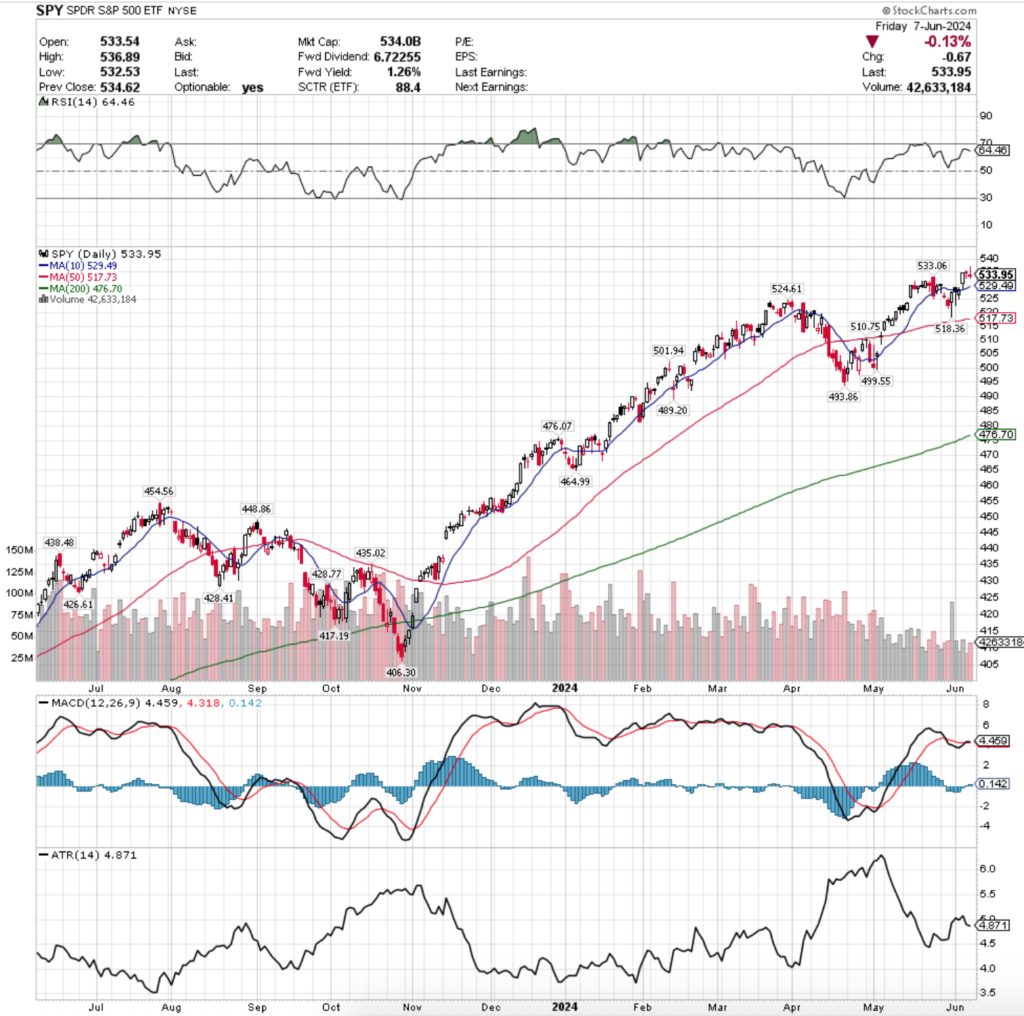
SPY, the SPDR S&P 500 ETF advanced +1.26% this past week as they continued to enjoy the NVDA stock split mania, while the VIX closed the week at 12.22%, implying a one day move of +/-0.77% & a one month move of +/-3.53%.
SPY ETF – SPDR S&P 500 ETF’s Technical Performance Over The Past Year
Their RSI is 64.46 after trending close to the overbought level but decreasing over the past two sessions, while their MACD is still bullish but looking weak & like it is ready for a bearish crossover in the coming week.
Volumes were -47.06% below average for the week compared to the year prior, continuing the tumbleweed trend for a fifth consecutive week (39,364,990 vs. 74,350,735).
This lack of volume for such a long time is becoming a bit concerning, with the coming week’s CPI, PPI & Fed-Funds Rate decision likely going to be the catalyst to increase volumes, be it to the upside or downside.
Monday began the week on a note of uncertainty, as the session gapped up to open above the 10 day moving average, only to test to the downside below the open of the previous Friday’s open & recovered to close just below/in-line with the 10 DMA.
This was on the second highest volume of the week, indicating that there is some severe downside sentiment in the market, both by how low the day’s range tested & by the fact that the day closed lower than it opened, which is another signal of limited cofidence.
Tuesday opened on a gap down & tested lower, although not as low as Monday & ultimately was able to test above the 10 DMA, although it closed about in-line with it.
The limited volume of the day (second lowest of the week) indicates that there was not much faith in the price advance & that market participants are still weary of prices being around the 10 day moving average.
Things got interesting on Wednesday, as SPY was able to gap up to open above the 10 DMA, but while the 10 DMA’s support held up, it was tested & the upside testing beyond the day’s closing level was minimal.
This led into Thursday’s narrow gap up open that ultimately tested lower & resulted in a doji candle, indicating uncertainty as investors tread water waiting for new developments to send SPY higher or lower.
The low volume on the doji should also be noted, as it showed market participants were relatively content with where SPY was priced, while also showing some hesitancy to continue marching higher.
This was confirmed by Friday’s session, where a new all-time high was reached temporarily, but the open & close of the day’s sessions were concentrated near the bottom of the day’s candle, which was also a doji (although its body was a bit thicker than the day prior’s.
SPY’s Average True Range declined a bit (we had anticipated it continuing higher) due to the first three sessions of the week, but in the wake of Thursday & Friday’s declines it should be primed to edge higher as volatility looks set to increase this week.
This week’s main events will be Wednesday & Thursday between CPI, the FOMC interest-rate decision & PPI data being released & markets are already eagerly awaiting their next direction based on the results of these announcements.
Rates will most likely remain unchanged & the “higher for longer” narrative will likely be repeated, which would cause the 10 DMA’s support to give out again, at which point all eyes will shift to the 50 day moving average.
There are two other support levels between the 10 & 50 day moving averages currently, but given that one was established six sessions ago it is likely not going to be strong, especially with how close the 50 DMA is to it.
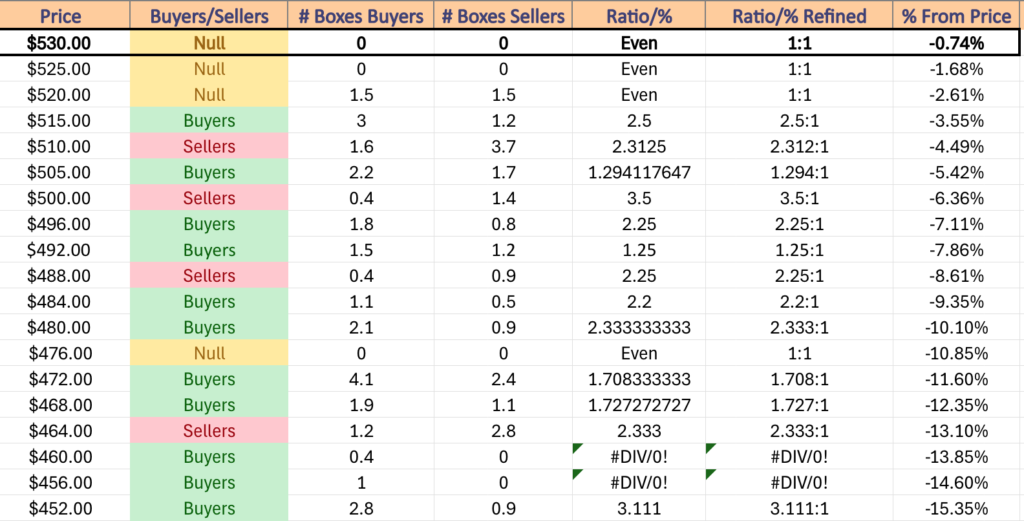
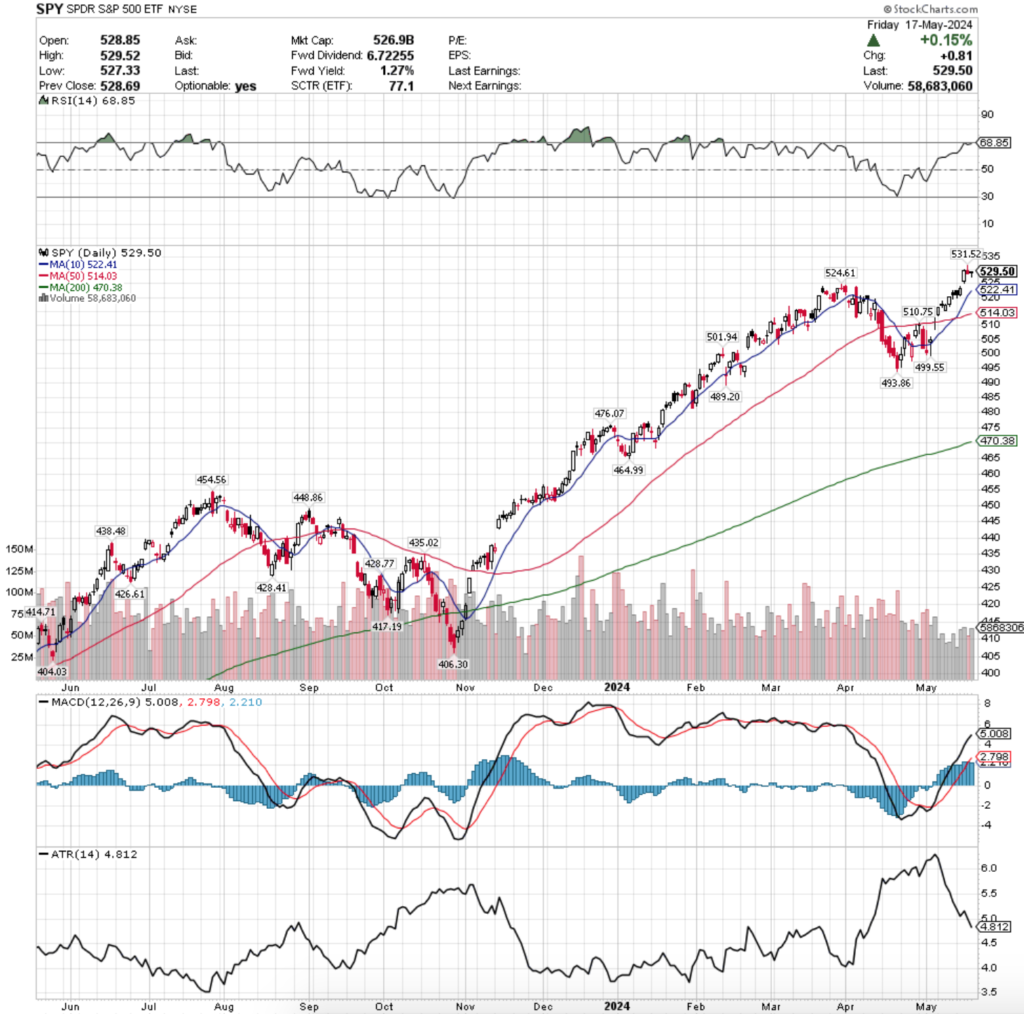
The 50 DMA test will more than likely result in a declining move through it, which would then open up SPY to further declines due to sparse support levels following their aggressive run up that began in October of 2023 & the $510.75, $501.94, $499.55 & $493.86 price levels would then be the next key support levels of focus.
Until then, expect rangebound activity & a consolidation for the beginning of the week within the confines of Wednesday’s candle’s real body on muted volumes.
In the event of any upside moves (for SPY, as well as the other index ETFs below) in the near-term, unless they’re accompanied by strong volumes they should be viewed with caution based on current market sentiments.
SPY has support at the $533.06 (Volume Sentiment: NULL, 0:0*), $529.49 (10 Day Moving Average, Volume Sentiment: NULL, 0:0*), $524.61 (Volume Sentiment: Even, 1:1) & $518.36/share (Volume Sentiment: Buyers, 2.5:1) price levels, with resistance at the $536.89/share (All-Time High, Volume Sentiment: NULL, 0:0*) price level.
SPY ETF’s Price Level:Volume Sentiment Over The Past 1-2 Years
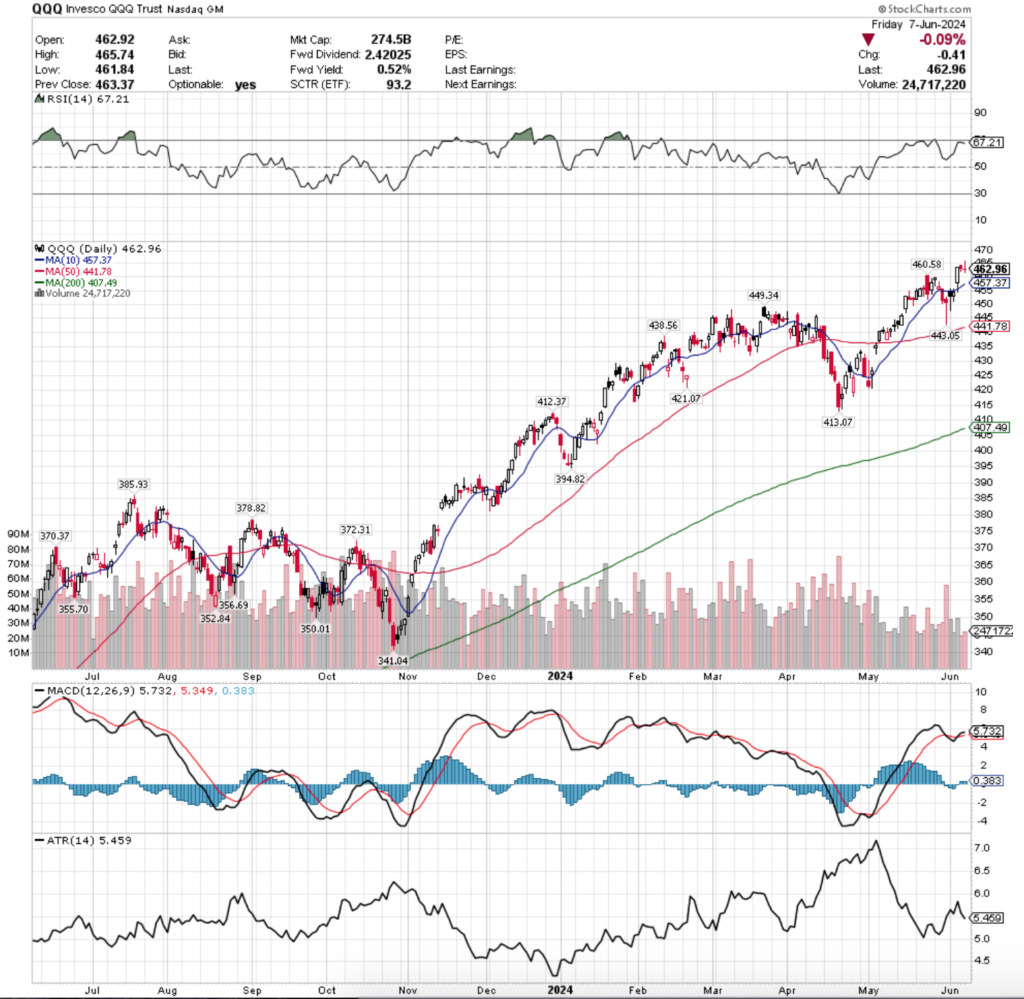
QQQ, the Invesco QQQ Trust ETF that tracks the NASDAQ 100 advanced +2.72% last week, having the strongest week of the major four index ETFs.
QQQ ETF – Invesco QQQ Trust ETF’s Technical Performance Over The Past 1-2 Years
Their RSI is just beneath the overbought level of 70 & is currently at 67.21 after brushing up against the overbought mark, while their MACD is slightly bullish, but looking feeble & ready to keel over for a bearish crossover in the coming days.
Volumes were -41.33% below average vs. the year prior (27,451,313 vs. 46,787,963), as market participants are extremely cautious about entering into new positions & are worried about the outcome of the three key events mentioned above.
This low volume should also be noted as if there is any type of miss or bad data released it will spark investors into action, most likely to all hop out of the pool & take their profits with them from the run up QQQ has enjoyed since October of 2023.
QQQ’s week looked very similar to SPY’s, which makes sense given that they’ve both been driven by NVDA’s success, while IWM & DIA have not as it is not a component of either index.
Monday kicked QQQ’s week off on an erie note, as the session gapped higher on the open to just below the 10 day moving average’s resistance, poked higher temporarily, but ultimately tested low on the downside to well below the prior Friday’s close & closed for the day lower than the open.
This was the week’s second highest volume session of the week as well, indicating that there is more bearish than bullish sentiment in the near-term for QQQ.
Tuesday had a similar story, opening above Monday’s close, but testing lower before poking its upper shadow above the 10 DMA only to close right below it.
The session’s weak volume should be noted as it indicates that there was a bit of uncertainty among market participants & an overall reluctance to go above the 10 day moving average’s resistance.
Wednesday’s move to the upside then became more questionable, as despite having the highest volumes of the week, the levels were so muted that it is hardly meaningful from a sentiment perspective compared to their average volumes.
They opened above the 10 DMA, tested below it, but ultimately continued higher & established a new all-time high.
It should be noted however that there was no upper shadow on the day’s candle, which means that the day’s closing level was one of the highest points it traded at all day, indicating that there is not much appetite for QQQ to advance beyond that level in the near-term.
Much like SPY, expect to see QQQ kick off this week in a consolidation range based on the real body of Wednesday’s candle in the run-up to this week’s big data announcements mid-week.
Thursday set the tone for this with a slight gap higher than ultimately closed in declines with a lower shadow indicating that there was more downward sentiment than upward at these levels & an indecisive spirit was confirmed by the lowest volume of the week.
This continued Friday as the session opened on a gap lower, tested higher to reach an new all-time high, but ultimately closed as a gravestone doji, indicating that the sentiment now for QQQ is bearish, which should be expected to continue into this week.
Much like SPY, QQQ’s 10 & 50 DMAs will continue to be areas to watch this week, as should the support of the 10 DMA be broken there will likely be a follow up test of the 50 DMA, as there are only two support levels between the two moving averages, one of which was established a week ago from Friday.
The index can continue to float higher if the AI & semiconductor names continue to be strong, but it appears that market participants are already taking their feet off of the gas pedal in recent weeks & are looking for a reason to take profits in the near-term, which may be delivered to them mid-week.
QQQ’s Average True Range also began to fall this past week due to the first three sessions, but it appears ready to continue climbing in the coming week amid rising volatility.
Due to this, it is important to have an idea as to how strong QQQ’s nearby support levels are in the event that they are retested soon.
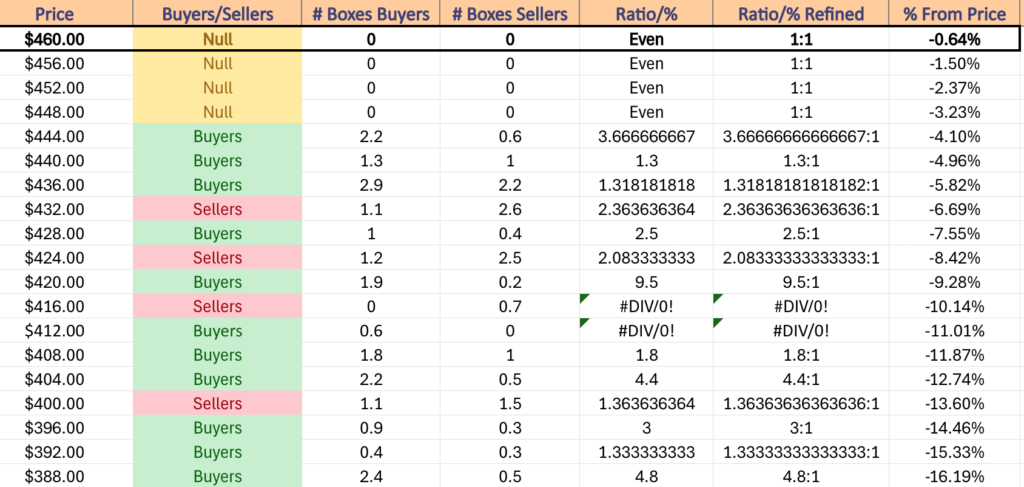
QQQ has support at the $460.58 (Volume Sentiment: NULL, 0:0*), $457.37 (10 Day Moving Average, Volume Sentiment: NULL, 0:0*), $449.34 (Volume Sentiment: NULL, 0:0*) & $443.05/share (Volume Sentiment: Buyers, 1.3:1) price levels, with resistance at the $465.74/share (All-Time High, Volume Sentiment: NULL, 0:0*) price level.
QQQ ETF’s Price Level:Volume Sentiment Over The Past 1-2 Years
IWM, the iShares Russell 2000 ETF fared the worst of the major index ETF this week, declining -2.22% as small cap stocks continued their consolidation that began in May.
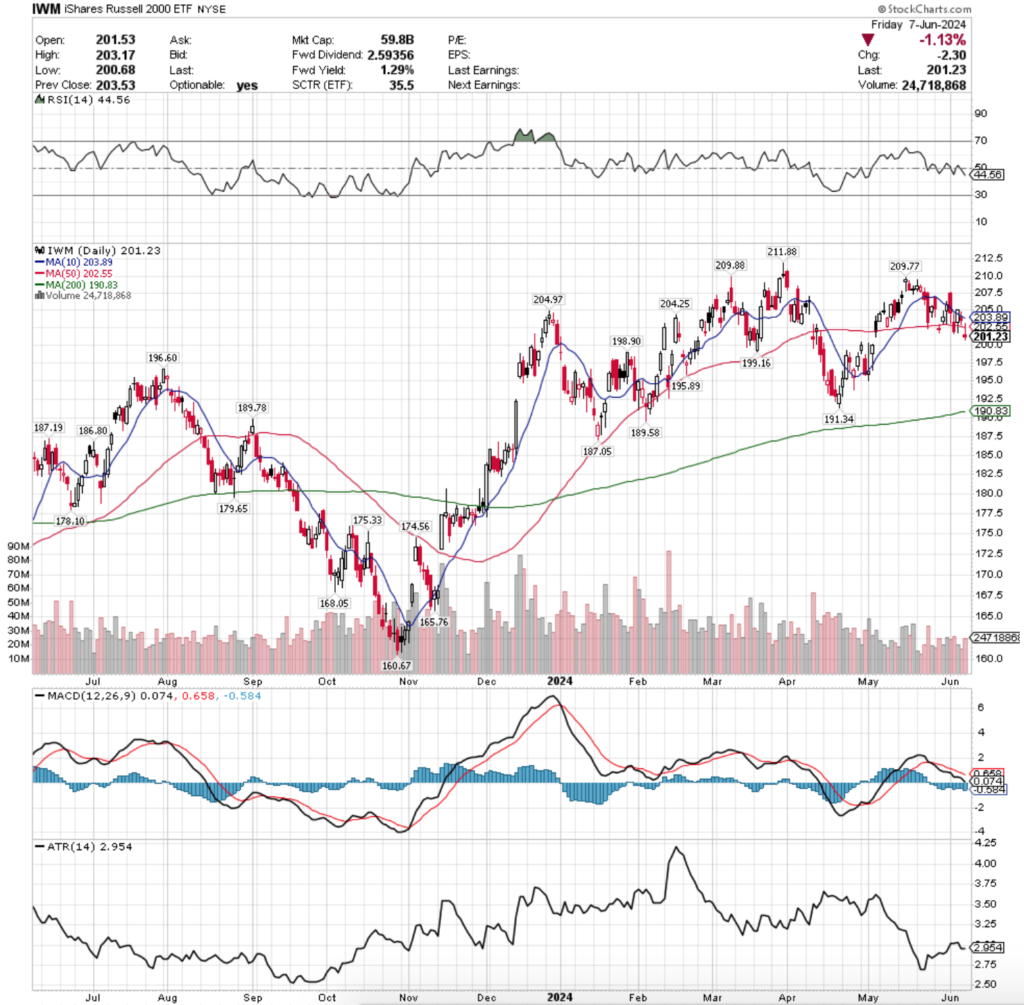
IWM ETF – iShares Russell 2000 ETF’s Technical Performance Over The Past Year
Their RSI is trending below the neutral level of 50 & currently sits at 44.56, while their MACD is still bearish following the crossover that occurred in mid-May.
Volumes were -33.08% below average compared to the prior year (22,737,264 vs. 33,975,688), as market participants await this week’s data announcements before making any further decisions on where to place money.
AS previously mentioned, IWM & DIA have broken off from the performance of SPY & QQQ recently due to the former not having NVDA as components.
This has led to the consolidation range that we have been seeing since May.
This should be concerning for the other indexes as it highlights that there is a lot of conflicting sentiment in the market right now.
Monday began on a gap higher than ultimately went below the 10 day moving average’s support to test the 50 DMA, which was able to hold up.
The price settled back up near the 10 DMA, but the session resulted in declines on modest volume.
Tuesday the bears were out in full force, as the week’s highest volume came from a session that opened on a gap down, failed to break the resistance of the 10 DMA on a test run & then crashed through the support of the 50 DMA & closed the day below it.
Wednesday was able to close above the 10 DMA barely, but the downside movement that IWM took during the day & the low volume despite wide trading range expose some cracks in the strength of IWM.
Thursday confirmed this with a bearish harami pattern emerging & a close to below the 10 DMA, which led to Friday’s gap down session that was unable to stay above the 50 day moving average’s support.
The theme of uncertainty was also revealed in Friday’s session as the candle ended the day as a spinning top on the lower range of the day’s prices & the gap up from early may began to be filled.
IWM’s Average True Range plateaued, but looks set to continue climbing with an increase in volatility this upcoming week.
Due to the relatively tight range that IWM has traded in since December of 2023 there are many local support levels in relation to its current price which will be beneficial for it in the event that we see SPY & QQQ begin to correct.
In the event that the $195.89 support level is broken the $191.34 & the 200 day moving average of $190.83/share will be key areas to focus on, as otherwise IWM looks set to establish a new range in the $180’s.
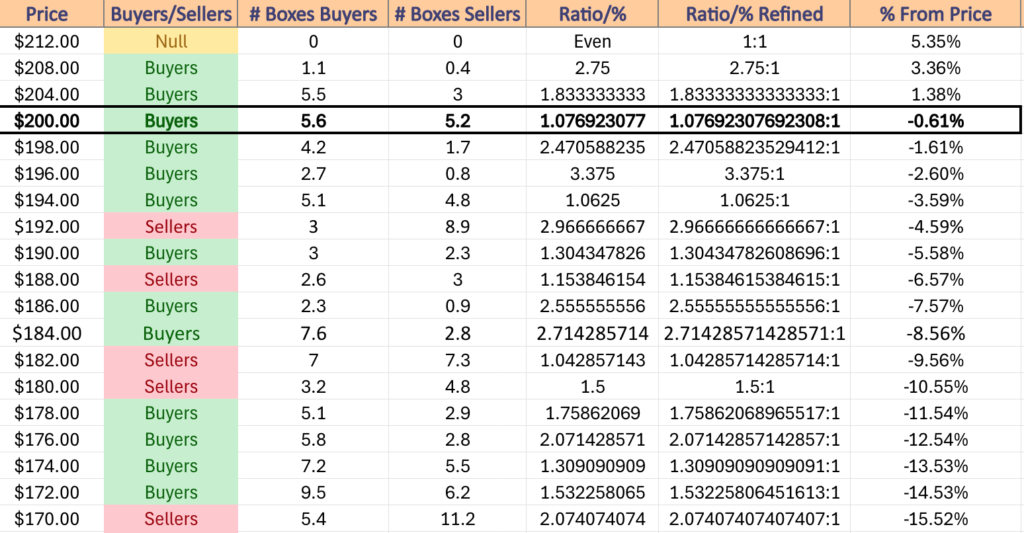
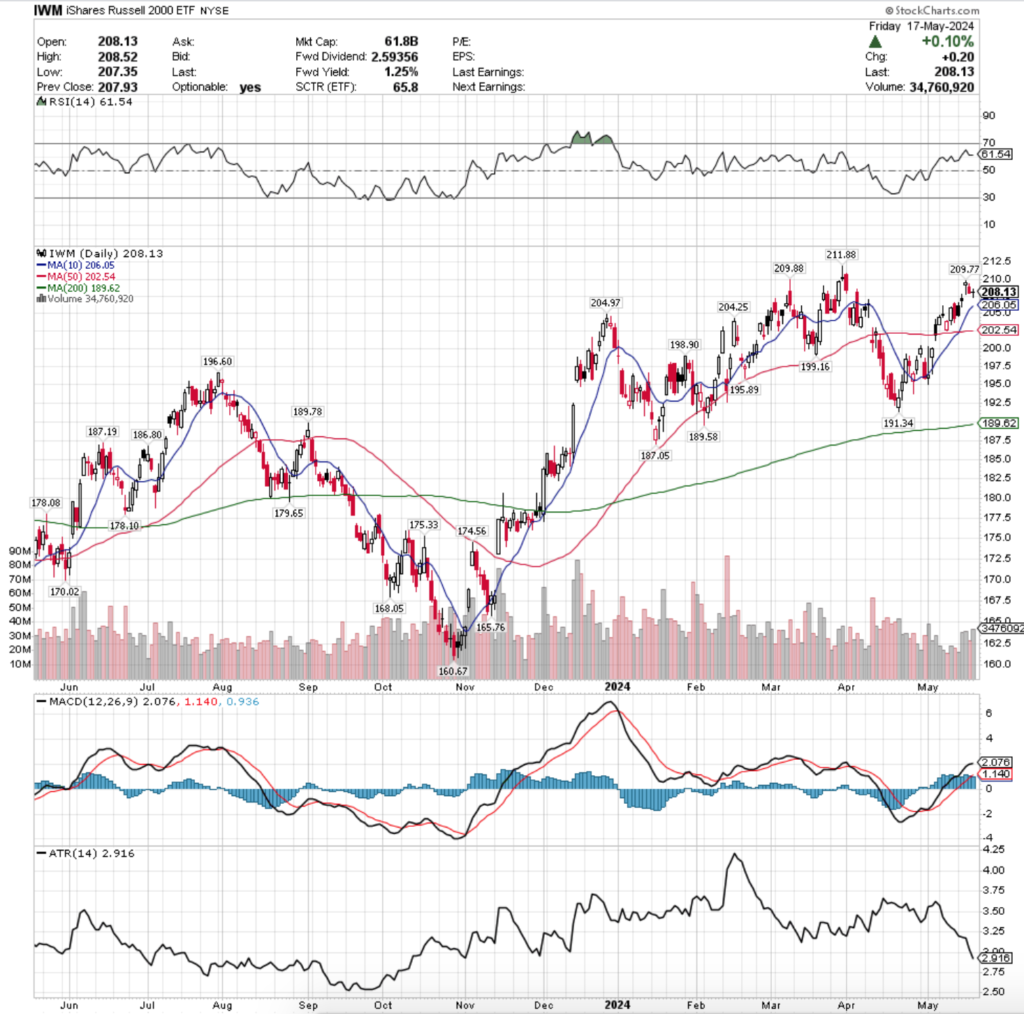
IWM has support at the $199.16 (Volume Sentiment: Buyers, 2.47:1), $198.90 (Volume Sentiment: Buyers, 2.47:1), $196.60 (Volume Sentiment: Buyers, 3.38:1) & $195.89/share (Volume Sentiment: Buyers, 1.06:1) price levels, with resistance at the $202.55 (50 Day Moving Average, Volume Sentiment: Buyers, 1.08:1), $203.89 (10 Day Moving Average, Volume Sentiment: Buyers, 1.08:1), $204.25 (Volume Sentiment: Buyers, 1.83:1) & $204.97/share (Volume Sentiment: Buyers, 1.83:1) price level.
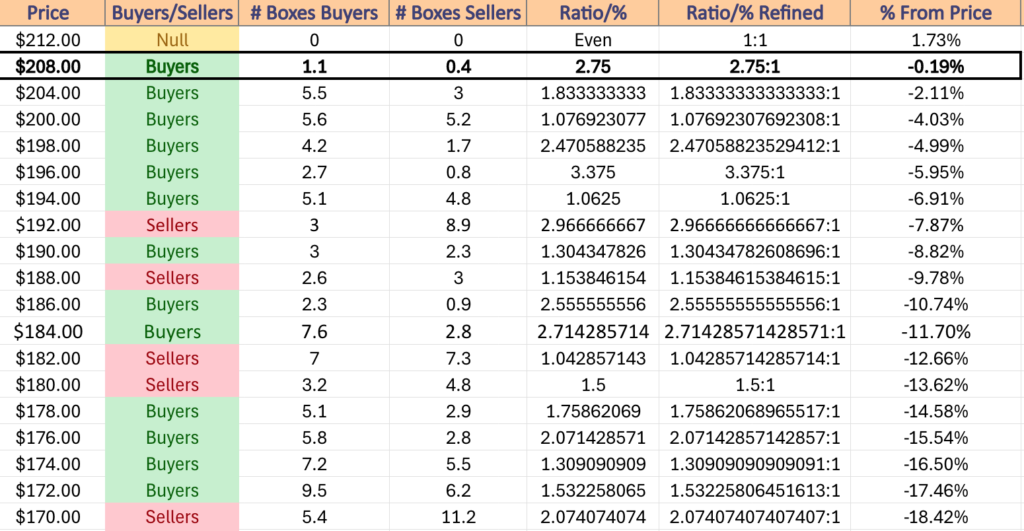
IWM ETF’s Price Level:Volume Sentiment Over The Past 1-2 Years
DIA, the SPDR Dow Jones Industrial Average ETF tread water for the week, adding only +0.25% as investors sit unsure of what the next move should be while awaiting this week’s data announcements.
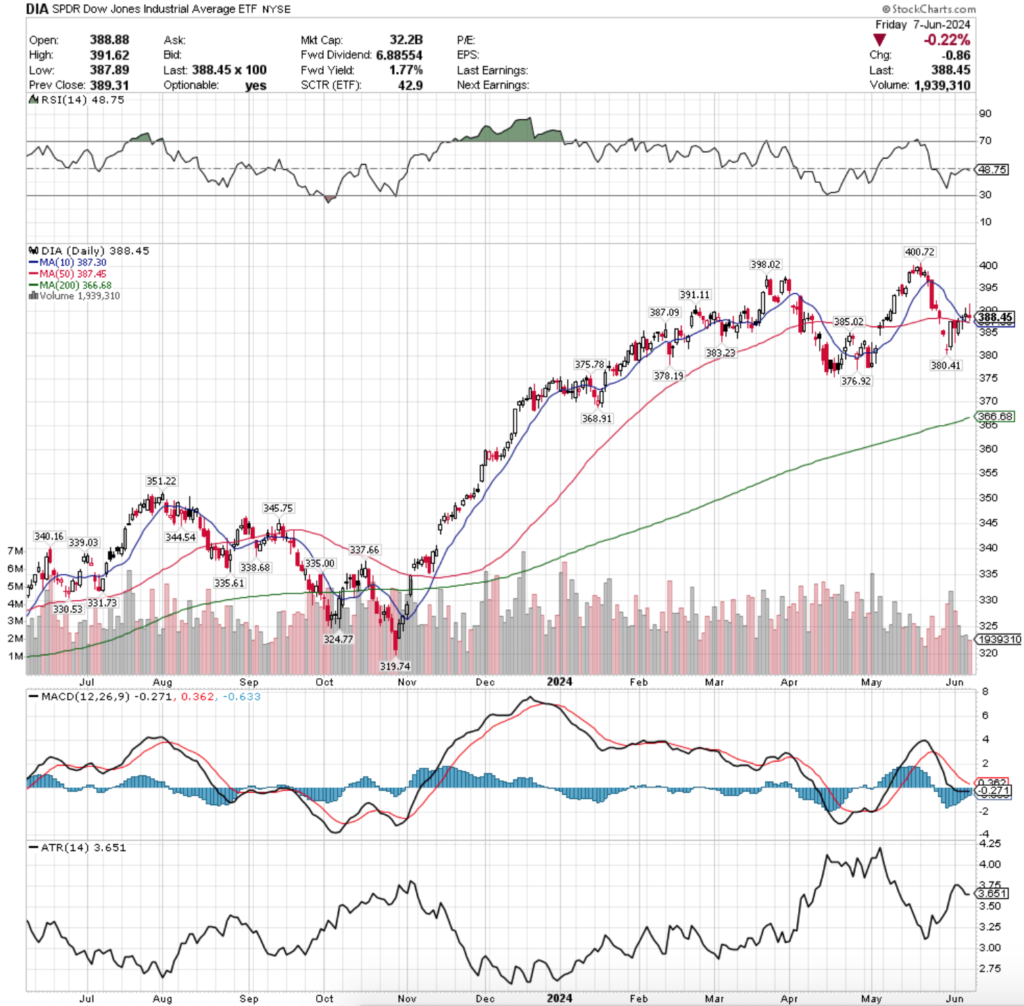
DIA ETF – SPDR Dow Jones Industrial Average ETF’s Technical Performance Over The Past Year
Their RSI is flat just below the neutral level & sits at 48.75, while their MACD is bearish currently, but has also flattened over the past week which will be something to keep an eye on moving into this week.
Volumes were -27.3% below average last week compared to the previous year (2,559,354 vs. 3,520,545) confirming that there is a great deal of indecision in the market, but it should be noted that last week’s highest volume session by a long-shot was Monday’s declining day.
Prices opened just above Friday’s close that day, were unable to break the 50 day moving average & instead tested lower, almost all the way to the Friday’s close before settling in what appears like a giant hanging man candle.
Tuesday was a bit more optimistic, DIA opened on a gap lower but was able to rally & temporarily cross through the 50 DMA’s resistance before closing just below it for an advancing session.
Things got interesting for DIA on Wednesday, when the day opened above both the 10 & 50 day moving averages, tested below both & wound up closing in a dragonfly doji just above them both.
While dragonfly dojis are typically indicative of a potential bullish reversal, the low volume levels & depth to the downside that the session tested are not a cause for optimism which the rest of the week echoed.
Thursday was another muted volume session that resulted in a spinning top on a high wave candle, indicating that there was no general consensus of where DIA was to be valued for the day.
The 10 & 50 DMAs were both support in relation to the day’s price range, but the open & close (real body portion of the candle) are concentrated closer to the lower end of the candle, indicating that there is more bearishness at these price levels than bullishness.
Friday confirmed this as well, as another weak volume session resulted in a spinning top (narrow body though, but too wide to be a doji) was able to test above Thursday’s high, but ultimately also tested near the low of Thursday as well before settling down lower for the day & “the range of indecision”.
While the close was above the support of the 10 & 50 day moving averages, the low volumes make it extremely difficult to see a bullish case in this situation.
In the event that there is one, there is a double top/emerging head & shoulders pattern with marks at the $398.02 (left) & $400.72/share price levels, which to see broken would require some serious market moving news, such as an FOMC rate cut.
DIA’s Average True Range has plateaued in recent days as there has not been much volatility, but that should perk up as this week progresses & volatility rises.
It will be impossible to not watch the 10 & 50 day moving averages this week, given that they’re just below DIA’s price & are sitting atop one another.
Due to this, in the event of a downside breakout all eyes should be on how resilient the $375.78-$378.19 support zone is, as if it crumbles the 200 day moving average is the only line of defense ($366.68) paired with the $368.91/share support level before the rapid advances of November & December 2023’s price range gets encroached, where there is no support for -4.22%.
Any upside moves right now should be viewed with caution, unless they’re accompanied by high volumes.
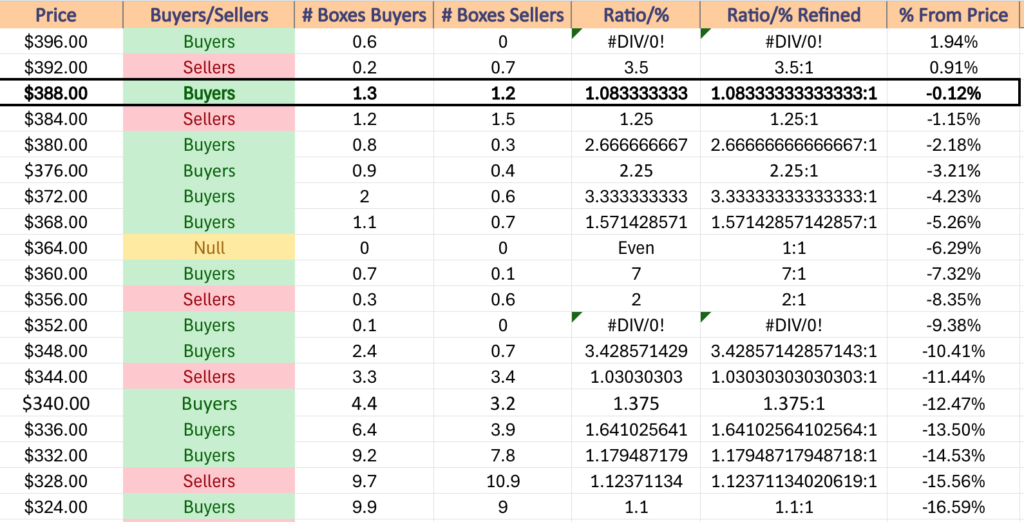
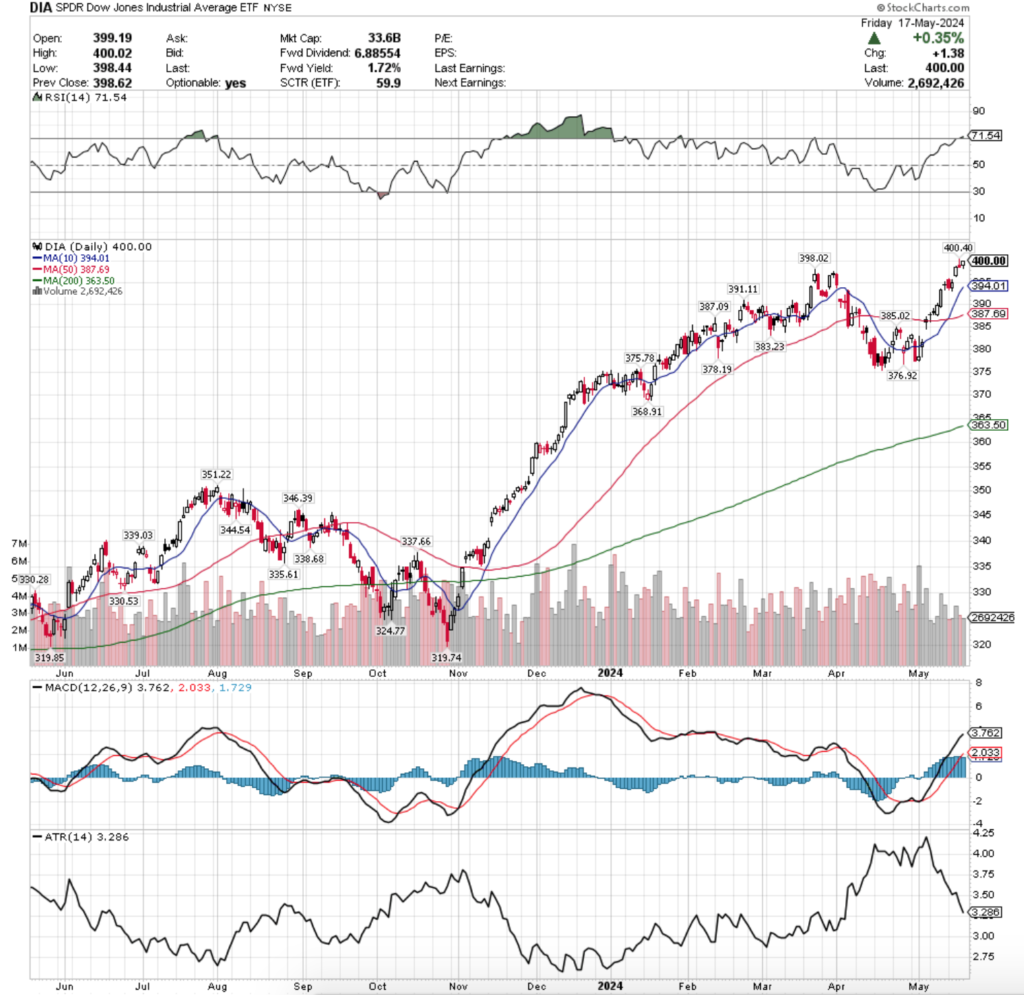
DIA has support at the $387.45 (50 Day Moving Average, Volume Sentiment: Sellers, 1.25:1), $387.30 (10 Day Moving Average, Volume Sentiment: Sellers, 1.25:1), $387.09 (Volume Sentiment: Sellers, 1.25:1) & $385.02/share (Volume Sentiment: Sellers, 1.25:1) price levels, with resistance at the $391.11 (Volume Sentiment: Buyers, 1.08:1), $398.02 (Volume Sentiment: Buyers, 0.6:0*) & $400.72/share (All-Time High, Volume Sentiment: NULL, 0:0*) price level.
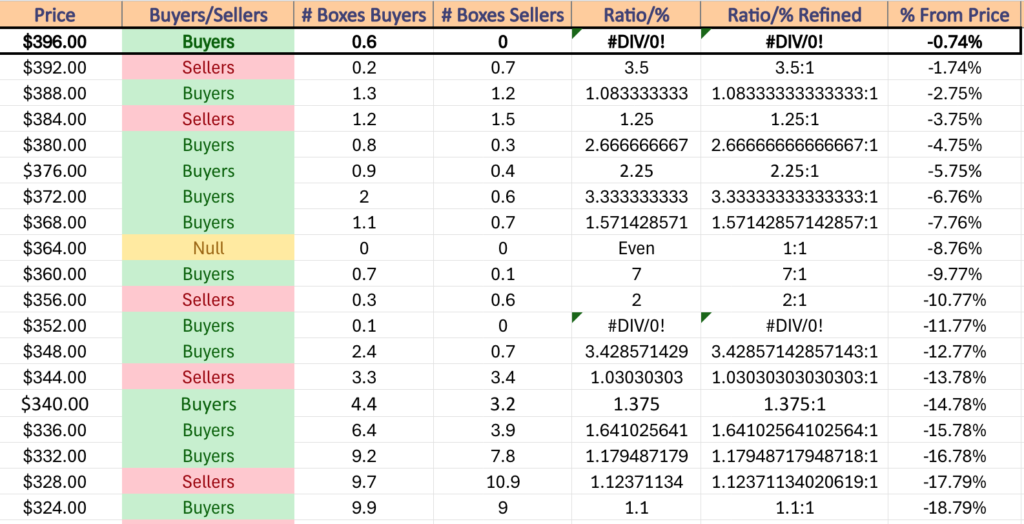
DIA ETF’S Price Level:Volume Sentiment Over The Past 3-4 Years
The Week Ahead
The week begins on Monday on a quiet note with no economic data announcements scheduled.
Monday’s earnings reports feature FuelCell Energy & Lovesac before the opening bell, with Calavo Growers & Yext reporting after the session’s close.
Tuesday begins at 6 am with the NFIB Optimism Index data.
Academy Sports + Outdoors reports earnings results Tuesday morning before the bell, followed by Oracle & Casey’s General Stores after the closing bell.
Much anticipated Consumer Price Index, CPI Year-over-Year, Core CPI & Core CPI Year-over-Year data is released at 8:30 am on Wednesday, followed by the FOMC Interest-Rate Decision, Monthly U.S. Federal Budget data & Fed Chair Jerome Powell Press Conference all at 2pm.
Wednesday afternoon features earnings reports from Broadcom, Dave & Buster’s Entertainment, Oxford Industries & Torrid after the session’s closing bell.
Thursday features Initial Jobless Claims, Producer Price Index, Producer Price Index Year-over-Year, Core PPI & Core PPI Year-over-Year data all at 8:30 am.
Korn Ferry, Signet Jewlers, Veradigm & Wiley are all due to report earnings results on Thursday morning before the opening bell, with Adobe scheduled to report after the close.
The week winds down with Import Price Index & Import Price Index minus Fuel data at 8:30 am, followed by Consumer Sentiment (prelim) data at 10 am & there are no noteworthy earnings reports due.
See you back here next week!
*** I DO NOT OWN SHARES OR OPTIONS CONTRACT POSITIONS IN SPY, QQQ, IWM OR DIA AT THE TIME OF PUBLISHING THIS ARTICLE***
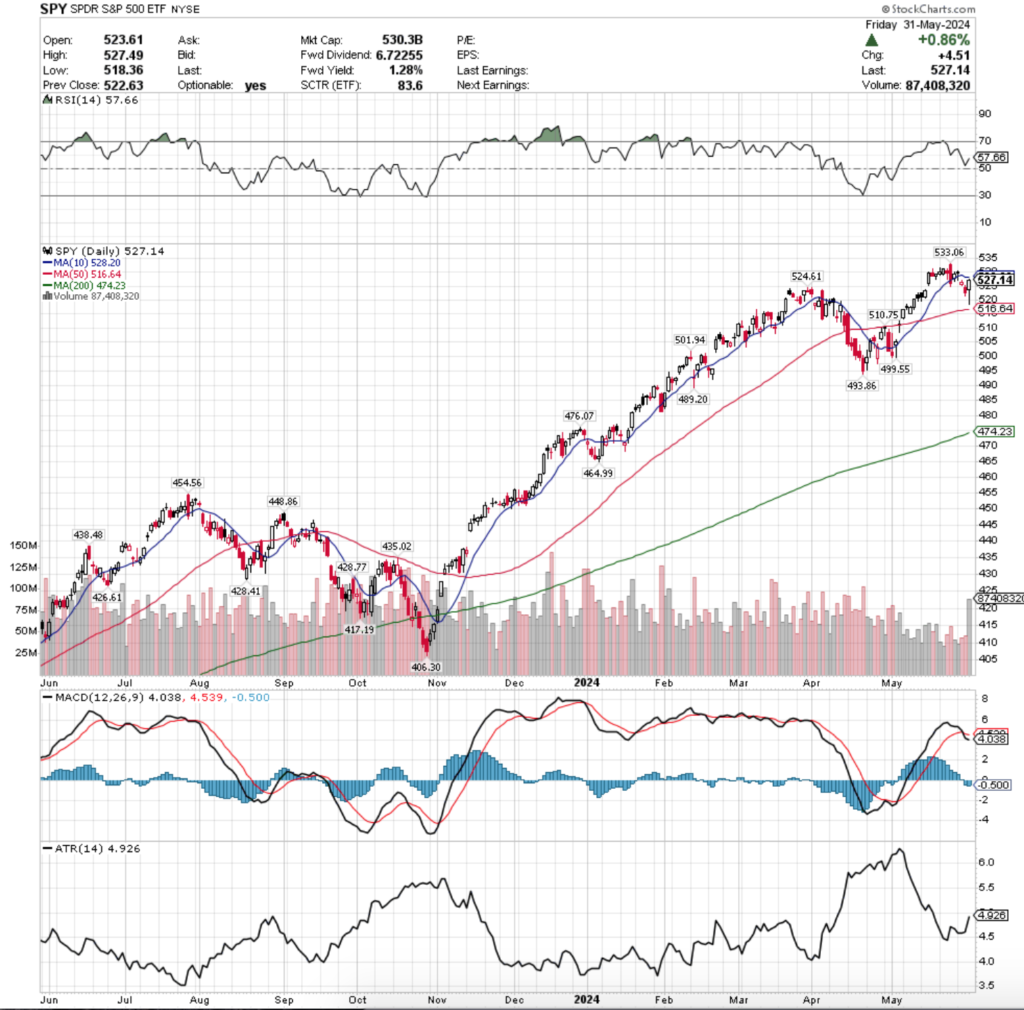
SPY, the SPDR S&P 500 ETF lost -0.39% last week, as the ghost-town volumes continued for another week, while the VIX closed out the short week at 12.92, implying a one day move of +/-0.81% & a one month move of +/-2.36%.
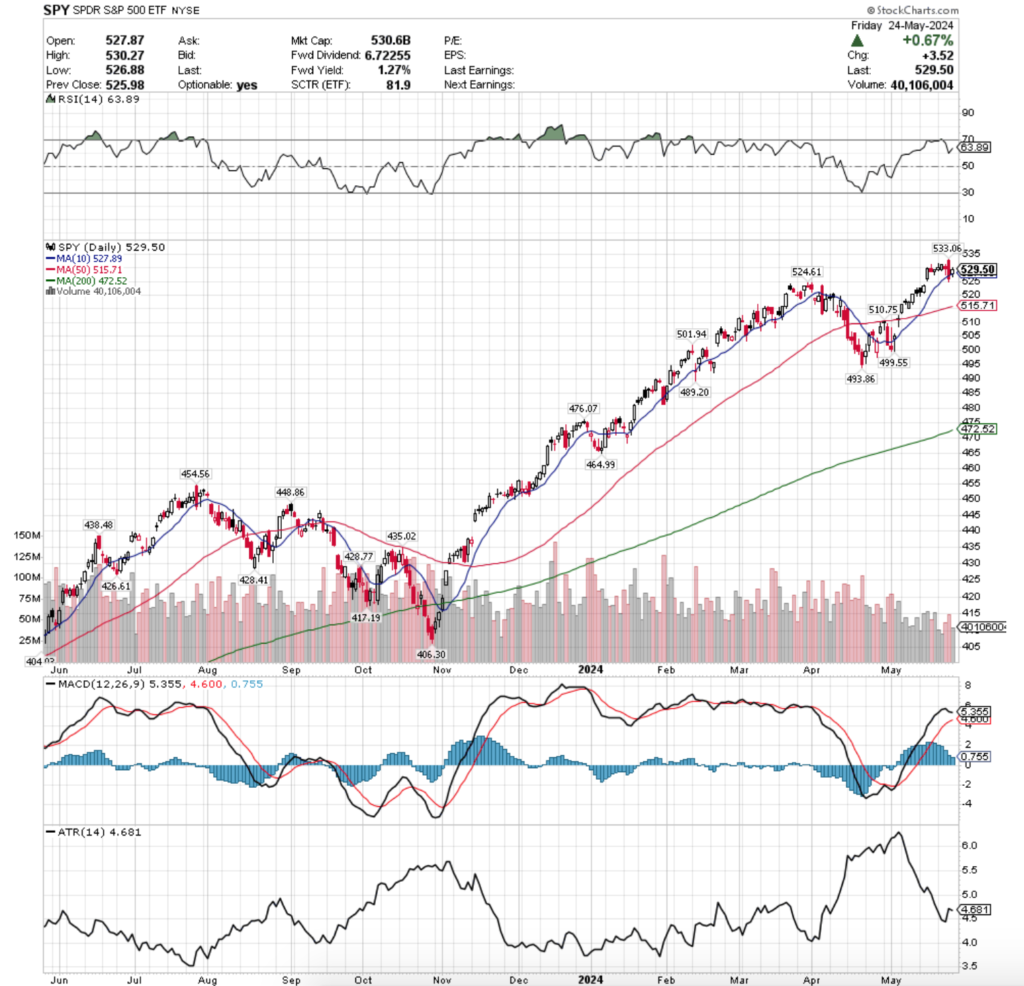
SPY ETF – SPDR S&P 500 ETF’s Technical Performance Over The Past Year
Their RSI was trending back towards neutral until Friday’s session boosted it back in the direction of overbought & currently sits at 57.55, while their MACD is bearish after crossing over on Thursday.
Volumes were yet again underwhelming for a fourth consecutive week, as SPY’s weekly volume was -27.34% below average compared to the year prior (54,558,375 vs. 75,091,843).
While it was a short trading week, these numbers are still very low, especially given how Friday’s volume eclipsed all of the volumes seen in the past month/month & a half.
Monday was Memorial Day in the United States & so the market wasn’t open, leaving the honors of opening the trading week to Tuesday.
Tuesday barely managed to stay positive, closing in a dragonfly doji on the weakest volumes of the week.
Given that last Thursday’s bearish engulfing candle had a very wide range & Tuesday’s candle remained inside of it, it was not exactly the vote of confidence market participants were hoping for.
Another area of concern included that the support of the 10 day moving average was temporarily broken on Tuesday, despite SPY rallying back to close above the 10 DMA.
The closing price was lower than the open though, which is another cause for concern, especially on such light volumes.
While Friday of last week did set a bullish harami two day pattern, it was proven to be weak as Wednesday saw a gap down session on stronger volume than Monday’s, but still severely lackluster levels compared to the rest of the previous year.
One glimmering area of hope for SPY on Wednesday came in the form of despite the gap down day, the close was slightly higher than the opening price level.
This was quickly erased on Thursday, when another gap down open occurred & pushed prices even further below the resistance of the 10 DMA.
Volumes were still subdued on Thursday, but slightly higher than the prior two days, which brings us to Friday’s interesting price action.
Firstly, as noted previously, Friday had the highest volumes of all sessions for almost the past month & a half for SPY.
The candle that the day resulted in is an interesting one though, as it came out in the form of a hanging man (bearish) with a very long lower shadow.
Prices opened just below the open of Thursday & proceeded to test well below all of Thursday’s range & broke below the $520/share range temporarily, as seen by the lower shadow.
Although the session proved to be an advancing day & a run at the 10 day moving average’s resistance was made, it was unable to reach, indicating that there is still quite a bit of downside sentiment.
As last week’s note pointed out for IWM & DIA, SPY has now entered into a range in the little bubble between the 50 Day Moving Average’s support & 10 Day Moving Average’s resistance.
This tends to be indicative of further near-term declines on the horizon & will be something to keep an eye on in the coming week.
SPY’s Average True Range perked up as last week’s note anticipated, and we expect it to continue into the near-term as volatility looks ready to increase further.
It would also be prudent to keep a keen eye on volume sentiments as the 50 day moving average begins to be tested, as an uptick in volumes there will likely be a great indicator of where market participants are ready for SPY to go.
In the event that the 50 DMA is breached another key area of focus will be the $510.75/share mark, where sellers have historically outperformed buyers at a ratio of 2.31:1 over the past 1-2 years, as this gate is the last area keeping SPY from heading towards the gap that in the $505-510 range, as well as the one in the $500-502 range.
The $510.75/share support is also where the 50 DMA rejected price advances on a session that resulted in a hanging man candle at the end of April, which is not a particularly reassuring signal of strength.
Last Thursday’s candle remains the upside target if the 10 DMA resistance is broken, but there appears to be more pain to come in the coming week for SPY & an increased chance of declines.
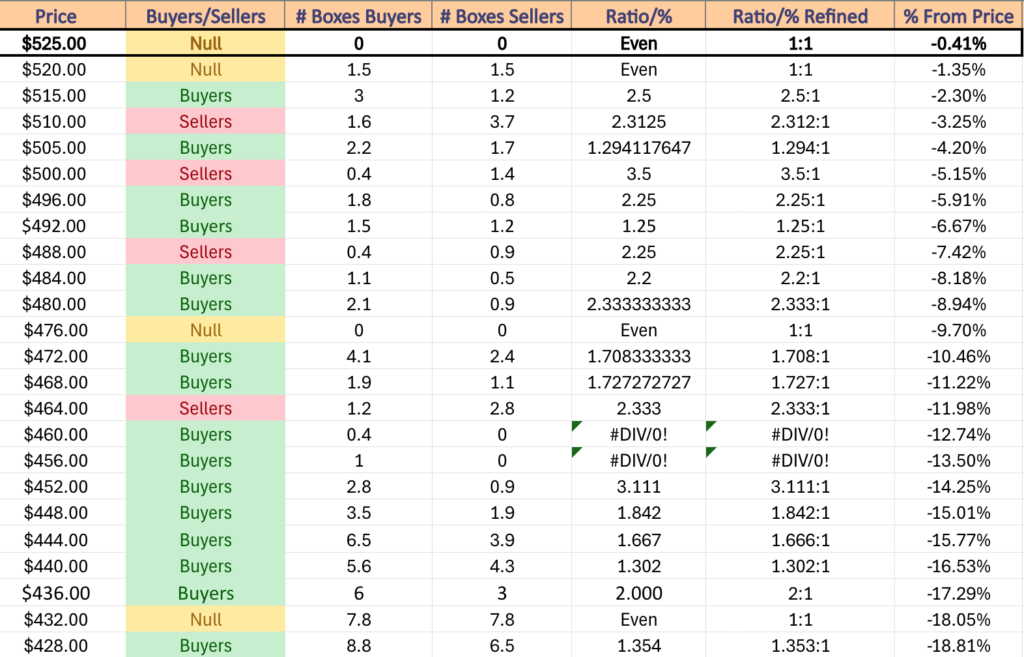
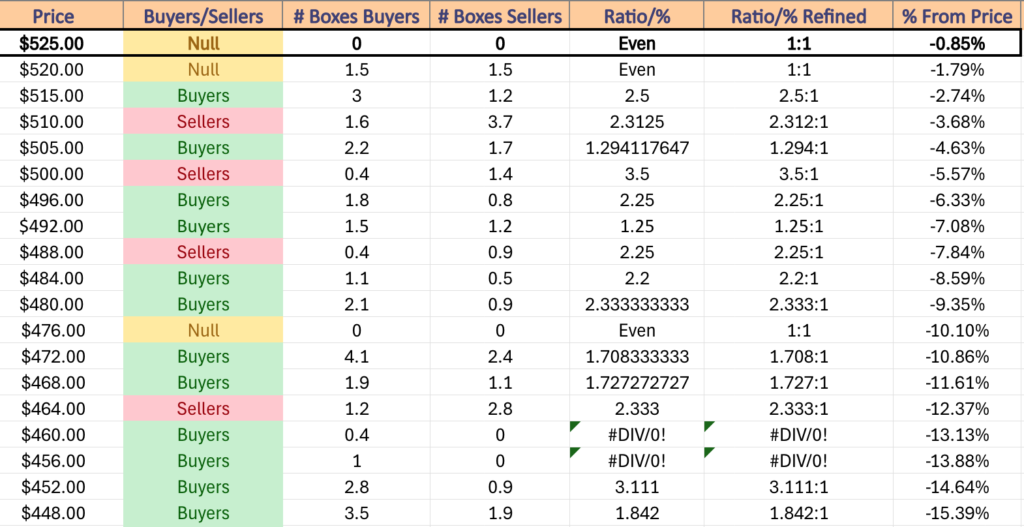
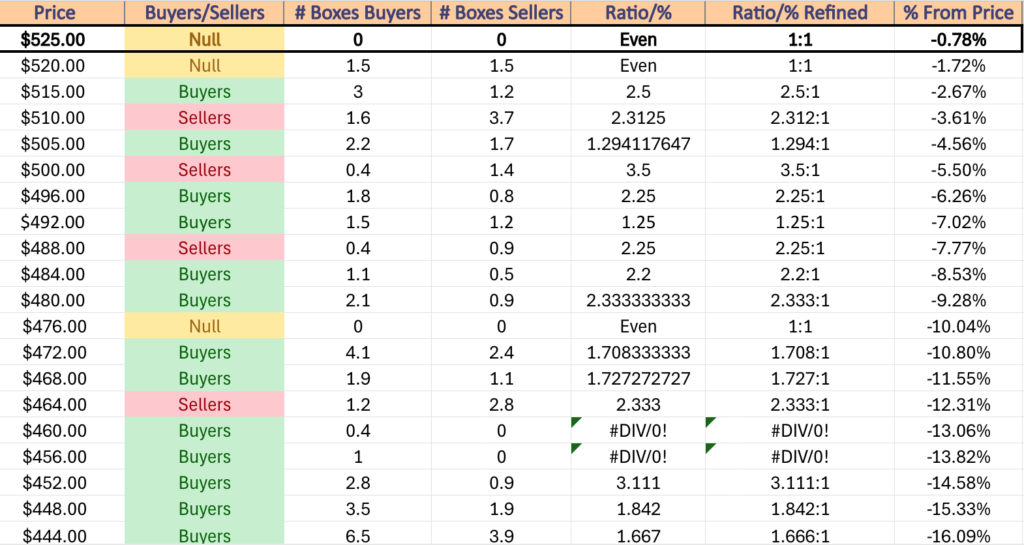
SPY has support at the $524.61 (Volume Sentiment: Even, 1:1), $516.64 (50 Day Moving Average, Volume Sentiment: Buyers, 2.5:1), $510.75 (Volume Sentiment: Sellers, 2.31:1) & $501.94/share (Volume Sentiment: Sellers, 3.5:1) price levels, with resistance at the $528.20 (10 Day Moving Average, Volume Sentiment: NULL, 0:0*) & $533.06/share (All-Time High, Volume Sentiment: NULL, 0:0*) price levels.
SPY ETF’s Price Level:Volume Sentiment Over The Past 1-2 Years
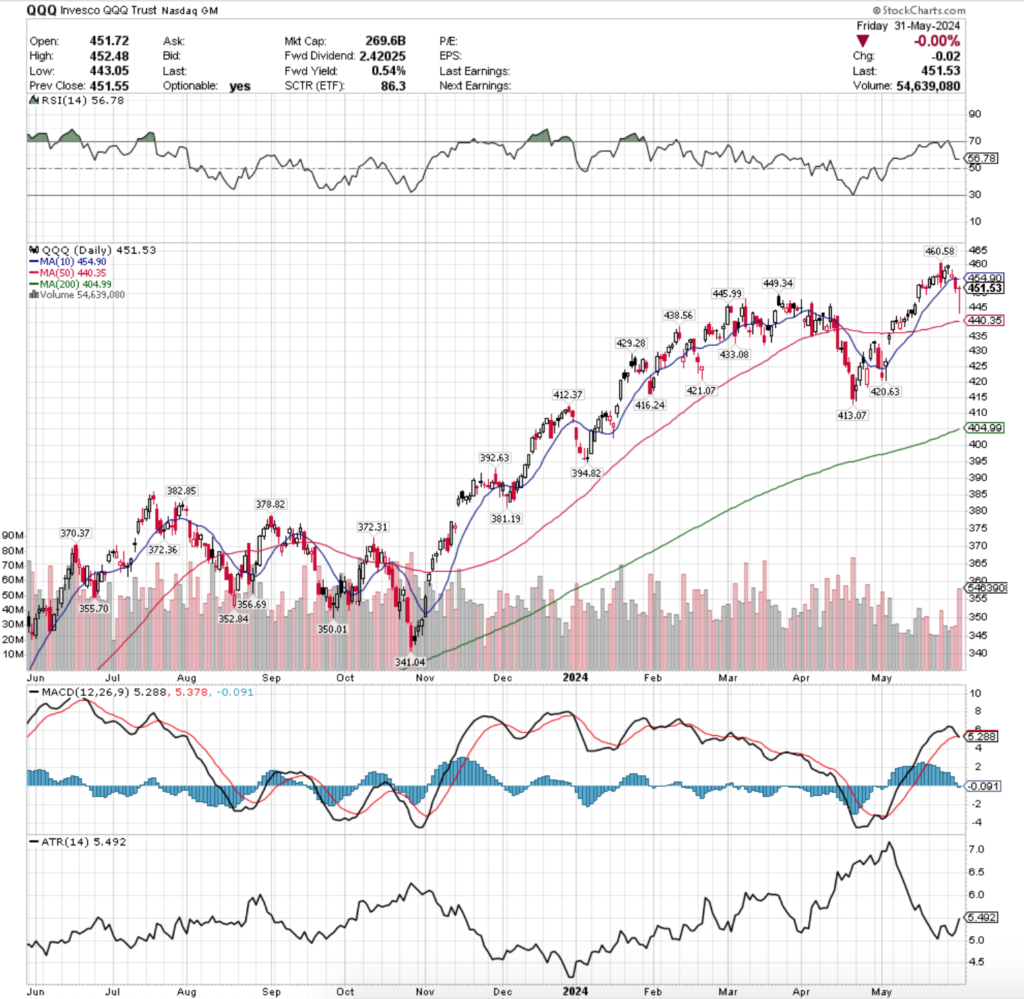
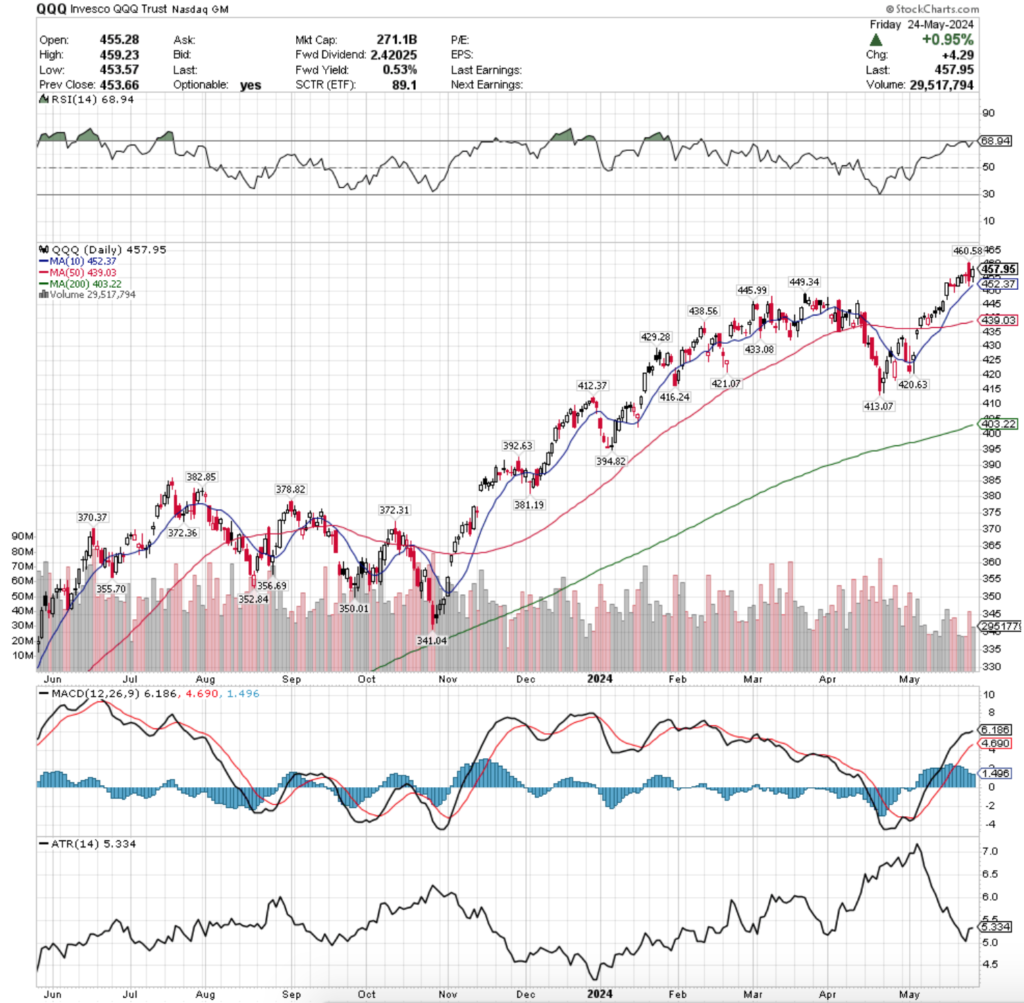
QQQ, the Invescco QQQ Trust ETF that tracks the performance of the NASDAQ 100, declined -1.58% in the short trading week, faring the worst of the major four indexes after being the leader of the prior week’s performance.
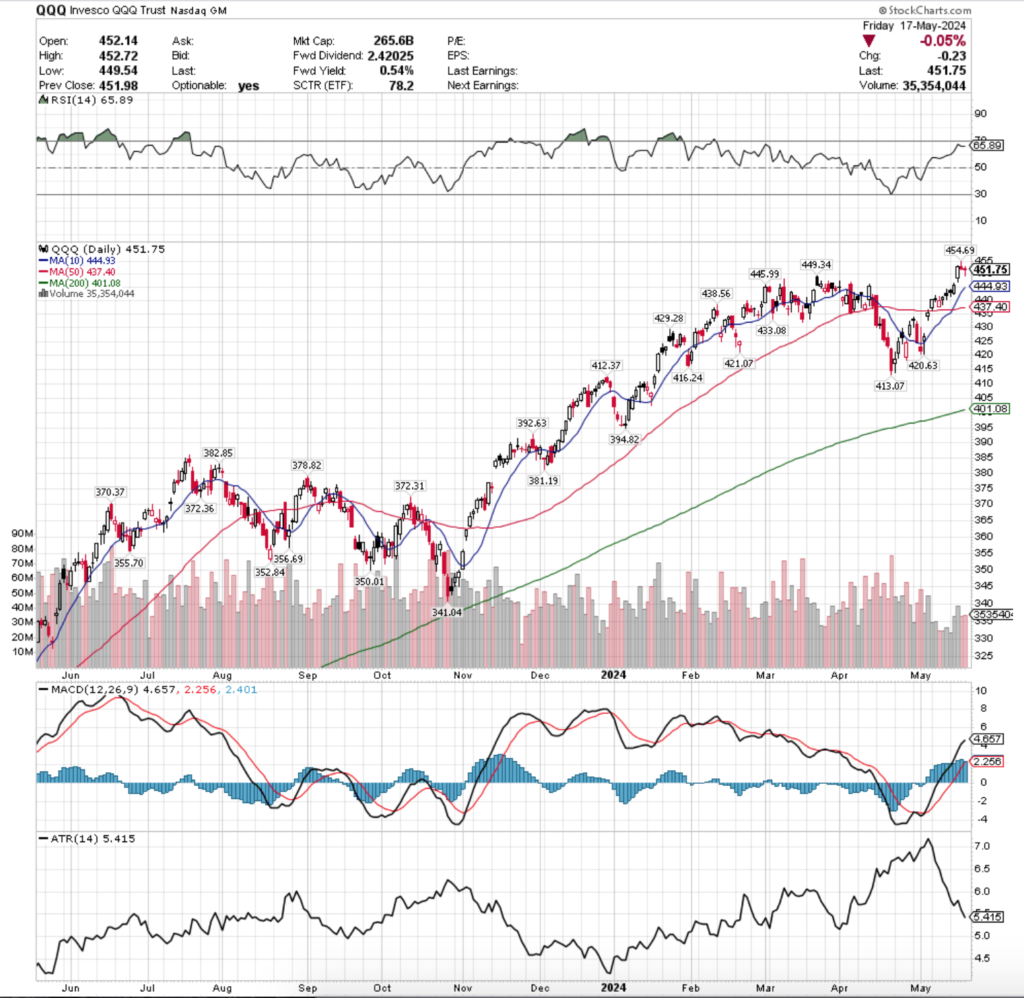
QQQ ETF – Invesco QQQ Trust ETF’s Technical Performance Over The Past Year
Their RSI is currently 56.78, while their MACD is bearish in the wake of the past few days of declining sessions.
Volumes were also very low for QQQ, finishing at -24.47% below average vs. the year prior’s average (35,643,100 vs. 47,192,452), which despite the four day trading week is still very low.
It is worth noting that Friday also had the highest volume of the week for QQQ, however it was on a “declining” session where QQQ dropped-0.00%, losing $0.02/share, which will make for an interesting sentiment attribute moving into next week.
Tuesday opened on an advancing note, however the day’s candle was a hanging man & set the stage for the rest of the week’s declines.
Tuesday managed to keep some hope for bulls alive as the strength of the 10 day moving average prevailed & propped prices up above it, where a declining open resulted in a test higher & an ultimate higher close than open for QQQ.
Tuesday had the weakest volume of the week, followed by Wednesday & Thursday.
Thursday is where we saw QQQ re-align to a degree with SPY, IWM & DIA, as last week’s note pointed out how there was a divergence in index performance between SPY & QQQ who have NVDA as a component & IWM & DIA who do not.
Thursday opened just above the 10 DMA, tested slightly higher based on the small upper shadow, but in the end broke to the downside, breaking the key support level to close ~1% below it.
This made for an interesting Friday, where the session opened near the low range of Thursday’s session’s candle body, tested down -1.92% to the low of the day, before closing two cents lower for the day at $451.53.
While the session resulted in a dragonfly doji which tends to signal a reversal is imminent, that’s not likely the case for QQQ this week.
Much like SPY above, QQQ is now in the area between the resistance of the 10 DMA that is moving downward applying pressure to price, while above the 50 DMA which is moving towards price as support.
QQQ is in luck though, as due to its more steady price progression there are more support levels locally in relation to its price compared to SPY, but these may not be as strong as holders think & could become problematic, particularly if there is a rug-pull profit taking move on NVDA & the other semiconductor stocks that are QQQ components that have been experiencing strength of recent.
Much like IWM & DIA last week & SPY above, now we wait to see if QQQ manages to maintain its position squeezed between the two moving averages & establishes a new consolidation range, or if the 50 DMA will give out & prices crash to the downside.
In the unlikely event that prices do ultimately pop up in the near-term, last Thursday’s high of $460.58/share is the target area to be keeping an eye on (all-time high).
It appears more likely to see a test of the downside though given the relationship to prices & the 10 & 50 DMAs, which is where attention should be placed this coming week.
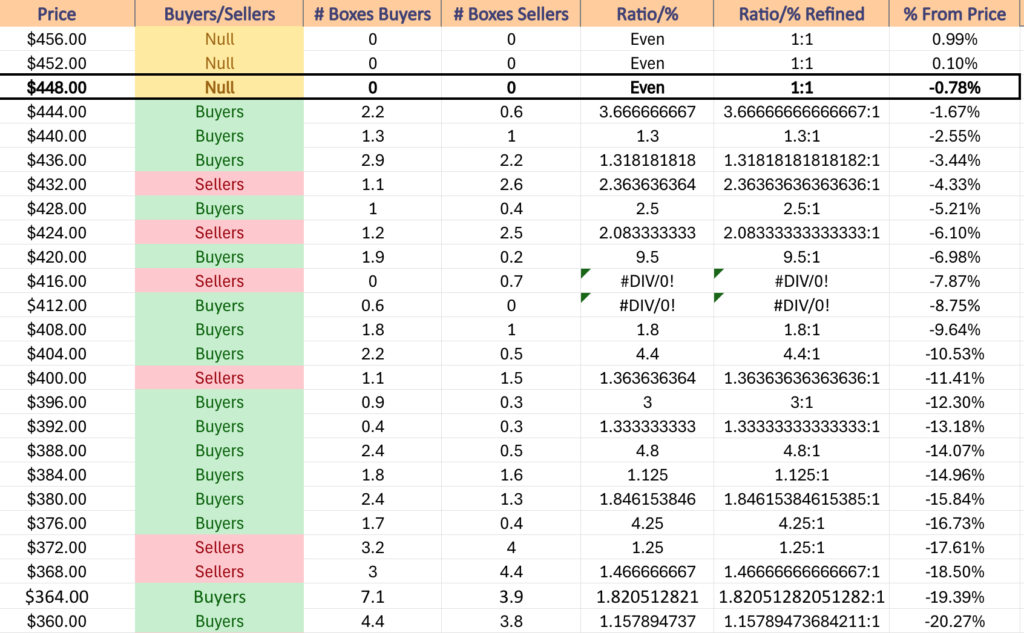
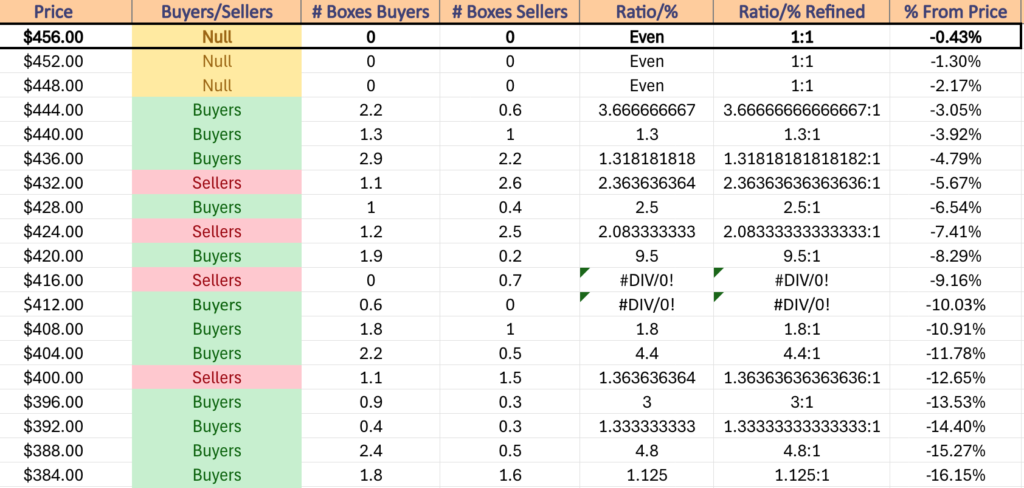
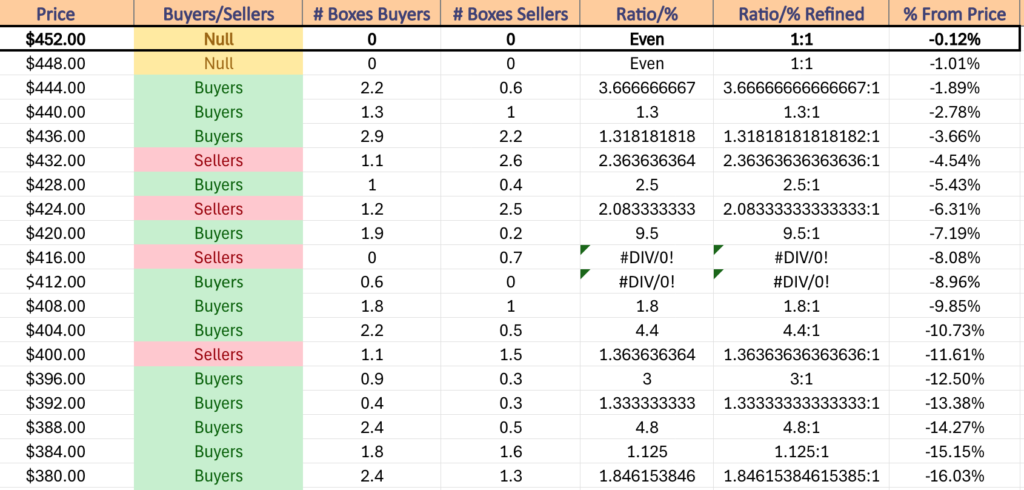
QQQ has support at the $449.34 (Volume Sentiment: NULL, 0:0*), $445.99 (Volume Sentiment: Buyers, 3.67:1), $440.35 (50 Day Moving Average, Volume Sentiment: Buyers, 1.3:1) & $438.56/share (Volume Sentiment: Buyers, 1.32:1) price levels, with resistance at the $454.90 (10 Day Moving Average, Volume Sentiment: NULL, 0:0*) & $460.58/share (All-Time High, Volume Sentiment: NULL, 0:0*) price levels.
QQQ ETF’s Price Level:Volume Sentiment Over The Past 1-2 Years
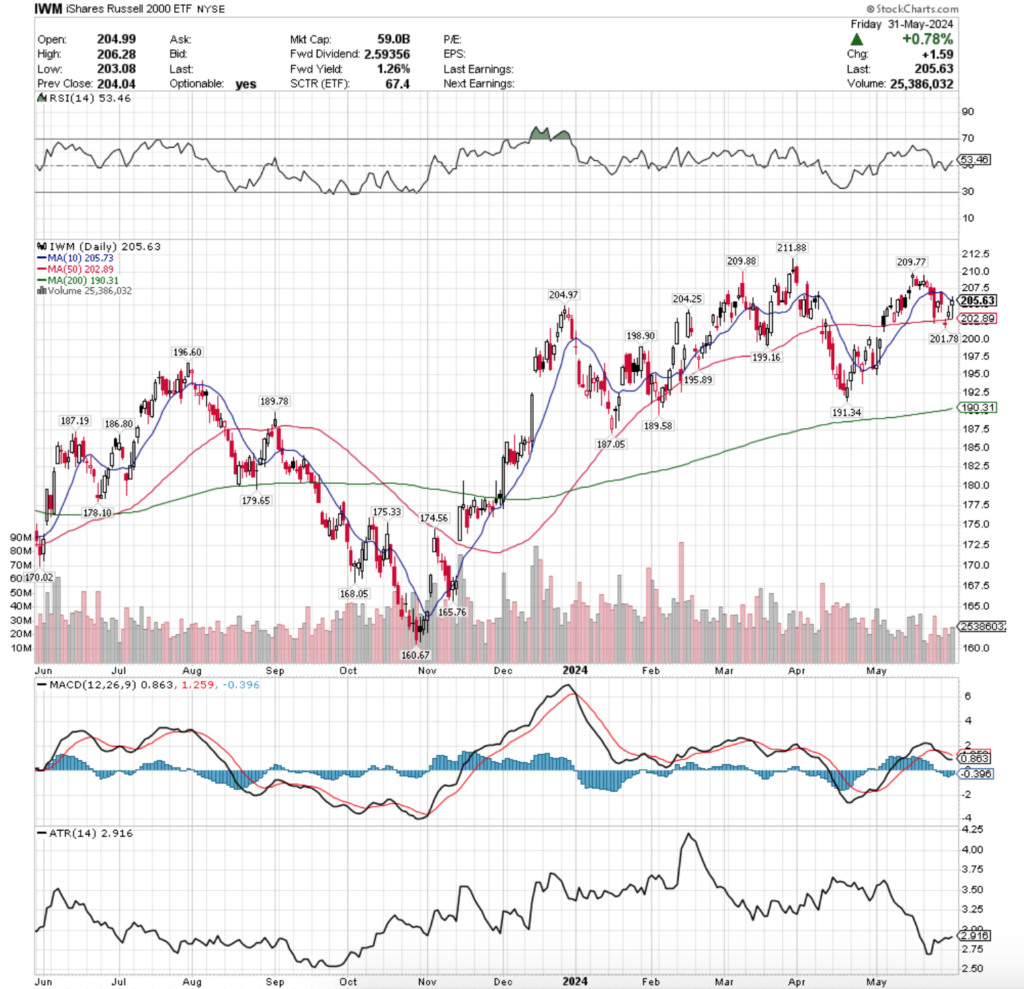
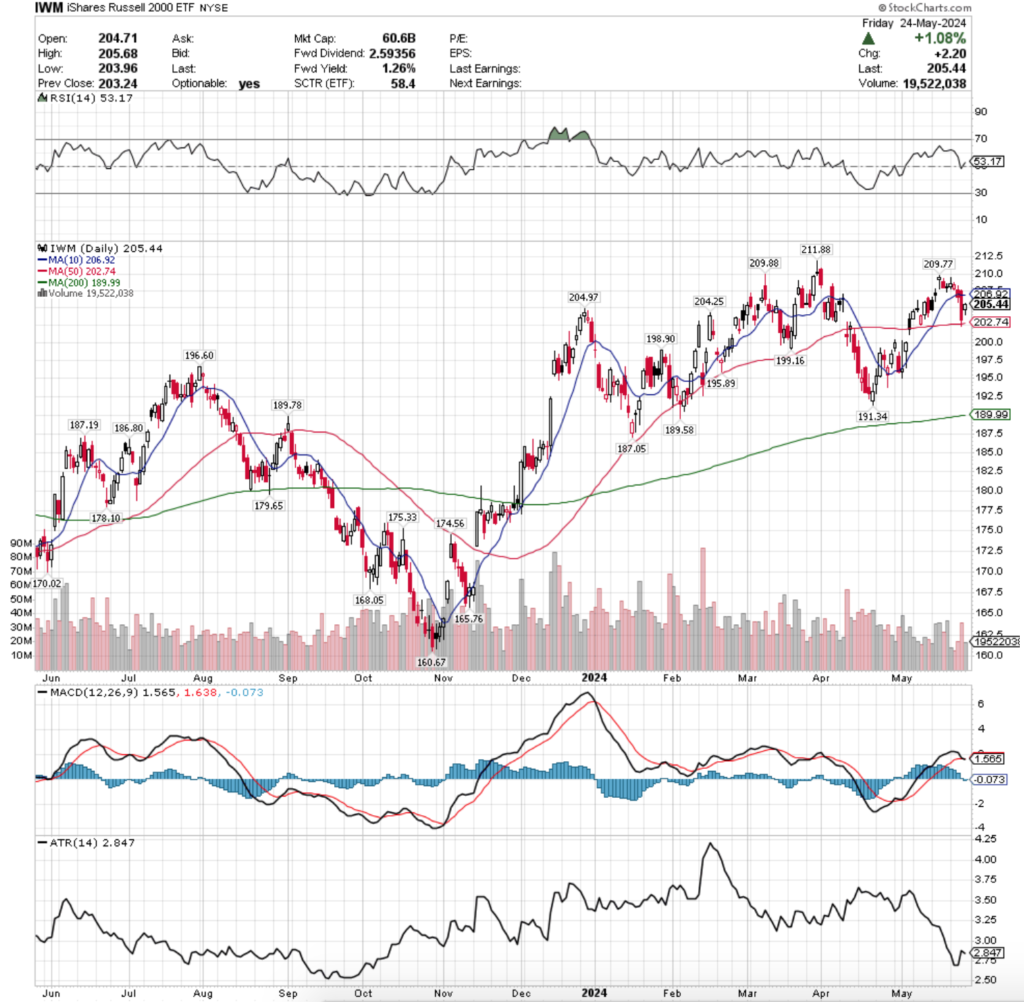
IWM ETF – iShares Russell 2000 ETF’s Technical Performance Over The Past Year
Their RSI is at 53.46 & trending back towards overbought after the gains of the past two sessions, while their MACD is bearish but the signal line could be broken bullishly in the event that the 10 day moving average’s resistance does not hold up.
Volumes were very low for IWM as well, coming in at -34.2% below average compared to the year prior (22,595,850 vs. 34,337,848), which even when the loss of Monday trading is factored in still signals a sluggish participation rate among investors.
IWM opened the week off Tuesday with gap up to the 10 day moving average in the footsteps of a bullish harami pattern formed the previous Friday.
However, the open was about the best part of the day, as it declined on the lowest volume of the week after that, testing near the prior day’s lows had been when looking at the candles’ lower shadows.
Things took an uglier turn on Wednesday, with a gap down session that barreled through the 50 day moving average’s support at the open & ended the day on an indecisive note with the session’s candle being a doji.
One thing that was certain was that market participants were overwhelmed by the resistance of the 50 day moving average, as the session remained below it all day & the volumes were at the second highest level of the week.
Thursday was a bit more optimistic, but still negative, as prices gapped back above the 50 DMA, tested its support to the downside & were able to rally higher, but the candle’s real body was concentrated in the lower half of the day’s range & volumes were lackluster compared with other sessions last week.
Friday was reckoning day, as the open gapped higher, tested lower covering the range between the 10 & 50 DMAs before heading back up to break the resistance of the 10 day moving average temporarily & closing 10 cents lower than the resistance level on the week’s highest volume.
IWM’s Average True Range has been increasing slowly over the past weeks & looks to continue to do so as more volatility appears to be on the horizon.
As we enter a new week all eyes will be on which direction prices get squeezed into as the 10 & 50 day moving averages begin to constrict the consolidation range that IWM has established over the past few weeks.
If prices can’t settle for a session above the 10 DMA, it appears the near-term following movements will be to the downside.
Fortunately, due to its more rangebound trading nature IWM has many support touch-points nearby in the event of the decline, and it will be interesting to see which ones hold up as the strongest.
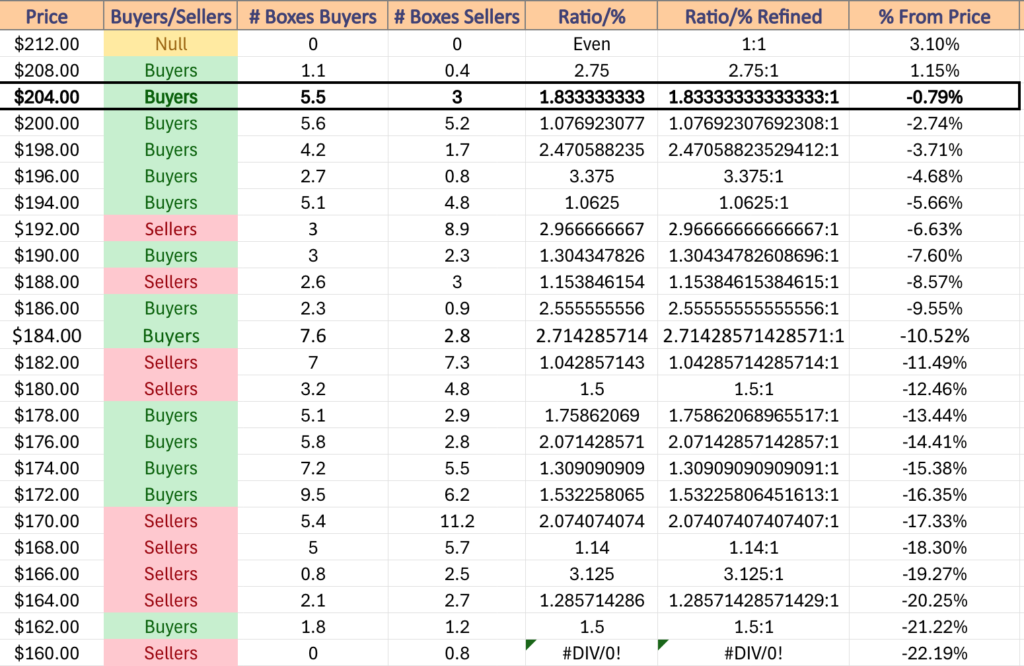
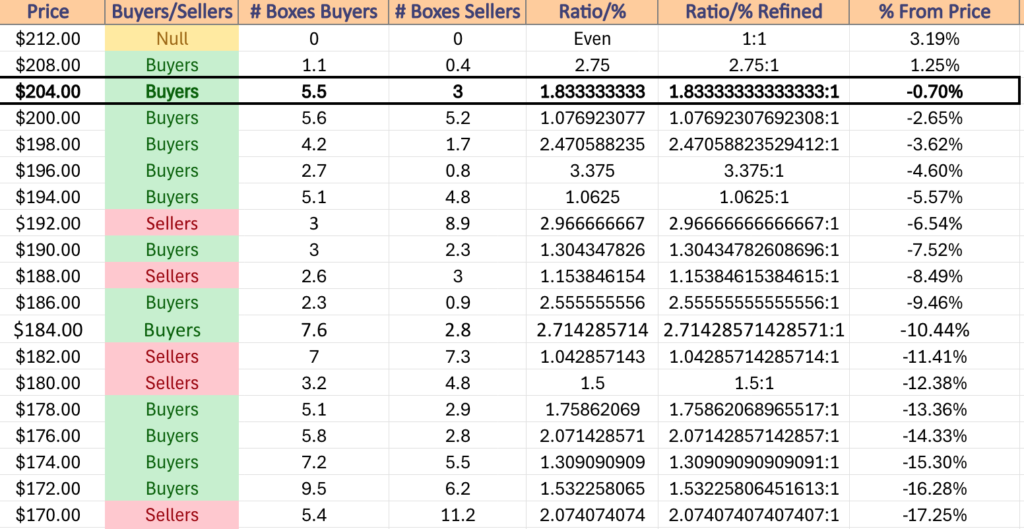
IWM has support at the $204.97 (Volume Sentiment: Buyers, 1.83:1), $204.25 (Volume Sentiment: Buyers, 1.83:1), $202.89 (50 Day Moving Average, Volume Sentiment: Buyers, 1.08:1) & $201.78/share (Volume Sentiment: Buyers, 1.08:1) price levels, with resistance at the $205.73 (10 Day Moving Average, Volume Sentiment: Buyers, 1.83:1), $209.77 (Volume Sentiment: Buyers, 2.75:1), $209.88 (Volume Sentiment: Buyers, 2.75:1) & $211.88/share (52-Week High, Volume Sentiment: Buyers, 2.75:1) price levels.
IWM ETF’s Price Level:Volume Sentiment Over The Past 1-2 Years
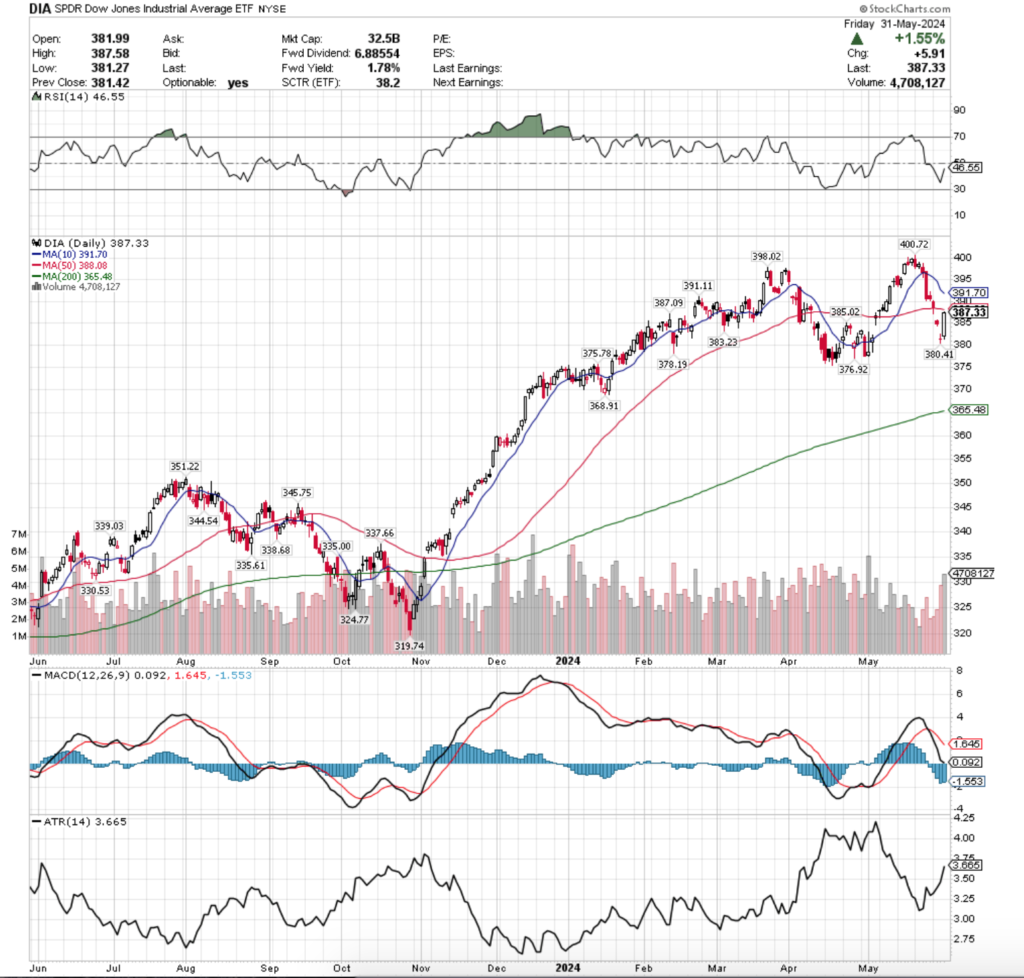
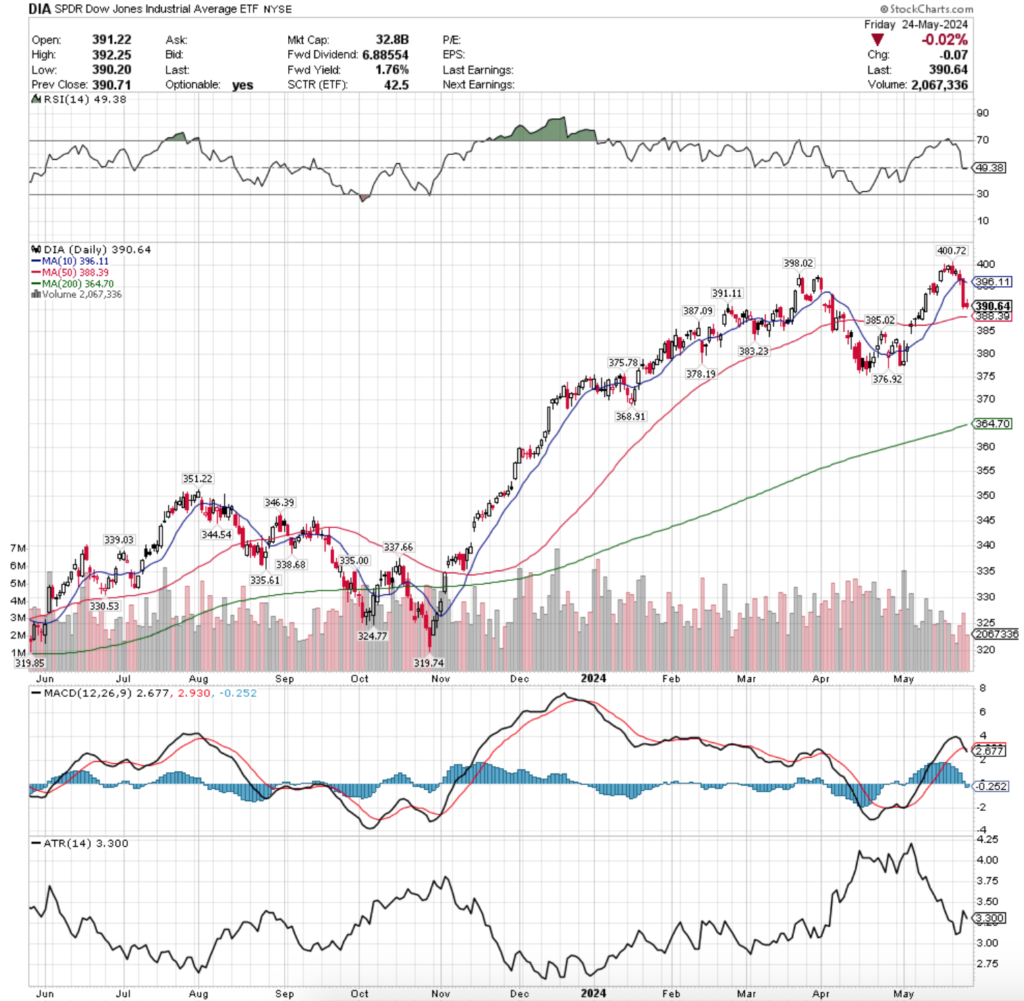
DIA ETF – SPDR Dow Jones Industrial Average ETF’s Technical Performance Over The Past Year
Their RSI is trending up towards the neutral 50 level & sits at 46.55, while their MACD is currently bearish following the declines of the past two weeks.
DIA’s volume was actually relatively high compared to the other index ETFs, coming in at only -3.28% below average compared to the year prior (3,426,550 vs. 3,542,864).
Much like IWM, DIA’s past week decoupled from the performance of the NVDA holding indexes SPY & QQQ & began to show signs of weakness.
Tuesday opened the week up on a gap down that straddled the 50 day moving average’s support, briefly breaking below it, before closing right in line with it, although on low volumes.
Wednesday saw investors showing more pessimism, as DIA gapped down again below the 50 DMA & closed the day as a spinning top candle, indicating that there is still a great deal of uncertainty among market participants.
Thursday may have been the most important day of the week for DIA though, where the second highest volume session of the week resulted in third consecutive gap down & a long-legged doji candle.
This is important for two reasons: 1) the long-legged doji is a signal of uncertainty among market participants overall & 2) because the open & close were so close to one another it can be viewed as market participants finding that price level to be “equilibrium” between bears & bulls.
If buyers & sellers are still uncertain of DIA’s proper value, but agree that it is near $380.41 currently then this suggests that there is further downside movement on the horizon.
While Friday’s wide-range session to the upside was on the highest volume of the week, it should not be interpreted as a bullish signal as it was unable to test the resistance of the 50 day moving average.
It was able to place their RSI a bit higher in the wake of the declines of the week & change prior, but given the angle of their 10 & 50 day moving averages there appears to be a bearish crossover on the cards for this coming week which would result in further downside movements.
DIA’s Average True Range continued to climb higher as the week was marked with heavy volatility & this should continue into the coming weeks.
This week will be time to watch how DIA’s price consolidates within the range of Friday’s candle, or if it continues its downwards slide.
With the 10 DMA closing in on the 50 DMA there should be some additional downside movement this week as a result of that impending crossover.
This is also beginning to look like a bearish head & shoulders set up is forming, which will be something to keep in the back of your mind as we navigate the next few weeks.
This is confirmed by the shapes of the 10 DMA, RSI & the MACD.
Fortunately for DIA their prices have been relatively rangebound in the past few months which has set them up with many support levels nearby.
As their 200 DMA inches higher it will also be important to keep an eye on the $368.91/share price level, which is currently the last support level before prices enter the range of the long bullish run up from November & December of 2023.
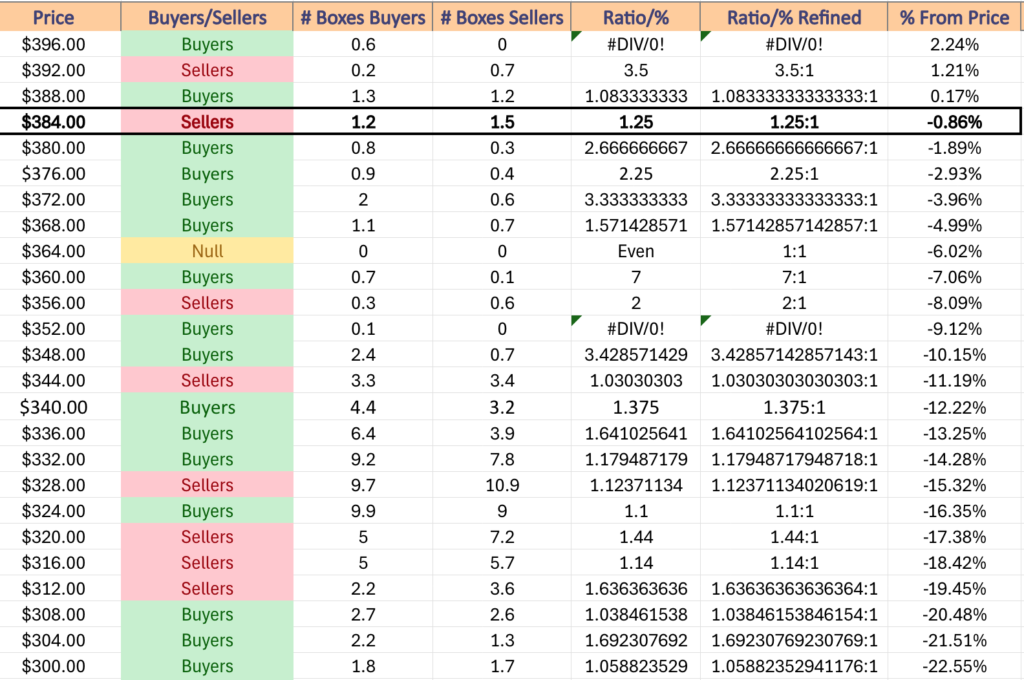
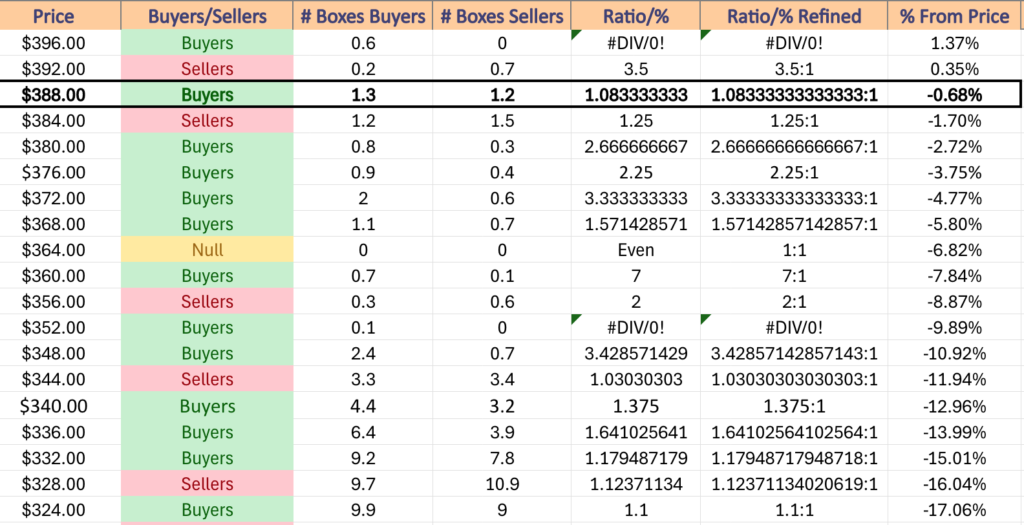
DIA has support at the $387.09 (Volume Sentiment: Sellers, 1.25:1), $385.02 (Volume Sentiment: Sellers, 1.25:1), $383.23 (Volume Sentiment: Buyers, 2.67:1) & $380.41/share (Volume Sentiment: Buyers, 2.67:1) price levels, with resistance at the $388.08 (50 Day Moving Average, Volume Sentiment: Buyers, 1.08:1), $391.11 (Volume Sentiment: Buyers, 1.08:1), $391.70 (10 Day Moving Average, Volume Sentiment: Buyers, 1.08:1) & $398.02/share (Volume Sentiment: Buyers, 0.6:0*) price levels.
DIA ETF’s Price Level:Volume Sentiment Over The Past 3-4 Years
The Week Ahead
Monday kicks the week off with S&P Flash U.S. Manufacturing PMI data at 9:45 am, followed by Construction Spending & ISM Manufacturing data at 10 am & Auto Sales data.
CIBC & Science Applications are scheduled to report earnings before Monday’s opening bell, with GitLab due to report after the session’s close.
Factory Orders & Job Openings data are announced at 10 am on Tuesday.
Tuesday opens up with Bath & Body Works, Core & Main, Designer Brands, Donaldson Company & Ferguson reporting earnings before the bell, with CrowdStrike, Guidewire Software, Hewlett Packard Enterprise, PVH, Sportman’s Warehouse, Stitch Fix & Verint Systems due to report after the session’s close.
Wednesday begins with ADP employment data at 8:15 am, U.S. Productivity (final revision) & U.S. Trade Deficit data at 8:30 am, S&P Flash U.S. Services PMI at 9:45 am & ISM Services data at 10 am.
Brown-Forman, Campbell Soup, Dollar Tree, Hibbett, Ollie’s Bargain Outlet, REV Group, Thor Industries & United Natural Foods are all due to report earnings before Wednesday’s opening bell, with Lululemon Athletica, ChargePoint, Couchbase, Five Below, Greif, Semtech, Smartsheet, Sprinklr & Victoria’s Secret scheduled to report earnings after the session’s close.
Initial Jobless Claims data is released at 8:30 am on Thursday.
Thursday’s earnings start off with ABM Industries, Big Lots, Ciena, G-III Apparel, J.M. Smucker, Nio & The Toro Company before the opening bell, with Argan, Braze, DocuSign, Mission Produce, Samsara, Vail Resorts & Zumiez reporting earnings after the closing bell.
Friday winds the week down with U.S. Employment Report, U.S. Unemployment Rate, U.S. Hourly Wages & Hourly Wages Year-over-Year data at 8:30 am, followed by Wholesale Inventories at 10 am & Consumer Credit at 3pm & there are no noteworthy earnings reports scheduled.
See you back here next week!
*** I DO NOT OWN SHARES OR OPTIONS CONTRACT POSITIONS IN SPY, QQQ, IWM OR DIA AT THE TIME OF PUBLISHING THIS ARTICLE ***
Is there anybody out there? Hello? A third straight week of bite-sized volumes came & went in a week with numerous Fed speakers & the most anticipated earnings report of the quarter where the S&P 500 & NASDAQ reached new all-time highs.
The Dow Jones Industrial Average joined the ranks of the Russell 2000 & decoupled from having similar recent success as the S&P & NASDAQ, primarily due to the fact that NVDA is not a component of the latter two indexes.
SPY, the SPDR S&P 500 ETF remained flat last week, registering a 0.00% change week-over-week (-$0.01) in a week where the VIX closed at 11.93, implying a one day move of +/-0.75% & a one month move of +/-2.18%.
SPY ETF – SPDR S&P 500 ETF’s Technical Performance Over The Past Year
Their RSI is rising & trending towards the overbought level, currently sitting at 63.89, while their MACD is bullish but looks like it will have a bearish crossover this week (although the four session week may impact this).
Volumes were -42.48% below average this week compared to the year prior (43,612,160 vs. 75,685,438), as the weak enthusiasm carried on for the third week in a row.
The week kicked off with a session that set the tone for a relatively range-bound performance, opening near Friday’s close, testing higher, before ultimately closing just above where it opened on the second lightest volume of the week.
Tuesday opened just below Monday’s close & wound up closing below the high of Monday’s session; however the session was the weakest volume session of the week, on a third consecutive week of very low volumes compared to the year prior.
Wednesday proved to be the pivot point of the week, forming a bearish harami with Tuesday’s candle & testing to the downside with its lower shadow on the second highest volume of the week.
This led to Thursday, where a wide-range bearish engulfing candle covered almost the entire range that SPY has traded at since 5/15 on the highest volume of the week, while also establishing a new all-time high.
The volume is even more significant as SPY was able to close below the support of their 10 day moving average, which has not happened since May 1, 2024 & is an indication that investor sentiment is waning.
The week wound down on a +0.67% session Friday, which opened at the 10 day moving average, tested lower, before closing up.
Volumes were still nothing to write home about on Friday & the spinning top candle indicates that there is still a great deal of uncertainty among market participants.
SPY’s Average True Range began to perk back up following the volatility of Wednesday & Thursday & should continue to do so into the coming week.
The strength of the 10 day moving average’s support is still going to be a main theme to keep an eye on this week, as it began showing weakness during the most active session by volume this week, indicating that investors were undeterred by it.
As noted in previous weeks, should the 10 DMA be broken there are limited local support touch-points for SPY, which means a breach of the 10 DMA would likely lead to a test of the 50 DMA which is ~3% below Friday’s closing price.
A breakdown of the 50 DMA would likely result in a broader leg downward & would then have downward pressure of the 10 & 50 DMA’s resistance impacting price.
Between Fed speakers, the Beige Book & some earnings reports that will highlight the strength of the lower income consumer there will be plenty of opportunities for a downside test of the 10 DMA to occur again during this shortened holiday week.
SPY has support at the $527.89 (10 Day Moving Average, Volume Sentiment: NULL, 0:0*), $524.61 (Volume Sentiment: Even, 1:1), $515.71 (50 Day Moving Average, Volume Sentiment: Buyers, 2.5:1) & $501.75/share (Volume Sentiment: Sellers, 3.5:1), with resistance at the $533.06/share (All-Time High, Volume Sentiment: NULL, 0:0*) price level.
SPY ETF’s Price Level:Volume Sentiment Over The Past 1-2 Years
QQQ, the Invesco QQQ Trust ETF that tracks the NASDAQ 100 was the only major index to advance this week, gaining +1.37%.
QQQ ETF – Invesco QQQ Trust ETF’s Technical Performance Over The Past Year
Their RSI is trending higher & sits just beneath the overbought level at 68.94, while their MACD is bullish, but is curling over for what looks to be a bearish crossover in the coming week (although the four day week may impact this).
Volumes were -39.9% below average compared to the previous year’s average (28,662,420 vs. 47,688,702), which casts doubt on the strength of their weekly advance, which was powered by NVIDIA’s earnings call & the associated strength in technology names.
QQQ’s week began on a muted note, with a low volume advancing session whose upper shadow indicated that there was a slight bit more room to move higher in the near-term.
Tuesday opened on a cautious note about mid-way through Monday’s total price range, but was able to close the day slightly higher day-over-day, but on lighter volume indicating that there was hesitancy.
Much like SPY, QQQ’s week’s performance was ultimately determined on Wednesday, when another very low volume session resulted in a dragonfly doji, indicating that there may be a reversal, or a continued march higher.
Thursday’s open in the wake of the NVDA earnings report was a large gap up for QQQ, but ultimately resulted in the indication of significant appetite for QQQ’s price to be lower, as the session closed near the low of Wednesday’s session & tested lower on the lower shadow.
Thursday also had the highest volume of the week, indicating that there is extreme discomfort in QQQ’s current price level & that many folks were eager to take profits off of the table quickly.
Also, Thursday set a new all-time high for QQQ, which confirms the profit taking angle & will make it important to keep an eye on this coming week.
Friday opened higher than Thursday’s close, tested lower but ultimately marched higher, forming a bullish harami pattern to close out the week, which will be an area to keep an eye on this week.
Like SPY, QQQ’s Average True Range began to perk up mid-week, which seems likely to continue into this coming week.
QQQ’s 10 day moving average & its relationship to its share price will be something traders are keeping a close eye on this week, as despite the weak volumes of last week, the 10 DMA maintained its strength & was not tested.
There are more local support levels for QQQ than SPY, as we’ve outlined before due to the less steep ascent that they took in the rally from October of 2023 to April of 2024, however due to the performance of many tech names eagerness to take profits may render that irrelevant in the face of a decline.
Along with SPY, the relationship between price, 10 & 50 day moving averages will also be something to keep an eye on in the event of decline, as the results will be similar for QQQ’s price.
QQQ has support at the $452.37 (10 Day Moving Average, Volume Sentiment: NULL, 0:0*), $449.34 (Volume Sentiment: NULL, 0:0*), $445.99 (Volume Sentiment: Buyers, 3.67:1) & $439.03/share (50 Day Moving Average, Volume Sentiment: Buyers, 1.32:1), with resistance at the $460.58/share (All-Time High, Volume Sentiment: NULL, 0:0*) price level.
QQQ ETF’s Price Level:Volume Sentiment Over The Past 1-2 Years
IWM, the iShares Russell 2000 ETF dipped -1.27% last week, as market participants were less enthusiastic about small cap names than other stocks.
IWM ETF – iShares Russell 2000 ETF’s Technical Performance Over The Past Year
Their RSI is just above the neutral level, sitting at 53.17, while their MACD is bearish following the declines of last week.
Volumes were -39.7% less than the year prior’s average (20,792,280 vs. 34,480,038), which is interesting, given that IWM decoupled from SPY & QQQ’s performance & went largely bearish for the week.
Monday started off on a bearish foot for IWM, with a shooting star candle that included a small lower shadow, indicating that there was further appetite to the downside.
Sure enough, Tuesday gapped down, tested slightly lower, but ultimately was able to gather enough steam to close above where it opened, but still for a declining session.
The low volume of Tuesday’s session was the lowest of the week for IWM, which somewhat mutes the fact that investors did push the price back to above where the session opened, which was confirmed by Wednesday’s decline.
Wednesday’s high wave session’s real body was slightly longer than a traditional spinning top, but nevertheless showed large movements both higher & lower based on the upper & lower shadows.
It also showed a complete breakdown of the 10 day moving average’s support for IWM, which when combined with Thursday’s session paints two interesting pictures.
Thursday the declines continued, opening at first above the close of Wednesday, before nosediving through both the 10 & 50 DMAs on the week’s highest volume.
Prices were able to cover to close above the 50 DMA, leading to a bullish harami with Friday’s +1.08% advancing session, but the volumes are clearly speaking more to the downside in terms of investor preference in IWM.
IWM’s Average True Range began to perk up again after declining all month due to the volatility of the past week & appears ready to continue climbing as the most likely scenarios for IWM in the near-term involve more volatility.
Based on the fact that the 50 DMA’s support ultimately held up, Friday’s candle forming a bullish harami may see a new consolidation range forming for IWM’s prices where they oscillate between the 10 & 50 day moving averages in the near-term while waiting for an upside or downside catalyst.
However, due to the high volumes that pushed the price below the 50 DMA’s support there could also be an uptick in volatility where the 50 DMA is broken through, leading to a leg to the downside.
In the event of the latter, there are a handful of support levels that are local to the 50 DMA & could lead to a continuation of the range that IWM has traded in since December 2024 in the near-term.
The angle which the 10 DMA is curled over at is an area of concern though, and indicates that there will be more declines in the coming week(s).
IWM has support at the $204.97 (Volume Sentiment: Buyers, 1.83:1), $204.25 (Volume Sentiment: Buyers, 1.83:1), $202.74 (50 Day Moving Average, Volume Sentiment: Buyers, 1.08:1) & $199.16/share (Volume Sentiment: Buyers, 2.47:1), with resistance at the $206.92 (10 Day Moving Average, Volume Sentiment: Buyers, 1.83:1), $209.77 (Volume Sentiment: Buyers, 2.75:1), $209.88 (Volume Sentiment: Buyers, 2.75:1) & $211.88/share (52-Week High, Volume Sentiment: Buyers, 2.75:1) price level.
IWM ETF’s Price Level:Volume Sentiment Over The Past 1-2 Years
DIA, the SPDR Dow Jones Industrial Average ETF had the weakest week of the major four indexes, declining -2.33%, indicating the importance NVDA stock had on markets this week, as it is a component of SPY & QQQ, but not DIA or IWM.
DIA ETF – SPDR Dow Jones Industrial Average ETF’s Technical Performance Over The Past Year
Their RSI is right along the neutral level at 49.38 after flattening out over the past two sessions, while their MACD is bearish in the aftermath of last week’s declines.
Volumes were -33.42% below average last week compared to the year prior (2,358,500 vs. 3,542,530), as investors were even weary to jump into names of the large cap comprised index & used the broader market volatility to take profits from DIA & its components.
As noted above, last week began to show the divergence between indexes that hold NVDA & indexes that do not, as IWM & DIA drifted further apart from SPY & QQQ.
DIA’s week began on an interesting note, where a low volume session that opened around Friday’s closing level created a new all-time high, before profits were taken & the day resulted in a decline.
Tuesday offered a glimmer of hope, but was still marked with uncertainty when the lowest volume of the week came on DIA’s only daily advance, but the result of the session was one of uncertainty, marked by a spinning top candle.
The rest of the week confirmed this, as Wednesday’s session opened lower, tested above Tuesday’s close, before breaking to the downside, temporarily dipping below the 10 day moving average’s support, but managing to recover to close about in line with the 10 DMA on the second highest volume of the week.
That volume indicated that sentiment clearly lies with more profit taking, which led to Thursday’s wide range decline on the highest volumes of the week, as there was no gain for DIA from the NVDA earnings report on Wednesday night.
Prices settled for the session ~2% below the 10 day moving average’s resistance, hovering <1% above the 50 day moving average’s support.
Friday’s session set up a situation similar to the one just outlined for IWM in terms of where DIA’s price goes from here, as there was more profit taking on a declining session of -0.02%, setting up a sharp downwards angle from the 10 DMA, while prices sit between it & the 50 DMA.
A ~0.5% decline would have DIA sitting atop its 50 DMA, indicating that in the near-term we either will see a consolidation range established within the two moving averages & the body of Thursday’s wide-range candle, or the support of the 50 DMA breaks down & results in a broader move to the downside.
In the case of either instance, there is a chance of the gap from early May being filled in the coming weeks, but in the near-term there does not appear to be much in the way of catalysts to the upside, nor general enthusiasm at these price levels to continue the charge higher.
DIA, like IWM has many local support touch-points, which will also be something to look at & assess as prices fluctuate in the near-term.
DIA has support at the $388.39 (50 Day Moving Average, Volume Sentiment: Buyers, 1.08:1), $387.09 (Volume Sentiment: Sellers, 1.25:1), $385.02 (Volume Sentiment: Sellers, 1.25:1) & $383.23/share (Volume Sentiment: Buyers, 2.67:1), with resistance at the $391.11 (Volume Sentiment: Buyers, 1.08:1), $396.11 (10 Day Moving Average, Volume Sentiment: Buyers, 0.6:0*), $398.02 (Volume Sentiment: Buyers, 0.6:0*) & $400.72/share (All-Time High, Volume Sentiment: NULL, 0:0*) price level.
DIA ETF’s Price Level:Volume Sentiment Over The Past 3-4 Years
The Week Ahead
Monday is the Memorial Day holiday in the U.S. so markets will be closed & there will be not economic data nor earnings reports released.
Cleveland Fed President Mester speaks in Japan at 12:55am on Tuesday, followed by the S&P Case-Shiller Home Price Index (20 cities) at 9 am, Minneapolis Fed President Kashkari speaks at 9:55 am & Consumer Confidence data is released at 10 am.
Tuesday morning’s earnings reports include Bank of Montreal, Bank of Nova Scotia, Baozun & Hello Group, with Box, CAVA Group & HEICO scheduled to report after the closing bell.
Wednesday starts late on the data front, with New York Fed President Williams speaking at 1:45 pm, followed by the Fed Beige Book at 2 pm.
Abercrombie & Fitch, Advanced Auto Parts, American Eagle Outfitters, Chewy, Columbus McKinnon, Dick’s Sporting Goods & Royal Bank of Canada are all due to report earnings before Wednesday’s opening bell, with Salesforce, Agilent Technologies, C3.ai, Capri Holdings, Credo Technology Group, HP, nCino, Nutanix, Okta, Pure Storage, Stratasys & UiPath all scheduled to report after the closing bell.
Things pick up on Thursday beginning with Initial Jobless Claims, GDP (first revision), Advanced U.S. Trade Balance in Goods, Advanced Retail Inventories & Advanced Wholesale Inventories at 8:30 am, Pending Home Sales at 10 am & New York Fed President Williams speaking at 12:05pm.
Thursday morning’s earnings calls include Dollar General, Best Buy, Birkenstock Holding, Burlington Stores, Caleres, Cracker Barrel, Foot Locker, Hormel Foods, Kohl’s, SpartanNash & Veradigm, with Dell Technologies, Ambarella, Asana, Cooper Companies, Costco Wholesale, Elastic, Gap, Marvell Technology, MongoDB, NetApp, Nordstrom, SentinelOne, Ulta Beauty, Veeva Systems & Zscaler all due to report after the session’s close.
Friday begins with Personal Income, Personal Spending, PCE Index, PCE (Year-over-Year), Core PCE Index & Core PCE (Year-over-Year) at 8:30 am & the Chicago Business Barometer (PMI) at 9:45 am & Genesco will report earnings before the opening bell.
See you back here next week!
*** I DO NOT OWN SHARES OR OPTIONS CONTRACTS IN SPY, QQQ, IWM OR DIA AT THE TIME OF PUBLISHING THIS ARTICLE ***
NVIDIA Corp. stock trades under the ticker NVDA & has been one of the most exciting stocks to watch over the past year as market participants have been swept up in AI-mania.
NVDA stock has advanced +195.9% over the past year (ex-dividends), including a +210.27% gain from their 52-week low in May of 2023 & currently sits -5.05% below their 52-week high that was set in March of 2024.
With a pivotal earnings call scheduled for tomorrow while they sit off of all-time highs, it is a good time to take a look at how investors have behaved at different price levels NVDA has traded at in recent history.
Below is a brief technical analysis of NVDA’s recent performance, followed by a list that shows all of the support & resistance levels from NVDA’s one-year chart, as well as the ratio of Buyers:Sellers (or Sellers:Buyers) at each price level that NVDA has traded at over the past ~1 year.
Understanding how investors have behaved in previous times at each price level can be of value as a means of gauging sentiment & the strength of how each price level has been viewed (particularly for support & resistance levels).
This is not financial advice, but rather an additional tool to consider while conducting your own research & due diligence on NVDA stock.
Technical Analysis Of NVIDIA Corp. NVDA Stock
NVIDIA Corp. NVDA Stock’s Technical Performance Over The Past Year
Their RSI is trending towards neutral & currently sits at 57.47 in the wake of last Thursday & Friday’s declines & their MACD is bullish, but it has curled over looking set to cross over bearishly during this week.
Volumes were -31.15% below average last week compared to the year prior (33,487,860 vs. 48,636,713.55), as traders & investors eagerly await their earnings report tomorrow afternoon.
One note of concern on their most recent volume is that while Wednesday’s advancing session had the highest volumes of the week, Thursday & Friday’s declining sessions had the second & third highest volumes of the week, indicating that there is a bit of weakness & lack of enthusiasm.
Monday kicked the week off with a dragonfly doji, whose bullishness was confirmed Tuesday when a bullish engulfing candle set the stage for Wednesday’s gap up session.
However, a clear risk-off sentiment crept into play as Thursday & Friday completed a bearish evening star pattern heading into the weekend, setting the stage for potentially more declines in the coming week.
So far NVDA’s 10 day moving average has maintained strength as a support level, and it will continue to be an area to keep focus on in the coming week, as their 50 day moving average is ~3.5% below it.
In the event price declines beneath both there would be downward pressure on it coming from both moving averages.
NVDA has some support levels nearby, all of whose volume sentiments are noted below.
NVIDIA Corp. NVDA Stock’s Price:Volume Sentiment Broken Down
The top table below shows the support & resistance levels of NVDA stock from the past year’s chart, as well as their price level:volume sentiment at each, using Friday’s closing price.
The moving averages are denoted with bold.
The next charts show the volume sentiment at each individual price level NVDA has traded at over the past ~1 year.
Beneath them is a copy & pasteable list of the same data, where the support/resistance levels are denoted in bold.
All ratios with “0” in the denominator are denoted with a “*”.
NULL values are price levels that had limited trading in, whether it be due to gaps, quick advances or they are at price extremes; in the event that they are retested & there is more data they would have a distinct “Buyers”, “Sellers” or “Even” title.
This is not intended as financial advice, but rather another tool to consider when performing your own research & due diligence on NVDA stock.
NVIDIA Corp. NVDA Stock’s Price Level:Volume Sentiment Over The Past ~1 Year At Key One Year Support & Resistance Levels
NVIDIA Corp. NVDA Stock’s Price Level:Volume Sentiment Over The Past ~1 Year
NVIDIA Corp. NVDA Stock’s Price Level:Volume Sentiment Over The Past ~1 Year
NVIDIA Corp. NVDA Stock’s Price Level:Volume Sentiment Over The Past ~1 Year
NVIDIA Corp. NVDA Stock’s Price Level:Volume Sentiment Over The Past ~1 Year
NVIDIA Corp. NVDA Stock’s Price Level:Volume Sentiment Over The Past ~1 Year
NVIDIA Corp. NVDA Stock’s Price Level:Volume Sentiment Over The Past ~1 Year
$975 – NULL – 0:0*, +5.43% From Current Price Level
$970 – NULL – 0:0*, +4.89% From Current Price Level
$965 – NULL – 0:0*, +4.35% From Current Price Level
$960 – NULL – 0:0*, +3.81% From Current Price Level
$955 – NULL – 0:0*, +3.27% From Current Price Level
$950 – Buyers – 2.6:0*, +2.73% From Current Price Level
$945 – Buyers – 2:0*, +2.19% From Current Price Level
$940 – Buyers – 1.5:1, +1.64% From Current Price Level
$935 – Sellers – 0.4:0*, +1.1% From Current Price Level
$930 – NULL – 0:0*, +0.56% From Current Price Level
$925 – Buyers – 1.26:1, +0.02% From Current Price Level
$920 – Buyers – 1.8:0*, -0.52% From Current Price Level – Current Price Level*
$915 – Buyers – 3.1:0*, -1.06% From Current Price Level
$910 – Buyers – 3.7:0*, -1.6% From Current Price Level – 10 Day Moving Average*
$905 – Sellers – 2.5:1, -2.14% From Current Price Level
$900 – Buyers – 1.86:1, -2.68% From Current Price Level
$895 – Buyers – 1.6:0*, -3.22% From Current Price Level
$890 – Buyers – 1.55:1, -3.76% From Current Price Level
$885 – Buyers – 1.42:1, -4.3% From Current Price Level
$880 – Buyers – 2.5:1, -4.84% From Current Price Level – 50 Day Moving Average*
$875 – Sellers – 2.55:1, -5.38% From Current Price Level
$870 – Buyers – 2.92:1, -5.92% From Current Price Level
$865 – NULL – 0:0*, -6.47% From Current Price Level
$860 – Sellers – 3.8:0*, -7.01% From Current Price Level
$855 – Sellers – 1.24:1, -7.55% From Current Price Level
$850 – Buyers – 1.36:1, -8.09% From Current Price Level
$845 – Buyers – 2.1:0*, -8.63% From Current Price Level
$840 – Sellers – 2.2:0*, -9.17% From Current Price Level
$835 – NULL – 0:0*, -9.71% From Current Price Level
$830 – Sellers – 2.7:0*, -10.25% From Current Price Level
$825 – Buyers – 2:0*, -10.79% From Current Price Level
$820 – Buyers – 4.3:0*, -11.33% From Current Price Level
$815 – NULL – 0:0*, -11.87% From Current Price Level
$810 – NULL – 0:0*, -12.41% From Current Price Level
$805 – NULL – 0:0*. -12.95% From Current Price Level
$800 – NULL – 0:0*, -13.49% From Current Price Level
$795 – Buyers – 1.26:1, -14.03% From Current Price Level
$790 – Buyers – 4.8:0*, -14.58% From Current Price Level
$785 – Buyers – 4.44:1, -15.12% From Current Price Level
$780 – NULL – 0:0*, -15.66% From Current Price Level
$775 – Sellers – 1.9:0*, -16.2% From Current Price Level
$770 – NULL – 0:0*, -16.74% From Current Price Level
$765 – NULL – 0:0*, -17.28% From Current Price Level
$760 – Sellers – 4.1:0*, -17.82% From Current Price Level
$755 – NULL – 0:0*, -18.36% From Current Price Level
$750 – NULL – 0:0*, -18.9% From Current Price Level
$745 – NULL – 0:0*, -19.44% From Current Price Level
$740 – NULL – 0:0*, -19.98% From Current Price Level
$735 – Buyers – 2.3:0*, -20.52% From Current Price Level
$730 – NULL – 0:0*, -21.06% From Current Price Level
$725 – Sellers – 4.2:0*, -21.6% From Current Price Level
$720 – Buyers – 1.85:1, -22.14% From Current Price Level
$715 – NULL – 0:0*, -22.69% From Current Price Level
$710 – NULL – 0:0*, -23.23% From Current Price Level
$705 – NULL – 0:0*, -23.77% From Current Price Level
$700 – Buyers – 2.3:0*, -24.31% From Current Price Level
$695 – Sellers – 2:0*, -24.85% From Current Price Level
$690 – Sellers – 1.06:1, -25.39% From Current Price Level
$685 – NULL – 0:0*, -25.93% From Current Price Level
$680 – Sellers – 3.2:0*, -26.47% From Current Price Level
$675 – NULL – 0:0*, -27.01% From Current Price Level
$670 – Sellers – 3.2:0*, -27.55% From Current Price Level
$665 – NULL – 0:0*, -28.09% From Current Price Level
$660 – Buyers – 2.3:0*, -28.63% From Current Price Level
$655 – NULL – 0:0*, -29.17% From Current Price Level
$650 – NULL – 0:0*, -29.71% From Current Price Level
$645 – NULL – 0:0*, -30.25% From Current Price Level
$640 – NULL – 0:0*, -30.8% From Current Price Level
$635 – NULL – 0:0*, -31.34% From Current Price Level
$630 – Buyers – 1.8:0*, -31.88% From Current Price Level
$625 – Buyers – 2:0*, -32.42% From Current Price Level
$620 – Buyers – 1.7:0*, -32.96% From Current Price Level
$615 – Buyers – 1.05:1, -33.5% From Current Price Level
$610 – Buyers – 1.59:1, -34.04% From Current Price Level – 200 Day Moving Average*
$605 – NULL – 0:0*, -34.58% From Current Price Level
$600 – NULL – 0:0*, -35.12% From Current Price Level
$595 – Buyers – 3.4:0*, -35.66% From Current Price Level
$590 – Buyers – 2.6:0*, -36.2% From Current Price Level
$585 – NULL – 0:0*,-36.74% From Current Price Level
$580 – NULL – 0:0*, -37.28% From Current Price Level
$575 – NULL – 0:0*, -37.82% From Current Price Level
$570 – Buyers – 2.2:0*, -38.36% From Current Price Level
$565 – NULL – 0:0*, -38.91% From Current Price Level
$560 – Even – 1:1, -39.45% From Current Price Level
$555 – NULL – 0:0*, -39.99% From Current Price Level
$550 – NULL – 0:0*, -40.53% From Current Price Level
$545 – Buyers – 2.23:1, -41.07% From Current Price Level
$540 – Buyers – 2.4:0*, -41.61% From Current Price Level
$535 – NULL – 0:0*, -42.15% From Current Price Level
$530 – Buyers – 3.6:0*, -42.69% From Current Price Level
$525 – NULL – 0:0*, -43.23% From Current Price Level
$520 – Buyers – 3:0*, -43.77% From Current Price Level
$515 – NULL – 0:0*, -44.31% From Current Price Level
$510 – NULL – 0:0*, -44.85% From Current Price Level
$505 – NULL – 0:0*, -45.39% From Current Price Level
$500 – NULL – 0:0*, -45.93% From Current Price Level
$496 – NULL – 0:0*, -46.37% From Current Price Level
$492 – NULL – 0:0*, -46.8% From Current Price Level
$488 – Buyers – 2:0*, -47.23% From Current Price Level
$484 – NULL – 0:0*, -47.66% From Current Price Level
$480 – Sellers – 2:0*, -48.1% From Current Price Level
$476 – Sellers – 1.14:1, -48.53% From Current Price Level
$472 – NULL – 0:0*, -48.96% From Current Price Level
*** I DO NOT OWN SHARES OR OPTIONS CONTRACT POSITIONS IN NVDA STOCK AT THE TIME OF PUBLISHING THIS ARTICLE ***
SPY, the SPDR S&P 500 ETF added +1.65% this past week, while the VIX closed at 11.99 to finish the week, implying a one-day move of +/-0.92% & a one-month move of +/-2.19%, in yet another week of lackluster volumes across the major four indexes.
SPY ETF – SPDR S&P 500 ETF’s Technical Performance Over The Past Year
Their RSI is nearing the overbought level & currently sits at 68.85 after a week of relative quiet (asides from Wednesday’s gap up session), while their MACD is still bullish, but showing signs of weakening in the near-term.
Volumes were -31.42% below average compared to the year prior (including last week’s “participation trophy week”, 52,530,754 vs. 76,595,337), indicating severe hesitancy on the part of market participants, as it appears the well of enthusiasm has dried up.
This low volume should be particularly alarming, given that most of the sessions of the past two weeks have closed in advances so there is not much conviction behind these moves up.
Monday kicked the week off on a similar note that last Friday wound down the previous week, resulting in a gap up open that tested lower to about mid-way through Friday’s lower shadow, before rallying back to close just above Friday’s close on what was one of the year’s bottom 3 lowest volume sessions.
Tuesday was able to find some stable footing & advance higher, but volumes again were nothing spectacular & folks weren’t just diving back into the fool in masses, as PPI data had just been announced & CPI data was on deck for Wednesday.
Wednesday opened with a gap up with enough enthusiasm to close higher for the day’s session & establish a new trading range for the end of the week, but volumes were still nothing to write home about (although they were the highest of the week for SPY).
Thursday is where the treading water began, which we will likely see continue into the coming week until the highly anticipated NVDA earnings call on Wednesday.
SPY ended Thursday on a bearish & uncertain note, as the session had declining volume that was similar to the advancing volumes of the past two days, on a shooting star candle.
This was to be expected walking into the open & is likely to continue into the coming week, barring there is some major news development in the time running up to the NVDA earnings report (bearish), or a head-fake up to get more people to pile back into the pool on one last pump.
Friday continued this theme, as the second highest volume session of the week ended in a +0.15% advance for the day, resulting in a dragonfly doji, which is a bullish reversal candle.
It also created a bullish harami pattern with Thursday’s candle, however, the session closed below its open & with the poor volume it is hard to read it as being particularly bullish.
SPY’s Average True Range is continuing lower, due to the gap up of Wednesday’s session & general lack of volatility, which we did anticipate would be rising in the near-term (and still do).
The late-July 2023 to November period is still something to be keeping a close eye on, as while the 10 Day Moving Average has recently pulled further ahead of the 50 DMA than it did during that time, this time around a new 52-week (and all-time) high was established.
Support levels for SPY are also in an interesting position as they currently sit, as using the data from the past 1-2 years, the immediate next two support levels do not have enough data yet to establish whether buyers or sellers have been the dominant force & they’re reportedly even (let’s assume buyers have the slight edge due to the nature of where they are currently trading).
The next two support levels are in the $510-514.99/share box, which is historically dominated by sellers at a rate of 2.31:1 & is only a 2.67% decline away from their current trading price from Friday’s close.
A decline of -4.56% would be in the cards if the sellers overtake the first two support levels & carry enough selling momentum from the historic behavior of the $510 range, which will be an area to keep a close eye on in the coming week, especially after the Fed speakers of the week & the NVDA earnings report.
SPY has support at the $524.61 (Volume Sentiment: Even, 1:1), $522.41 (10 Day Moving Average, Volume Sentiment: Even, 1:1), $514.03 (50 Day Moving Average, Volume Sentiment: Sellers, 2.31:1) & $510.75/share (Volume Sentiment: Sellers, 2.31:1) price levels with resistance at the $531.52/share (All-Time High, Volume Sentiment: NULL, 0:0*) price level.
SPY ETF’s Price Level:Volume Sentiment Over The Past 1-2 Years
QQQ, the Invesco QQQ Trust ETF that tracks the NASDAQ 100, advanced +2.19% last week, having the strongest weekly performance of the major four index ETFs.
QQQ ETF – Invesco QQQ Trust ETF’s Technical Performance Over The Past Year
Their RSI is near the overbought level, but has backed away from it in the wake of the past two sessions & sits at 65.89, while their MACD is bullish but showing signs of impending weakness in the coming week(s).
Volumes were weak, -29.72% below average vs. the prior year (33,892,137 vs. 48,227,138), indicating that there is still a lot of skepticism about their near-term potential among market participants.
Much like SPY, QQQ has now had back-to-back weeks of subpar volumes as investors sit on the edge of their seats awaiting to see if NVDA’s earnings call can give markets the strength to continue climbing.
Monday saw one of the lowest volume sessions of the year for QQQ on a day where despite gapping higher than the week prior on the open there was minimal strength & a test to the downside & ultimate close lower than the open.
Tuesday saw investors more eager to enter the market both in terms of volumes & the session’s bullish engulfing candle, leading to Wednesday’s gap up session on the highest volume of the week.
From there QQQ became range-bound near the closing price of Wednesday’s session for the rest of the week.
Thursday formed a bearish harami with Wednesday’s candle (bearish) as the real body of the shooting star candle was confined within the real body of Wednesday’s.
Friday confirmed this with more downside action, as the lower shadow of the day’s range tested down ~75% of Wednesday’s candle’s real body, indicating that pessimism has not left the building for QQQ & will likely continue into the new week.
QQQ’s Average True Range has been trending lower & recently crossed its mean as volatility has subsided since April, although it is likely to pick back up this coming week.
As noted in prior weeks, QQQ has more nearby support points than SPY due to the velocity with which SPY climbed over the past 7-8 months, but all eyes will continue to be on the 10 & 50 day moving averages.
If prices are to fall below them, there will be downward pressure from their resistance & given how close they are in the first place it would not take particularly long for them to begin flashing bearish signals.
Another thing to be mindful 0f in the coming few months is in the event of a decline, whether or not a head & shoulders pattern emerges with last week’s new all-time high as the head (or a new high reached this week).
It will also be important to be watching how volume trends change after two weeks with subpar volumes, as well as noting whether the buyers or sellers have been the dominating players at the support levels that QQQ is likely going to test in the coming week(s).
QQQ has support at the $449.34 (Volume Sentiment: NULL, 0:0*), $445.99 (Volume Sentiment: Buyers, 3.67:1), $444.93 (10 Day Moving Average, Volume Sentiment: Buyers, 3.67:1) & $438.56/share (Volume Sentiment: Buyers, 1.32:1) price levels with resistance at the $454.69/share (All-Time High, Volume Sentiment: NULL, 0:0*) price level.
QQQ ETF’s Price Level:Volume Sentiment Over The Past 1-2 Years
IWM ETF – iShares Russell 2000 ETF’s Technical Performance Over The Past Year
Their RSI is near the oversold end of neutral, currently sitting at 61.54, while their MACD is bullish but has curled over bearishly & looks primed for a bearish crossover in the coming days.
Volumes were -15.46% below average compared to the year prior (29,329,278 vs. 34,692,386), as market participants were reluctant to buy into IWM for a second straight week.
The week kicked off on a unique & anything but certain note, as one of the lowest volume sessions of the year opened above last Friday’s close, tried to march up to Friday’s high, but ultimately retreated & closed lower.
This resulted in a bullish harami pattern, but given the low volume & the lower close than open it was to be taken with a grain of salt & not a sign of bullish enthusiasm.
Tuesday opened on a gap higher, but ended up closing in confusion & uncertainty as a spinning top candle, on a second straight day of lower closes than opens for IWM.
This lack of conviction among market participants continued throughout the week, as despite gapping higher on Wednesday, IWM closed the day with a hanging man candle, which is a bearish signal.
Thursday & Friday went on to work on closing the gap created by Wednesday’s session, with Thursday being a declining session & Friday resulting in a doji candle, signaling uncertainty going into the weekend.
Friday had the highest volumes of the week, which should also raise a skeptical brow about the strength in IWM currently, given that they closed at the exact price level that they opened on for the day, indicating that investors didn’t have any conviction one way or the other regarding their price.
IWM’s Average True Range has continued to decline in the month of May as volatility has subsided dramatically since April, but their other indicators look like we’ll see an uptick in their ATR in the week ahead.
It’ll be worth keeping an eye on IWM’s MACD this upcoming week & how its 10 day moving average moves in relation to it, as their MACD is showing signs of weakness & if the declines from it begin to pull the 10 DMA down that could set up a decent size swing to the downside.
Much like SPY & QQQ, that downwards move for the 10 DMA would also begin forcing downwards pressure on price if it drops beneath it & would also trigger the same downwards pressure from the 50 DMA in the event of declining below that as well.
IWM has support at the $206.05 (10 Day Moving Average, Volume Sentiment: Buyers, 1.83:1), $204.97 (Volume Sentiment: Buyers, 1.83:1), $204.25 (Volume Sentiment: Buyers, 1.83:1) & $202.54/share (50 Day Moving Average, Volume Sentiment: Buyers, 1.08:1) price levels with resistance at the $209.77 (Volume Sentiment: Buyers, 2.75:1), $209.88 (Volume Sentiment: Buyers, 2.75:1) & $211.88/share (52-Week High, Volume Sentiment: Buyers, 2.75:1) price level.
IWM ETF’s Price Level:Volume Sentiment Over The Past 1-2 Years
DIA ETF – SPDR Dow Jones Industrial Average ETF’s Technical Performance Over The Past Year
Their RSI is in overbought territory following the advances of the month of May & currently sits at 71.54, while their MACD is bullish, but showing signs of a bearish roll-over on the near-term horizon.
Volumes were -19.6% lower last week compared to the year prior (2,857,738 vs. 3,554,391), in another week of lackluster trading activity.
Monday began DIA’s week with a bearish engulfing candle that almost engulfed the entirety of Friday’s doji’s range.
However, this large downside candle came on weak volumes, adding a layer of uncertainty into the mix & a lack of conviction behind market participants.
Tuesday resulted in an advancing session that created a bullish harami pattern with Monday’s & set the stage for the rest of the week’s advances.
Wednesday’s gap up came in the wake of Tuesday’s harami pattern & it also was the session with the week’s highest volumes, which isn’t a strong sign of conviction given how low volumes were for the week & the week prior.
Thursday brought another all-time high for DIA, but on a bearish note as the day’s session resulted in a shooting star candle, showing that investors did not want to budge over the $400.40/share mark for DIA.
Friday resulted in a relatively range-bound hanging man candle (bearish) on sub-par volumes indicating that there is a bit of bearish sentiment out there among market participants in regards to DIA.
Much like SPY, QQQ & IWM, DIA’s Average True Range has been declining throughout May as volatility has subsided, but it should begin to uptick again in the coming week(s).
DIA’s week will be interesting, as unlike SPY & QQQ NVDA is not a component of DIA.
Most of the same observations for SPY, QQQ & IWM are applicable to DIA in terms of their coming week’s performance & concerns, with the primary ones being the strength of their nearest support levels & how price behaves in relation to their 10 & 50 day moving averages.
Their recent volumes have painted a troublesome picture & it looks as though folks are very hesitant to dive into the pool & are more interested in seeing if it is almost time to jump out to take a break.
DIA has support at the $398.02 (Volume Sentiment: Buyers, 0.6:0*), $394.01 (10 Day Moving Average, Volume Sentiment: Sellers, 3.5:1), $391.11 (Volume Sentiment: Buyers, 1.08:1) & $387.69/share (50 Day Moving Average, Volume Sentiment: Sellers, 1.25:1) price levels with resistance at the $400.40/share (All-Time High, Volume Sentiment: NULL, 0:0*) price level.
DIA ETF’s Price Level:Volume Sentiment Over The Past 3-4 Years
The Week Ahead
Monday the week kicks off on a sleepy note, with no economic data scheduled to be released.
global-E Online, Li Auto & Wix.com are all scheduled to report earnings Monday morning before the opening bell, with Keysight Technologies, Nordson, Palo Alto Networks & Zoom Video Communications reporting after the closing bell.
Cleveland Fed President Loretta Mester, Atlanta Fed President Raphael Bostic & Boston Fed President Susan Collins speak together on a panel on Tuesday night at 7pm.
Tuesday opens up with AutoZone, Eagle Materials, James Hardie, Lowe’s & Macy’s all reporting earnings before the opening bell, with Toll Brothers, Modine Manufacturing, Skyline Champion, Urban Outfitters & Viasat all reporting earnings after the session’s close.
Wednesday brings us Existing Home Sales data at 10 am, followed by Minutes of the May FOMC Meeting at 2pm.
Target, Analog Devices, Brady, Dorian LPG, Dycom, GDS Holdings, Kingsoft Cloud, Petco Health & Wellness, Phontronics, TJX, Vipshop Holdings & Williams-Sonoma all report earnings Wednesday morning before the market opens, with the day’s headliner NVIDIA reporting after the closing bell, along with Enersys, LiveRamp, Snowflake, Sociedad Quimica y Minera, Synopsys, VF Corp & Zuora as well.
Initial Jobless Claims will be reported at 8:30 am on Thursday, followed by S&P Flash U.S. Services PMI & S&P Flash U.S. Manufacturing PMI data at 9:45 am, New Home Sales data at 10 am & Atlanta Fed President Raphael Bostic speaking at 3pm.
Thursday kicks off with BJ’s Wholesale, Endava, Hamilton Lane, KE Holdings, Medtronic, Minro Muffler, NetEase, Ralph Lauren, Shoe Carnival, Titan Machinery, Triumph Group & Weibo reporting earnings before the market opens, followed by Intuit, Lions Gate Entertainment, Ross Stores, StepStone Group & Workday after the closing bell.
Friday winds the week down with Durable-Goods Orders & Durable Goods minus Transportation data at 8:30 am, followed by Consumer Sentiment (final) data at 10 am.
The week ends on the earnings front in the morning when Booz Allen Hamilton, Hudbay Minerals & TransAlta are all scheduled to report earnings before the market’s opening bell.
See you back here next week!
*** I DO NOT OWN SHARES OR OPTIONS CONTRACT POSITIONS IN SPY, QQQ, IWM OR DIA AT THE TIME OF PUBLISHING THIS ARTICLE ***
XLU, the Utilities Select Sector Fund ETF is currently at a new 52-week high following a +8.15% advance over the past year (ex-distributions) & a +30% gain since their 52-week low in October of 2023.
Given that XLU is at a new 52-week high it is worth diving into what volume sentiments have been like at various price levels that they have traded at over the past 4-5 years, especially given that there will likely be tests of support levels in the coming week(s).
This is important as it may help identify which levels of support will be more apt to be stronger than others.
This is not a specific recommendation, nor is it a substitute for performing your own due diligence, but rather it is meant to be an extra tool that you can take into consideration while making your own assessment of XLU.
Brief Technical Analysis Of XLU, The Utilities Select Sector SPDR Fund ETF
XLU ETF – Utilities Select Sector SPDR Fund ETF’s Technical Performance Over The Past Year
Their RSI is currently overbought at 78.61, while XLU’s MACD is bullish, but beginning to show signs of rolling over bearishly in the near-term.
Volumes for the past week were +2.77% above the average volume of the past year (16,541,240 vs. 16,095,135.46) confirming strong sentiment behind the run up to the new 52-week high.
However, it is difficult to gauge if this is due to exuberance from the A.I. craze as market participants piled into the utility companies that will be needed to provide all of the power to data centers, or as a pivot due to the broader market state.
Determining this will be key to understanding how resilient XLU & its components remain in the coming months.
Tuesday of last week came as a gap up session on stable volume, leading to Wednesday & Thursday’s subsequent advances, with Thursday’s high advancing volume being notably above average.
Friday was a risk-off session in anticipation of the weekend, where it looked like there could be a bearish dark cloud cover pattern set up, but XLU was able to close closer to the close of Thursday’s candle, avoiding the bearish sentiment.
Friday’s high volume level should be noted, as it seemed folks were packing in & taking profits before the weekend in anticipation of this week’s PPI, CPI, Fed Speakers & other consumer-centric data releases (details can be found in this week’s market review note).
Monday was an interesting day for XLU, as the session opened higher than Friday, tested above Friday’s high, before venturing lower & ultimately settling at the same price day-over-day as Friday’s session.
Monday’s volume also was well below the volumes of the other days of the past week, adding an even stronger note of uncertainty & indecision on the part of market participants.
In the event of a pull-back in XLU, it is important to note where their support levels are.
The nearest level is at the 10 day moving average at $69.30, before $67.40, $66.08 & a support zone in the $65-66/share range (including the 50 DMA).
When these support levels are tested, the table & data contained below may be useful in your analysis of how strong/weak each will be.
Price Level:Volume Sentiment For XLU, Utilities Select Sector Fund ETF For The Past 4-5 Years
Below is a list of the one year support & resistance levels, with the 10, 50 & 200 day moving averages denoted in bold & the Buyer:Seller sentiment ratio beneath each price level.
The images that follow it list out the volume sentiment for each price level that XLU has traded at over the past 4-5 years.
These ratios can be used to make an assessment about how strong a particular support or resistance level may be, based on how buyers & sellers have behaved there in the recent past.
There is also a list typed out below it with the same table information, where the bold prices indicate a support/resistance level.
Note that due to price extremes (being near the all-time high) some price levels do not have enough data yet & are marked as NULL 0:0*, while other high levels will be skewed towards buyers, as there has not been much in terms of downside tests against them.
Also, ratios with a denominator of 0 are also denoted with an “*”.
This is something that should be kept in mind when working with the data below.
XLU ETF’s Price Level:Volume Sentiment Over The Past 4-5 Years With One Year Support Levels
Breaking Down XLU ETF’s Price Level:Volume Sentiment Over The Past 4-5 Years
XLU ETF’s Price Level:Volume Sentiment Over The Past 4-5 Years
$74 – NULL – 0:0*, +3.83% From Current Price Level
$73 – Buyers – 2.33:1, +2.43% From Current Price Level
$72 – Buyers – 4.5:1, +1.02% From Current Price Level
$71 – Buyers – 1.14:1, -0.38% From Current Price Level – Current Price Box*
$70 – Sellers – 1.05:1, -1.78% From Current Price Level
$69 – Sellers – 1.67:1, -3.19% From Current Price Level – 10 Day Moving Average*
$68 – Buyers – 1.35:1, -4.59% From Current Price Level
$67 – Buyers – 1.5:1, -5.99% From Current Price Level
$66 – Buyers – 1.52:1, -7.39% From Current Price Level
$65 – Buyers – 1.12:1, -8.8% From Current Price Level – 50 Day Moving Average*
$64 – Buyers – 1.29:1, -10.2% From Current Price Level
$63 – Sellers – 1.03:1, -11.6% From Current Price Level
$62 – Sellers- 1.11:1, -13.01% From Current Price Level – 200 Day Moving Average*
$61 – Sellers – 1.01:1, -14.41% From Current Price Level
$60 – Buyers – 1.04:1, -15.81% From Current Price Level
$59 – Sellers – 1.08:1, -17.22% From Current Price Level
$58 – Seller s- 1.09:1, -18.62% From Current Price Level
$57 – Buyers – 1.77:1, -20.02% From Current Price Level
$56 – Buyers – 1.3:1, -21.43% From Current Price Level
$55 – Sellers – 1.11:1, -22.83% From Current Price Level
$54 – Buyers – 1.15:1, -24.23% From Current Price Level
$53 – Buyers – 1.4:1, -25.63% From Current Price Level
$52 – Buyers – 1.5:1, -27.04% From Current Price Level
$51 – Buyers – 1.41:1, -28.44% From Current Price Level
$50 – Buyers – 1.25:1, -29.84% From Current Price Level
$49 – Buyers – 1.04:1, -31.25% From Current Price Level
$48 – Sellers – 1.36:1, -32.65% From Current Price Level
$47 – Buyers – 1.17:1, -34.05% From Current Price Level
$46 – Buyers – 1.5:1, -35.46% From Current Price Level
$45 – Sellers – 1.05:1, -36.86% From Current Price Level
$44 – Buyers – 1.14:1, -38.26% From Current Price Level
$43 – Even – 1:1, -39.67% From Current Price Level
$42 – NULL – 0:0*, -41.07% From Current Price Level
$41 – Sellers – 0.5:0*, -42.47% From Current Price Level
$40 – NULL – 0:0*, -43.88% From Current Price Level
$39 – Sellers – 0.5:0*, -45.28% From Current Price Level
$38 – NULL – 0:0*, -46.68% From Current Price Level
*** I DO NOT OWN SHARES OR OPTIONS CONTRACTS IN XLU AT THE TIME OF PUBLISHING THIS ARTICLE ***