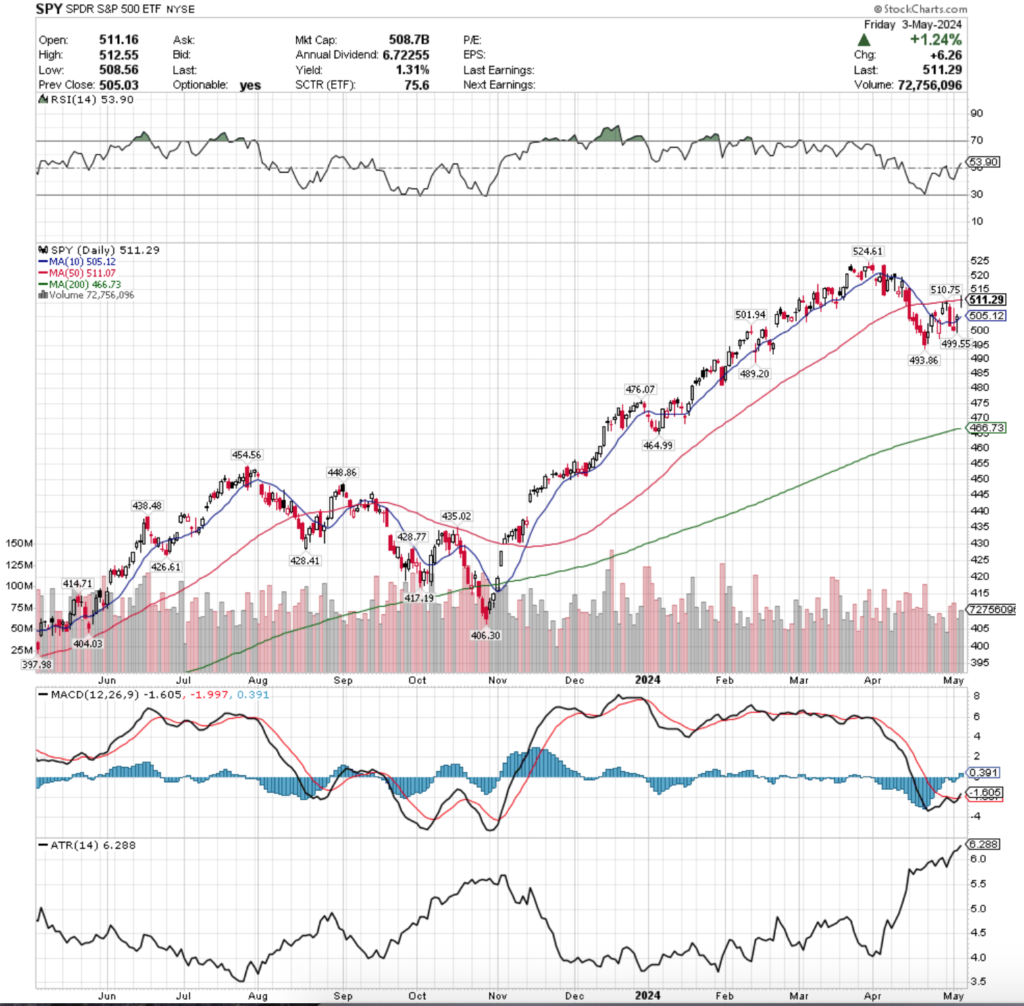
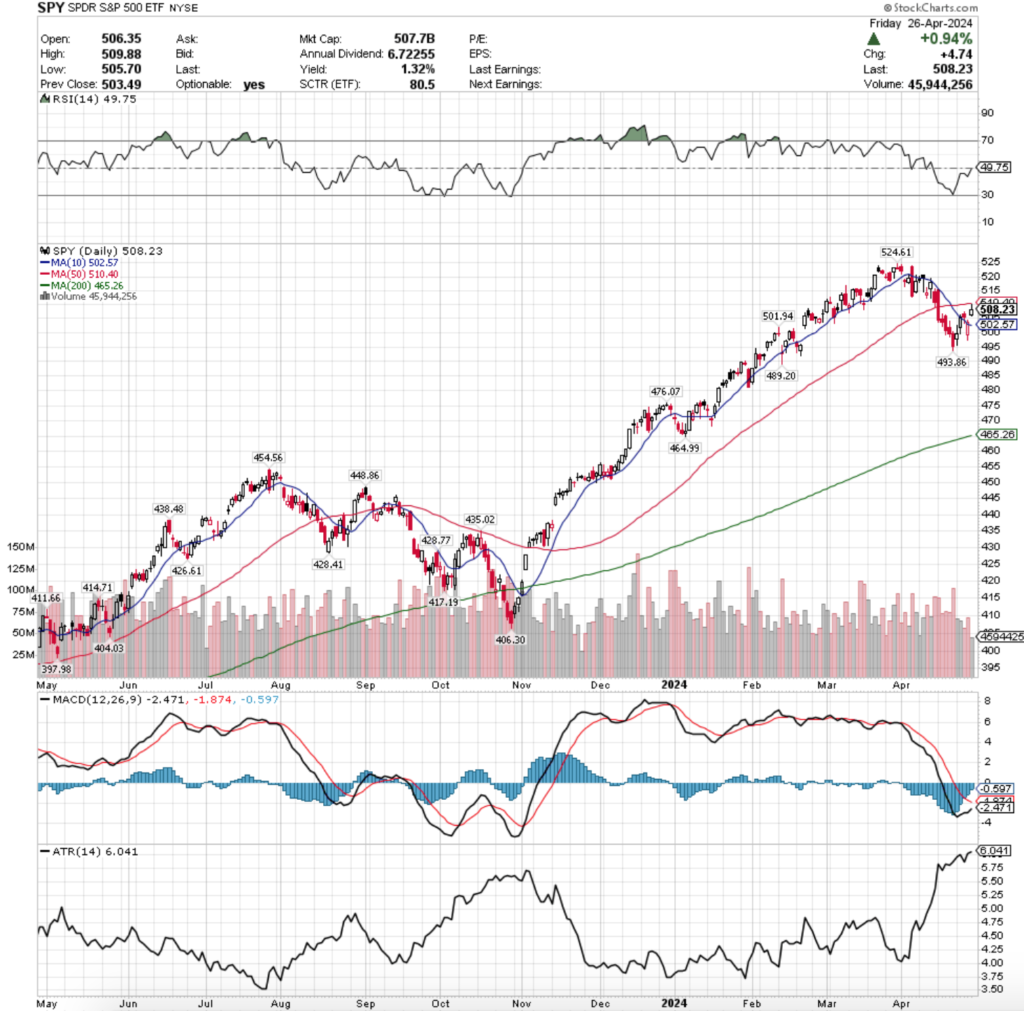
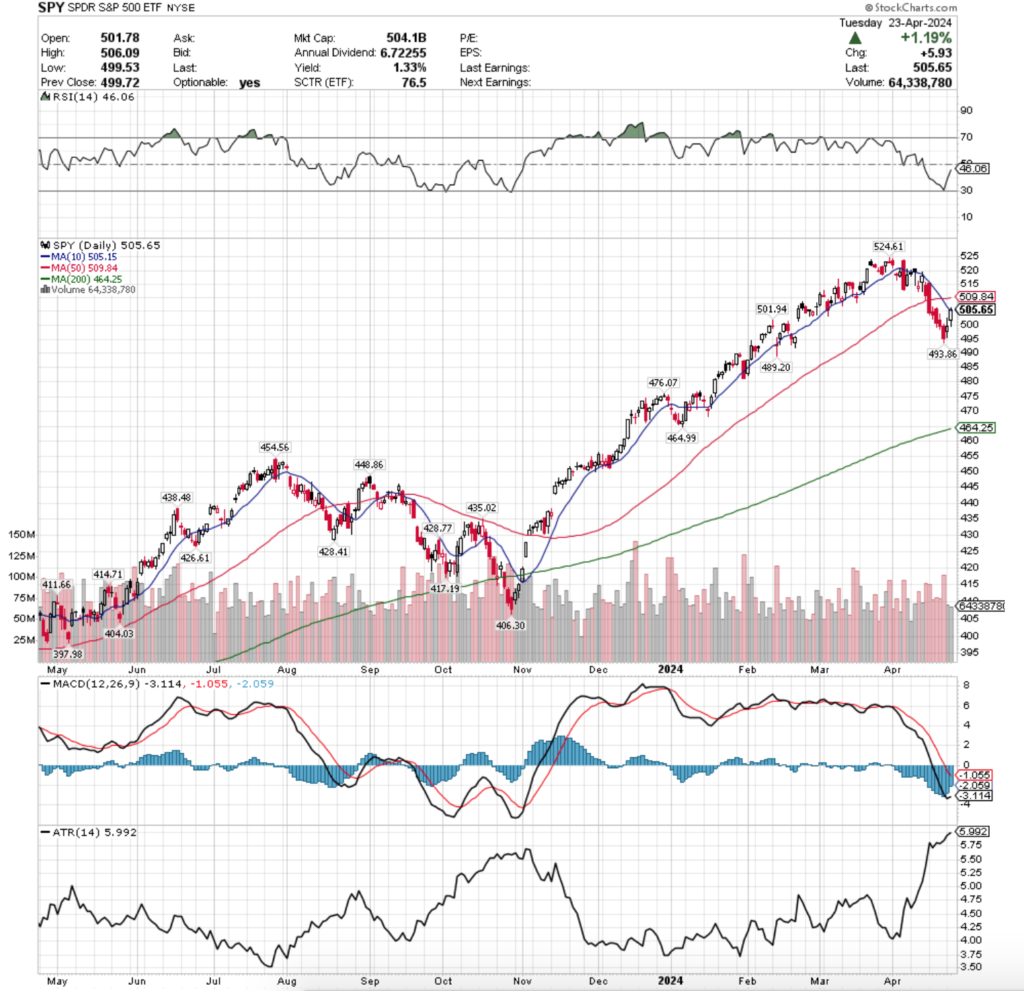
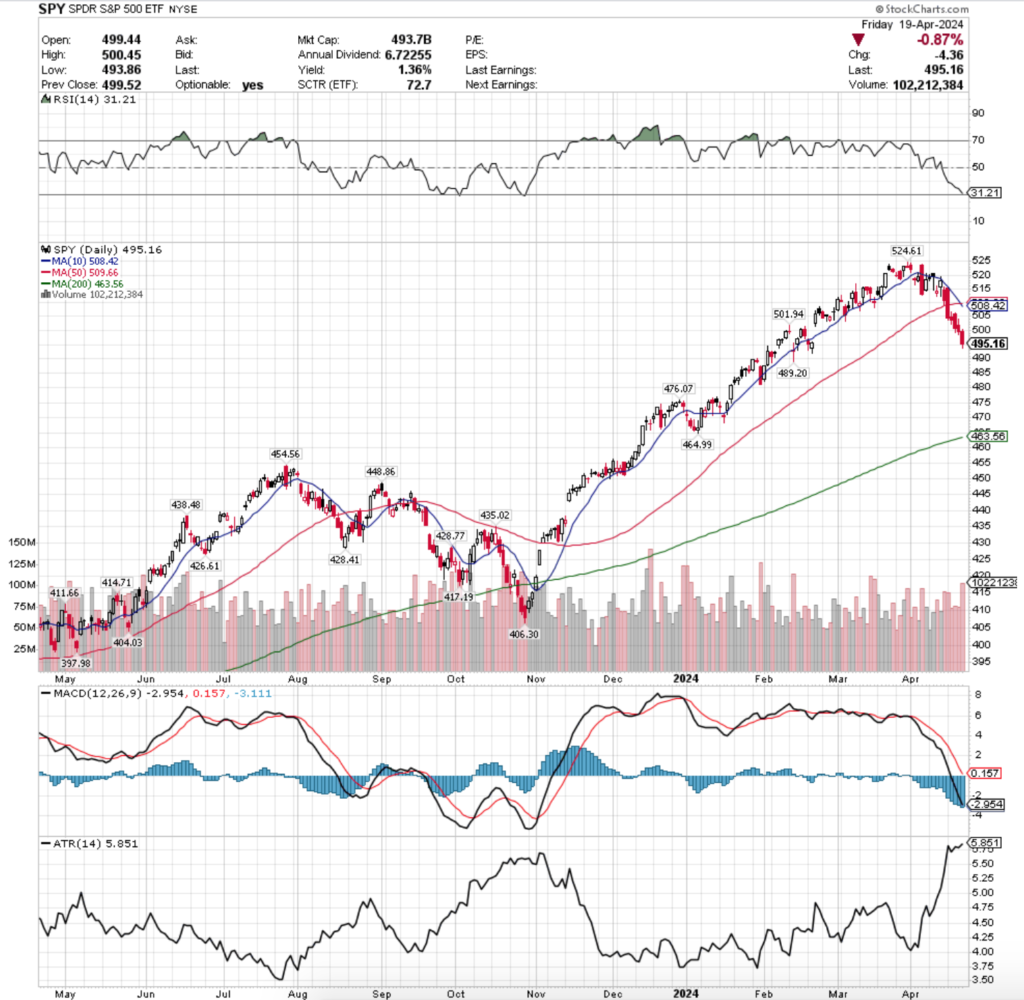
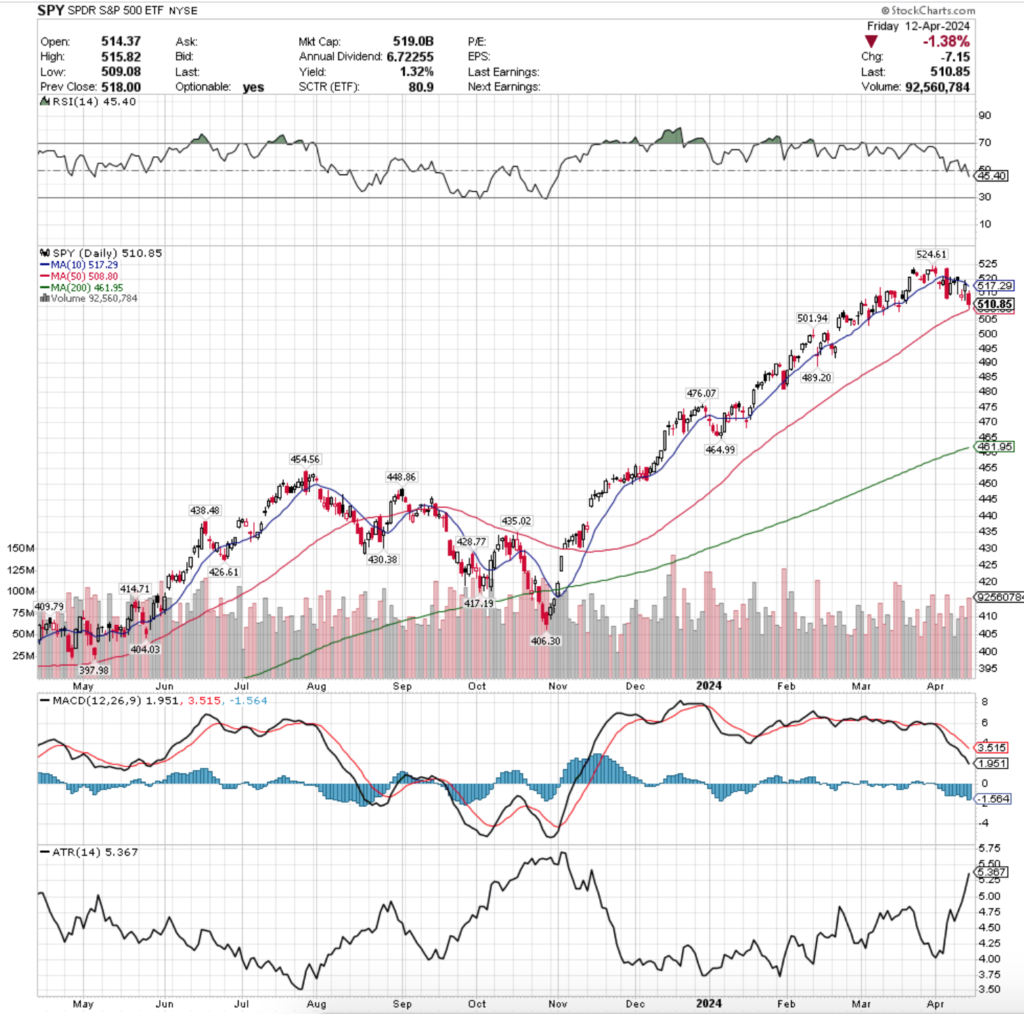
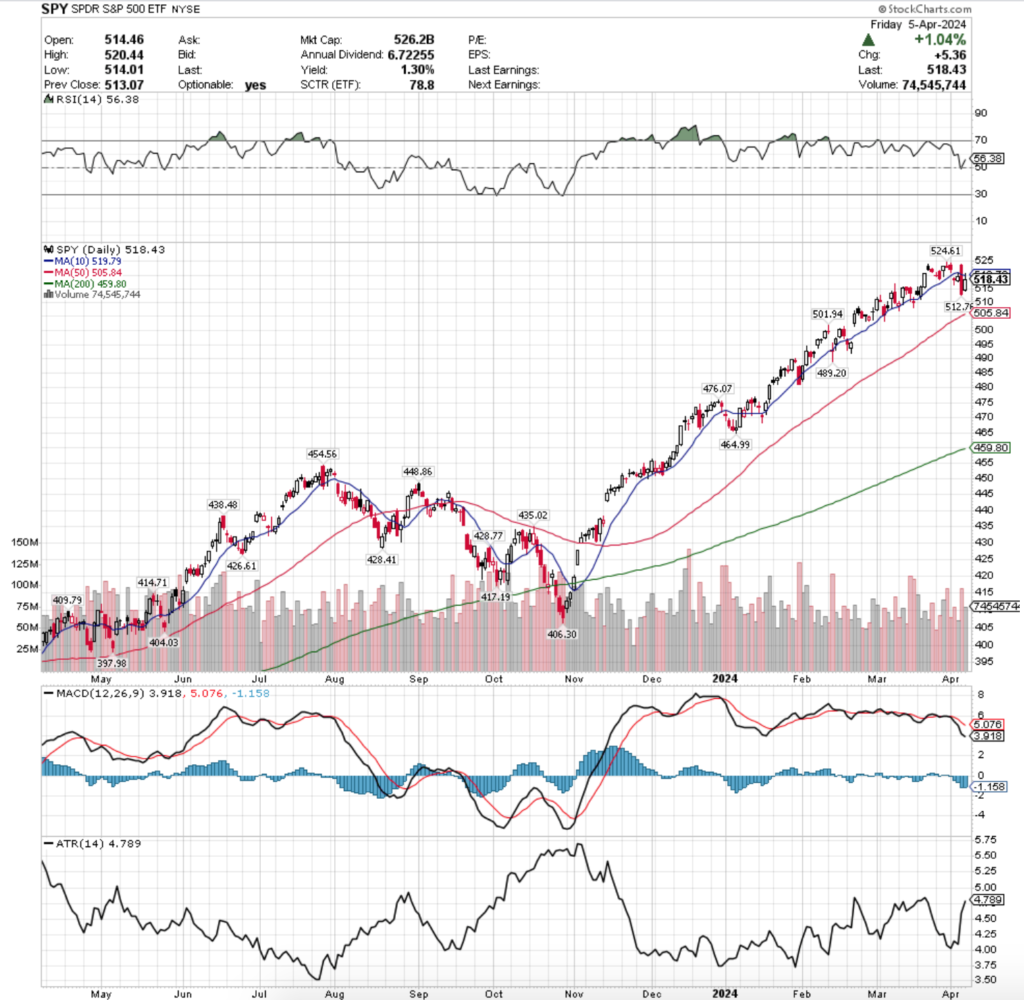
SPY, the SPDR S&P 500 ETF gained +1.87% last week, while the VIX closed the week out at 12.55, implying a one day move of +/-0.79% & a one month move of +/-2.29% as volatility subsided week-over-week & volumes were well below average for the major four indexes.
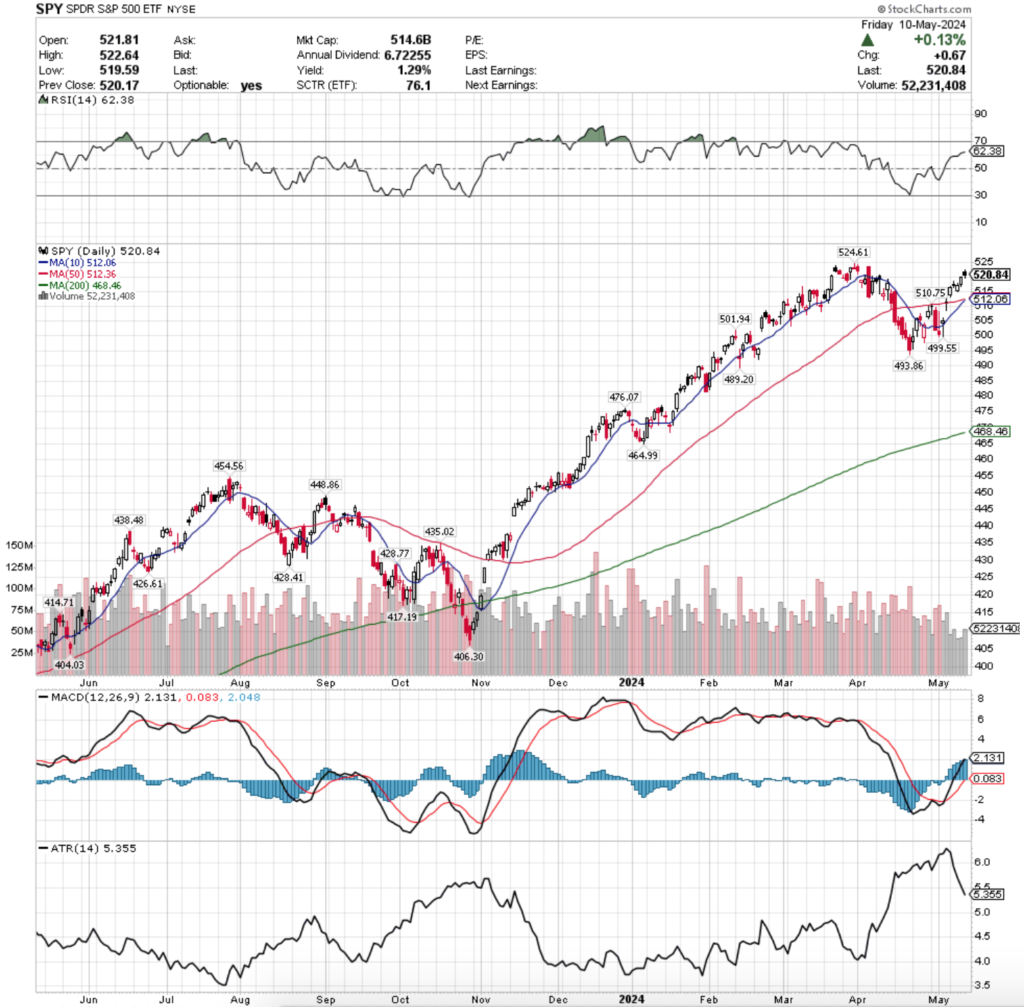
Their RSI is trending towards overbought levels & currently sits at 62.38, while their MACD is bullish, but beginning to show signs of weakness & will be something to keep an eye on heading into next week.
Volumes were -38.16% below average last week compared to the year prior (47,531,860 vs. 76,858,996), indicating severe hesitancy on the part of investors, as all five sessions of the week were advancing.
Monday’s session kicked off the week on an advancing note, but it should be noted that there was some movement to the downside during the session as seen in the lower shadow of the daily candle.
However, due to the way it recovered & rallied higher it set up the rest of the week to continue climbing, even if only on fluffy light volume.
Tuesday showed signs of blood in the water & the truly uncertain & cautious environment for SPY, as the session gapped higher but was only able to close in a doji candle where the real body was contained in the lower 50% of the daily candle & was filled in, as the close was lower than the open (not a gravestone doji though), that formed a bearish dark cloud cover pattern with Monday’s candle.
Tuesday also accounted for the highest volume of the week, which should signal alarms for market participants given how narrow the day’s trading range was in relation to the rest of the week & should be something to be keeping an eye on heading into the new week.
Wednesday reflected that as SPY opened on a gap down but was able to push higher & avoid forming an evening star pattern (bearish).
This should also be an area of concern as it occurred on the lightest volumes of the week, indicating that there was not particularly strong sentiment behind the move.
Thursday was another very low volume session that advanced over a wider range than Wednesday, which is another checkmark in the “not strength” column.
The week closed out on an ominous note, with Friday’s session resulting in a spinning top candle, indicating indecision among market participants.
Friday was the second highest volume of the week, which in this instance has bearish implications, given that the session opened on a gap higher, tested above the open, but ultimately went lower.
In addition to testing lower, the day also closed below its open which is not indicative of strength & strong belief of market participants.
Their Average True Range is reverting back towards the mid-range as there has been a lack of volatility in the past couple of weeks in the wake of a volatile month of April.
Much like last week, a key area for the week ahead will be how the 10 & 50 day moving averages move in relation to prices for SPY.
They’re currently set up for a bullish crossover during Monday’s session (one year chart), but there doesn’t appear to be much strength & belief in SPY’s prices at these levels.
This makes it worth taking a look on the chart above to back in September of 2023, when SPY had just recovered from a -5.75% tumble, but was unable to reach back to the previous high of two months prior.
Additionally, note the way that the 10 & 50 day moving averages were behaving then.
Peak to trough in the March-April 2024 decline was -5.86% & while the more recent run up to the 52-week (also all-time) high has come closer to reaching the peak than the July-August/September 2023 attempt, volumes have been lower during the climb.
The groundhog saw his shadow then & may well be looking at it again this week, when there are earnings due from Home Depot & Walmart that will shed insight into the state of consumers, in additional to inflation data readings from the PPI (Tuesday) & CPI (Wednesday).
Any weak signals in those reports & data announcements will create a spike in volatility (Average True Range, as noted last week) & likely set up a long couple of months ahead of us for SPY.
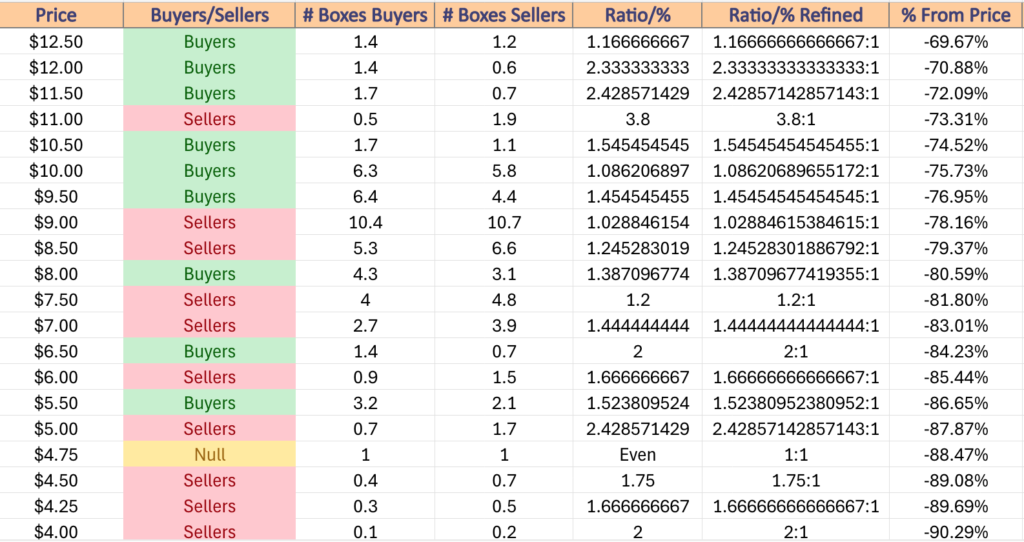
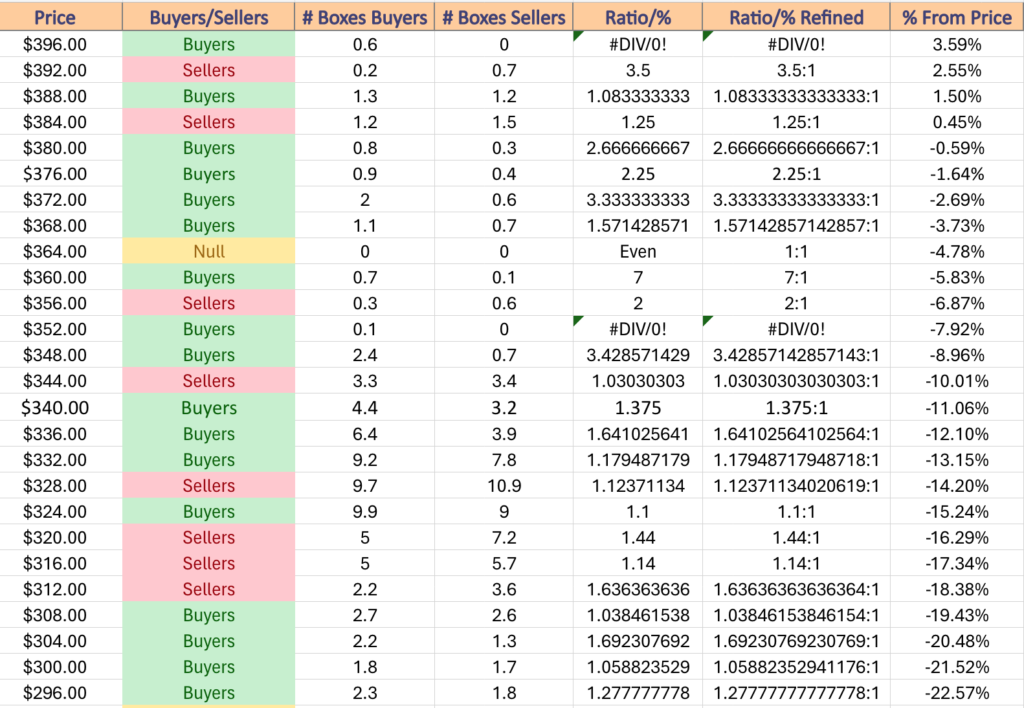
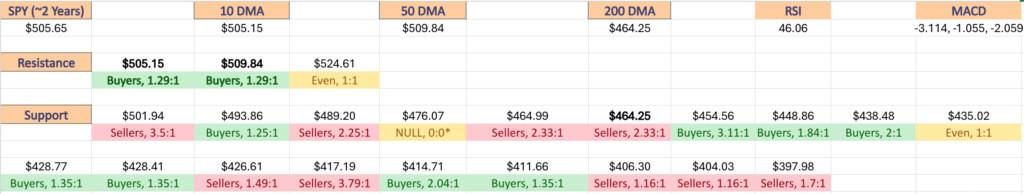
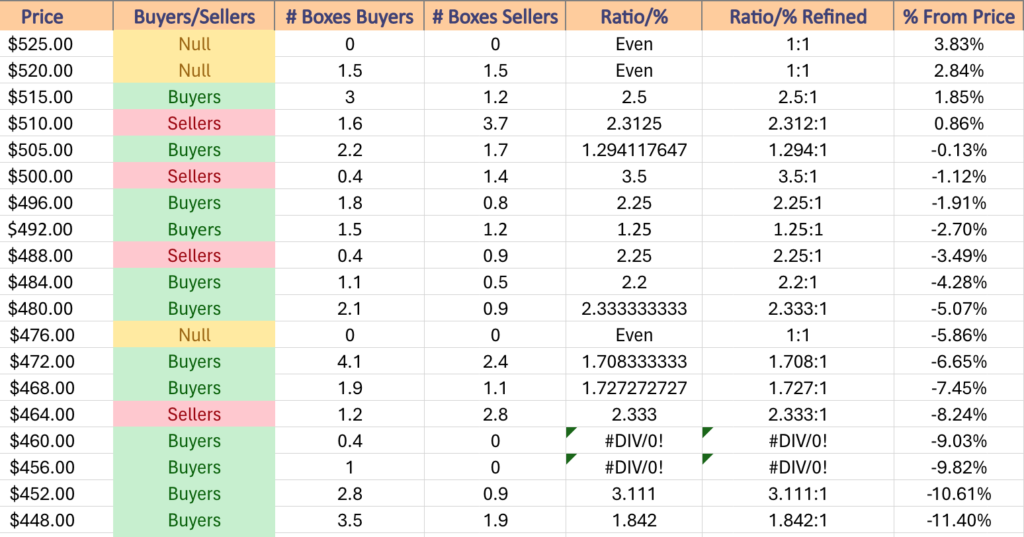
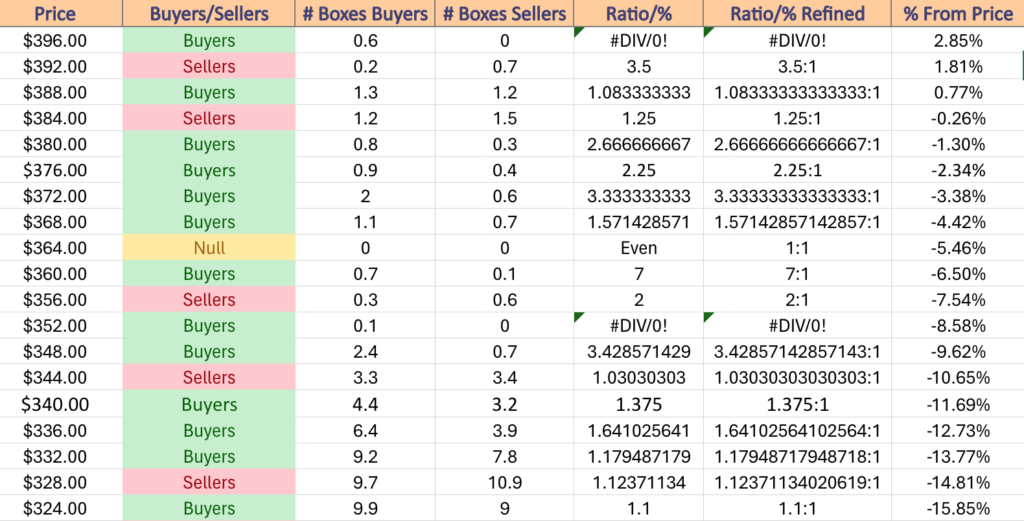
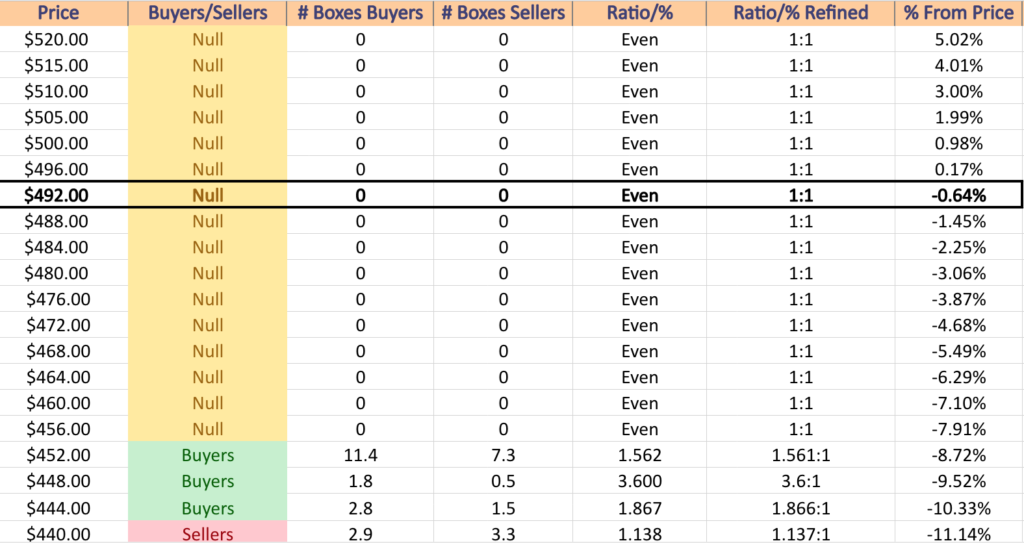
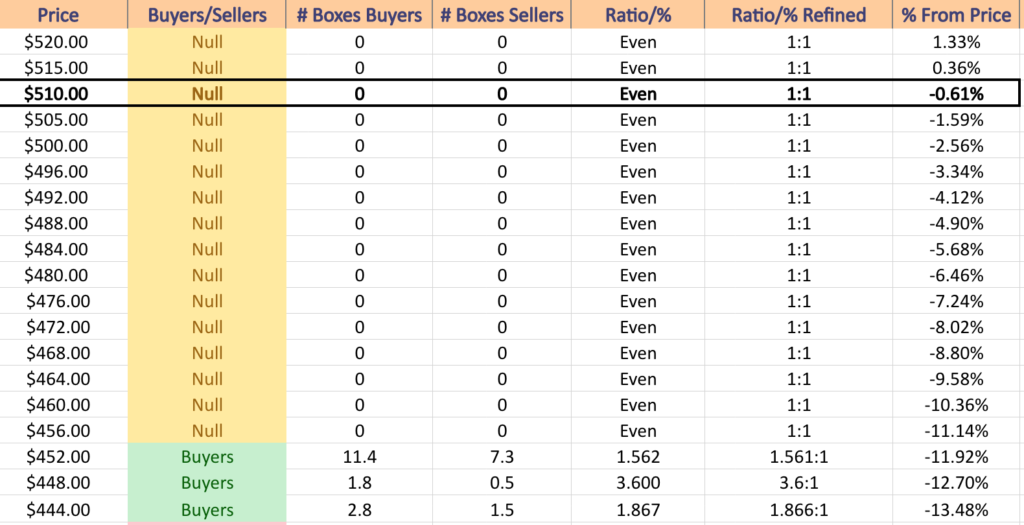
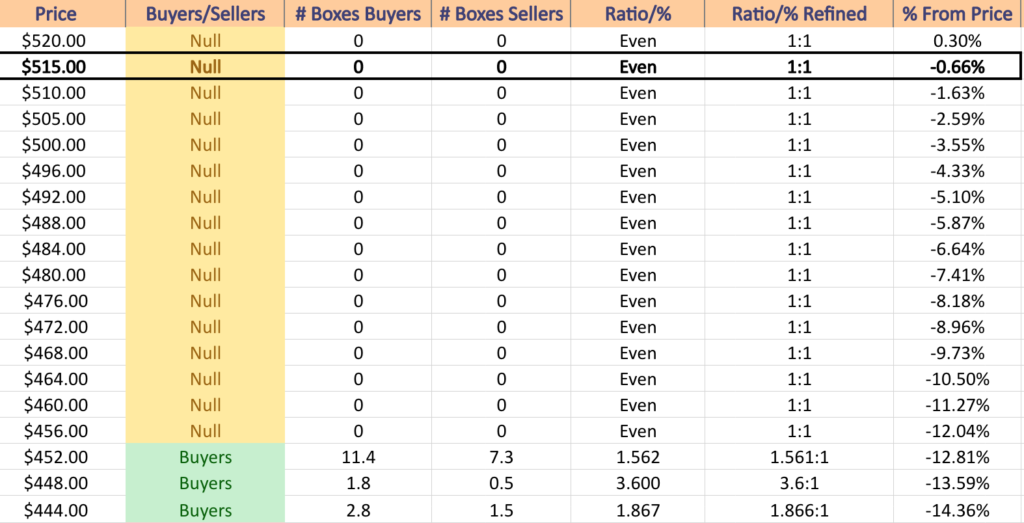
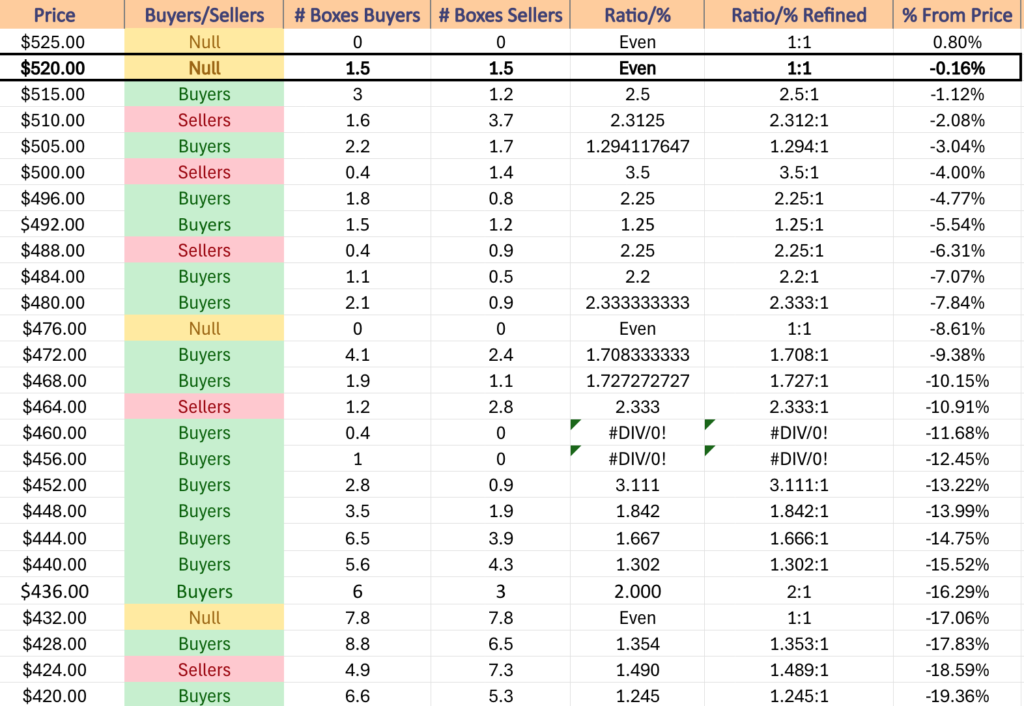
This leads us to looking at support levels & the volume sentiment at each over the past 1-2 years, which as shown below do have some strong historic selling sentiment within the next -3-4% lower, where all of SPY’s nearby support levels reside.
It will be another key area to watch heading into next week.
SPY has support at the $512.36 (50 Day Moving Average, Volume Sentiment: Sellers, 2.31:1), $512.06 (10 Day Moving Average, Volume Sentiment: Sellers, 2.31:1), $510.75 (Volume Sentiment: Sellers, 2.31:1) & $501.94/share (Volume Sentiment: Sellers, 3.5:1) price levels, with resistance at the $524.61/share (All-Time High, Volume Sentiment: Even, 1:1) price levels.
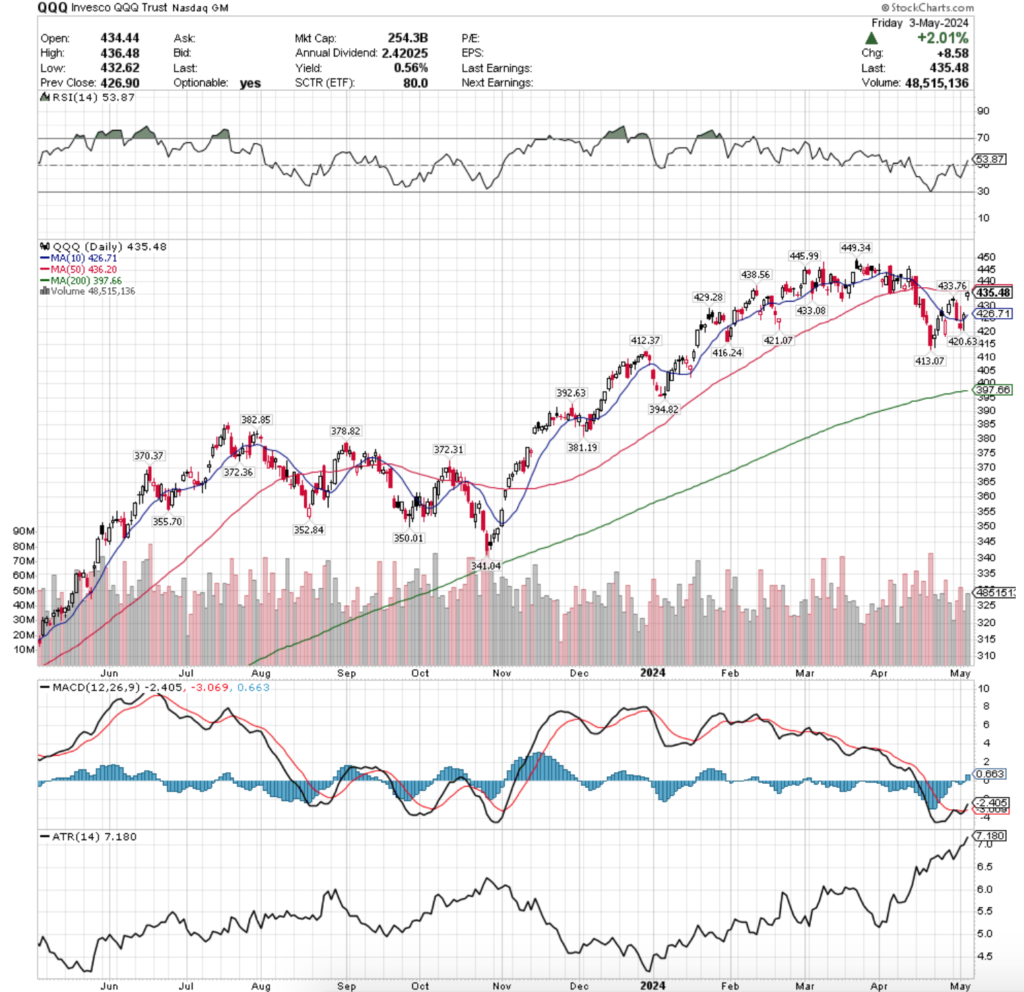
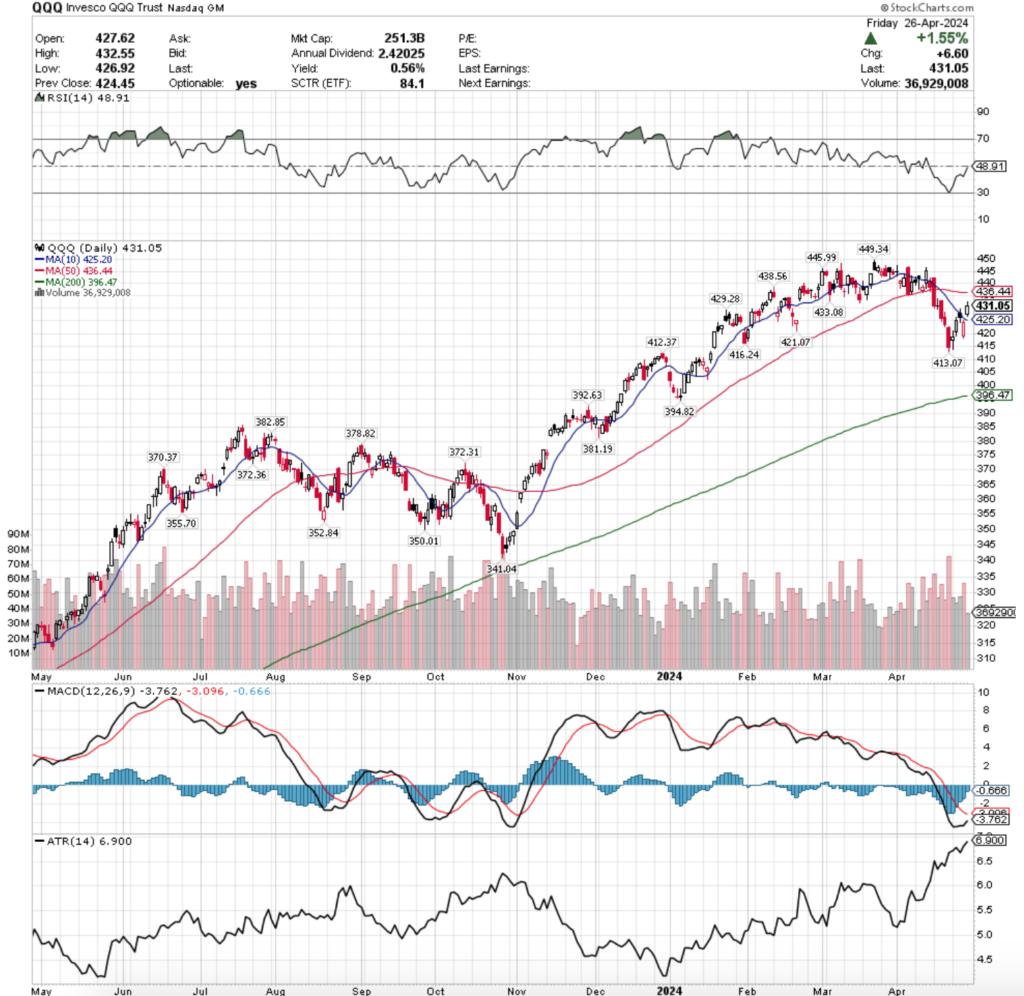
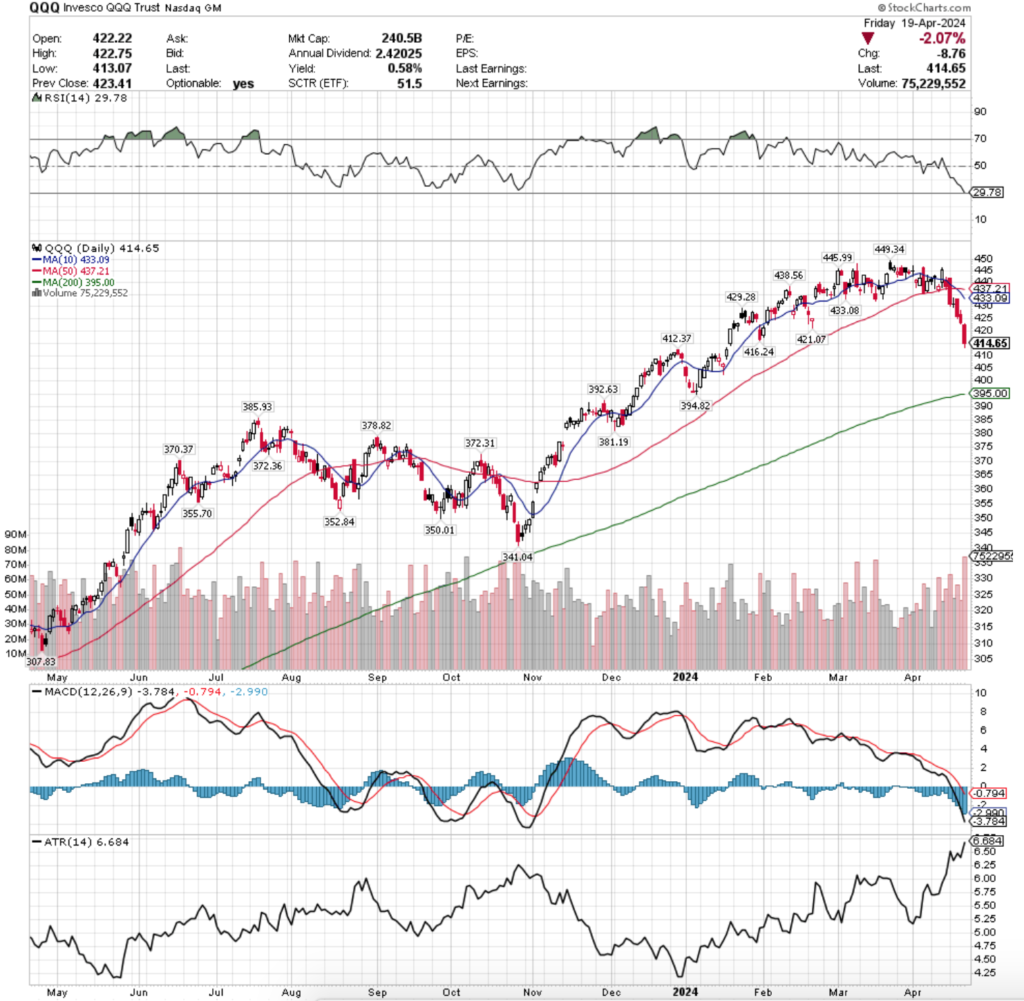
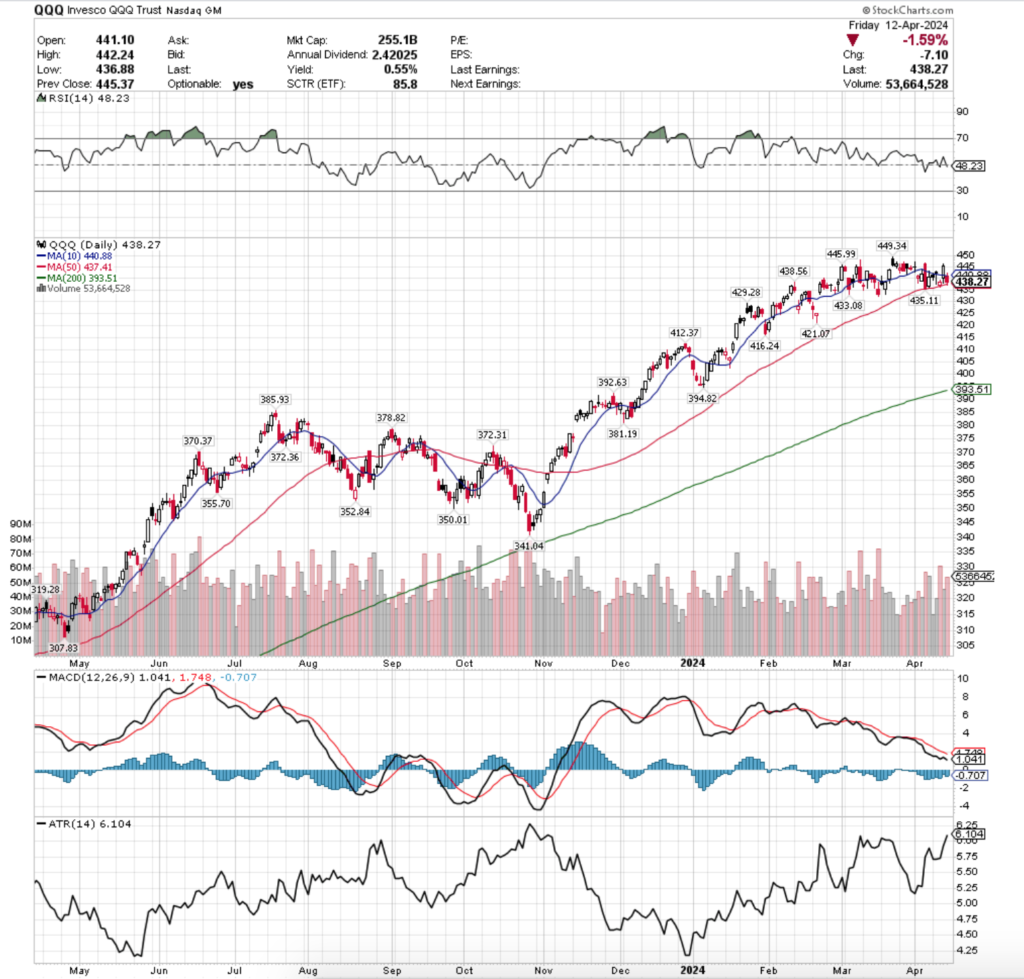
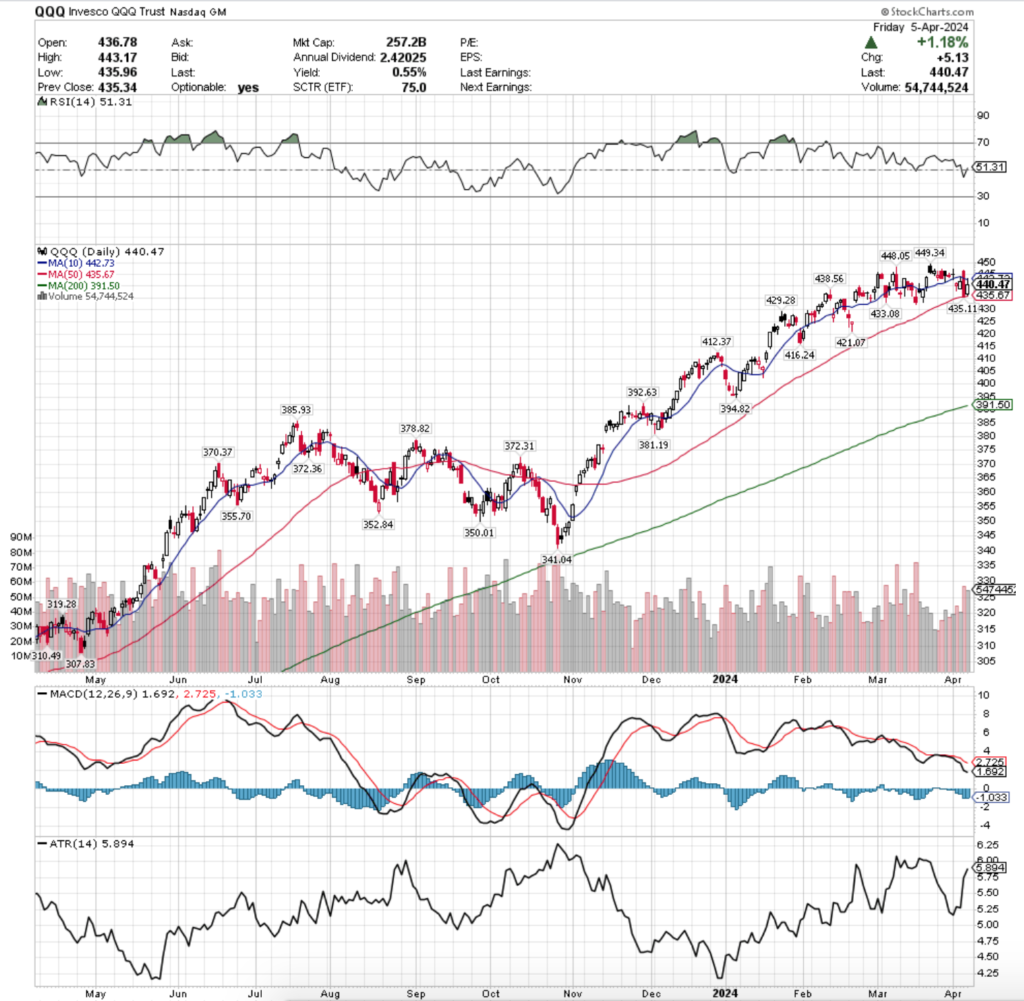
QQQ, the Invesco QQQ Trust ETF that tracks the NASDAQ 100, climbed +1.51% last week, also joining SPY with “participation trophy” volumes that were not indicating strong sentiment among market participants.
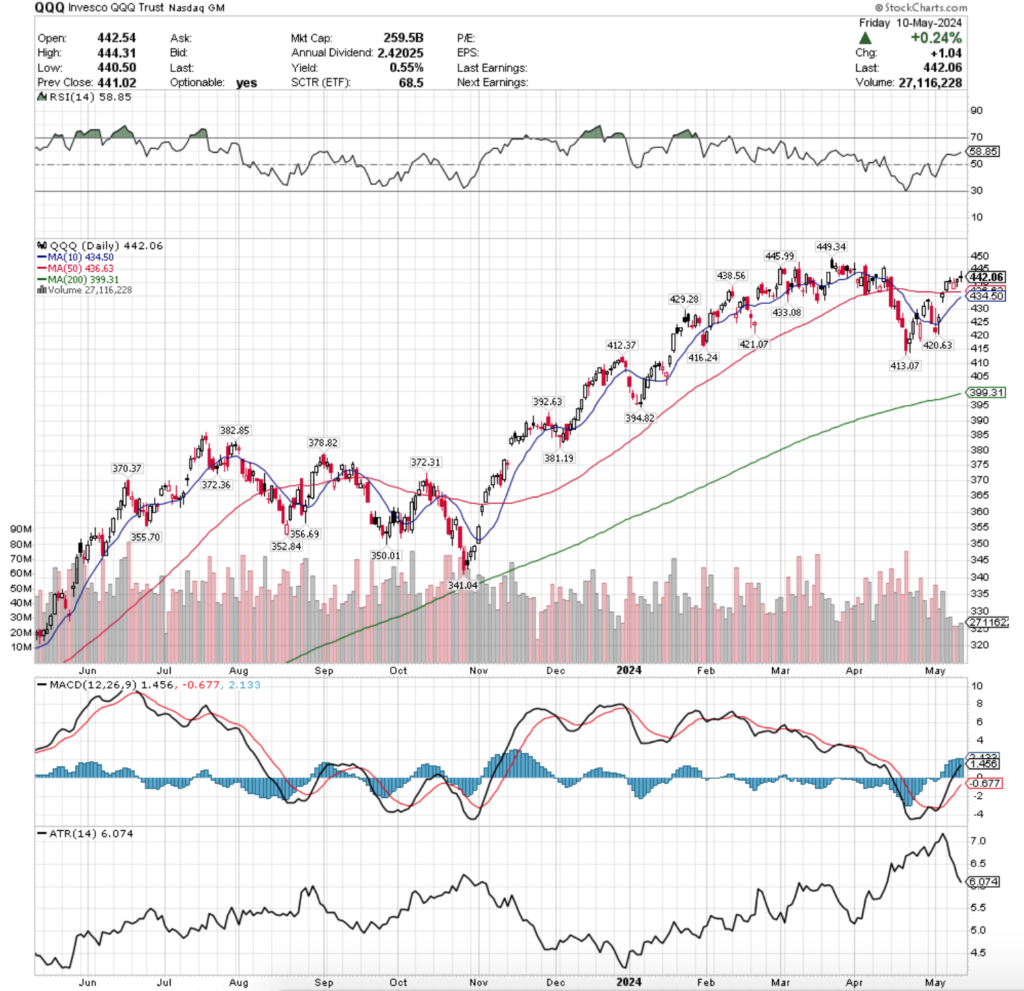
Their RSI is currently at 58.85 & their MACD is bullish, but beginning to show signs of potentially curling over bearishly in the near-term.
Volumes were a meager -43.08% below average compared to the year prior’s average (27,553,400 vs. 48,404,862), making QQQ the weakest volume of the week among the major four indexes.
Monday showed that the strength of the 50 day moving average’s support was still alive & well, opening just above it, testing lower but ultimately rallying back to close on an advance.
Tuesday looked suspiciously like SPY’s day, with the highest volume of the (weak) week resulting in a doji that closed below the open & in the lower half of the day’s total range.
Things got interesting on Wednesday, where the second lightest volume of the week resulted in a gap down that ultimately was able to work its way up & close higher, albeit on extraordinarily weak volume.
Another particularly interesting point with Wednesday’s candle is that if it was a filled in red real body it would be considered an evening star pattern, which is bearish.
This too is eerily similar to SPY’s situation last week (except SPY advanced that day, while QQQ declined) & while the minor pump into the end of the week was facilitated by Wednesday’s outcome, it still has a bearish sentiment written all over it.
Thursday opened higher, tested well lower into the mid-section of Wednesday’s candle’s real body & resulted in a hanging man candle as it was able to close higher than it opened; it should be noted that this all occurred on the weakest volume of the week.
The volume story for QQQ is similar to SPY, participation trophy levels that don’t add conviction to the moves higher that each index ETF made.
Friday closed the week out doubling down on the notes of uncertainty that we’d seen all week.
Muted volume on a long-legged doji candle that closed below the opening price isn’t a recipe that the bulls tend to want any part of.
Their Average True Range is downtrending back towards the median of its range due to the lack of volatility over the past two weeks, much like SPY’s.
Much like SPY’s timeframe comparison above, it is worth revisiting how QQQ behaved in the July-October 2023 time period.
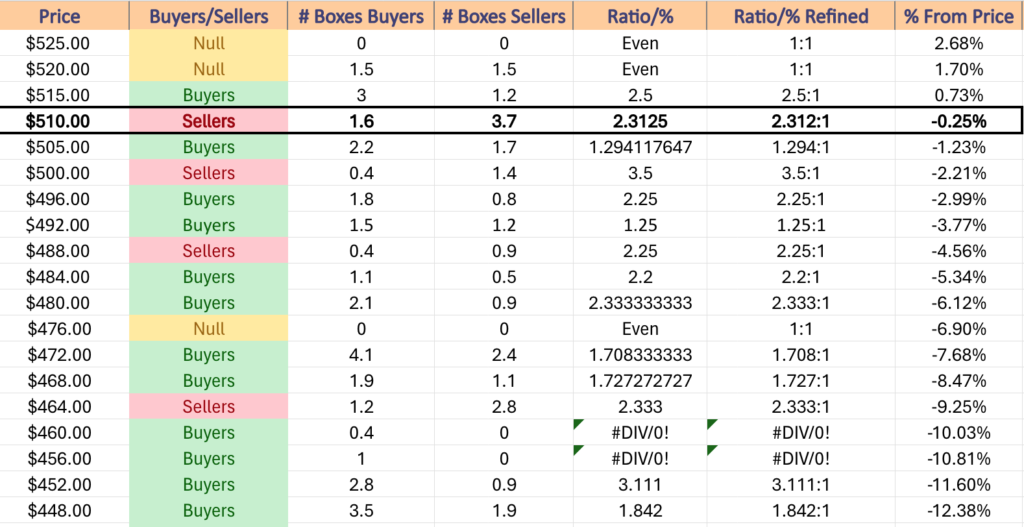
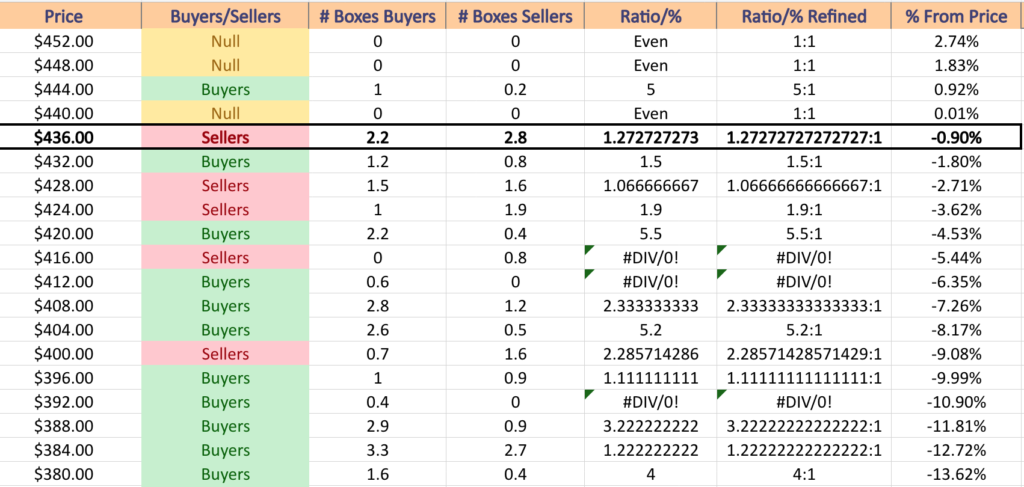
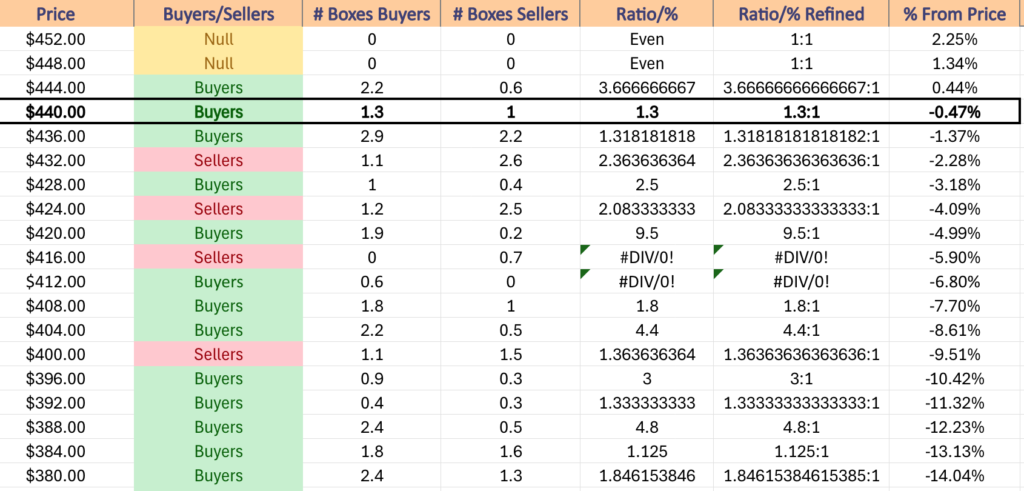
One notable difference is that QQQ has more support levels nearby than SPY which may prove beneficial for them, particularly as there should be an anticipated pump running up to the NVDA earnings report on May 22, regardless of what this week’s data tells us.
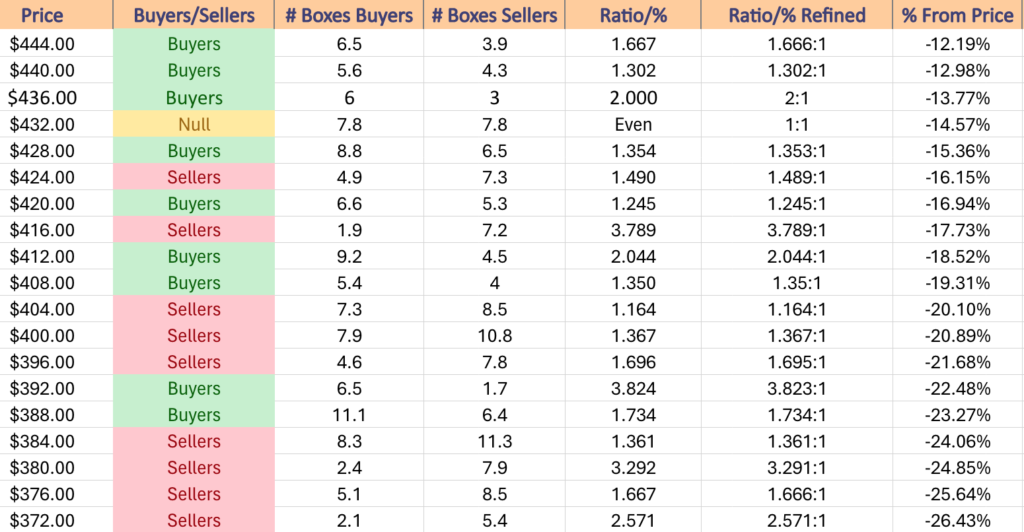
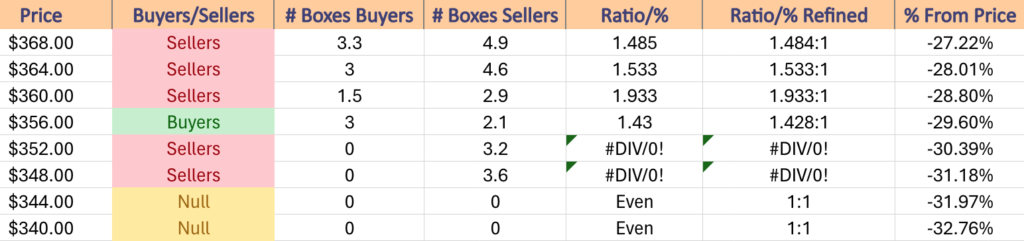
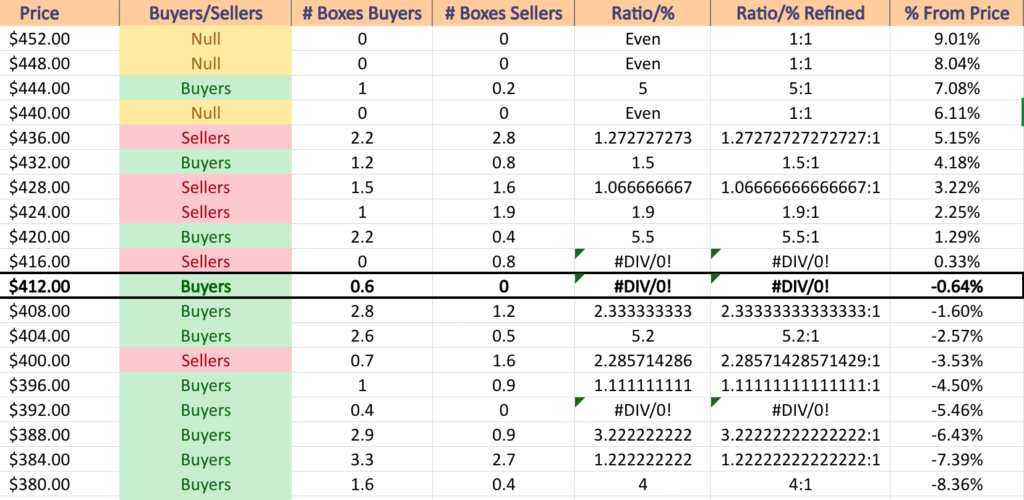
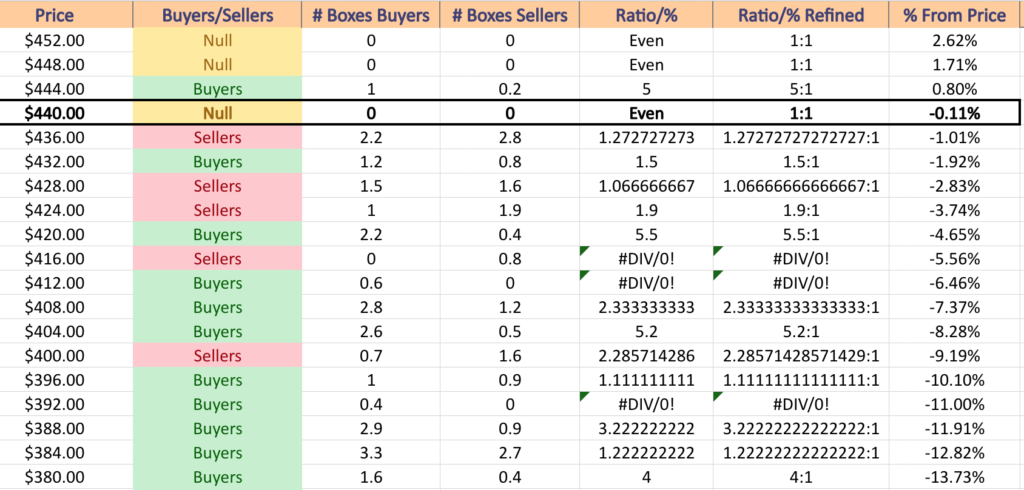
There is also a similar amount of local selling sentiment for QQQ as was the case with SPY, although their past few months’ more rangebound activity than SPY’s does provide a little extra support from buyer-centric volume.
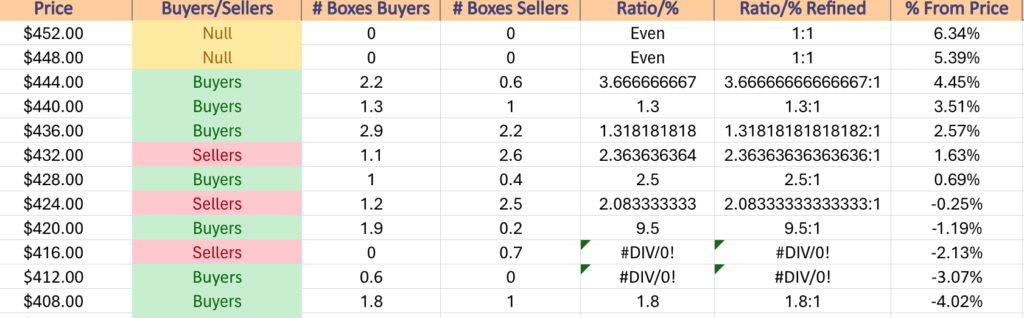
It should be noted though that at extreme price levels like this that data will be skewed towards the buyers, which may make the buyer strength mislead due to a lack of downwards tests for the high price levels.
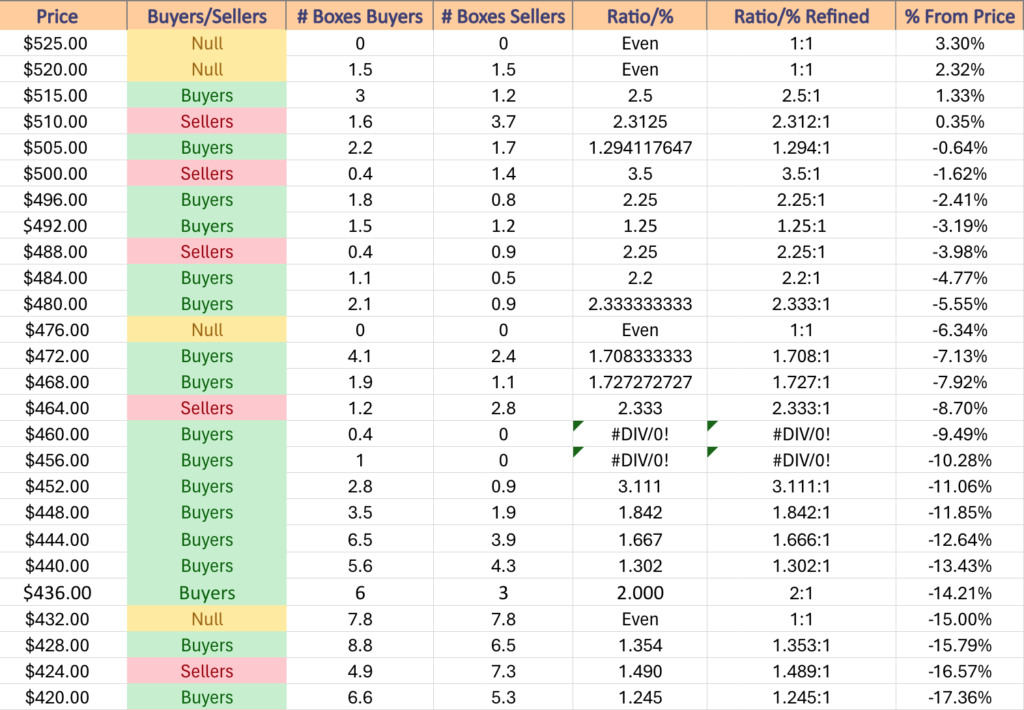
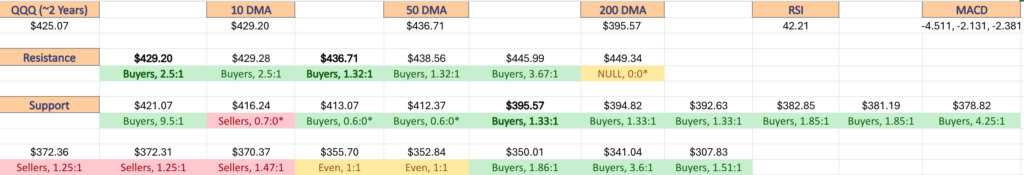
QQQ has support at the $438.56 (Volume Sentiment: Buyers, 1.32:1), $436.63 (50 Day Moving Average, Volume Sentiment: Buyers, 1.32:1), $434.50 (10 Day Moving Average, Volume Sentiment: Sellers, 2.36:1) & $433.08/share (Volume Sentiment: Sellers, 2.36:1) price levels, with resistance at the $445.99 (Volume Sentiment: Buyers, 3.67:1) & $449.34/share (All-Time High, Volume Sentiment: NULL, 0:0*) price levels.
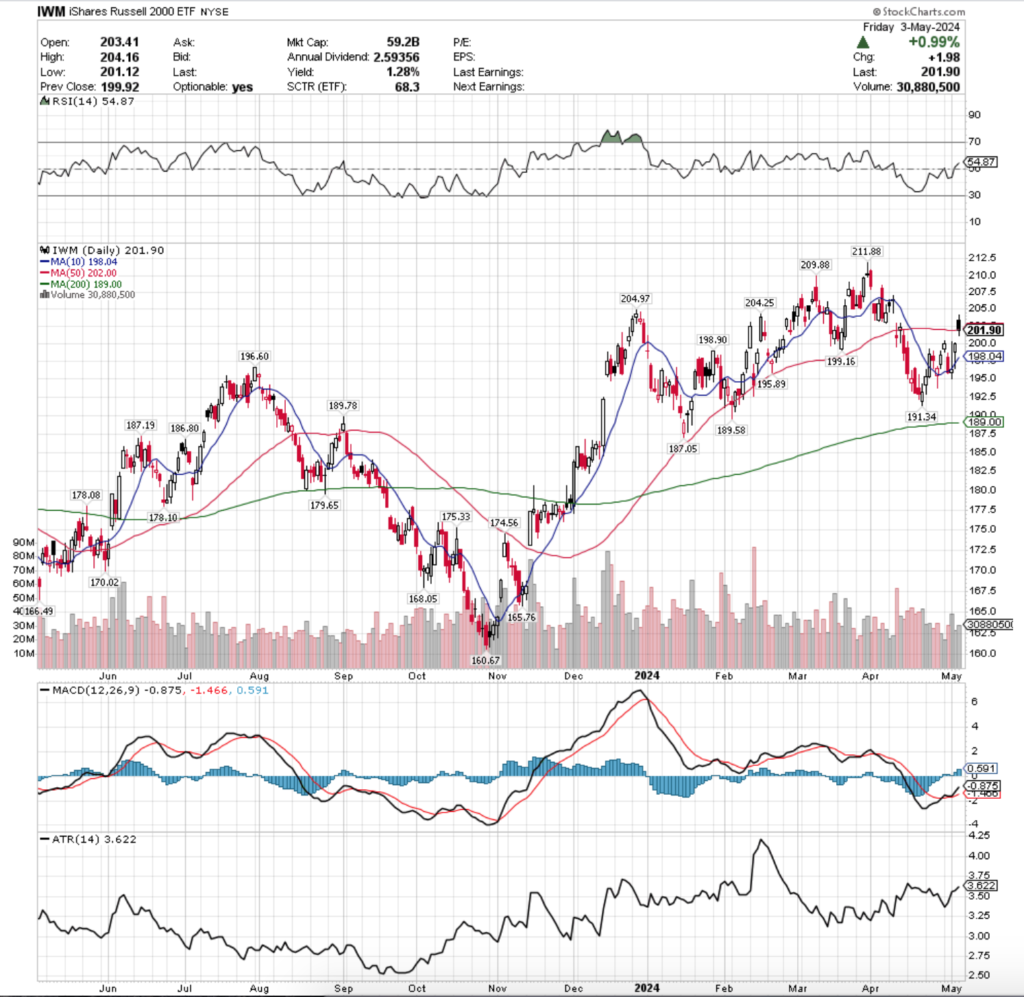
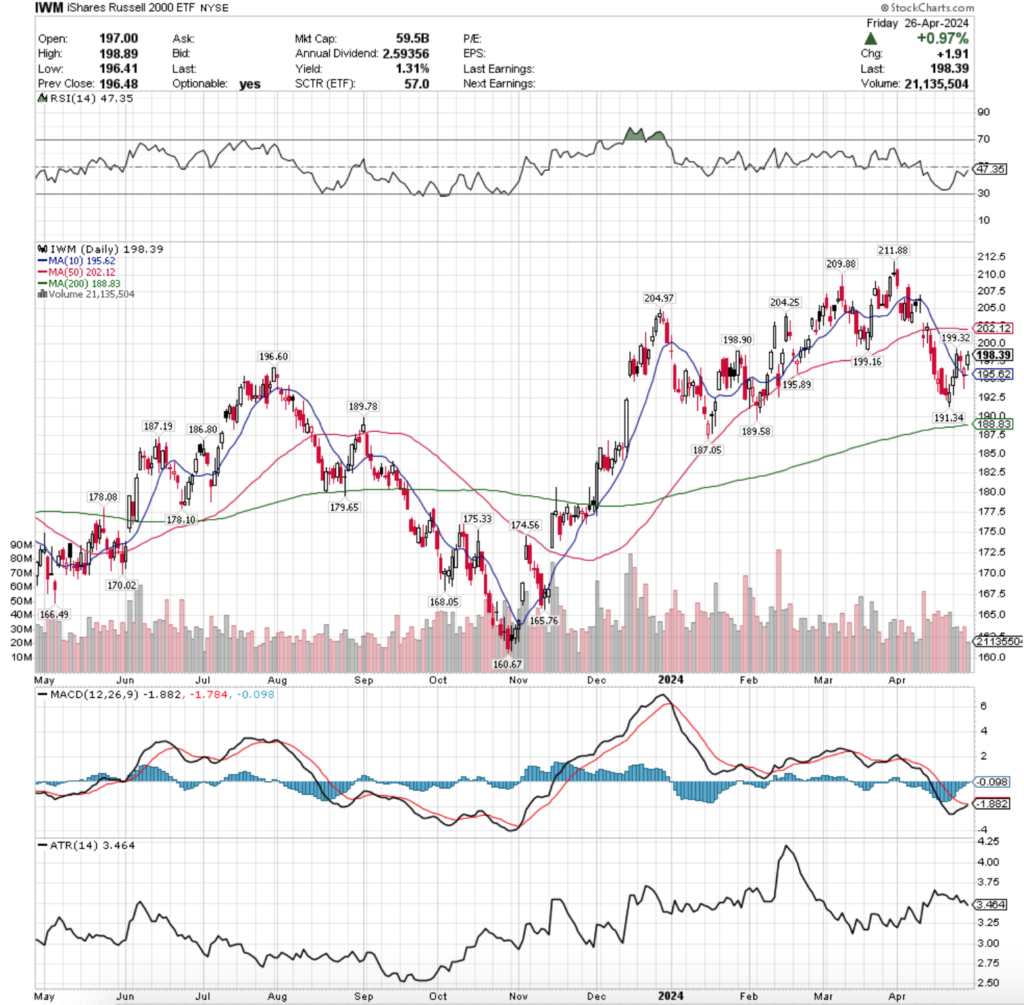
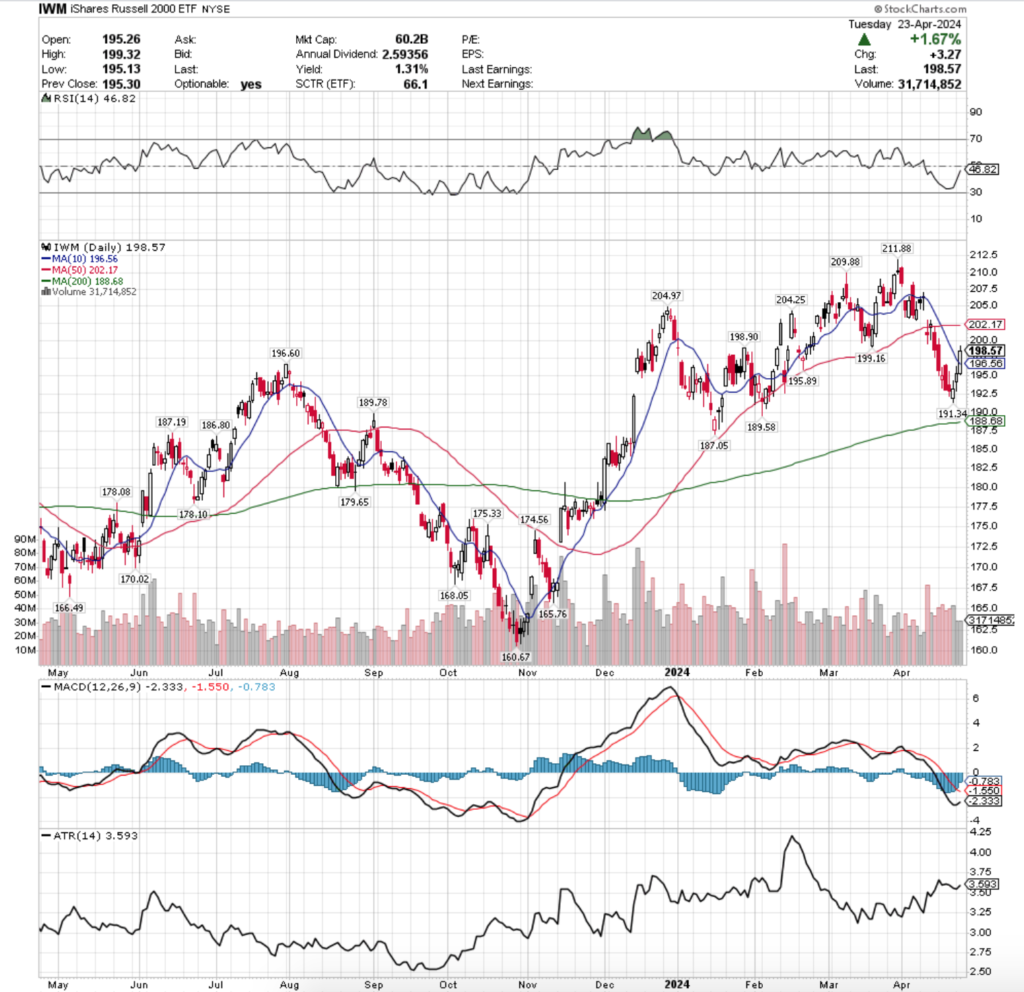
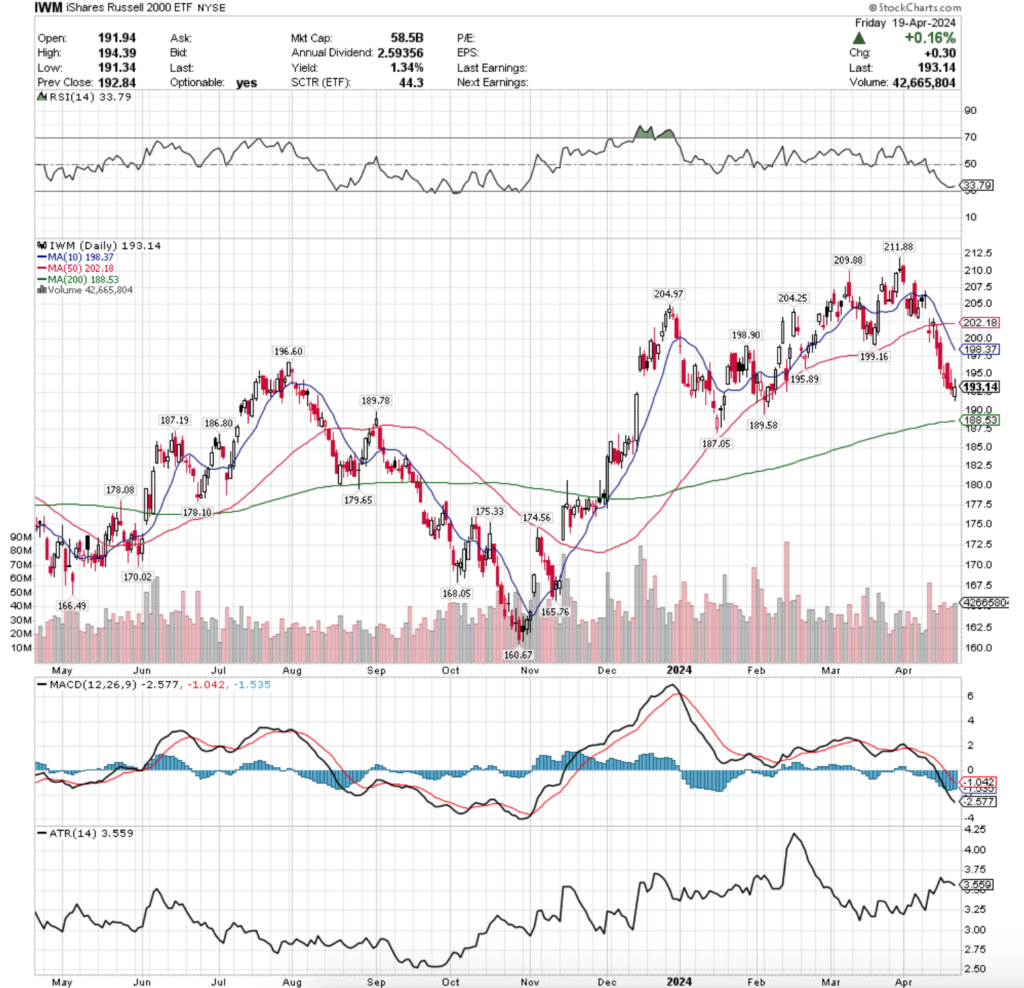
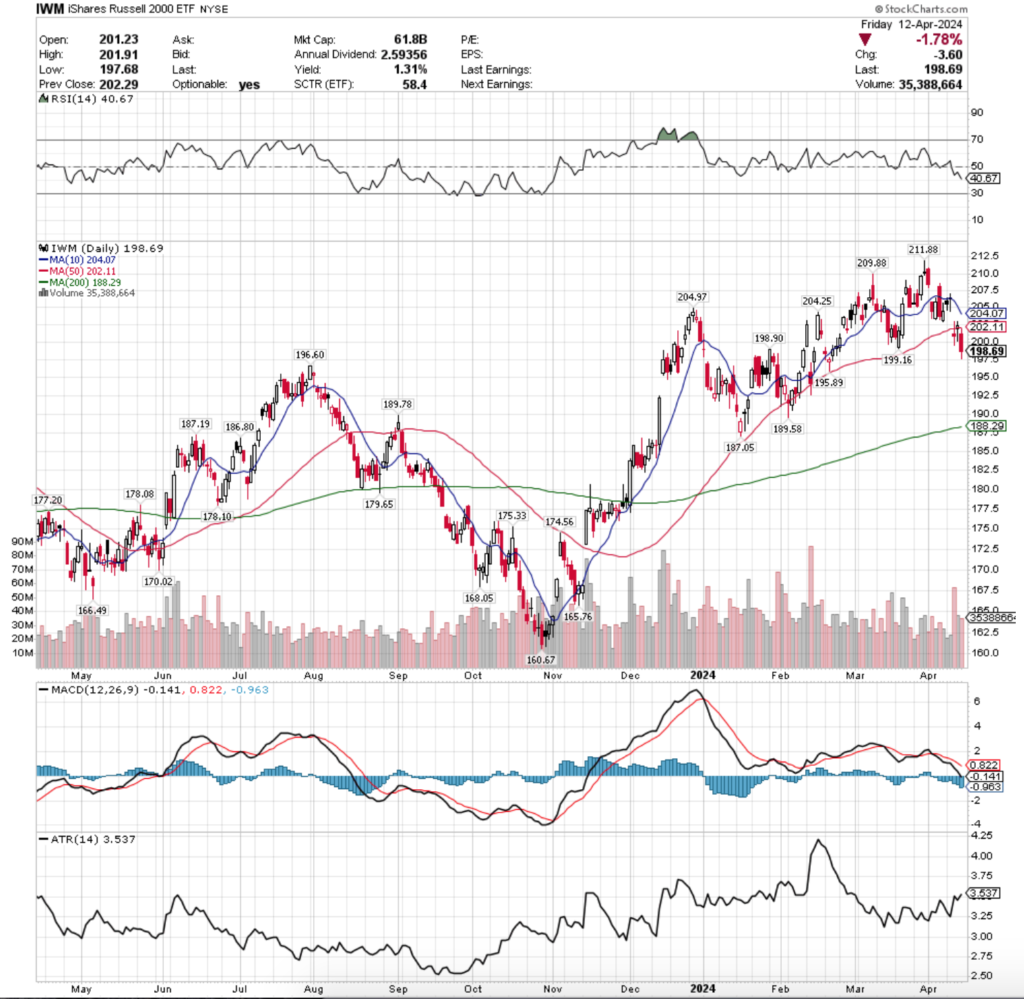
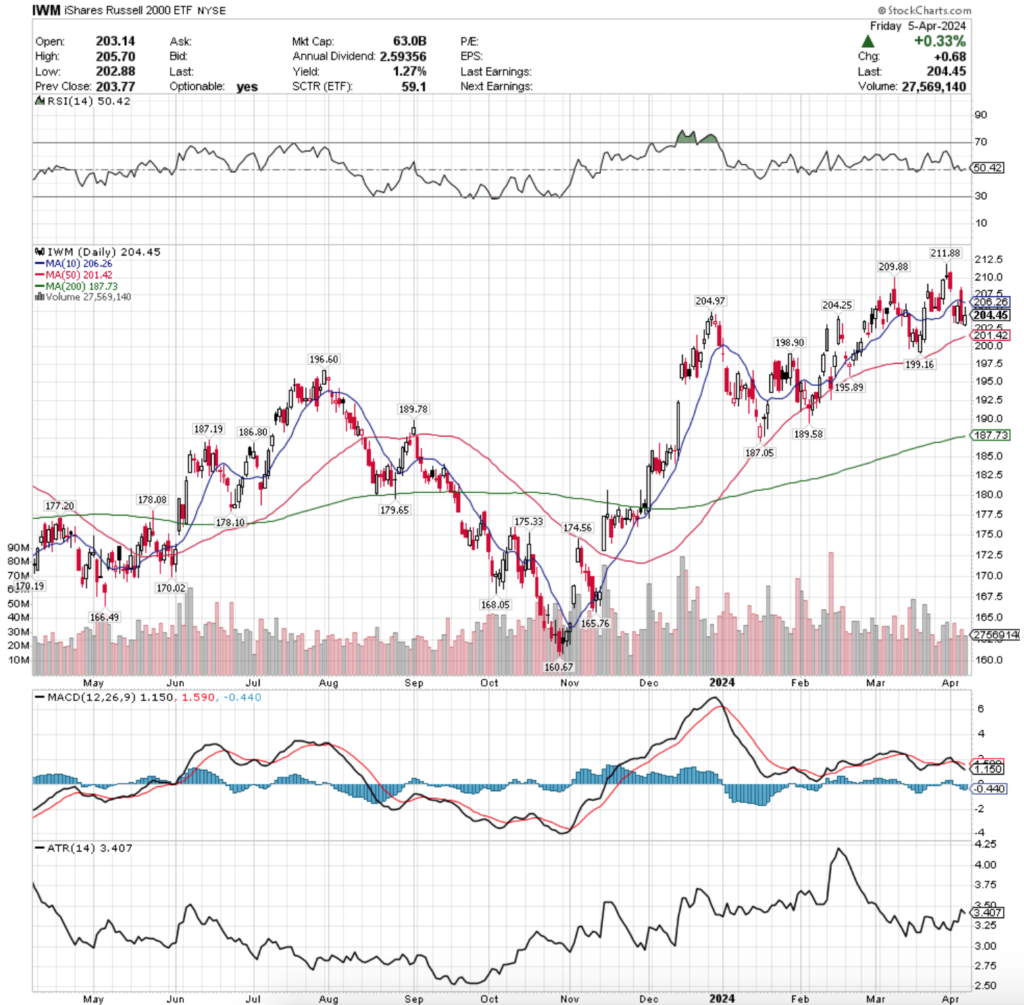
IWM, the iShares Russell 2000 ETF was the least favorite of the major four indexes last week, adding +1.19% for the week.
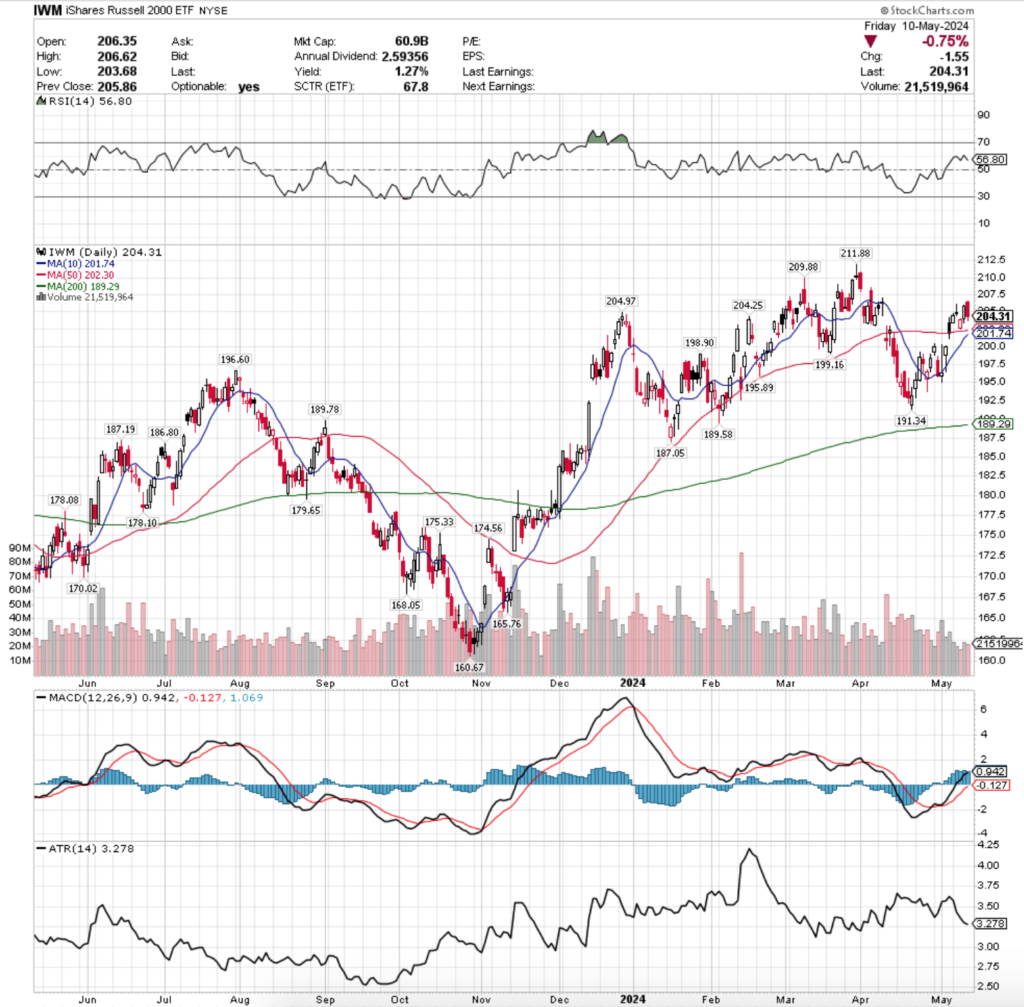
Their RSI is at 56.8, while their MACD is still bullish but beginning to show signs of weakening in the near-term.
Volumes were -38.76% below average last week compared to the year prior (21,202,560 vs. 34,624,259), as much like SPY & QQQ market participants were not enthusiastic about the leg upward at all.
Monday opened the week up with a move higher on the week’s highest volume, setting the stage for the rest of the week to climb higher.
Tuesday’s gravestone doji candle established that there would not be much more room to run higher for IWM though throughout the rest of the week, which Wednesday confirmed.
Wednesday gapped lower on the open, nearing the 50 day moving average, but the 50 DMA provided adequate support & prices pushed higher to close above their open, but like SPY & QQQ on the weakest volume of the week.
Thursday showed a glimmer of hope for bulls, as there was a move higher for IWM on the week’s second highest volume, however a risk off move into the weekend was in store for Friday.
Friday also showed there was more downside appetite for IWM, as their lower shadow pushed below Thursday’s opening price & midway down Thursday’s lower shadow, indicating that there was more bearish sentiment than bullish for the day.
Their Average True Range is just below the middle of its current range, but is beginning to turn upwards following Friday’s bearish -0.75% declining session & should continue to rise if the volatility persists.
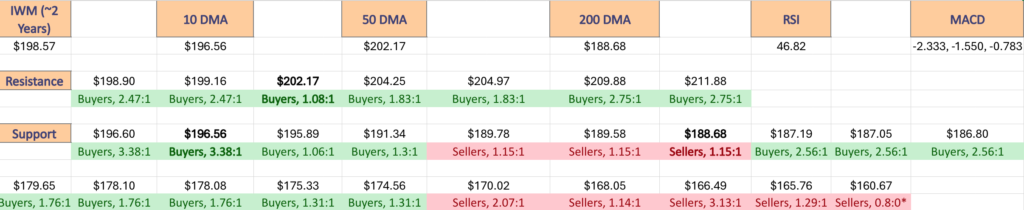
IWM is also resembling the same July-October 2023 period mentioned for SPY & QQQ, but its 10 DMA has come much closer to the 50 DMA recently compared to then, which will be an area to keep a watch on this week.
With that said, IWM will have a bullish 10 & 50 day moving average crossover in the next 1-2 days, pending no large gap downs to open the week, but how long it will be able to rally & stay above the 50 DMA is yet to be seen.
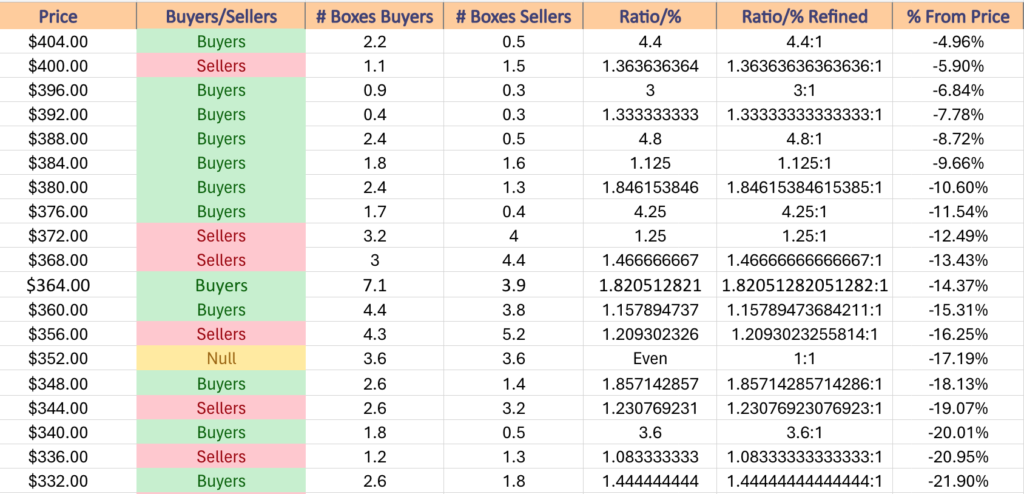
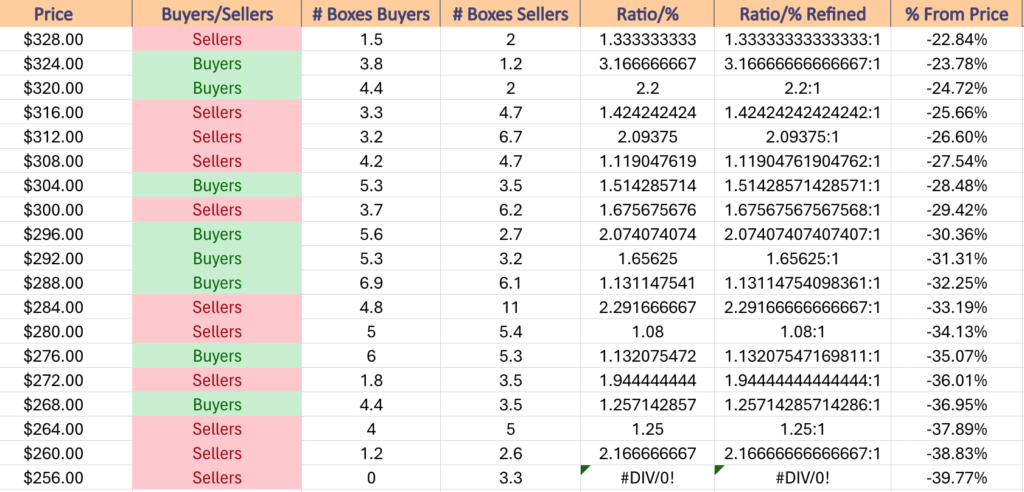
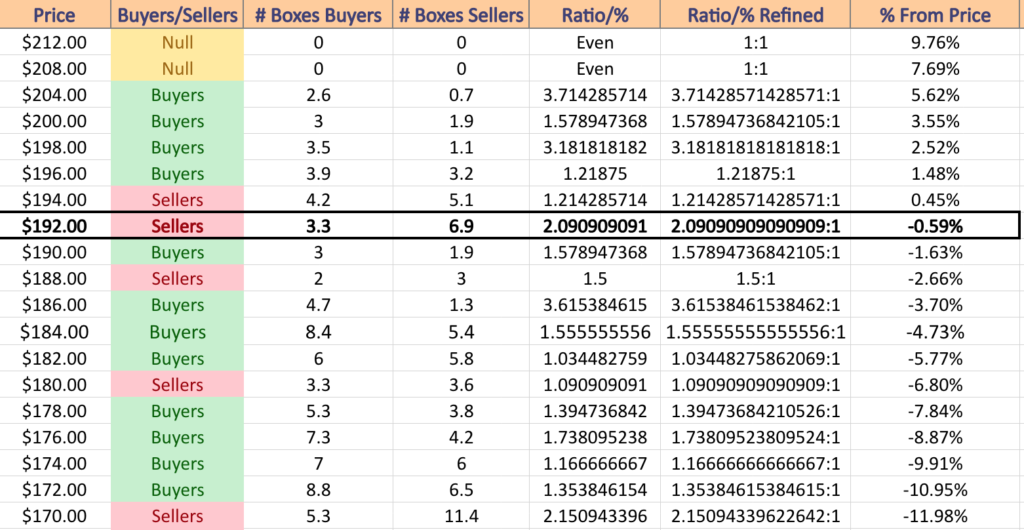
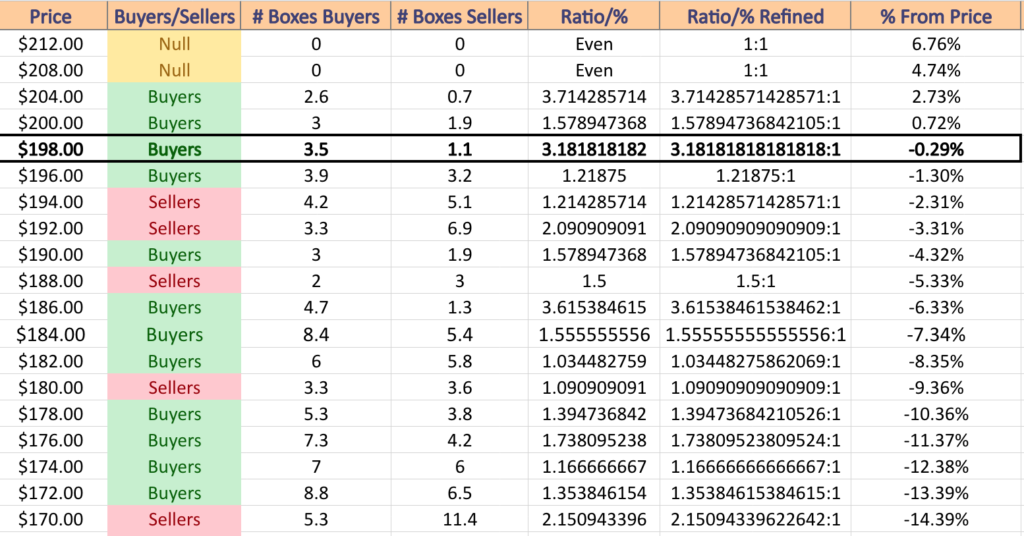
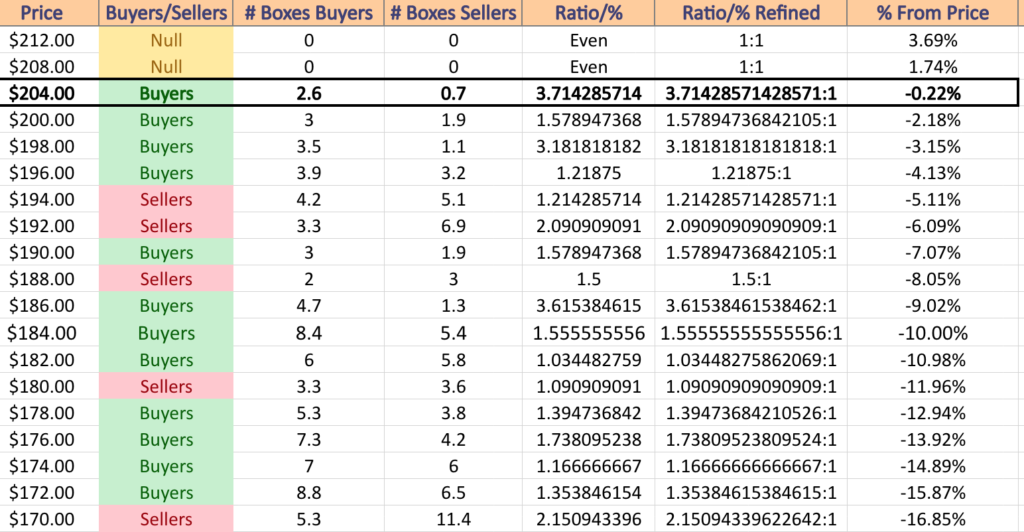
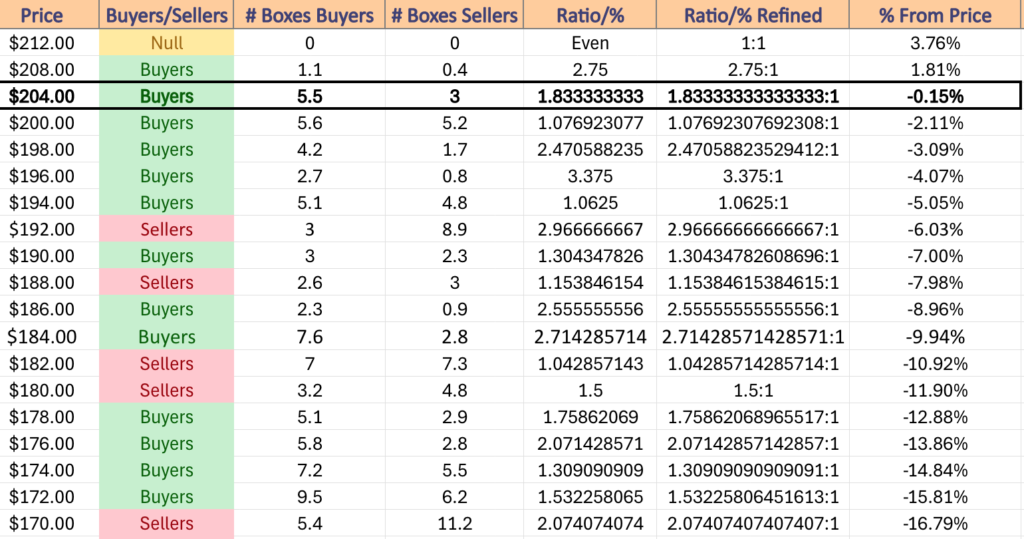
IWM has a good amount of support levels in near-by range which will help them in the event of bad news next week, and unlike SPY & QQQ their next four support levels are all dominated by the buyers over the past 1-2 years.
It is also worth noting that there is a bit of a head & shoulders pattern forming bearishly on IWM’s one year chart, which as you can see prices today are right between the $204.97 level in December of 2023 & the $204.25 level of February 2023.
This looks primed for a bearish surprise in the coming week, unless the buyer strength outlined below at the local support levels is able to hold up & keep IWM propped up.
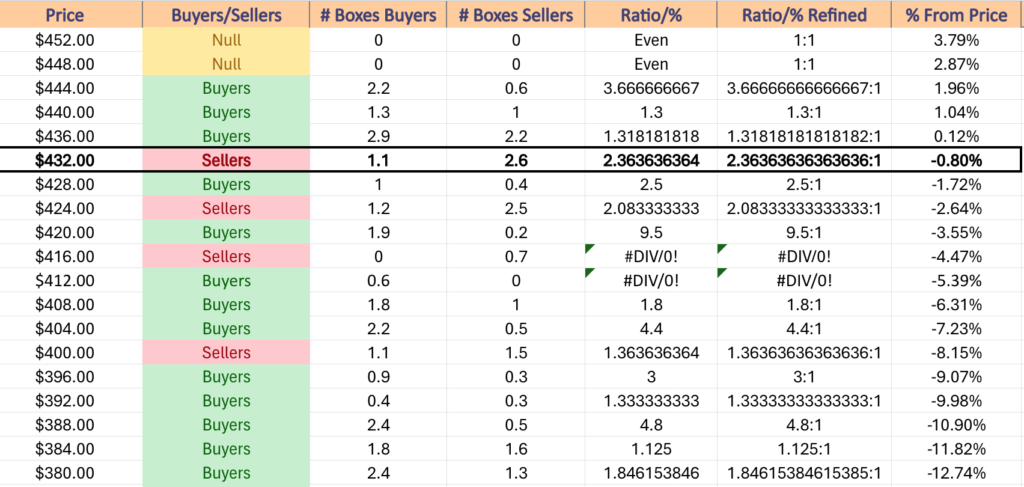
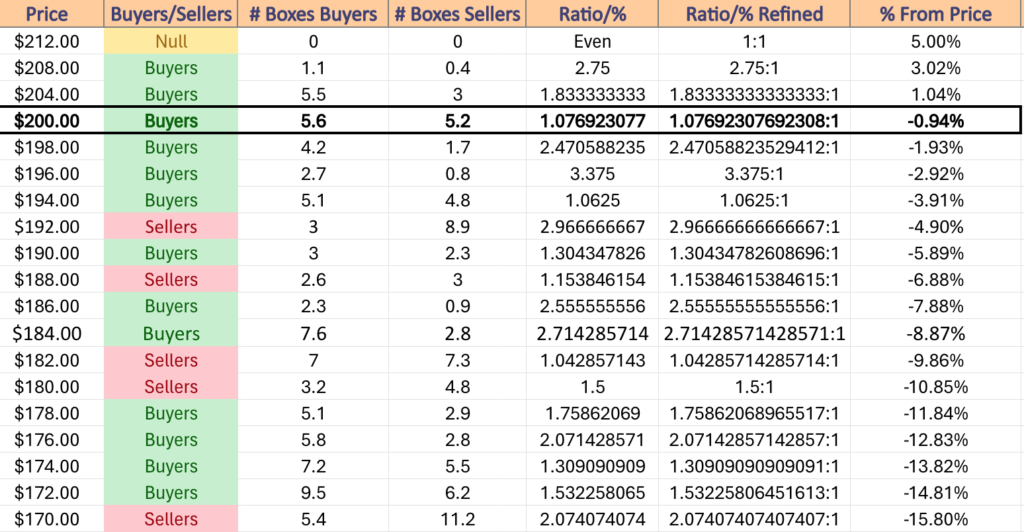
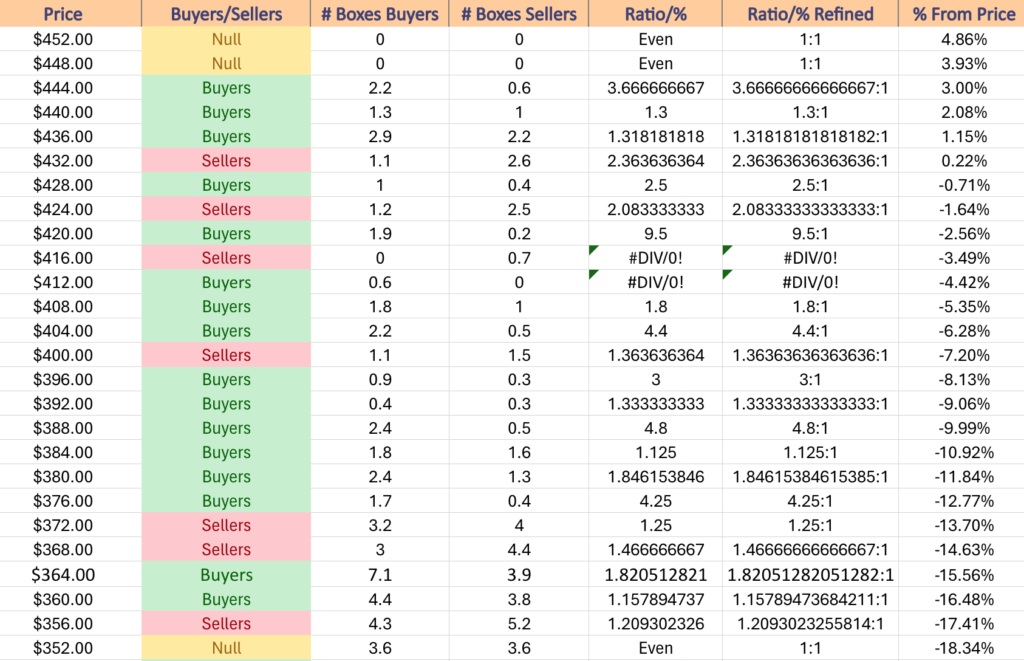
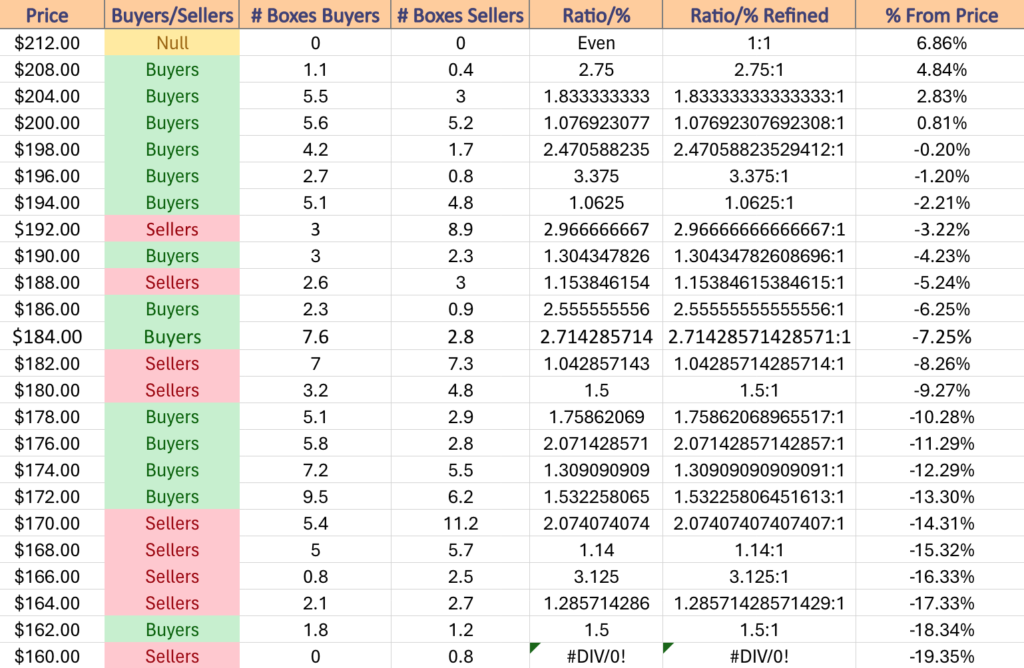
IWM has support at the $204.25 (Volume Sentiment: Buyers, 1.83:1), $202.30 (50 Day Moving Average, Volume Sentiment: Buyers, 1.08:1), $201.74 (10 Day Moving Average, Volume Sentiment: Buyers, 1.08:1) & $199.16/share (Volume Sentiment: Buyers, 2.47:1) price levels, with resistance at the $204.97 (Volume Sentiment: Buyers 1.83:1), $209.88 (Volume Sentiment: Buyers, 2.75:1) & $211.88/share (52-Week High, Volume Sentiment: Buyers, 2.75:1) price levels.
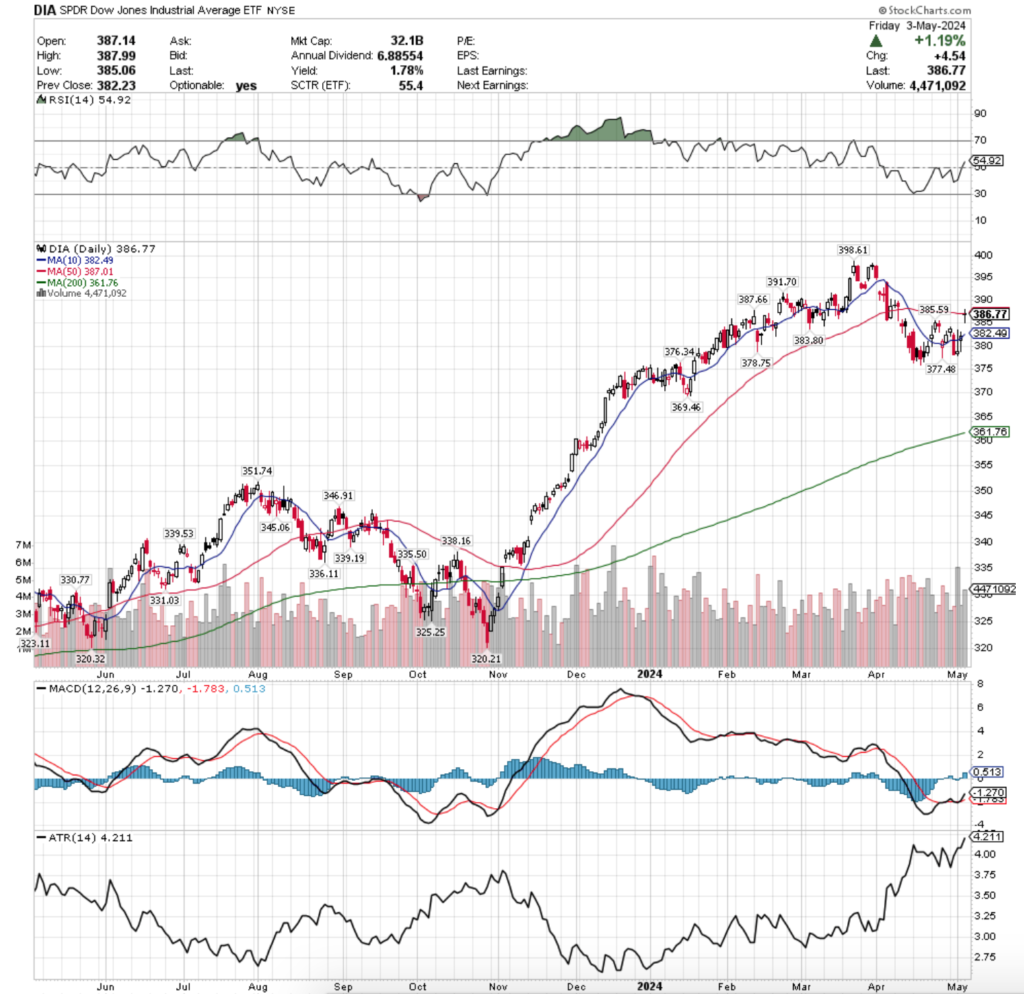
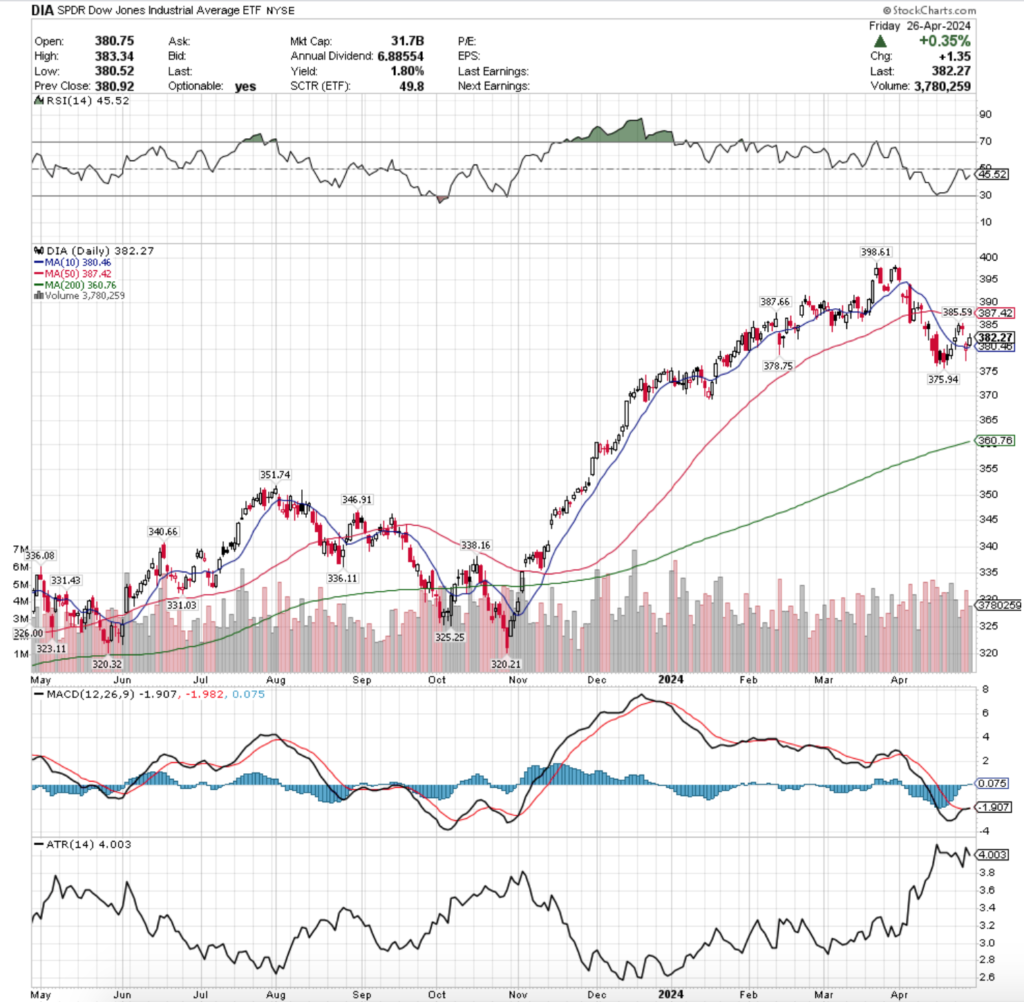
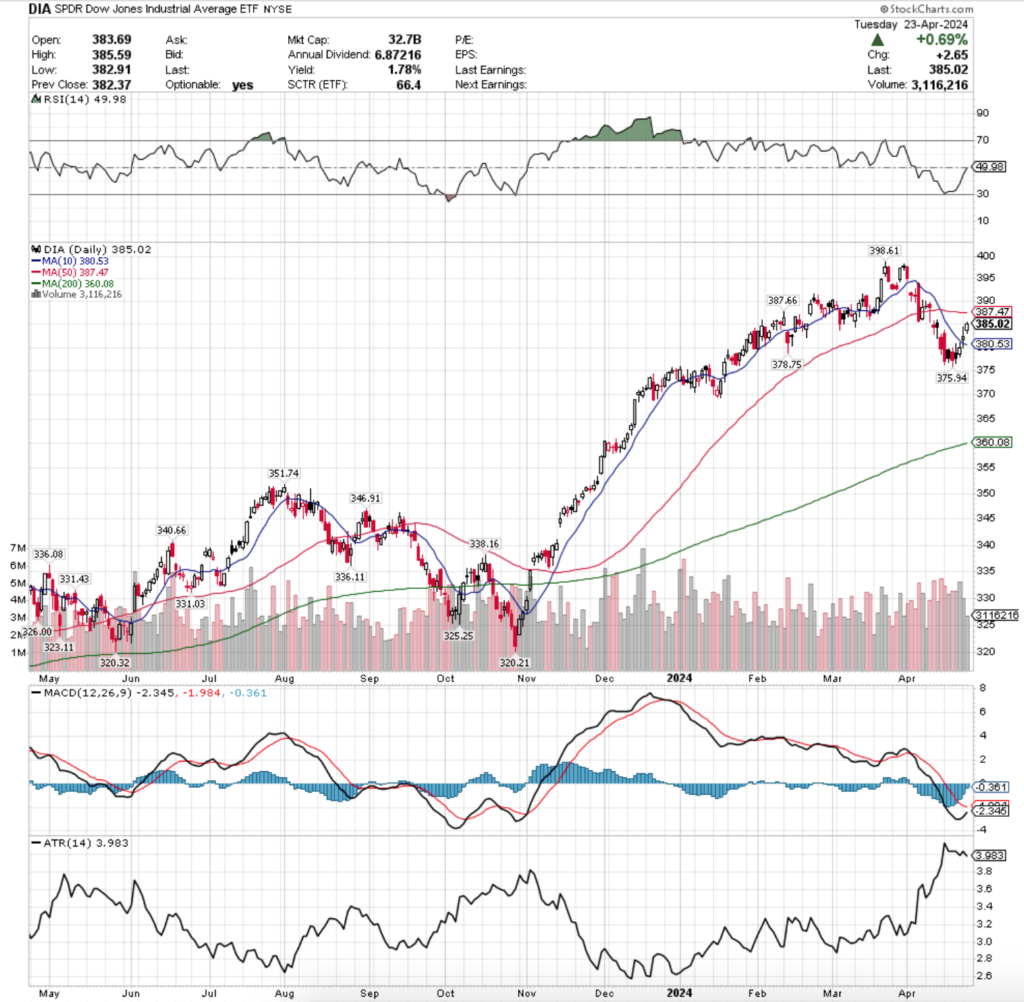
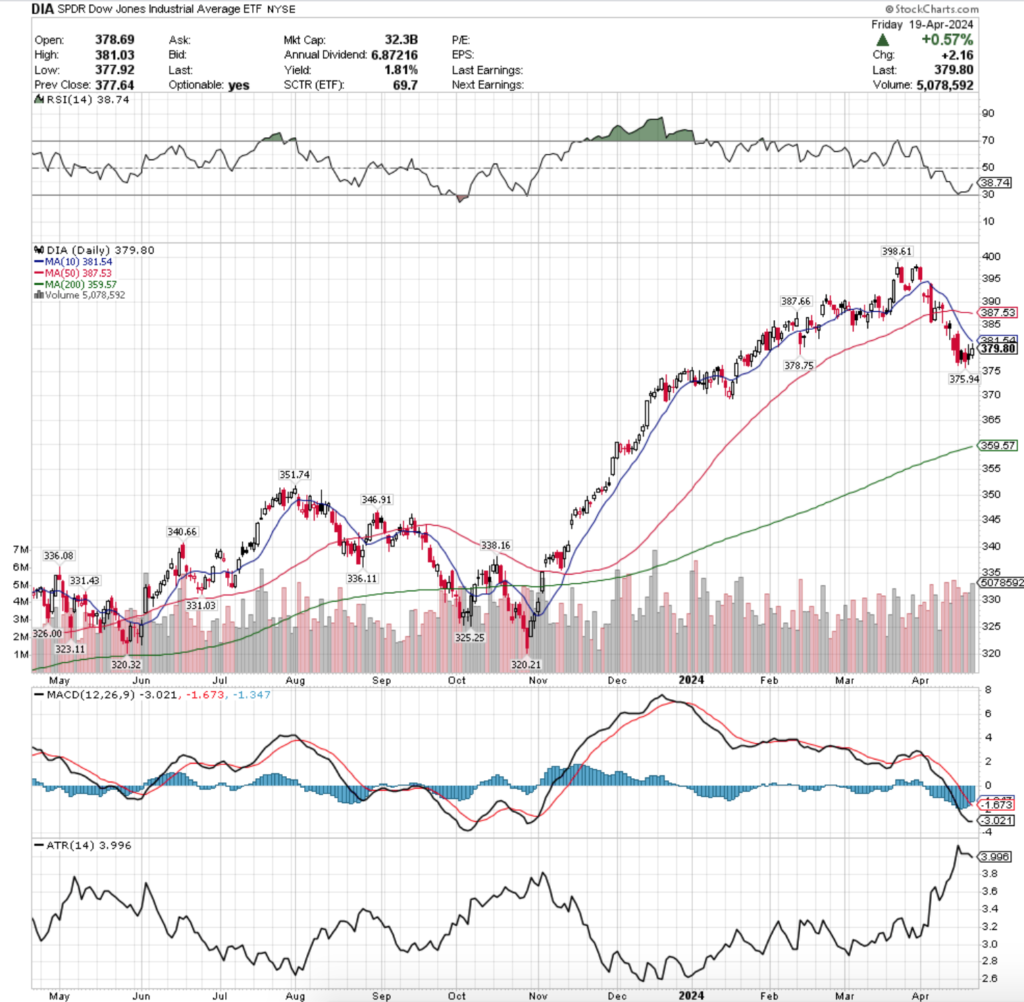
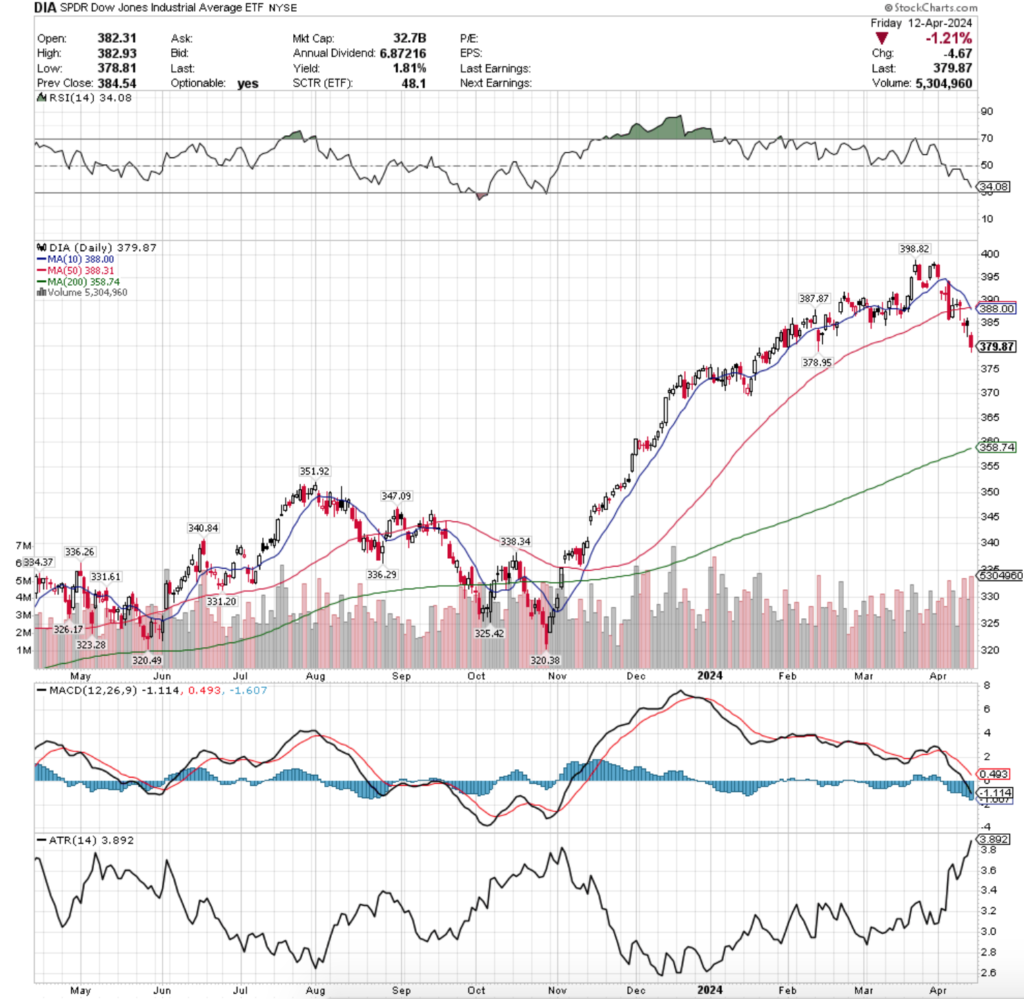
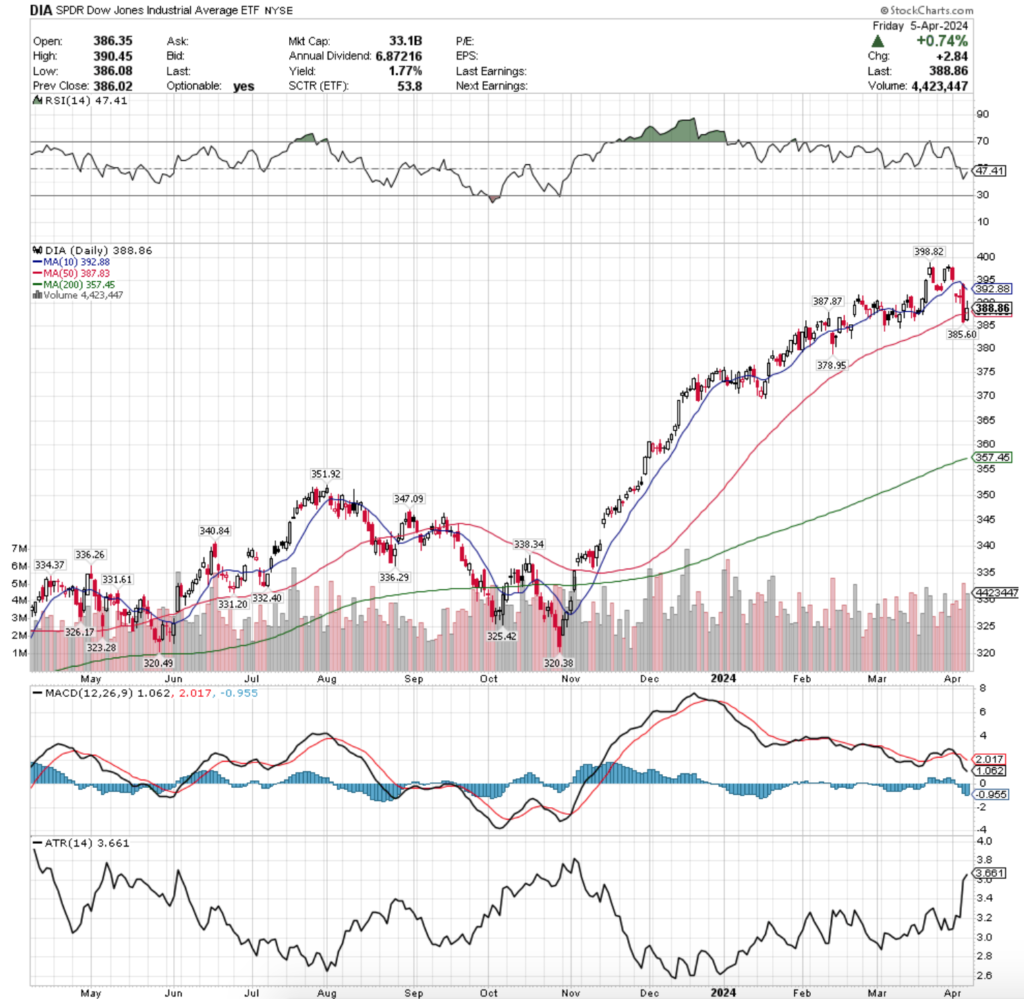
DIA, the SPDR Dow Jones Industrial Average ETF advanced +2.17%, as investors favored the larger cap index over the other three major indexes.
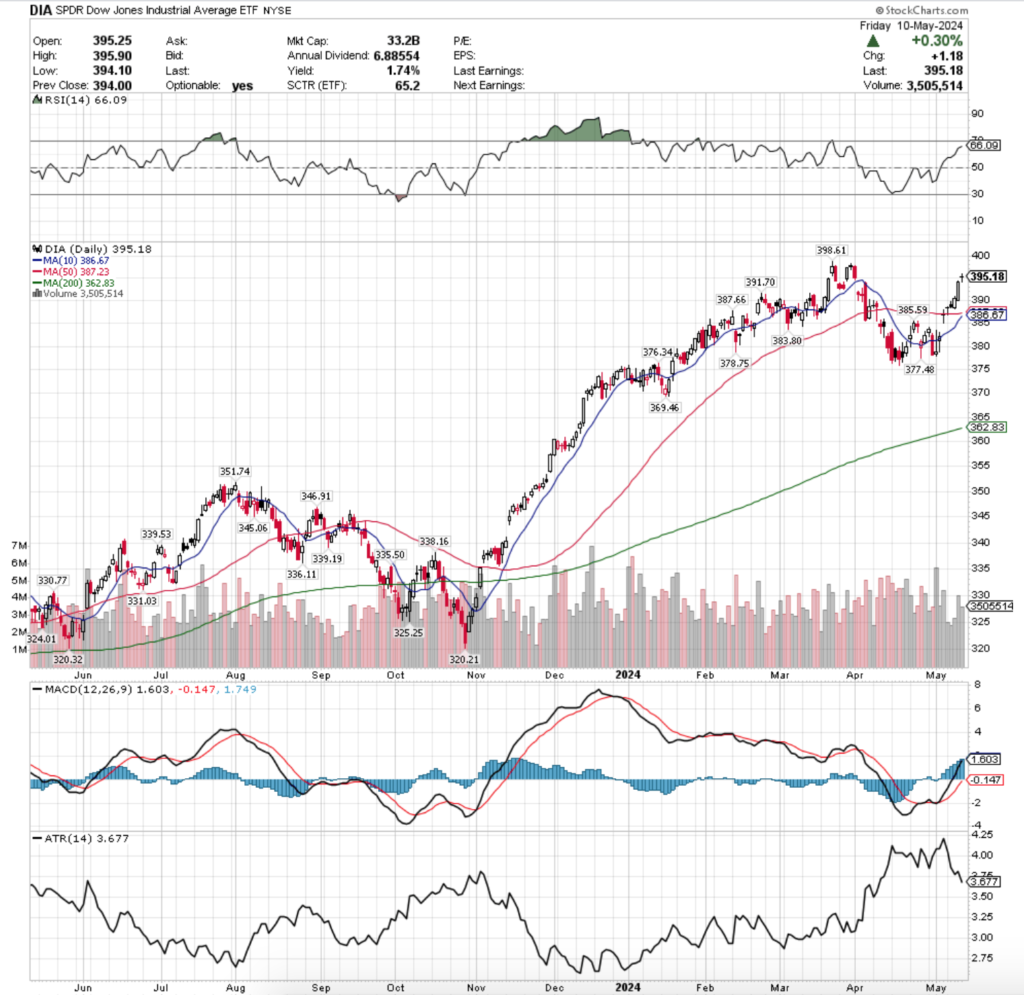
Their RSI is nearing overbought levels & is currently at 66.09, while their MACD is bullish mostly due to the gap up session of last Friday & the advances that followed.
Volumes were -12.55% below average compared to the year prior (3,105,100 vs. 3,550,743), which while is still weak, is nowhere near as subdued as the levels seen in SPY, QQQ or IWM.
Monday followed in Friday’s footsteps & resulted in a dragonfly doji, although on ~42% of the volume of Friday’s session, which isn’t a signal of strength, but the 50 DMA was able to prove sturdy as support.
Tuesday saw the week’s lowest volume & a session that opened on a gap up, tested higher, before ultimately closing below the opening price; again, not signaling much strength & a clear indication of hesitancy among market participants.
Wednesday was able to muster some folks off of the sidelines for DIA & resulted in a bullish engulfing candle that set the stage for the rest of DIA’s week.
Thursday was the highest volume of the week on a the widest range candle that had almost no shadows, which leads us to the fun part.
Friday’s session had the second highest volume of the week & resulted in a dragonfly doji, which based on the outcome of Monday’s session could translate into a an evening star pattern (both are bearish).
Friday’s range overall was relatively concentrated compared to the rest of the week, which leads market participants to another questions, “Were the last two trading sessions of the week just attempts to get people to jump into the pool to lead to a rug pull next week with more profit?”.
DIA is within ~1% of its all-time high, which if you look closer at from March of 2024 was led up to in the two days prior by two candles exactly like Thursday & Friday’s (although opposite volume configurations).
All eyes will be on Monday’s performance for DIA for more insight into what comes next for it, conveniently leading into Tuesday’s PPI report.
DIA’s Average True Range has been retreating from the high end towards the median of its range due to the decline of volatility over the past 6 sessions, which has in turn shot their RSI up dramatically.
Much like IWM, DIA is not exactly in line with how similar SPY & QQQ were for he July-October 2023 in terms of moving average & performance, which could change if there were a gap down to lead the week off in the first day or two.
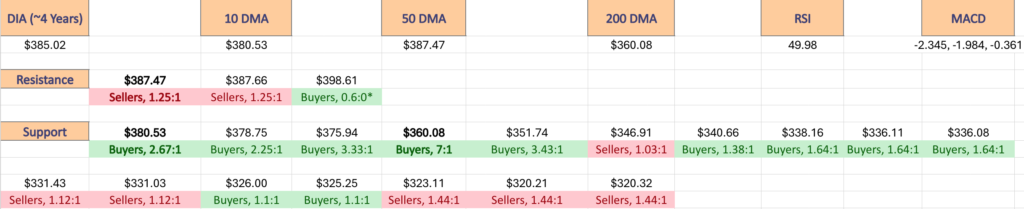
Much like every other index outlined above, the story will really come down to the strength of support from the 10 & 50 day moving averages, as well as the volumes for the coming week.
For DIA, there is a chance that even should we receive bad news that they remain more resilient than the other three indexes above due to their components, but as NVDA is not a component they will likely not receive the same gains as SPY or QQQ in anticipation of the NVDA earnings call on 5/22.
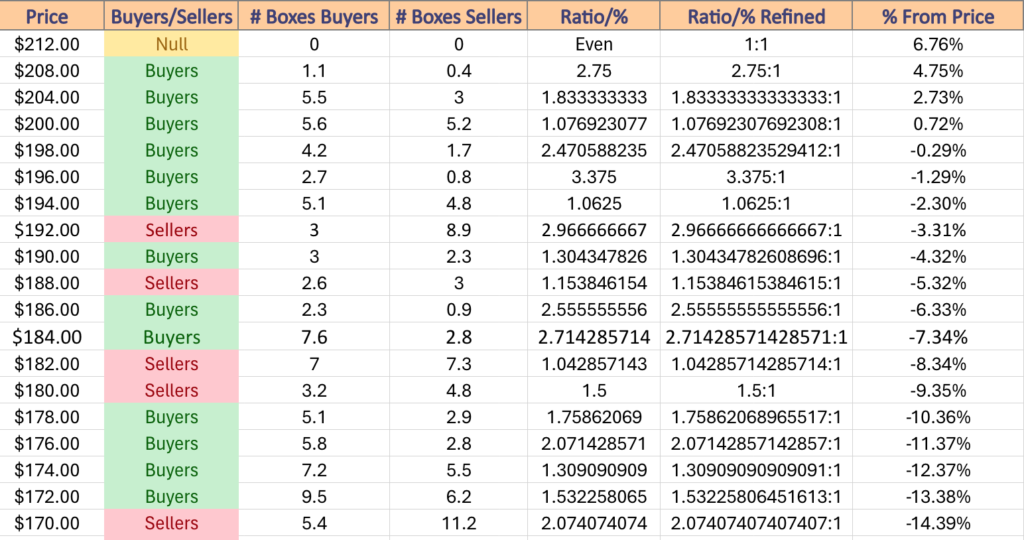
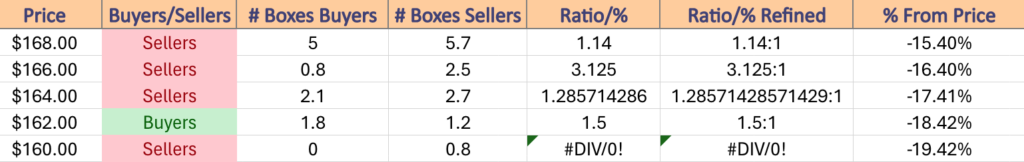
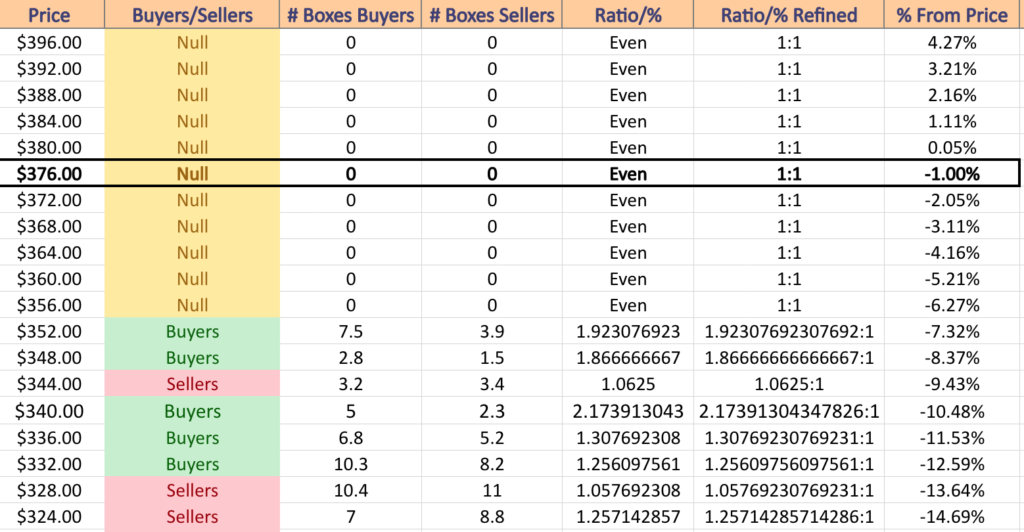
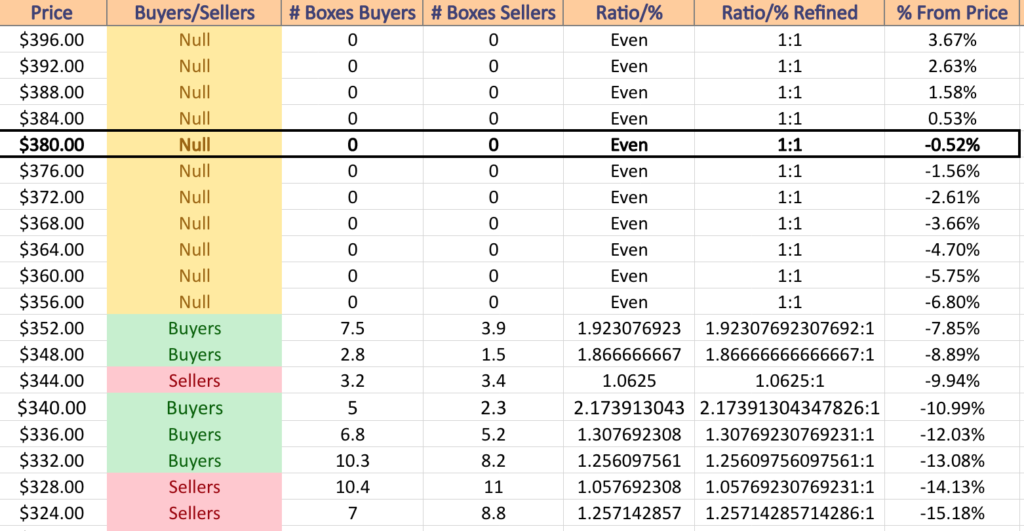
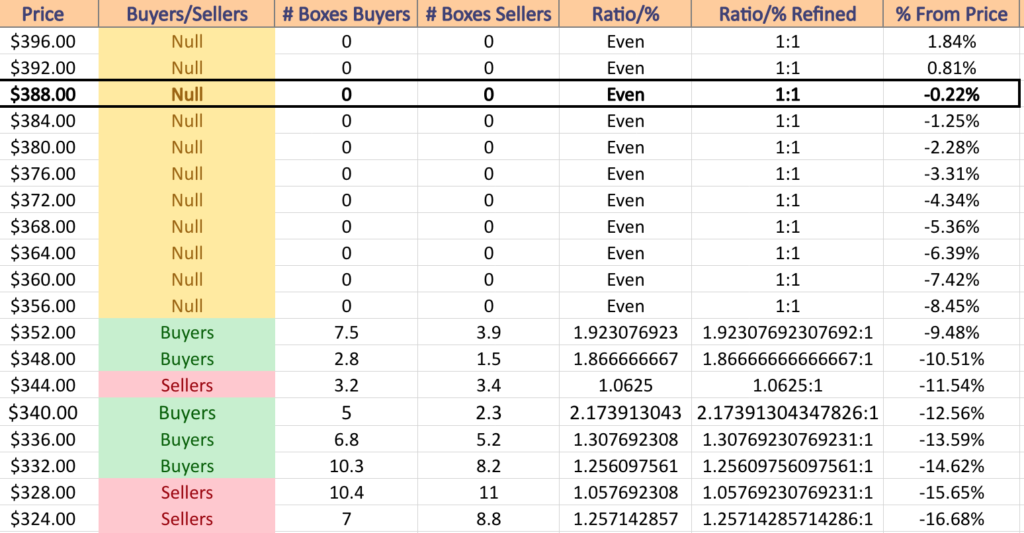
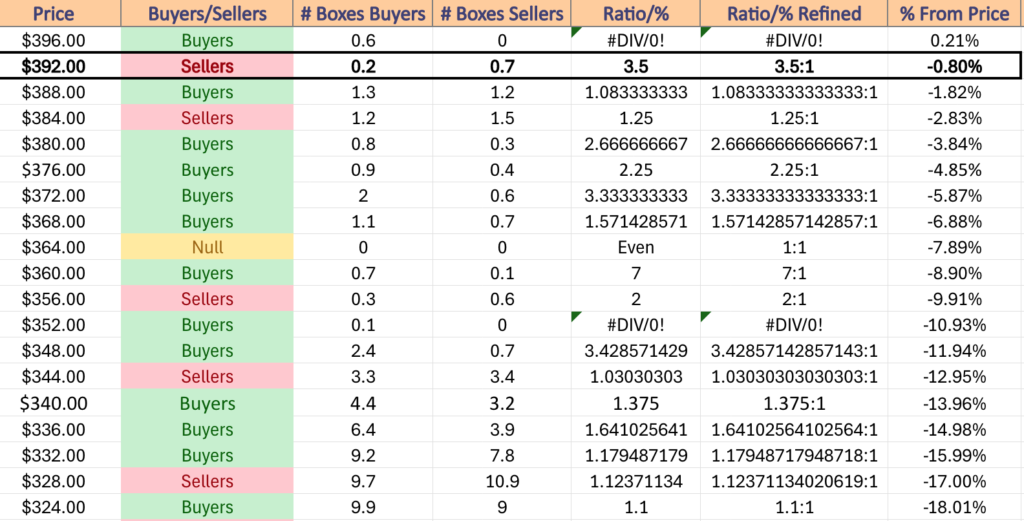
There also is the issue of sellers dominating the next four support levels of DIA, and given that two of those are moving averages should DIA find itself decline there will be downward pressure on prices moving into the coming month(s).
There also looks to be a bearish head & shoulders pattern emerging in DIA, which will be an area of concern in the coming week(s).
In the near-term there are plenty of support levels nearby the price, but in the next month-month & a half the $369.46 level will be something to keep on your radar should DIA begin to decline, as aside from the 200 DMA, there is limited support for ~-5% from that support level (also the 200 DMA will continue moving higher day-over-day).
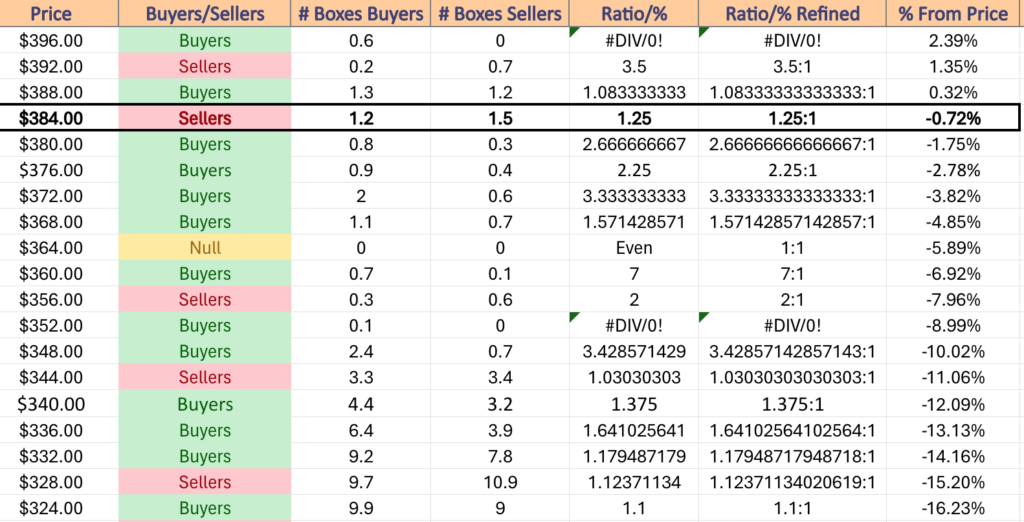
DIA has support at the $395.18 (Volume Sentiment: Sellers, 1.25:1), $387.66 (Volume Sentiment: Sellers, 1.25:1), $387.23 (50 Day Moving Average, Volume Sentiment: Sellers, 1.25:1) & $386.67/share (10 Day Moving Average, Volume Sentiment: Sellers, 1.25:1) price levels, with resistance at the $398.61/share (All-Time High, Volume Sentiment: NULL, 0:0*) price levels.
The Week Ahead
Monday does not have any major economic data to be announced.
Amer Sports, Huya, Paysafe, Tencent Music & Veradigm report earnings before Monday’s opening bell, while Agilysis, Allogene Therapeutics, American Healthcare REIT, Kyverna Therapuetics & StoneCo all are scheduled to report after the session’s close.
NFIB Optimism Index data is released Tuesday at 6am, followed by Producer Price Index, PPI Year-over-Year, Core PPI & Core PPI Year-over-Year data at 8:30am.
Tuesday morning kicks off with earnings from Home Depot, Alibaba Group Holding, IHS Holding, International Game Technology, Jack In The Box, On Holding, Rush Enterprises, Sea Limited, SFL Corp. & Smith Douglas Homes, followed by Boot Barn Holdings, Capital Southwest Corp., DHT, dLocal, Lions Gate Entertainment, Nextracker, Prestige Consumer & Sun Life after the closing bell.
Wednesday is set to be busy, with Consumer Price Index, CPI Year-over-Year, Core CPI, Core CPI Year-over-Year, U.S. Retail Sales, Retail Sales minus Autos & the Empire State Manufacturing Survey data all announced at 8:30 am, followed by Home Builder Confidence Index & Business Inventories data at 10 am.
Arcos Dorados, Dole, Dynatrace, Monday.com & Riskified are all due to report earnings Wednesday morning, with Cisco Systems, Copa Holdings, Grab, Maxeon Solar & ZTO Express all scheduled to report after the session closes.
Initial Jobless Claims, Philadelphia Fed Manufacturing Survey, Housing Starts, Building Permits, Import Price Index & Import Price Index minus Fuel data are all scheduled for release at 8:30 am on Thursday, with Industrial Production & Capacity Utilization data coming out at 9:15 am.
Thursday morning features earnings reports from Walmart, Advanced Drainage Systems, Canada Goose, Deere, Lightspeed, NICE & Under Armour, followed by Applied Materials, Copart, Doximity, DXC Technologies, Flower Foods & Take-Two Interactive Software after the closing bell.
Friday the week winds down with U.S. Leading Economic Indicators announced at 10 am.
RBC Bearings wraps up the week in terms of earnings calls for the week on Friday morning before the opening bell.
See you back here next week!
*** I DO NOT OWN SHARES OR OPTIONS CONTRACT POSITIONS IN SPY, QQQ, IWM OR DIA AT THE TIME OF PUBLISHING THIS ARTICLE ***