Northrop Grumman Corp. stock trades under the ticker NOC & has shown recent bullishness that traders & investors should research further into.
NOC stock closed at $478.90/share on 7/29/2022.
Northrop Grumman Corp. NOC Stock’s Technical Performance Broken Down
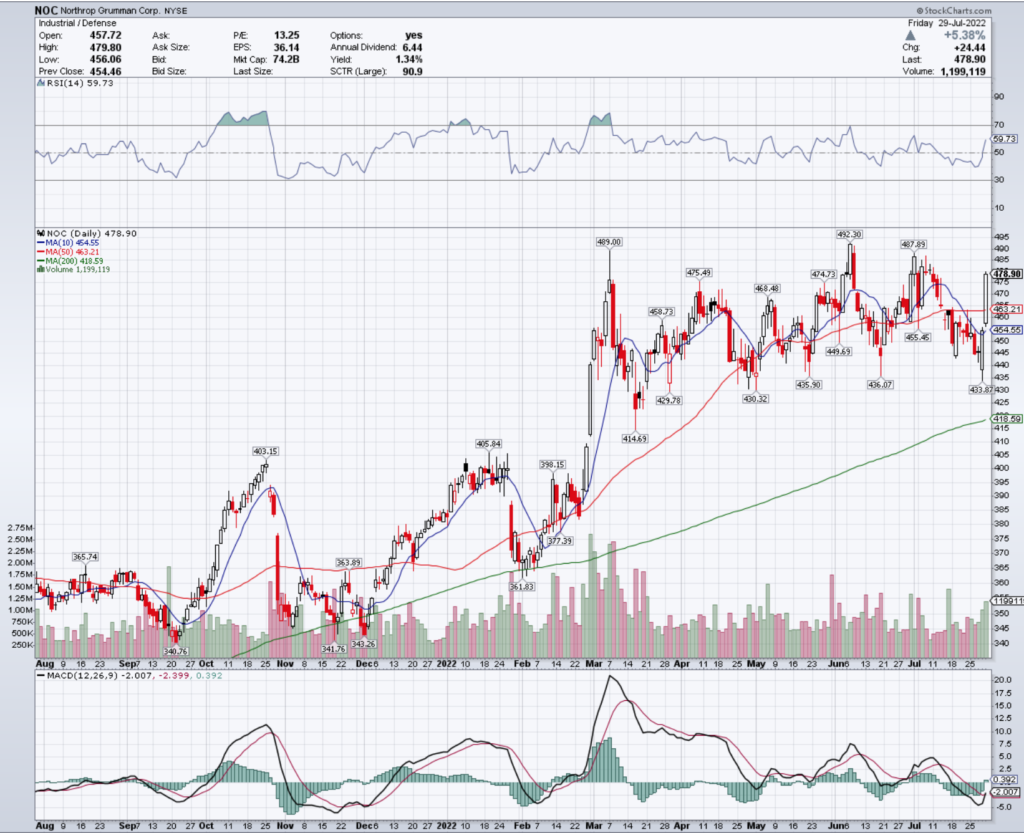
NOC Stock Price: $478.90
10 Day Moving Average: $454.55
50 Day Moving Average: $463.21
200 Day Moving Average: $418.59
RSI: 59.73
MACD: -2.007
On Friday, NOC stock gapped up 5.38%, closing above its 50 day moving average & completing a bullish MACD crossover.
Their RSI is on the overbought end of neutral, and recent trading volumes have been about average compared to the year prior, signaling that there may be momentum to come in th enear-term.
They will need to remain above the $475.49 support level as they try to break above the $487.89 resistance level.
Northrop Grumman Corp. NOC Stock As A Long-Term Investment
Long-term oriented investors will like NOC stock’s P/E (ttm) of 12.55, but will find their 5.32 P/B (mrq) to be a bit rich.
They recently reported -3.8% Quarterly Revenue Growth Y-o-Y, with -8.8% Quarterly Earnings Growth Y-o-Y.
Their balance sheet will require some additional research before making an investment, with $1.17B of Total Cash (mrq) & $14.49B of Total Debt (mrq).
NOC stock pays a 1.36% dividend yield, which appears to be stable in the long-term, as their payout ratio is 17.98%.
84.2% of NOC stock’s outstanding share float is owned by institutional investors.
Northrop Grumman Corp. NOC Stock As A Short-Term Trade Using Options
Short-term oriented traders can use options to hedge against market volatility, while profiting from movements in NOC stock in any direciton.
I am looking at the contracts with the 8/19 expiration date.
The $470, $475 & $472.50 call options are all in-the-money, listed from highest to lowest level of open interest.
The $480, $485 & $490 puts are also in-the-money, in order of most to least liquid.
Tying It All Together
NOC stock offers many interesting opportunities to traders & investors alike.
Investors will like NOC stock’s safe dividend yield, but may want to research their balance sheet more before making an investment.
Traders will like their recent technical performance, as well as how liquid their options are.
Overall, NOC stock is worth taking a closer look into to see how it fits into your portfolio strategy.
*** I DO NOT OWN SHARES OF NOC STOCK AT THE TIME OF PUBLISHING THIS ARTICLE ***
Kroger Co. stock trades under the ticker KR & has shown recent bullishness that traders & investors should look closer into.
KR stock closed at $46.44/share on 7/29/2022.
Kroger Co. KR Stock’s Technical Performance Broken Down
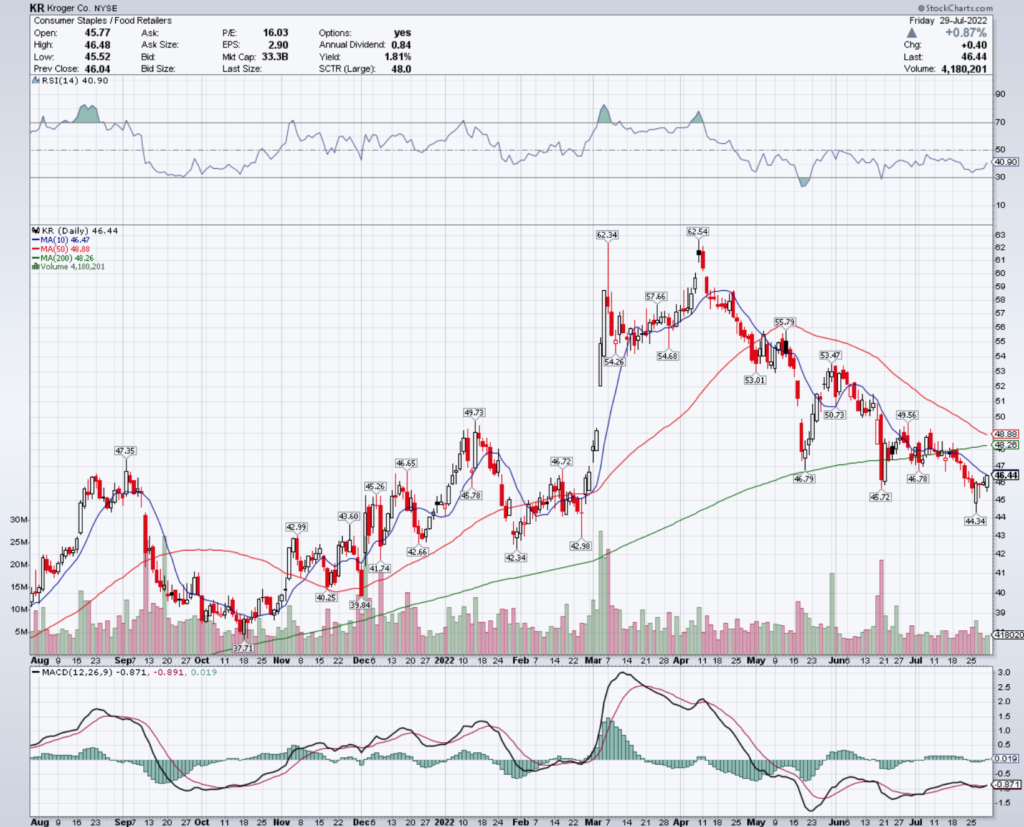
KR Stock Price: $46.44
10 Day Moving Average: $46.47
50 Day Moving Average: $48.88
200 Day Moving Average: $48.26
RSI: 40.9
MACD: -0.871
On Friday, KR stock completed a bullish MACD crossover, closing just beneath its 10 day moving average.
Their RSI is on the oversold side of neutral, and recent volumes have been lighter than average, signaling that investors still have an unsure sentiment about its price.
They need to remain above the $45.72 support level, while trying to break above the $46.78 resistance level.
Kroger Co. KR Stock As A Long-Term Investment
Long-term oriented investors will like KR stock’s 15.92 P/E (ttm), but may think that their 3.5 P/B (mrq) is too rich at 3.5.
They recently reported 8% Quarterly Revenue Growth Y-o-Y, with 374.3% Quarterly Earnings Growth Y-o-Y.
Their balance sheet will require a closer examination, with $1.38B of Total Cash (mrq) & $20.75B of Total Debt (mrq).
KR stock pays a 1.82% dividend yield, which appears to be stable in the long-run, as their payout ratio is 28%.
82.73% of KR stock’s outstanding share float is owned by institutional investors.
Kroger Co. KR Stock As A Short-Term Trade Using Options
Short-term focused traders can use options to profit from price movements in KR stock, while protecting themselves from broader market volatility.
I am looking at the contracts with the 8/19 expiration date.
The $46, $45 & $44 call options are all in-the-money, with the former having more open interest than the latter 2.
The $48, $47 & $46.50 puts are also all in-the-money, listed in order of most to least liquid.
Tying It All Together
KR stock offers many opportunities to investors & traders alike.
Investors will like their safe dividend, along with their P/E, but may want to look closer into their balance sheet.
Traders will like their current market performance in times of elevated volatility compared to many of their peers, as well as how liquid their options are.
All-in-all, it is worth taking a closer look into KR stock to see how it fits into your portfolio strategy.
*** I DO NOT OWN SHARES OF KR STOCK AT THE TIME OF PUBLISHING THIS ARTICLE ***
The Travelers Cos., Inc. stock trades under the ticker TRV & has shown recent bullishness that traders & investors should take a closer look into.
TRV stock closed at $158.96/share on 7/27/2022.
The Travelers Cos., Inc. TRV Stock’s Technical Performance Broken Down
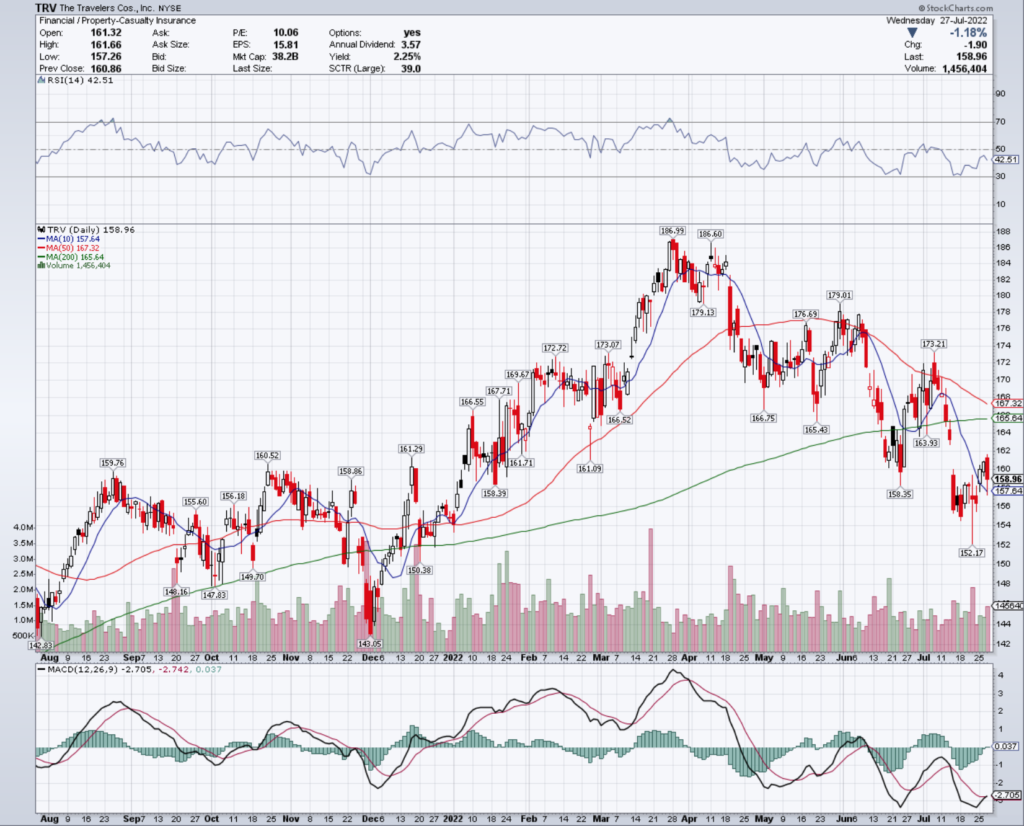
TRV Stock Price: $158.96
10 Day Moving Average: $157.64
50 Day Moving Average: $167.32
200 Day Moving Average: $165.64
RSI: 42.51
MACD: -2.705
Yesterday, TRV stock completed a bullish MACD crossover, despite settling down 1.18%
Their RSI is still in oversold territory, and their recent trading volumes have been about average compared to the year prior, signaling that there may still be some momentum to come in the near-term.
They will need to break above the $159.76 & $160.52/share resistance levels as they continue to climb higher.
The Travelers Cos., Inc. TRV Stock As A Long-Term Investment
Long-term oriented investors will like TRV stock’s valuation metrics, with a 10.87 P/E (ttm) & a 1.62 P/B (mrq).
They recently reported 5.2% Quarterly Revenue Growth Y-o-Y, with -41% Quarterly Earnings Growth Y-o-Y.
Their balance sheet will warrant a closer review before making an investment though, with $4.28B of Total Cash (mrq) & $7.29B of Total Debt (mrq).
TRV stock pays a 2.22% dividend yield, which appears to be sustainable in the long-run, with a 24.8% payout ratio.
85% of TRV stock’s outstanding share float is owned by institutional investors.
The Travelers Cos., Inc. TRV Stock As A Short-Term Trade Using Options
Short-term oriented traders can use options to profit from short term movements in TRV stock’s price, while hedging against broader market volatility.
I am looking at the contracts with the 8/19 expiration date.
The $155, $150 & $140 calls are all in-the-money, listed from most to least liquid.
The $160, $165 & $170 puts are also all in-the-money, with the former being more liquid than the latter strikes.
Tying It All Together
TRV stock has many interesting characteristics that traders & investors will find appealing.
Investors will like their valuation metrics, as well as their dividend yield, but may want to review the structure of their balance sheet before making an investment.
Traders will like their current technical strength amid volatility, but may be disappointed by how liquid their options are.
All-in-all, TRV stock is worth taking a closer look into to see how it fits into your portfolio strategy.
*** I DO NOT OWN SHARES OF TRV STOCK AT THE TIME OF PUBLISHING THIS ARTICLE ***
Southwest Gap Corp. stock trades under the ticker SWX & has shown recent bullishness that traders & investors should research further into.
SWX stock closed at $86.09/share on 7/26/2022.
Southwest Gas Corp. SWX Stock’s Technical Performance Broken Down
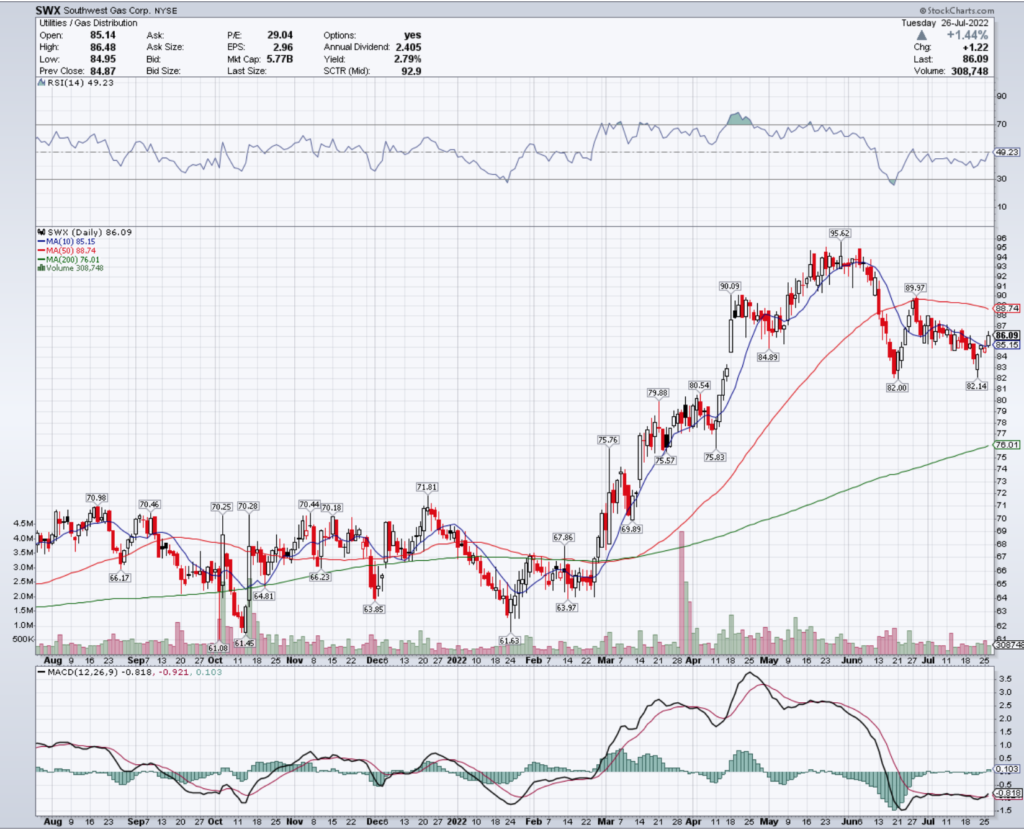
SWX Stock Price: $86.09
10 Day Moving Average: $85.15
50 Day Moving Average: $88.74
200 Day Moving Average: $76.01
RSI: 49.23
MACD: -0.818
Yesterday, SWX stock completed a bullish MACD crossover, while break out & settling above its 10 day moving average.
With a neutral RSI & low trading volumes in the recent days compared to the year prior, there seems to be a lot of uncertainty about the future direction of SWX stock in the near-term.
They will need to remain above their support levels of $85.15 & $84.89, while trying to break above their $88.74 & $89.97/share resistance levels.
Southwest Gas Corp. SWX Stock As A Long-Term Investment
Long-term oriented investors will like SWX stock’s valuation metrics, with a 29.05 P/E (ttm) & a 1.63 P/B (mrq).
They recently reported 43.1% Quarterly Revenue Growth Y-o-Y, with -18% Quarterly Earnings Growth Y-o-Y.
Their balance sheet will require an additional review, with $624.7M of Total Cash (mrq) & $6.23B of Total Debt (mrq).
SWX stock pays a 2.8% dividend, which may not be sustainable in the long-run, with an 81.23% payout ratio/
Still, 95.3% of SWX stock’s outstanding share float is owned by institutional investors.
Southwest Gas Corp. SWX Stock As A Short-Term Trade Using Options
Short-term focused traders can use options to profit from SWX stock’s price movements, while hedging against volatility in the broader markets.
I am looking at the contracts with the 8/19 expiration date.
The $70, $65, $75 & $85 call options are all in-the-money, listed from highest to lowest levels of open interest.
The $90 puts are the only strike price in-the-money at the moment, although there is liquidity at the $85 & $80 levels.
Tying It All Together
SWX stock has a lot of characteristics that traders & investors are sure to find appealing.
Investors will like their valuation metrics & dividend yield, but may want to review their balance sheet to see how sustainable that yield is in the long-term.
Traders will like the way that they have weathered recent market volatility, but will be disappointed by how illiquid their options are.
Overall, it is worth taking a closer look into SWX stock to see how it fits into your portfolio strategy.
*** I DO NOT OWN SHARES OF SWX STOCK AT THE TIME OF PUBLISHING THIS ARTICLE ***
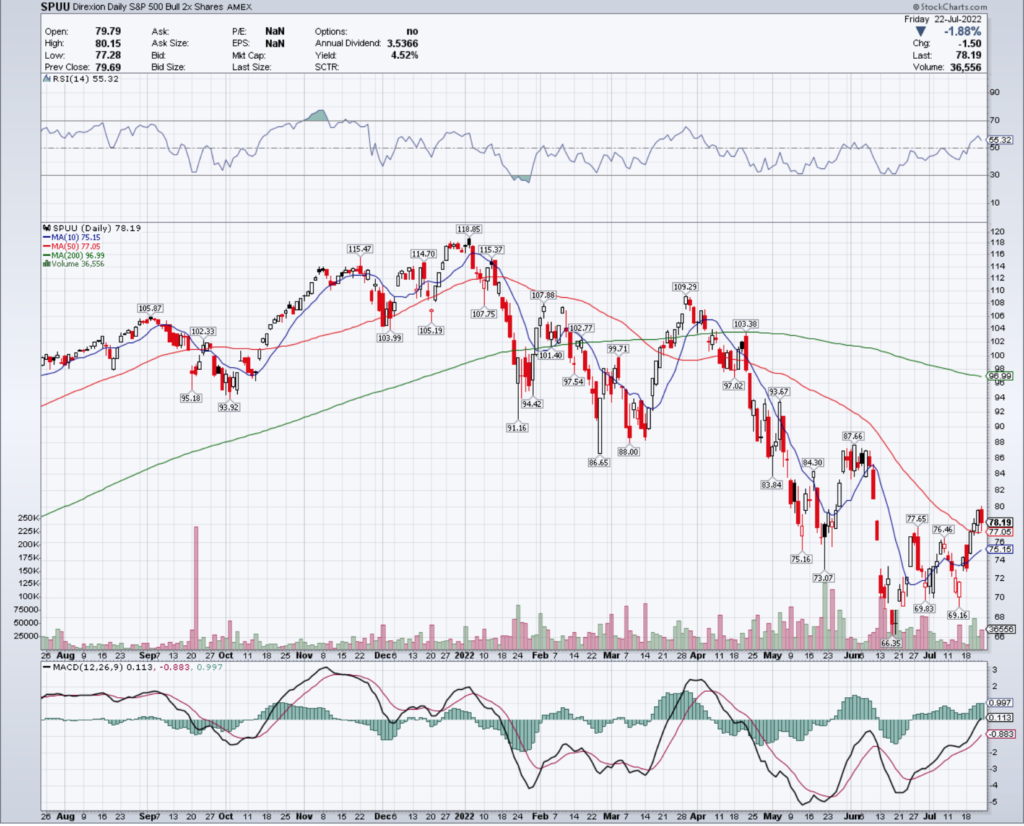
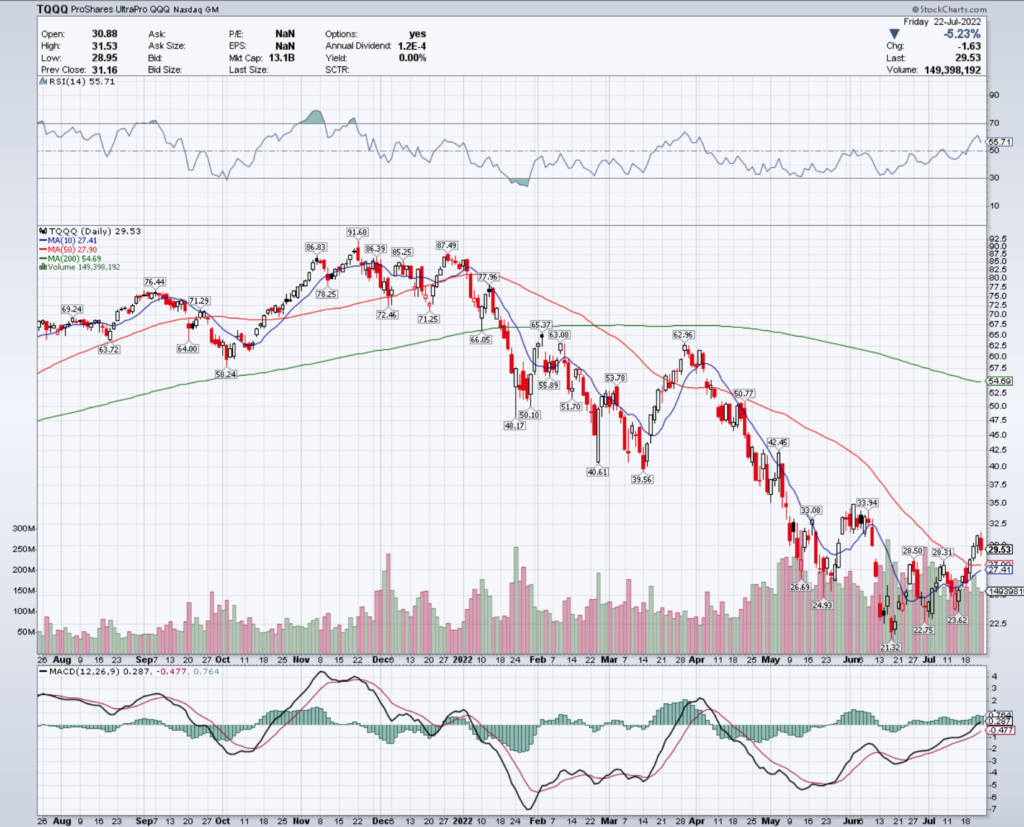
While volumes were above average compared to the rest of July, there still is a lot of uncertainty in the air, as their MACD is still charging upwards bullishly, but their RSI is breaking down.
TQQQ, the ProShares UltraPro QQQ ETF that tracks the NASDAQ’s performance, has seen similar performance, although on higher volumes than SPUU compared to the recent month.
TQQQ ETF – ProShares UltraPro QQQ ETF
Based on their technical positioning, there looks to be a fallout coming for TQQQ in the near-term, given that their components tend to be more interest rate reliant than S&P 500 companies.
However, given the nature of the concerns for growth outlooks being discussed in recent earnings reports, the S&P 500 will follow close behind once the NASDAQ begins to fall again.
Natural Gas (BOIL), Debt Market Income (JPIE), Senior Loans (BKLN) & 7-10 Year Treasury Bonds (IEF) Are All Bullishly Leading The Markets
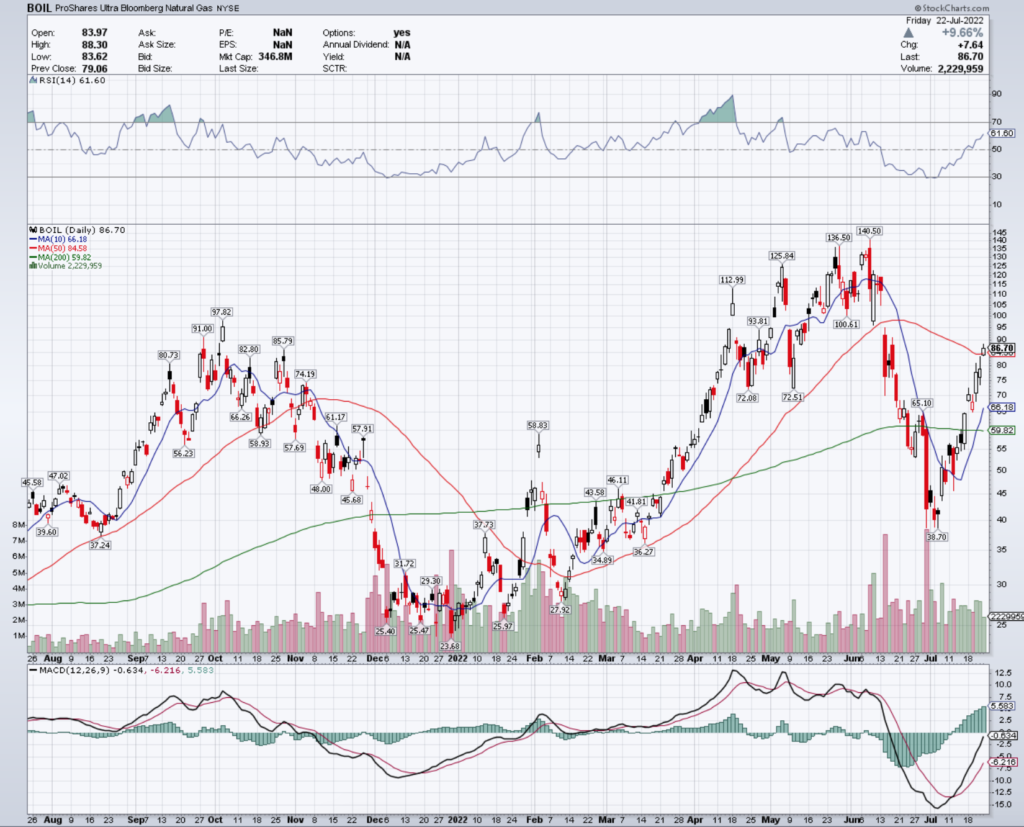
BOIL ETF – ProShares Ultra Bloomberg Natural Gas ETF
Their MACD points to more strength to come, and their RSI is still not in the overbought range yet, along with strong recent volume, signaling that BOIL still has momentum to run.
While they don’t have a dividend to provide downside protection, they do have options that traders & investors can use to position themselves against possible downturns as a hedge.
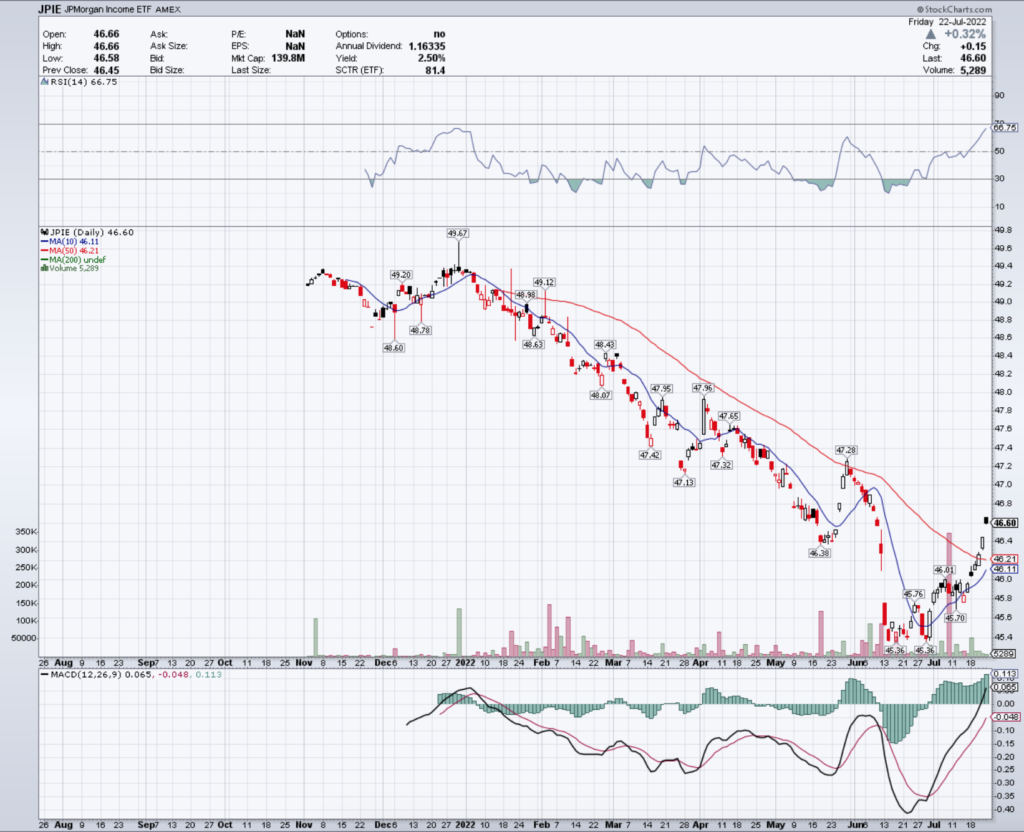
JPIE, the JPMorgan Income ETF is a relatively new ETF, and does not have options yet, but has been performing strongly since June’s steep downfall.
JPIE ETF – JPMorgan Income ETF
Their RSI is encroaching on overbought territory, while their MACD is still very bullish.
Traders & investors who own these shares have a 2.5% cushion against losses in their dividend yield, should they hold it for more than one year.
They need to break above the $46.80/share level as they continue climbing higher.
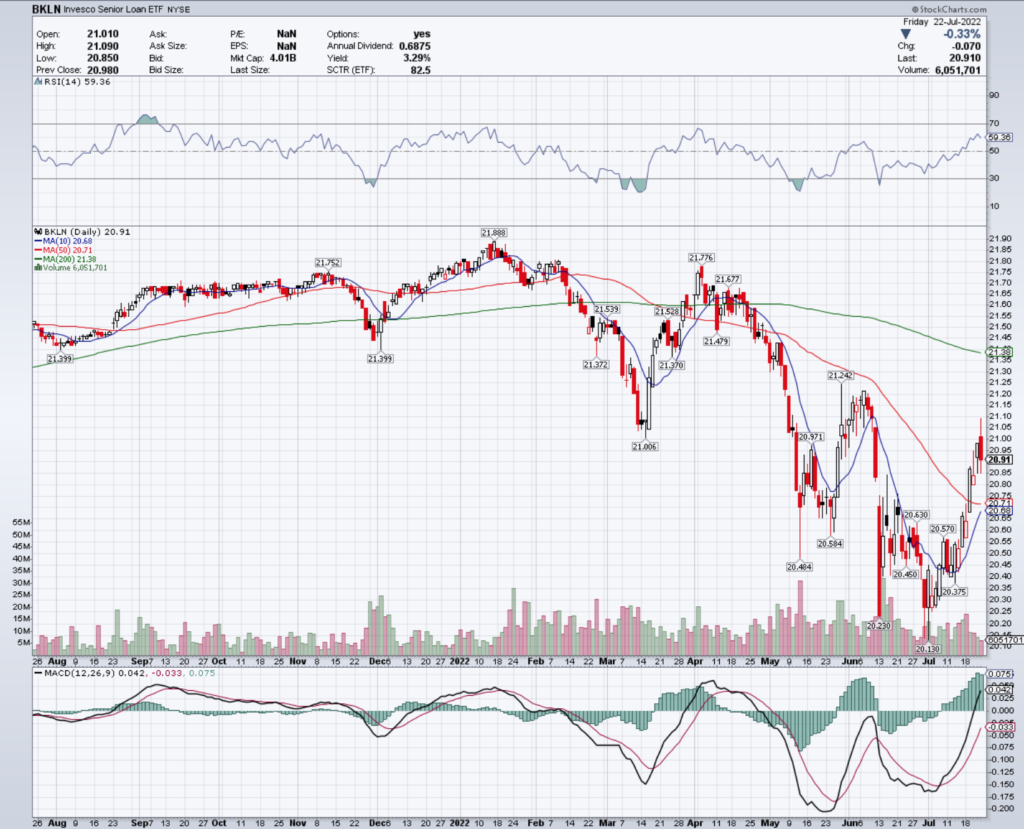
BKLN, the Invesco Senior Loan ETF also has recovered well from the losses incurred in June, despite showing weakness on Friday of this week.
BKLN ETF – Invesco Senior Loan ETF
Their MACD is still bullish, but beginning to turn bearish & their RSI has already begun to work its way back down towards neutral from recent high levels.
Fortunately, they pay a 3.3% dividend yield annually to investors who own them for a year, and also offer options that can be used to protect traders against any falls in price.
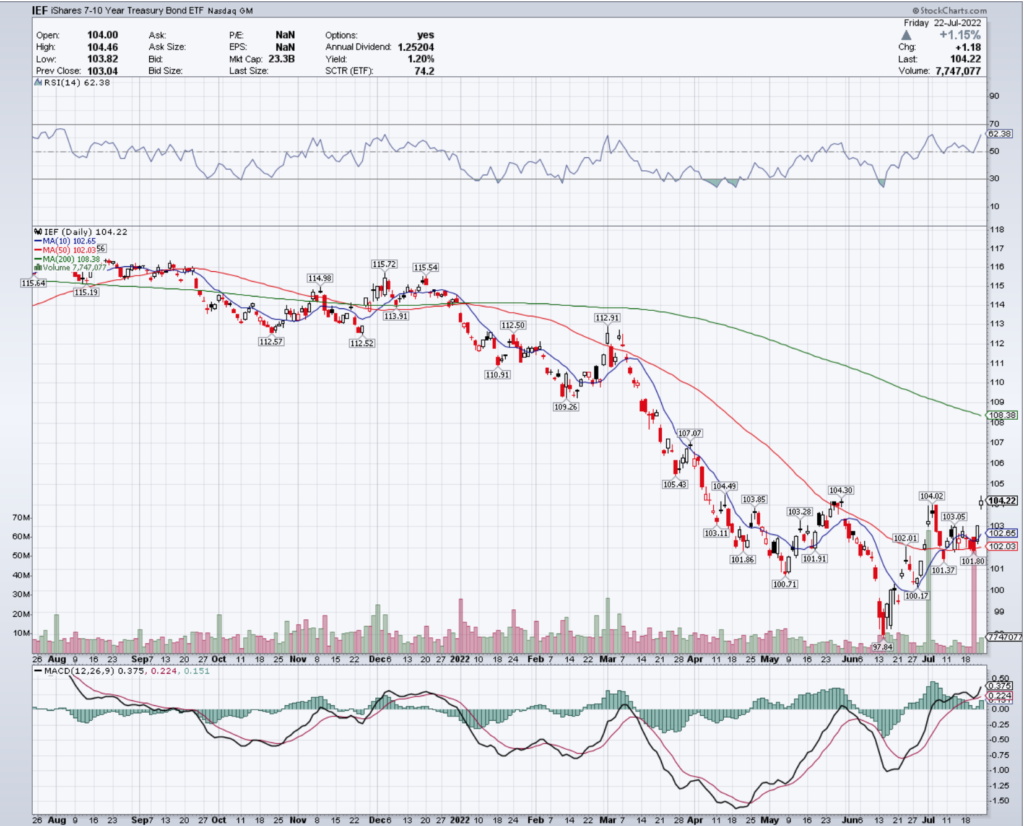
Their RSI is pushing towards overbought conditions, which may result in a brief cool off, but their MACD is still bullish.
IEF has options that can be used for downside protection/profits & also pays a 1.2% dividend, for those who hold their shares for the course of a year.
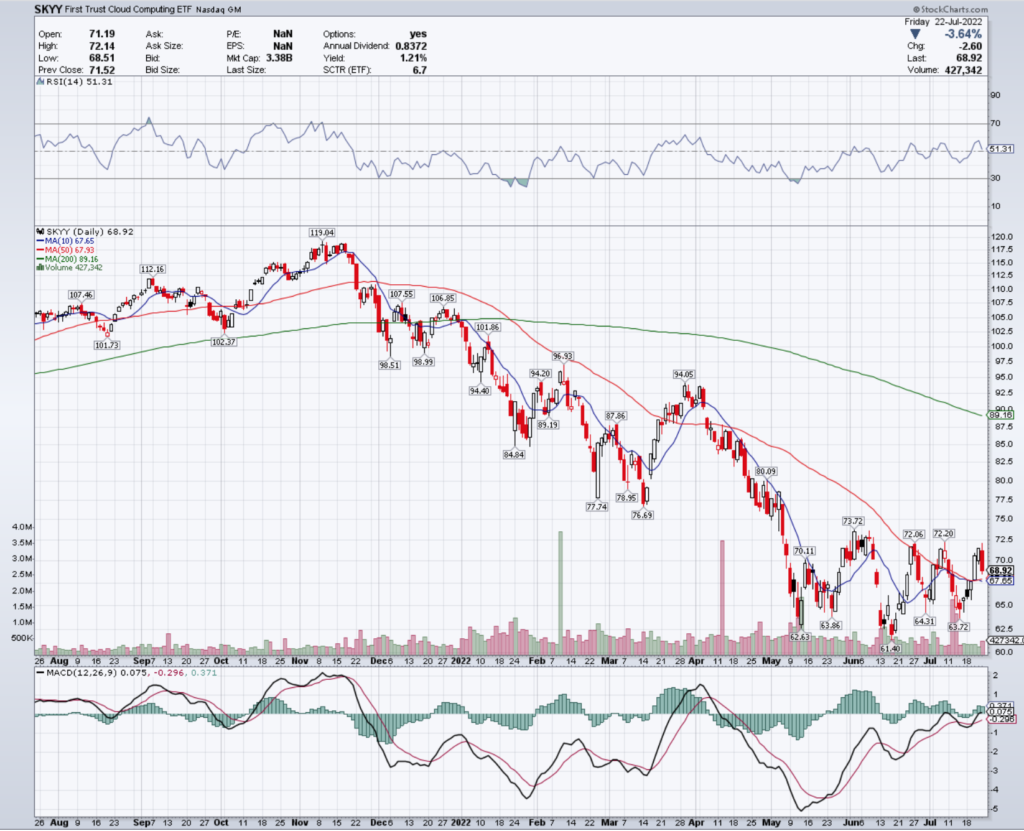
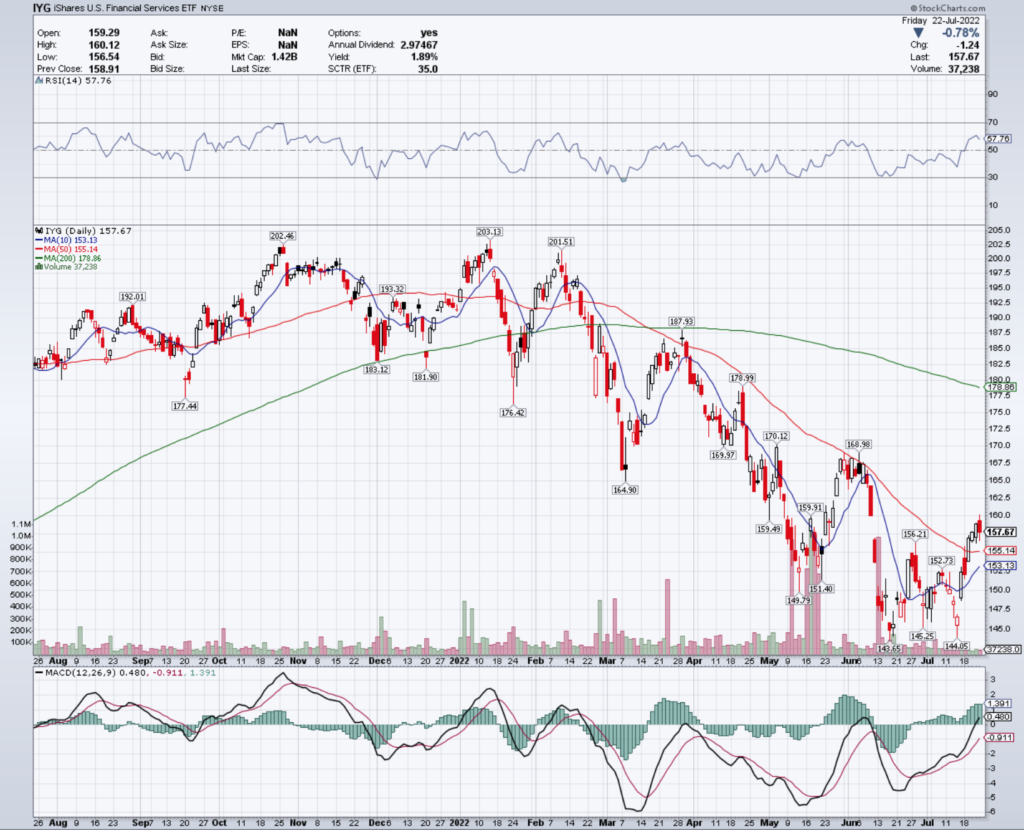
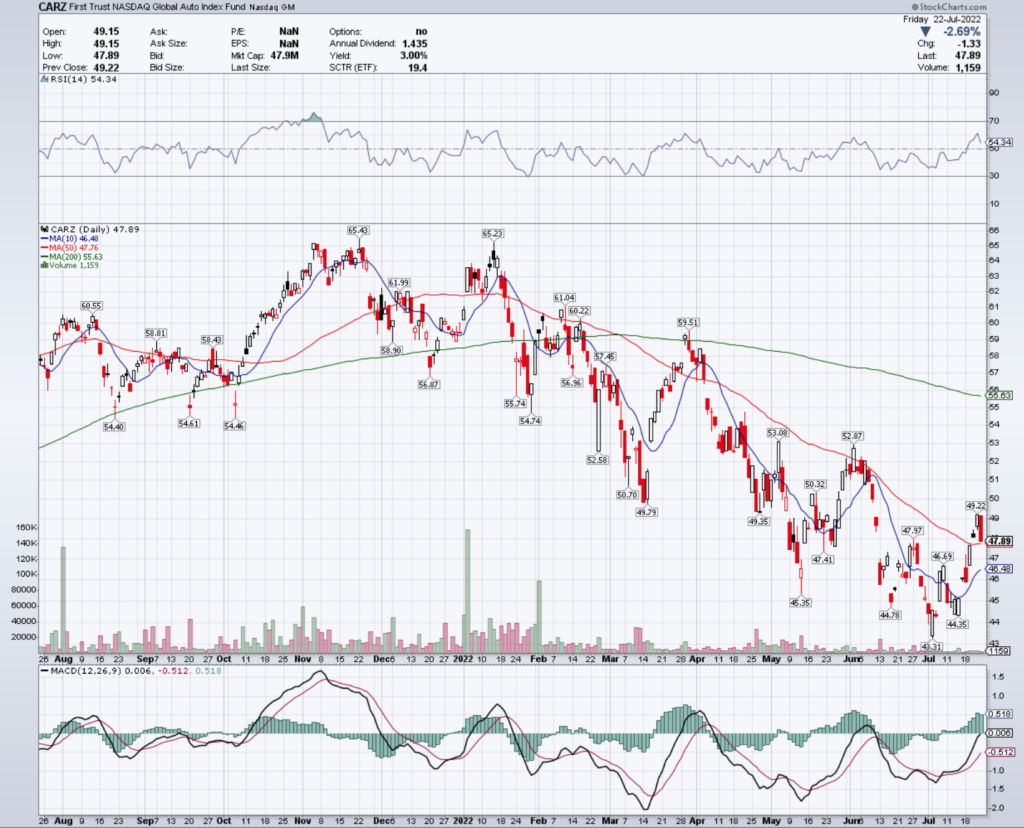
Cloud Computing (SKYY), U.S. Financial Services (IYG), Global Autos (CARZ) & Video Games & E-Sports (HERO) Are All Bearishly Lagging The Market
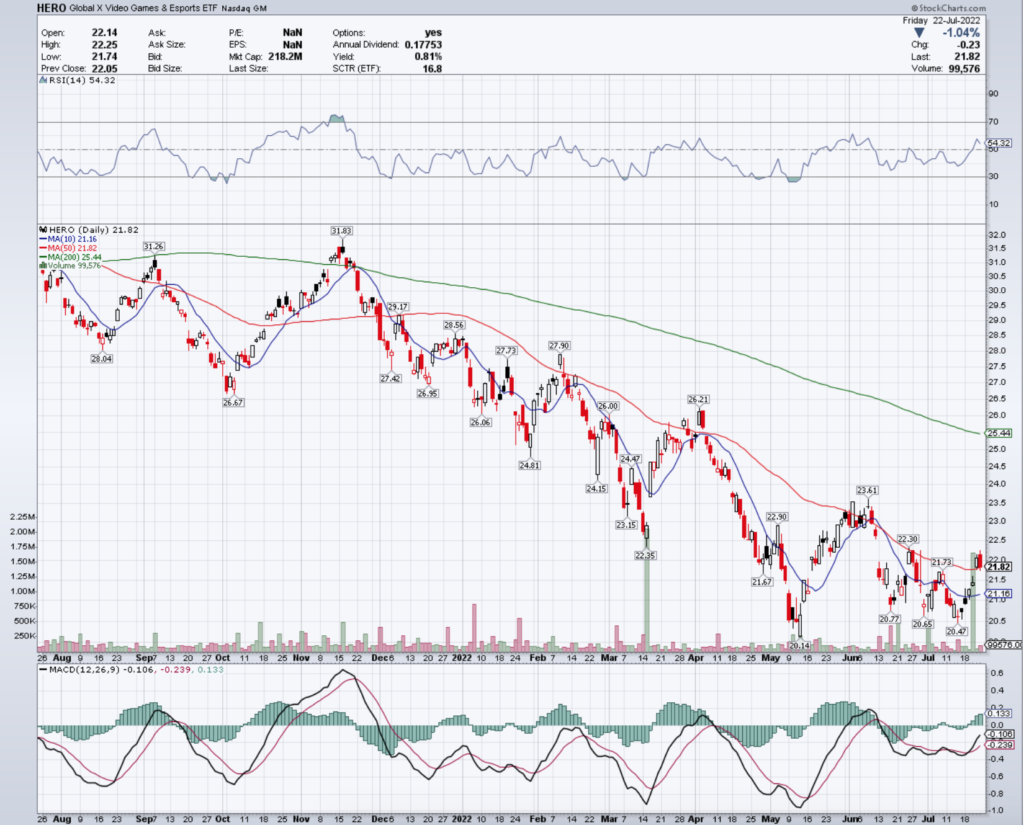
Traders can use their options to position themselves defensively against future losses, and shareholder get a 1.89% cushion of downside protection from their dividend.
CARZ ETF – First Trust NASDAQ Global Auto Index Fund ETF
They have not traded on meaningful volume over the last few months, when compared with the year prior, showing that sentiment is still not that confident & bullish.
Despite not having options to trade, they do offer a 3% dividend yield as a cushion for investors who purchase the ETF & hold it for a year to protect against losses from volatility.
They will need to break above the $22.30 & $22.90 price levels to reverse their downward trend, but traders can trade their options as they decline further to profit in the meantime.
Tying It All Together
While the largest & most anticipated news this week will be coming out of the Federal Reserve, earnings will also be a big contributor to market sentiments.
Earnings reports are still sounding pessimistic, and data is still weaker than what investors are anticipating.
How much volatility this creates will be key to figuring out the rest of the year’s interest rate decisions from the Federal Reserve, which will give clues about how to play out the rest of the year in the markets.
*** I DO NOT OWN SHARES OF SPUU, TQQQ, BOIL, JPIE, BKLN, IEF, SKYY, IYG, CARZ & HERO AT THE TIME OF PUBLISHING THIS ARTICLE ***
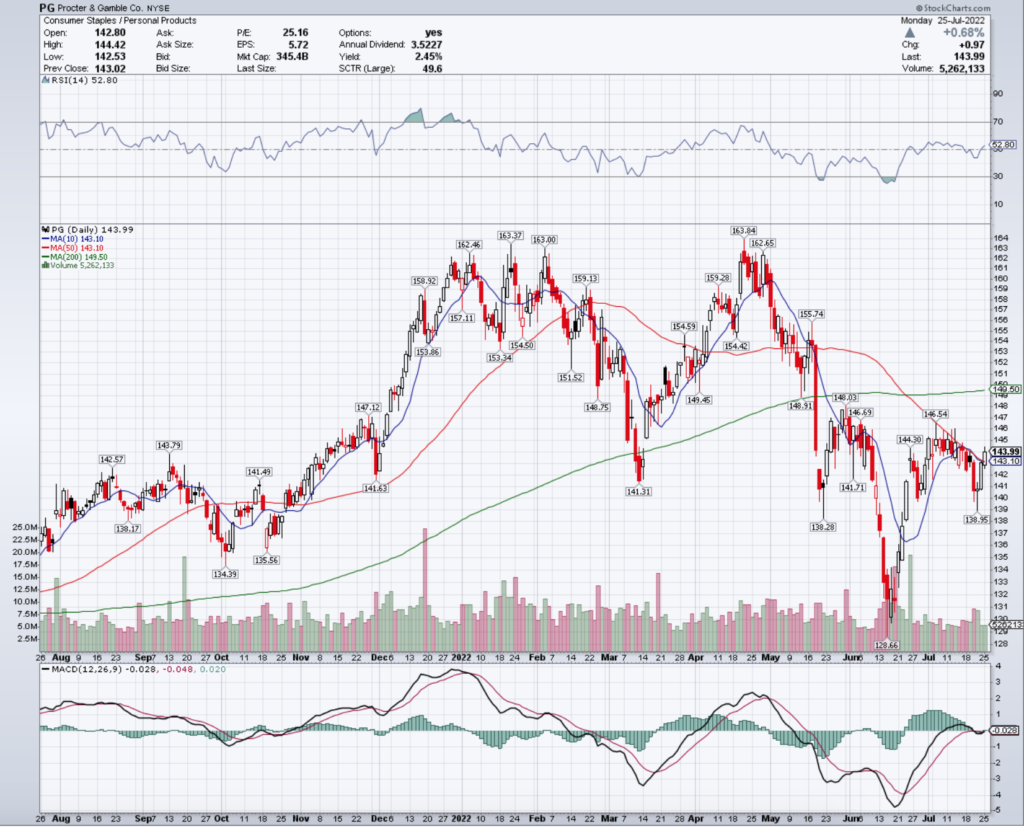
Yesterday, PG stock completed a bullish MACD crossover, breaking out & settling above both their 10 & 50 day moving averages.
Their recent momentum may be unsustainable though, with recent trading volumes being below average compared to the year prior & their RSI is neutral.
They will need to stay above the $142.57 & $143.79/share support levels, and will need to break above the $144.30/share resistance level to continue climbing higher.
Procter & Gamble Co. PG Stock As A Long-Term Investment
Long-term oriented investors will like PG stock’s 25 P/E (ttm), but will find their 7.69 P/B (mrq) to be too high.
They recently reported 7% Quarterly Revenue Growth Y-o-Y, with 2.6% Quarterly Earnings Growth Y-o-Y.
Their balance sheet will require a closer examination, with $8.53B of Total Cash (mrq) & $33.67B of Total Debt (mrq).
PG stock pays a 2.43% dividend yield, which may not be sustainable in the long-run, as their payout ratio is 60.83%.
65.9% of PG stock’s outstanding share float is owned by institutional investors.
Procter & Gamble Co. PG Stock As A Short-Term Trade Using Options
Short-term oriented traders can use options to profit from price movements in PG stock, while hedging against broader market volatility.
I am looking at the contracts with the 8/19 expiration date.
The $140, $142 & $141 call options are all in-the-money, listed from most to least liquid.
The $145, $144 & $147 puts are also in-the-money, with the former having more open interest than the latter two strikes.
Tying It All Together
Proctor & Gamble stock has many interesting characteristics that traders & investors are sure to like.
Investors will like their recent growth & their dividend yield, but may want to research their balance sheet further to find more clues about how sustainable the yield is.
Traders will like their recent market performance amid volatility, as well as the liquidity of their options.
All-in-all, PG stock is worth taking a closer look into to see how it fits into your portfolio strategy.
*** I DO NOT OWN SHARES OF PG STOCK AT THE TIME OF PUBLISHING THIS ARTICLE ***
Sun Communities, Inc. stock trades under the ticker SUI & has shown recent bullish behavior that traders & investors should research further into.
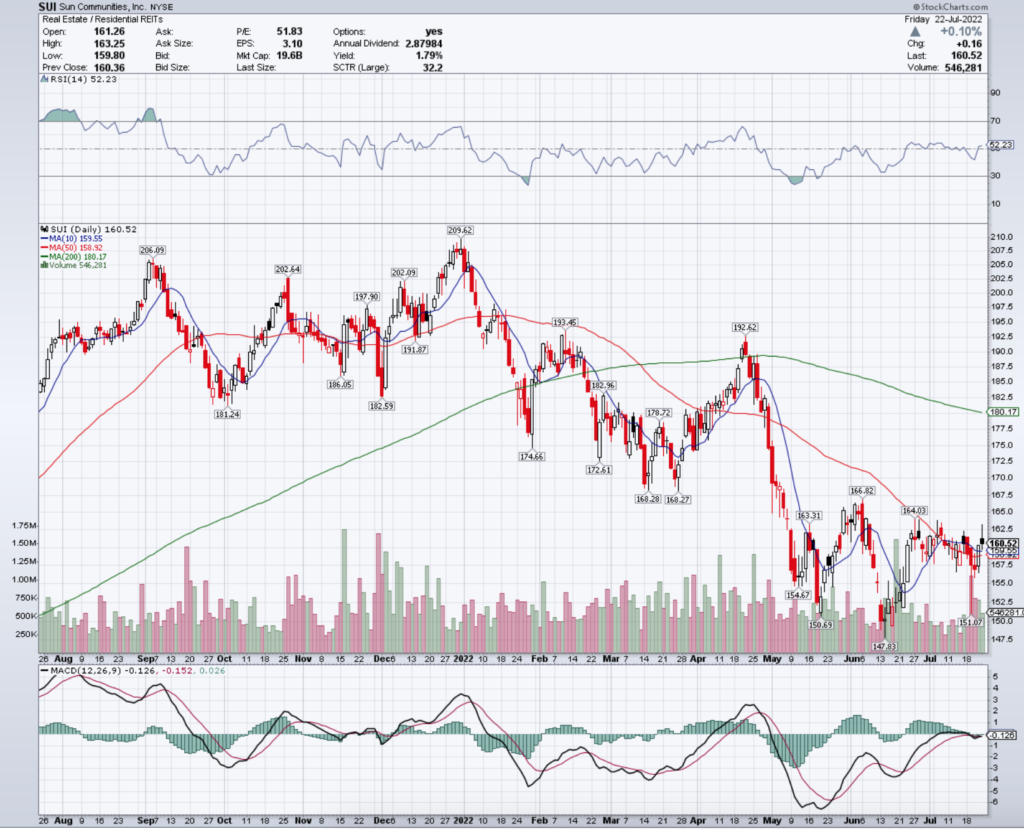
SUI stock closed at $160.52/share on 7/23/2022.
Sun Communities, Inc. SUI Stock’s Technical Performance Broken Down
SUI Stock Price: $160.52
10 Day Moving Average: $159.55
50 Day Moving Average: $158.92
200 Day Moving Average: $180.17
RSI: 52.23
MACD: -0.126
On Friday, SUI stock completed a bullish MACD crossover, settling above its 10 day moving average.
Their recent trading volumes have been about average for the last year, which paired with a neutral RSI signals there may be more near-term strength to come.
They need to break above the $163.31 & $164.03/share resistance levels to continue climbing higher.
Sun Communities, Inc. SUI Stock As A Long-Term Investment
Long-term oriented investors may find SUI stock’s valuation metrics to be a bit rich, with a 51.12 P/E (ttm) & a 2.98 P/B (mrq).
They recently reported 23.8% Quarterly Revenue Growth Y-o-Y, although their -97.2% Quarterly Earnings Growth Y-o-Y should be researched further before making an investment.
Their balance sheet will also require an additional review, with $116M of Total Cash (mrq) & $6.21B of Total Debt (mrq).
SUI stock pays a 2.10% dividend, which may not be sustainable in the long-run, with a 107% payout ratio.
Still, 98.5% of SUI stock’s outstanding share float is owned by institutional investors.
Sun Communities, Inc. SUI Stock As A Short-Term Trade Using Options
Short-term oriented traders can trade options to profit from price movements in SUI stock, while hedging against broader market volatility.
I am looking at the contracts with the 8/19 expiration date.
The $160 call options are in-the-money, while the out-of-the-money $165 & $170 strike prices also have open interest.
The $165 puts are also in-the-money, with liquidity in the out-of-the-money $160 & $155 strikes as well.
Tying It All Together
SUI stock has many interesting characteristics that traders & investors are sure to like.
Investors will like their dividend yield (should it remain sustainable) & strong institutional support, but may want to dig deeper into their balance sheet.
Traders will like their recent technical strength amid volatility, but will be disappointed by the liquidity of their options.
Overall, SUI stock is worth taking a closer look at to see how it fits into your portfolio strategy.
*** I DO NOT OWN SHARES OF SUI STOCK AT THE TIME OF PUBLISHING THIS ARTICLE ***
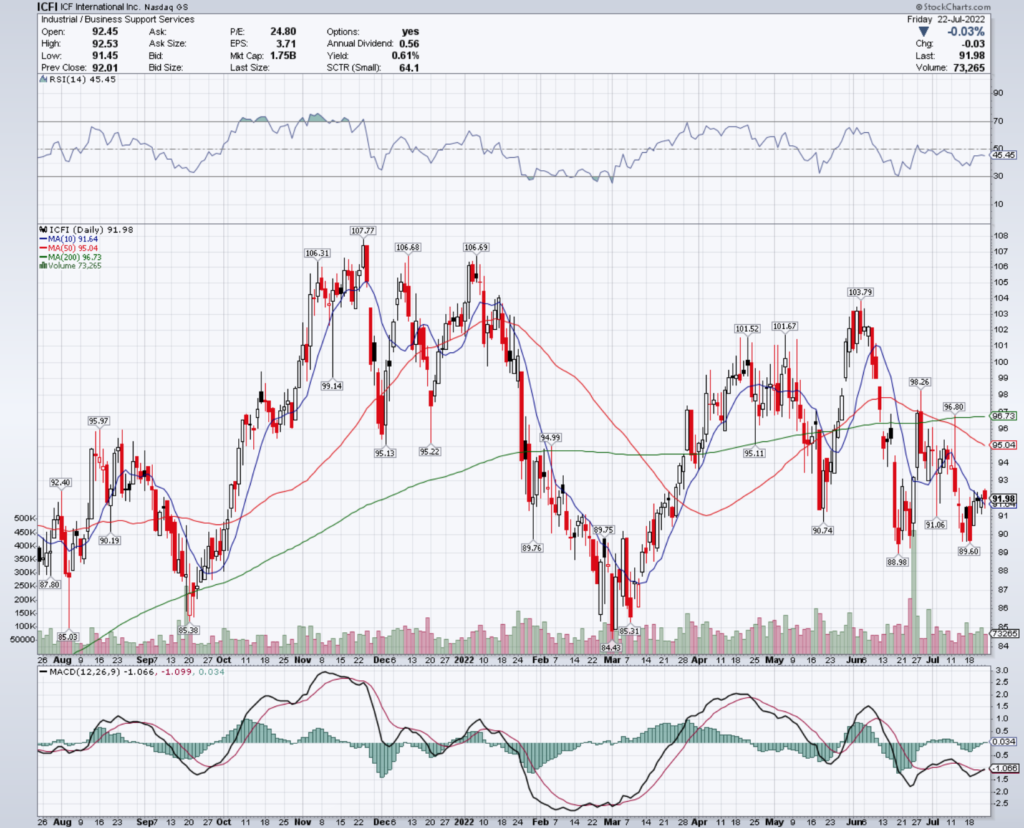
ICF International Inc. stock trades under the ticker ICFI & has shown recent bullishness that traders & investors should research further into.
ICFI stock closed at $91.98/share on 7/22/2022.
ICF International Inc. ICFI Stock’s Technical Performance Over The Last Year
ICFI Stock Price: $91.98
10 Day Moving Average: $91.64
50 Day Moving Average: $95.04
200 Day Moving Average: $96.73
RSI: 45.45
MACD: -1.066
On Friday, ICFI stock completed a bullish MACD crossover, settling down slightly, but remaining above its 10 day moving average.
Their recent trading volumes have been average compared to the year prior & their RSI is still neutral/oversold, signaling that there may be more strength to come in the near-term.
They need to break above the $92.40 & $94.99/share resistance levels as they continue climbing higher.
ICF International Inc. ICFI Stock As A Long-Term Investment
Long-term oriented investors will like ICFI stock’s valuation metrics, with a P/E (ttm) of 24.58 & a 2.13 P/B (mrq).
They recently reported 9.2% Quarterly Revenue Growth Y-o-Y, with -2.7% Quarterly Earnings Growth Y-o-Y.
Their balance sheet will require a closer review, with $7.39M of Total Cash (mrq) & $680.7M of Total Debt (mrq).
ICFI stock pays a 0.61% dividend yield, which appears stable in the long-term as their payout ratio is 15.14%.
94.7% of ICFI stock’s outstanding share float is owned by institutional investors.
ICF International Inc. ICFI Stock As A Short-Term Trade Using Options
Short-term oriented traders can use options to hedge against market volatility, while profiting from price movements in any direction.
I am looking at the contracts with the 9/16 expiration date.
They have very limited levels of open interest this far out, but the $90 calls are in-the-money, with liquidity in the out-of-the-money $95 & $100 strikes as well.
The $100 puts are the only strike in-the-money currently, but as time gets closer to expiration there should be more contracts written.
Tying It All Together
ICFI stock has many unique attributes that traders & investors should look closer into.
Investors will like their modest, but safe dividend yield, as well as their valuation metrics, but may want to review their balance sheet structure before investing.
Traders will like their recent technical strength amid market volatility, but will be disappointed by how illiquid their options are.
Overall, it is worth taking a closer look at ICFI stock to see how it fits into your portfolio strategy.
*** I DO NOT OWN SHARES OF ICFI STOCK AT THE TIME OF PUBLISHING THIS ARTICLE ***