Weyco Group, Inc. WEYS Stock Analysis

Weyco Group, Inc. stock trades under the ticker WEYS & has shown recent bullish behavior that traders & investors should take a closer look at.

WEYS stock closed at $25.82/share on 7/21/2022.

Weyco Group, Inc. WEYS Stock’s Technical Performance Broken Down

Weyco Group, Inc. WEYS Stock's Technical Performance Over The Last Year

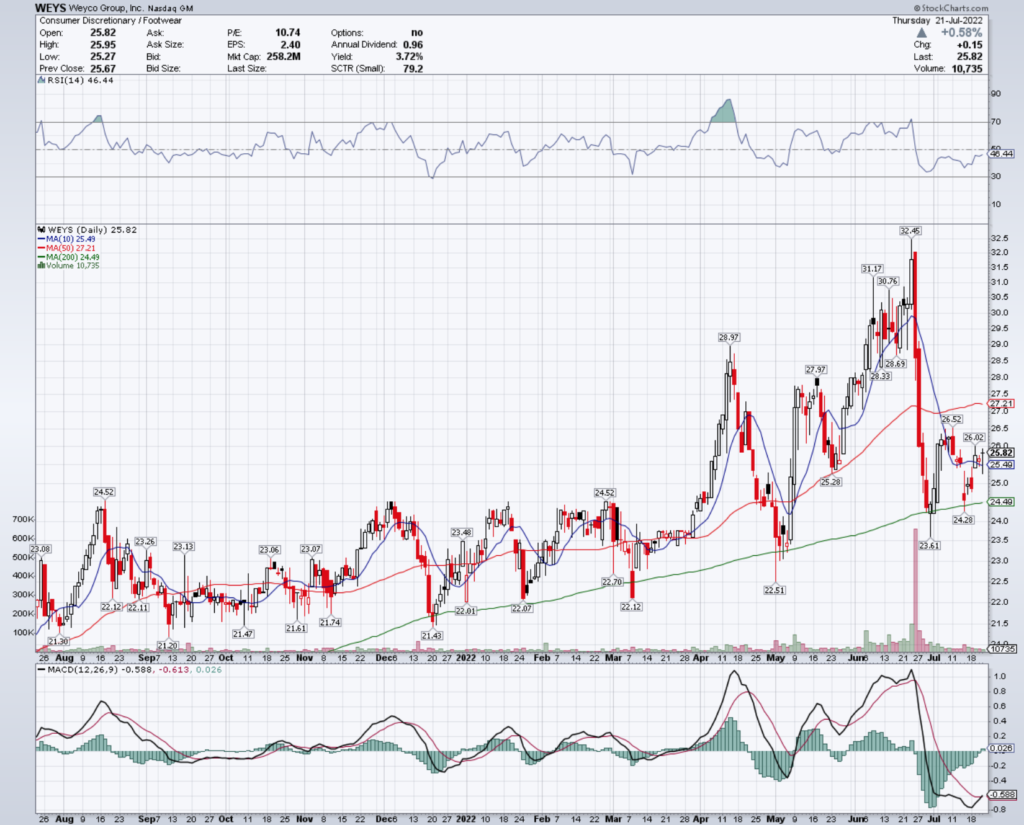
WEYS Stock Price: $25.82

10 Day Moving Average: $25.49

50 Day Moving Average: $27.71

200 Day Moving Average: $24.49

RSI: 46.44

MACD: -0.588

Yesterday, WEYS stock completed a bullish MACD crossover, while remaining over its 10 day moving average.

Their recent trading volumes have been about average compared to the year prior, and their RSI is still neutral, signaling that there may be some more strength left in the near-term.

They will need to break above the $26.02 & $26.52/share resistance levels as they continue to climb higher.

Weyco Group, Inc. WEYS Stock As A Long-Term Investment

Long-term oriented investors will like WEYS stock’s valuation metrics, with a 10.41 P/E (ttm) & a 1.19 P/B (mrq).

They recently reported 73.5% Quarterly Revenue Growth Y-o-Y, with 205.9% Quarterly Earnings Growth Y-o-Y.

Their balance sheet appears healthy, with $24.98M of Total Cash (mrq) & $10.34M of Total Debt (mrq).

WEYS stock pays a 3.74% dividend yield, which appears stable in the long-run, with a 40% payout ratio.

19.8% of WEYS stock’s outstanding share float is owned by institutional investors.

Weyco Group, Inc. WEYS Stock As A Short-Term Trade Using Options

Unfortunately, WEYS stock does not have options for traders to trade.

However, traders can use ETFs such as DES, the Wisdom Tree Small Cap Dividend Fund’s options as a means of getting some down-side protection for WEYS stock.

Tying It All Together

Overall, WEYS stock has many interesting characteristics that investors are sure to like.

Their valuation metrics & balance sheet both look healthy.

Their dividend yield is also nice & appears to be stable in the long-run based on their payout ratio.

While they do not have options to trade, ETFs can be leveraged to get downside protection for long-shares of WEYS stock.

It is worth researching WEYS stock more to see how it fits your portfolio strategy.

*** I DO NOT OWN SHARES OF WEYS STOCK AT THE TIME OF PUBLISHING THIS ARTICLE ***

General Dynamics Corp. GD Stock Analysis

General Dynamics Corp. stock trades under the ticker GD & has shown recent bullishness that traders & investors should take a closer look at.

GD stock closed at $216.89/share on 7/21/2022.

General Dynamics Corp. GD Stock’s Technical Performance Broken Down

General Dynamics Corp. GD Stock's Technical Performance Over The Last Year

GD Stock Price: $216.89

10 Day Moving Average: $215.22

50 Day Moving Average: $220.02

200 Day Moving Average: $215.70

RSI: 48.93

MACD: -1.837

Yesterday, GD stock completed a bullish MACD crossover, settling just above its 10 & 200 day moving averages at the close.

With a neutral RSI & trading volumes below average, there may be some weakness on the horizon for GD in the near-term, presenting an opportunity for a better entry price.

They will need to break above the $218.17/share price level, before going on to test the $221.92/share level.

General Dynamics Corp. GD Stock As A Long-Term Investment

Long-term oriented investors will like GD stock’s 18.22 P/E (ttm), but may find their 3.28 P/B (mrq) to be a bit rich.

They recently reported 0% Quarterly Revenue Growth Y-o-Y, with 3.1% Quarterly Earnings Growth Y-o-Y.

Their balance sheet may warrant a closer review, with $2.91B of Total Cash (mrq) & $13.17B of Total Debt (mrq).

GD stock pays a 2.23% dividend yield, which appears stable in the long-run, as their payout ratio is 51.5%.

86.5% of GD stock’s outstanding share float is owned by institutional investors.

General Dynamics Corp. GD Stock As A Short-Term Trade Using Options

Short-term oriented traders can use options to hedge against market volatility, while profiting from price movements in GD stock.

I am looking at the contracts with the 8/19 expiration date.

The $210, $215 & $207.50 calls are all in-the-money, listed from most to least liquid.

Currently, only the $220 puts are in-the-money, but since GD has weekly expirations, I expect there to be more contracts written as the weeks pass.

Tying It All Together

GD stock has many characteristics that traders & investors are sure to find appealing.

Investors will like their dividend yield, but may want to research into their balance sheet a bit more before investing.

Traders will like their current technicals, as well as their weekly option expirations.

Overall, GD stock is worth taking a closer look into to see how it fits into your portfolio strategy.

*** I DO NOT OWN SHARES OF GD STOCK AT THE TIME OF PUBLISHING THIS ARTICLE ***

Pepsico, Inc. PEP Stock Analysis

Pepsico, Inc. stock trades under the ticker PEP & has shown recent bearishness that traders & investors should take a closer look at.

PEP stock closed at $168.26/share on 7/20/2020.

Pepsico, Inc. PEP Stock’s Technical Performance Broken Down

Pepsico, Inc. PEP Stock's Technical Performance Over The Last Year

PEP Stock Price: $168.26

10 Day Moving Average: $170.10

50 Day Moving Average: $166.46

200 Day Moving Average: $165.05

RSI: 51.22

MACD: 1.286

Yesterday, PEP stock completed a bearish MACD crossover, on below average volume compared to the year prior.

This signals that there is not strong sentiment , but that the stock should incur more near-term losses, which will enable traders & investors to get a better price/share.

Their RSI is neutral & they look set to test their $167.70 & $167.62 support levels, with the $168.67/share level being the next level of resistance on their march higher.

Pepsico, Inc. PEP Stock As A Long-Term Investment

Long-term oriented investors will like PEP stock’s P/E (ttm) of 25.61, but will find their 12.65 P/B (mrq) to be too high.

They recently reported 5.2% Quarterly Revenue Growth Y-o-Y, although -39.4% Quarterly Earnings Growth Y-0-Y.

Their balance sheet will require a closer examination though, with $5.69B of Total Cash (mrq) & $39.28B of Total Debt (mrq).

PEP stock pays a 2.57% dividend yield, which may not be sustainable in the long-run, as their payout ratio is 65.9%.

73.9% of PEP stock’s outstanding share float is owned by institutional investors.

Pepsico, Inc. PEP Stock As A Short-Term Trade Using Options

Short-term oriented traders can use options to profit from price movements in PEP stock, while also hedging against market volatility.

I am looking at the contracts with the 8/19 expiration date.

The $165, $157.50 & $160 call options are all in-the-money, listed from highest to lowest levels of open interest.

The $170, $172.50 & $175 puts are also all in-the-money, with the former two being more liquid than the latter.

Tying It All Together

PEP stock has many interesting characteristics that traders & investors are sure to find appealing.

Investors will like their P/E (ttm) & dividend yield, but may want to review their balance sheet closer to ensure that their dividend will be sustainable in the longer-term.

Traders will like their options’ liquidity, despite their bearish technicals.

Overall, PEP stock is worth researching further into to see how it fits into your portfolio strategy.

*** I DO NOT OWN SHARES OF PEP STOCK AT THE TIME OF PUBLISHING THIS ARTICLE ***

Marathon Petroleum Corp. MPC Stock Analysis

Marathon Petroleum Corp. stock trades under the ticker MPC & has shown recent bullishness that traders & investors should take a closer look into.

MPC stock closed at $84.42/share on 7/15/2022.

Marathon Petroleum Corp. MPC Stock’s Technical Performance Broken Down

Marathon Petroleum Corp. MPC Stock's Technical Performance Over The Last Year

MPC Stock Price: $84.42

10 Day Moving Average: $82.56

50 Day Moving Average: $93.91

200 Day Moving Average: $77.18

RSI: 44.04

MACD: -3.687

On Friday, MPC stock completed a bullish MACD crossover, gapping up 4.64% to settle above its 10 day moving average at the close.

While their RSI is on the oversold end of neutral, their recent trading volume has been below average for the year, signaling that recent sentiment around their price movements is not strong.

They will need to break above the $85.18/share resistance level to continue climbing higher, while keeping above their support at $83.60/share.

Marathon Petroleum Corp. MPC Stock As A Long-Term Investment

Long-term oriented investors will like MPC stock’s P/E (ttm) of 19.91, but may find their 1.91 P/B (mrq) to be higher than they’d like.

They recently reported 67.9% Quarterly Revenue Growth Y-o-Y.

Their balance sheet will require a more thorough examination, with $10.6B of Total Cash (mrq) & $28.03B of Total Debt (mrq).

MPC stock pays a 2%.88 dividend yield, which looks to be sustainable in the long-run, although their payout ratio is high at 54.72%.

79.6% of MPC stock’s outstanding share float is owned by institutional investors.

Marathon Petroleum Corp. MPC Stock As A Short-Term Trade Using Options

Short-term oriented traders can use options to hedge against market volatility, while also profiting from price movements in MPC stock.

I am looking at the contracts with the 8/5 expiration date.

The $83, $84 & $80 calls are all in-the-money, listed from most to least liquid.

The $87, $85, $86 & $88 are also in-the-money, listed in order of most to least open interest.

As MPC has weekly expiration dates, there may be more contracts written as other expiration dates pass.

Tying It All Together

MPC stock has many interesting characteristics that traders & investors should find appealing.

Investors will like their dividend yield, as well as their recent reported growth.

Traders will like their current momentum, as well as their weekly options expirations.

All-in-all, it is worth taking a closer look into MPC stock to see how it fits into your portfolio strategy.

*** I DO NOT OWN SHARES OF MPC STOCK AT THE TIME OF PUBLISHING THIS ARTICLE ***

Dorian LPG, Ltd. LPG Stock Analysis

Dorian LPG, Ltd. stock trades under the ticker LPG & has shown recent bullishness that traders & investors should research further.

LPG stock closed at $15.27/share on 7/15/2022.

Dorian LPG, Ltd. LPG Stock’s Technical Performance Broken Down

Dorian LPG, Ltd. LPG Stock's Technical Performance Over The Last Year

LPG Stock Price: $15.27

10 Day Moving Average: $14.64

50 Day Moving Average: $15.61

200 Day Moving Average: $12.15

RSI: 51.84

MACD: -0.234

On Friday, LPG stock completed a bullish MACD crossover, climbing 2.9% to settle above its 10 day moving average.

With a neutrak RSI there is potential for more near-term momentum, but recent trading volumes have been light, signaling that there is still uncertainty in the market.

They will need to break above the $15.78 & $16.46/share resistance level as they continue climbing higher.

Dorian LPG, Ltd. LPG Stock As A Long-Term Investment

Long-term oriented investors will like LPG stock’s valuation metrics, with a 8.58 P/E (ttm) & a 0.67 P/B (mrq).

They recently reported -22.7% Quarterly Revenue Growth Y-o-Y, with -19.6% Quarterly Earnings Growth Y-o-Y, which may be a cause for concern to investors.

Their balance sheet also will require some additional research before making an investment, with $236.8M of Total Cash (mrq) & $670.8M of Total Debt (mrq).

LPG stock pays a 30.32% dividend yield, which appears to not be sustainable in the long-run, as their payout ratio is 112.4%.

Still, 73.6% of LPG stock’s outstanding share float is owned by institutional investors.

Dorian LPG, Ltd. LPG Stock As A Short-Term Trade Using Options

Short-term oriented traders can use options to hedge against market volatility, while profiting from movements in LPG stock’s price.

I am looking at the contracts with the 8/19 expiration date.

The $15 & $12.50 call options are in-the-money, with the former being the most liquid.

There are no in-the-money puts currently, unless we look to 9/16’s expiration, where the $17.50, $20 & $25 contracts are in-the-money.

Tying It All Together

LPG stock has many interesting attributes that traders & investors should find appealing.

Investors will like their valuation metrics, but may be disappointed in how unsustainable their dividend’s payout ratio is (although their yield is still quite high).

Traders will like their current momentum, but may be disappointed by how illiquid their options are.

All-in-all, it is worth taking a closer look into EGLE stock to see how it fits into your portfolio strategy.

*** I DO NOT OWN SHARES OF LPG STOCK AT THE TIME OF PUBLISHING THIS ARTICLE ***

Eagle Bulk Shipping Inc. EGLE Stock Analysis

Eagle Bulk Shipping Inc. stock trades under the ticker EGLE & has recently shown bullishness that traders & investors should take a closer look at.

EGLE stock closed at 47.21/share on 7/15/2022.

Eagle Bulk Shipping Inc. EGLE Stock’s Technical Performance Broken Down

Eagle Bulk Shipping Inc. EGLE Stock's Technical Performance Over The Last Year

EGLE Stock Price: $47.21

10 Day Moving Average: $44.94

50 Day Moving Average: $59.76

200 Day Moving Average: $50.23

RSI: 39.22

MACD: -4.604

On Friday, EGLE stock completed a bullish MACD crossover, gapping up 5.38% to settle above its 10 day moving average at the close.

Their RSI is on the oversold end of neutral, and their recent trading volume has been roughly average recently compared to the year prior, signaling that there still may be more more near-term momentum.

They will need to break above the $47.86 & $49.24/share resistance levels as they continue to climb higher.

Eagle Bulk Shipping Inc. EGLE Stock As A Long-Term Investment

Long-term oriented investors will like EGLE stock’s valuation metrics, with a 3.15 P/E (ttm) & a 0.88 P/B (mrq).

They recently reported 90.9% Quarterly Revenue Growth Y-o-Y, with 438.9% Quarterly Earnings Growth Y-o-Y.

Their balance sheet will require a closer examination before investing though, with $85.97M of Total Cash (mrq) & $398.84M of Total Debt (mrq).

EGLE stock pays a 13.5% dividend yield, which appears stable in the long-term, with a 28.5% payout ratio.

84.2% of EGLE stock’s outstanding share float is owned by institutional investors.

Eagle Bulk Shipping Inc. EGLE Stock As A Short-Term Trade Using Options

Short-term oriented traders can use options to hedge against market volatility, while profiting from movements in EGLE stock’s price.

I am looking at the contracts with the 8/19 expiration date.

The $45, $40 & $30 call options are all in-the-money, listed from most to least levels of open interest.

The $50, $55 & $60 puts are also all in-the-money, listed from most to least liquid.

Tying It All Together

EGLE stock has many interesting attributes that traders and investors should find appealing.

Investors will like their dividend yield & valuation metrics, but may want to review their balance sheet more closely.

Traders will like their recent momentum, but may be disappointed in how liquid their options are.

Overall, it is worth taking a closer look into EGLE stock to see how it fits into your portfolio strategy.

*** I DO NOT OWN SHARES OF EGLE STOCK AT THE TIME OF PUBLISHING THIS ARTICLE ***

Stepan Co. SCL Stock Analysis

Stepan Co. stock trades under the ticker SCL & has shown recent bullishness that traders & investors should look closer into.

SCL stock closed at $99.26/share on 7/14/2022.

Stepan Co. SCL Stock’s Technical Performance Broken Down

Stepan Co. SCL Stock's Technical Performance Over The Last Year

SCL Stock Price: $99.26

10 Day Moving Average: $99.91

50 Day Moving Average: $103.87

200 Day Moving Average: 109.81

RSI: 42.94

MACD: -1.337

Yesterday, SCL stock completed a bullish MACD crossover, trading at about average volume compared to the year prior.

Their RSI is still on the oversold side of neutral, signaling that there may be more bullish momentum to come in the near-term.

SCL will need to break above the $100.46 & $102.34/share resistance levels to continue climbing higher.

Stepan Co. SCL Stock As A Long-Term Investment

Long-term oriented investors will like SCL stock’s valuation metrics, with a P/E (ttm) of 16.11 & a P/B (mrq) of 1.97.

They recently reported 25.6% Quarterly Revenue Growth Y-o-Y, with 10.3% Quarterly Earnings Growth Y-o-Y.

Their balance sheet will require a closer review, reporting $236.04M of Total Cash (mrq), with $605.5M of Total Debt (mrq).

SCL stock pays a 1.3% dividend yield, which appears stable in the long-run, as their payout ratio is 20.95%.

80.3% of SCL stock’s outstanding share float is owned by institutional investors.

Stepan Co. SCL Stock As A Short-Term Trade Using Options

Short-term oriented traders can use options to profit from SCL stock’s price movements, while hedging against broader market volatility.

I am looking at the contracts with the 9/16 expiration date.

The $75, $85 & $80 call options are all in-the-money, listed from highest to lowest levels of open interest.

The $100 & $115 puts are also in-the-money, with the former being more liquid than the latter.

As there are 2 other expiration dates between now & 9/16, there should be more contracts being written in the coming months.

Tying It All Together

Stepan Co. stock has many interesting characteristics that traders & investors are sure to like.

Investors will like their dividend yield & valuation metrics, but may want to review their balance sheet further before making an investment.

Traders will like their technical set up, but may want to wait to see if their contracts become more liquid in the coming weeks as other expiration dates pass.

Overall, it is worth seeing how SCL stock fits into your portfolio strategy.

*** I DO NOT OWN SHARES OF SCL STOCK AT THE TIME OF PUBLISHING THIS ARTICLE ***

Coterra Energy Inc. CTRA Stock Analysis

Coterra Energy Inc. stock trades under the ticker CTRA & has shown recent bullish behavior that traders & investors should research further into.

CTRA stock closed at $26.34/share on 7/12/2022.

Coterra Energy Inc. CTRA Stock’s Technical Performance Broken Down

Coterra Energy Inc. CTRA Stock's Technical Performance Over The Last Year

CTRA Stock Price: $26.34

10 Day Moving Average: $26.29

50 Day Moving Average: $30.28

200 Day Moving Average: $24.06

RSI: 39.37

MACD: -1.399

Yesterday, CTRA stock completed a bullish MACD crossover, settling just above its 50 day moving average.

Their RSI is still oversold & recent volumes have been about average compared to the year prior, signaling that while there is still some uncertainty around the stock, there may be more momentum in the near-term.

They will need to stay above the $25.37/share support level, and break above the $27.27 & $28.37/share resistance levels to continue climbing higher.

Coterra Energy Inc. CTRA Stock As A Long-Term Investment

Long-term oriented investors will like CTRA stock’s valuation metrics, with a 9.67 P/E (ttm) & a 1.81 P/B (mrq).

They recently reported 324.3% Quarterly Revenue Growth Y-o-Y, with 382.5% Quarterly Earnings Growth Y-o-Y.

Their balance sheet will need a closer examination, with $1.45B of Total Cash (mrq) & $3.44B of Total Debt (mrq).

CTRA stock pays a 4.1% dividend yield, which appears stable in the long-term, with an 18.2% payout ratio.

95.5% of CTRA stock’s outstanding share float is owned by institutional investors.

Coterra Energy Inc. CTRA Stock As A Short-Term Trade Using Options

Short-term focused traders can use options to profit from CTRA stock’s price movements, while also hedging against broader market volatility.

I am looking at the contracts with the 7/22 expiration date.

The $25, $26 & $24 call options are all in-the-money, listed from highest to lowest levels of open interest.

The $28, $27.50, $27 & $26.50 puts are also all in-the-money, named in order to most to least liquid strikes.

Tying It All Together

CTRA stock has many characteristics that traders & investors are sure to find appealing.

Investors will like their valuation metrics & dividend yield, but may want to look closer into the structure of their balance sheet.

Traders will like their current momentum, but may find that their options are not as liquid as they’d like them to be.

All-in-all, CTRA stock is worth taking a closer look into to see how it fits into your portfolio strategy.

*** I DO NOT OWN SHARES OF CTRA STOCK AT THE TIME OF PUBLISHING THIS ARTICLE ***

Dorchester Minerals, LP DMLP Stock Analysis

Dorchester Minerals, LP stock trades under the ticker DMLP & has shown recent bullishness that traders & investors should research further into.

DMLP stock closed at $24.69/share on 7/12/2022.

Dorchester Minerals, LP DMLP Stock’s Technical Performance Broken Down

Dorchester Minerals, LP DMLP Stock's Technical Performance Over The Last Year

DMLP Stock Price: $24.69

10 Day Moving Average: $24.82

50 Day Moving Average: $27.55

200 Day Moving Average: $22.41

RSI: 42.26

MACD: -1.014

Yesterday, DMLP stock completed a bullish MACD crossover, trading on roughly average volume compared to the year prior.

Their RSI is still leaning towards oversold, and they need to remain above the $23.28/share support level.

They will need to cross above the $25.57 & $27.15/share resistance levels to continue climbing higher.

Dorchester Minerals, LP DMLP Stock As A Long-Term Investment

Long-term oriented investors will like DMLP stock’s P/E (ttm) of 10.48, but will find their P/B (mrq) of 5.81 to be too high.

They recently reported 127.1% Quarterly Revenue Growth Y-o-Y, with 159% Quarterly Earnings Growth Y-o-Y.

Their balance sheet looks appealing, with $32.97M of Total Cash (mrq) & $1.81M of Total Debt (mrq).

DMLP stock pays a 9.37% dividend yield, which may not be sustainable in the long-term, as their payout ratio is 80.12%.

21% of DMLP stock’s outstanding share float is owned by institutional investors.

Dorchester Minerals, LP DMLP Stock As A Short-Term Trade Using Options

Short-term focused traders can use options to protect themselves from broader market volatility, while profiting from price movements in DMLP stock.

I am looking at the contracts with the 8/19 expiration date.

The $22.50, $20, $17.50 & $15 calls are all in-the-money, listed in order of highest to lowest levels of open interest.

The $25, $30 & $35 puts are also in-the-money, listed from most to least liquid strike price.

Tying It All Together

DMLP stock has many unique characteristics that traders & investors will find appealing.

Long-term oriented investors will like their balance sheet & dividend yield, but may want to look deeper into how sustainable their yield is based on their payout ratio.

Short-term focused traders will like their current technical momentum, but may be disappointed by how liquid their options are.

Overall, DMLP stock is worth researching further into to see how it fits into your portfolio strategy.

*** I DO NOT OWN SHARES OF DMLP STOCK AT THE TIME OF PUBLISHING THIS ARTICLE ***

Southwest Gas Corp. SWX Stock Analysis

Southwest Gas Corp. stock trades under the ticker SWX & has shown recent bullishness that traders & investors should research further.

SWX stock closed at $86.63/share on 7/11/2022.

Southwest Gas Corp. SWX Stock’s Technical Performance Broken Down

SWX Stock Price: $86.63

10 Day Moving Average: $86.98

50 Day Moving Average: $89.42

200 Day Moving Average: $74.95

RSI: 46.02

MACD: -0.816

Yesterday, SWX stock completed a bullish MACD crossover, trading on below average volume compared to the year prior & settling below their 10 day moving average.

With a neutral RSI, there could be more momentum left in the tank to continue climbing higher in the near-term.

They will need to break above the $87.04 & $87.46/share resistance levels as they continue to climb higher.

Southwest Gas Corp. SWX Stock As A Long-Term Investment

Long-term oriented investors will like SWX stock’s valuation metrics, with a 29.47 P/E (ttm) & a 1.65 P/B (mrq).

They recently reported 43.1% Quarterly Revenue Growth Y-o-Y, with -18% Quarterly Earnings Growth Y-o-Y.

Their balance sheet will require a more thorough examination, with $624.7M of Total Cash (mrq) & $6.32B of Total Debt (mrq).

SWX stock pays a 2.76% dividend yield, which may not be sustainable in the long-term, as their payout ratio is 81.23%.

95.89% of SWX stock’s outstanding share float is owned by institutional investors.

Southwest Gas Corp. SWX Stock As A Short-Term Trade Using Options

Short-term oriented traders can use options to profit from SWX stock’s price movements, while hedging against broader market volatility.

I am looking at the contracts with the 7/15 expiration date.

The $65, $80 & $85 call options are all in-the-money, listed from highest to lowest levels of open interest.

The $95, $90 & $100 puts are also in-the-money, although quite illiquid, in order of most to least liquid.

Tying It All Together

SWX stock has many attributes that traders & investors are sure to find appealing.

Investors will like their valuation metrics, but may want to spend more time combing through their balance sheet to help them understand how long their dividend can remain so high.

Traders will like their current momentum, but may with that their options were a bit more liquid.

Overall, SWX stock is worth taking a closer look into to see how it fits into your portfolio strategy.

*** I DO NOT OWN SHARES OF SWX STOCK AT THE TIME OF PUBLISHING THIS ARTICLE ***