Broadcom Inc. stock has had a fantastic 2023, rising +111.83% (ex-dividends) from their 52-week low in October of 2022.
Much like other semiconductor industry peers, their price trend has been a very stable trajectory over the past year.
83.99% of AVGO’s outstanding share float is owned by institutional investors, and they are a major holding in many popular ETFs including SOXL (7.95% target, per their prospectus), USD (11.63%), SMH (5.4%) & many more.
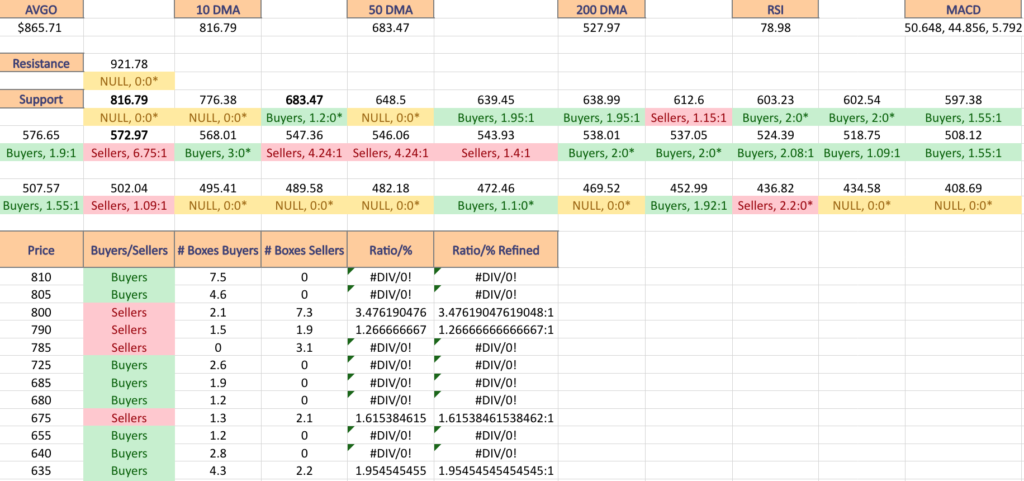
The Price:Volume analysis seeks to display the volume at specific share-price levels from over the past year & is intended to serve as a reference point for how investors viewed AVGO stock’s value at each level.
It also includes a list of moving averages, as well as support & resistance levels, which will be marked in bold.
Broadcom Inc. AVGO Stock’s Price:Volume Sentiment Broken Down
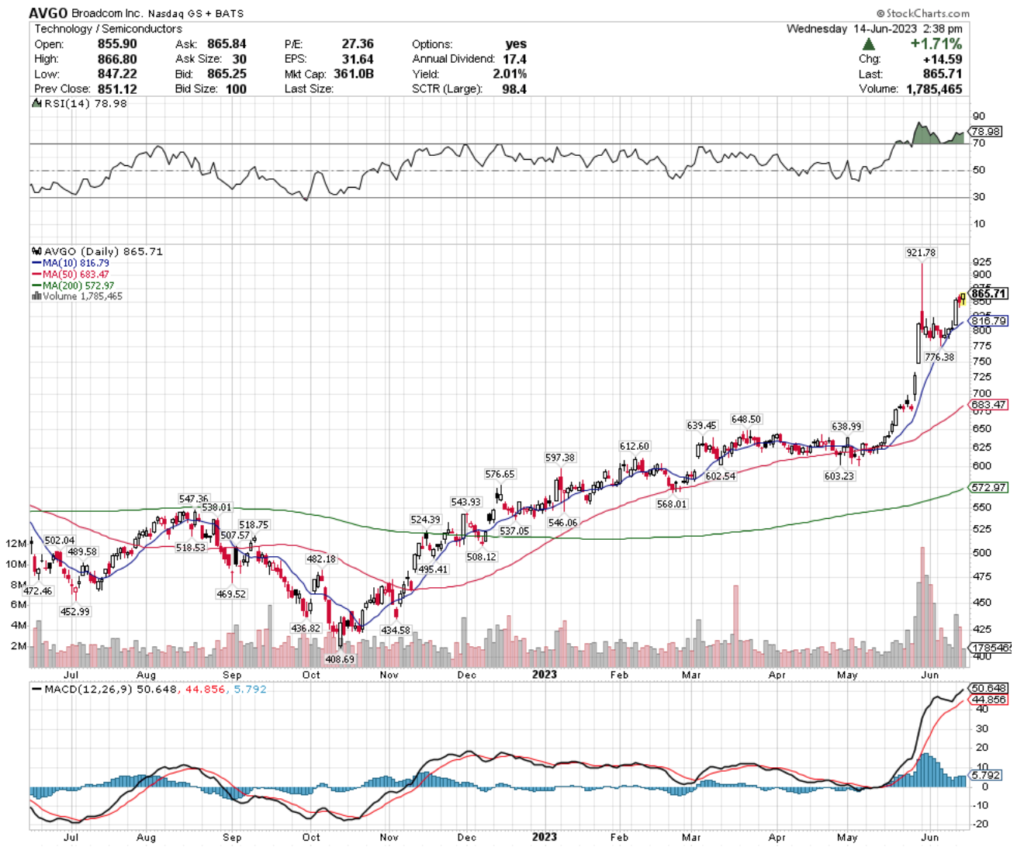
Broadcom Corp. AVGO Stock’s Technical Performance Over The Past Year
AVGO stock’s RSI is currently overbought at 78.98, with their MACD still bullishly trending upwards, as they’ve continued to climb higher after late May’s gap up session.
While the past week’s volumes have subsided a bit, the past month has seen above average volume compared to the year prior, signaling enthusiasm among investors & traders.
AVGO stock’s 10 Day Moving Average is $816.79, their 50 Day Moving Average is $683.47 & their 200 Day Moving Average is $572.97.
The bold prices on the image below denote the moving average levels just listed & the bold entries in the list form of the analysis under the images include other levels of support (there is no data for their limited resistance levels).
Each corresponding price level using a ratio of Buyers:Sellers (or Sellers:Buyers), NULL values denote that there was not enough data, so the ratio would’ve been 0:0.
Ratios with a 0 for the denominator/constant are denoted with an *, but are reported as is, as we are accounting for volume/sentiment.
Also, as there is such a wide spread between many price levels, many of the resistance levels are marked NULL, as there was limited volume data for them & they were not included in the long list.
Broadcom Corp. AVGO Stock’s Volume By Price Level, Including At Support & Resistance Levels From The Past Year
Broadcom Corp. AVGO Stock’s Volume By Price Level, Including At Support & Resistance Levels From The Past Year
Broadcom Corp. AVGO Stock’s Volume By Price Level, Including At Support & Resistance Levels From The Past Year
AVGO Stock’s Volume By Price Level
$810 – Buyers – 7.5:0
$805 – Buyers – 4.6:0*
$800 – Sellers – 3.48:1
$790 – Sellers – 1.27:1
$785 – Sellers – 3.1:0*
$725 – Buyers – 2.6:0*
$685 – Buyers – 1.9:0*
$680 – Buyers – 1.2:0*– 50 Day Moving Average
$675 – Sellers – 1.62:1
$655 – Buyers – 1.2:0*
$640 – Buyers – 2.8:0*
$635 – Buyers – 1.95:1
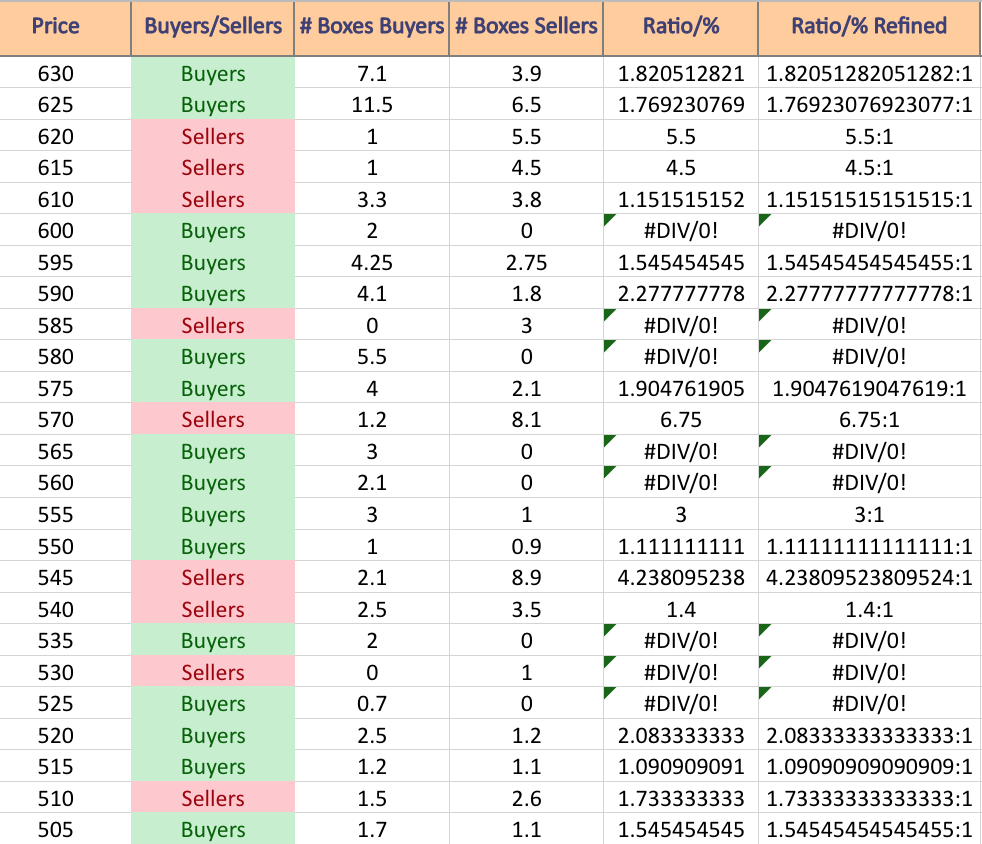
$630 – Buyers – 1.82:1
$625 – Buyers – 1.77:1
$620 – Sellers – 5.5:1
$615 – Sellers – 4.5:1
$610 – Sellers – 1.15:1
$600 – Buyers – 2:0*
$595 – Buyers – 1.55:1
$590 – Buyers – 2.28:1
$585 – Sellers – 3:0*
$580 – Buyers – 5.5:0*
$575 – Buyers – 1.90:1
$570 – Sellers – 6.75:1– 200 Day Moving Average
$565 – Buyers – 3:0*
$560 – Buyers – 2.1:0*
$555 – Buyers – 3:1
$550 – Buyers – 1.11:1
$545 – Sellers – 4.24:1
$540 – Sellers – 1.4:1
$535 – Buyers – 2:0*
$530 – Sellers – 1:0*
$525 – Buyers – 0.7:0*
$520 – Buyers – 2.08:1
$515 – Buyers – 1.09:1
$510 – Sellers – 1.73:1
$505 – Buyers – 1.55:1
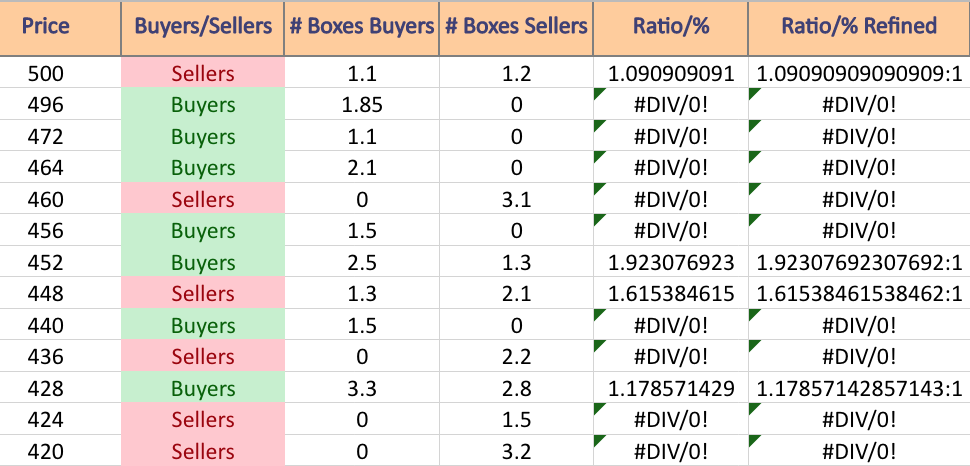
$500 – Sellers – 1.09:1
$496 – Buyers – 1.85:0*
$472 – Buyers – 1.1:0*
$464 – Buyers – 2.1:0*
$460 – Sellers – 3.1:0*
$456 – Buyers – 1.5:0*
$452 – Buyers – 1.92:1
$448 – Sellers – 1.62:1
$440 – Buyers – 1.5:0*
$436 – Sellers – 2.2:0*
$428 – Buyers – 1.18:1
$424 – Sellers – 1.5:0*
$420 – Sellers – 3.2:0*
Tying It All Together
The list & image above paint the picture as to how investors & traders have behaved at various price levels that AVGO has been at over the past one-to-two years.
It is not meant to serve as investment/trading advice, and is simply a way to visualize what investor/trader sentiment has been like at each of the price levels mentioned, as well as what it was at levels of support & resistance that are denoted in the image & list.
As always, do your own due diligence before making investing/trading decisions.
For more on the methodology on how the data was collected & put together, please refer to our original Price:Volume analysis.
*** I DO NOT OWN SHARES OR OPTIONS CONTRACT POSITIONS IN AVGO AT THE TIME OF PUBLISHING THIS ARTICLE ***
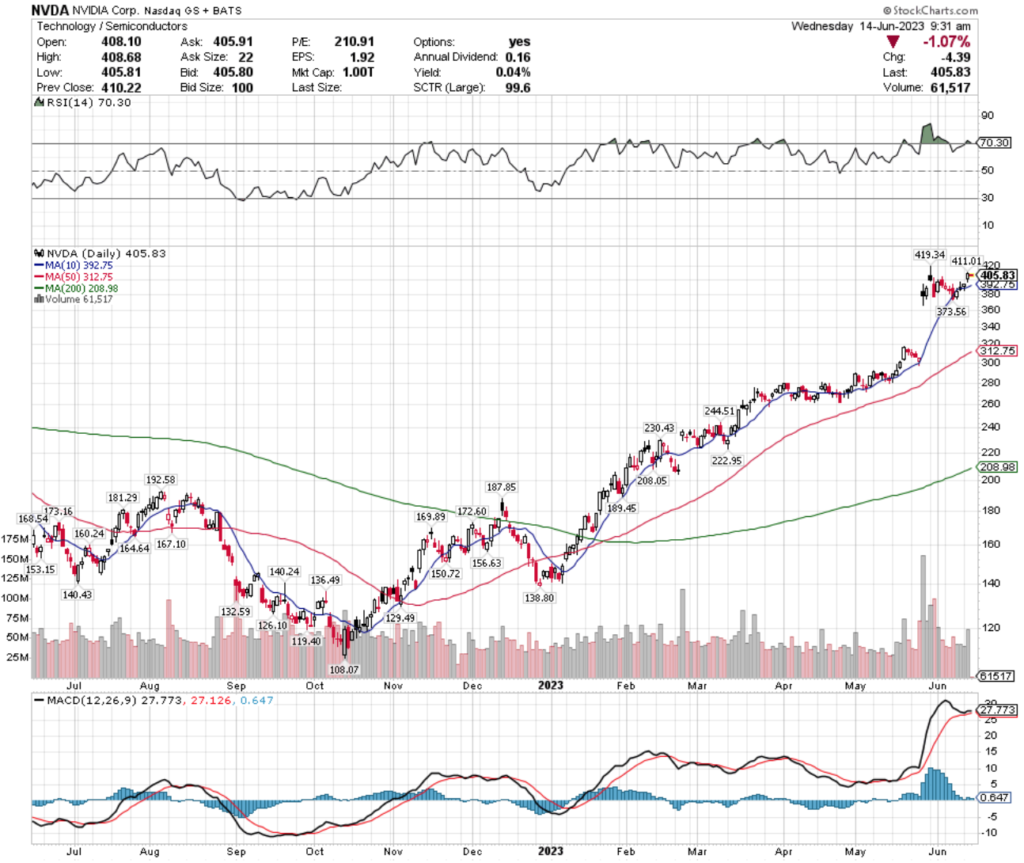
NVIDIA Corp. has been one of the stock market’s biggest darlings this year, climbing +275.53% since their 52-week low n October of 2022.
Their share price has been in a relatively consistent upward trajectory since October, with a only a few hiccups along the way.
NVDA is also a major holding in many ETFs that have been performing well this year, including SOXL (8.81%, per prospectus), USD (29.6%), SMH (17.3%) & many others.
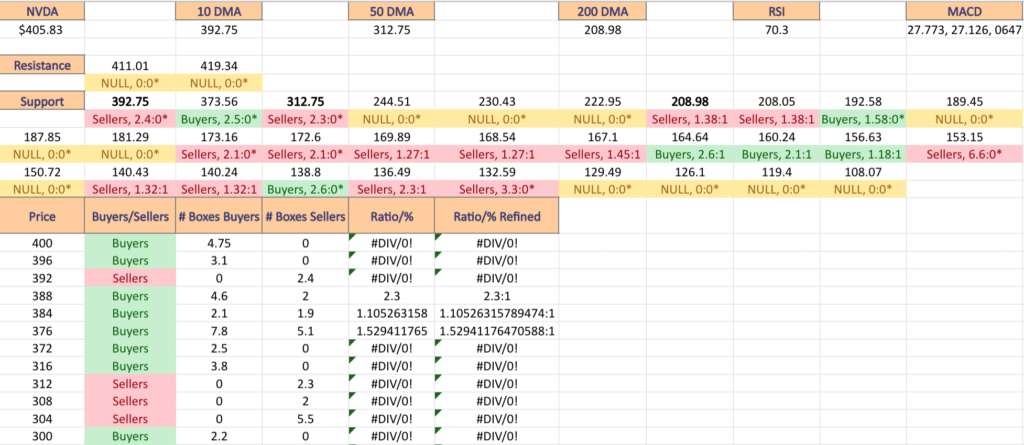
The Price:Volume analysis seeks to display the volume at specific share-price levels from over the past year & is intended to serve as a reference point for how investors viewed NVDA stock’s value at each level.
It also includes a list of moving averages, as well as support & resistance levels, which will be marked in bold.
NVIDIA Corp. NVDA Stock’s Price:Volume Sentiment Broken Down
NVIDIA Corp. NVDA Stock’s Technical Performance Over The Past Year
As the chart shows, NVDA has had an excellent year, which was pumped up even higher by a gap up at the end of May.
Their RSI is currently overbought at 70.3 & their MACD is still bullish, but has cooled off in the past week as their price consolidated around the gap up’s range.
NVDA stock’s 10 Day Moving Average is $392.75, their 50 Day Moving Average is $312.75 & their 200 Day Moving Average is $208.98.
The bold prices on the image below denote the moving average levels just listed & the bold entries in the list form of the analysis under the images include other levels of support (there is no data for their limited resistance levels).
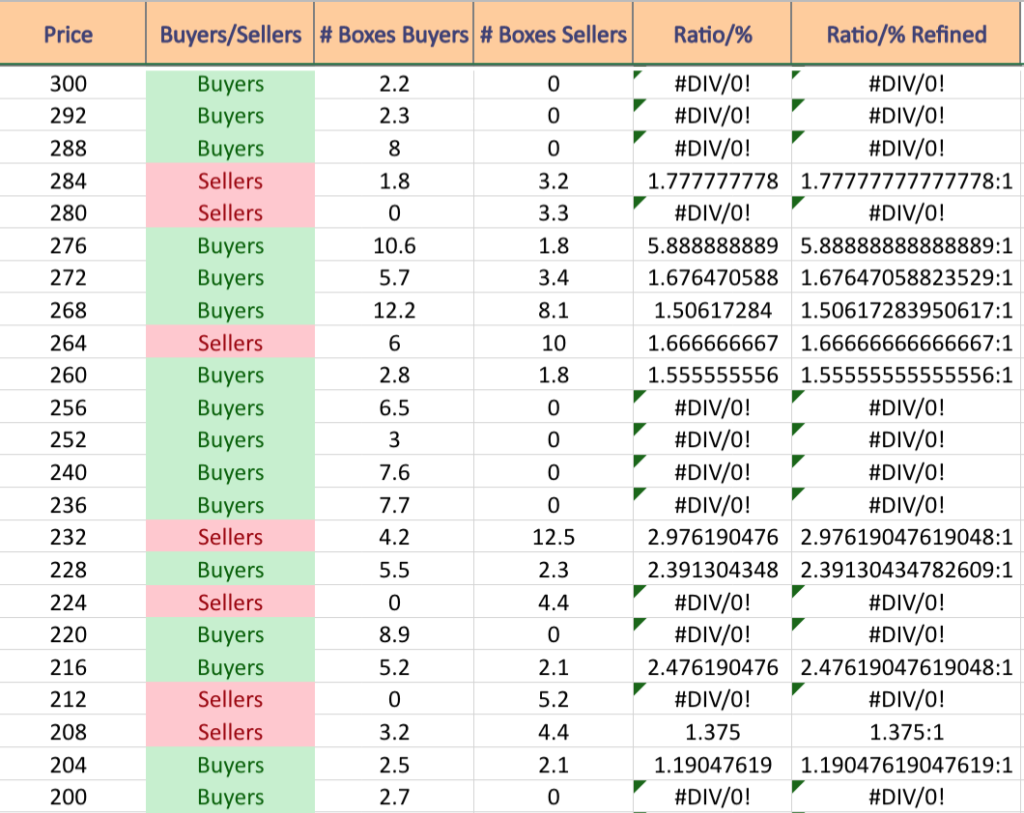
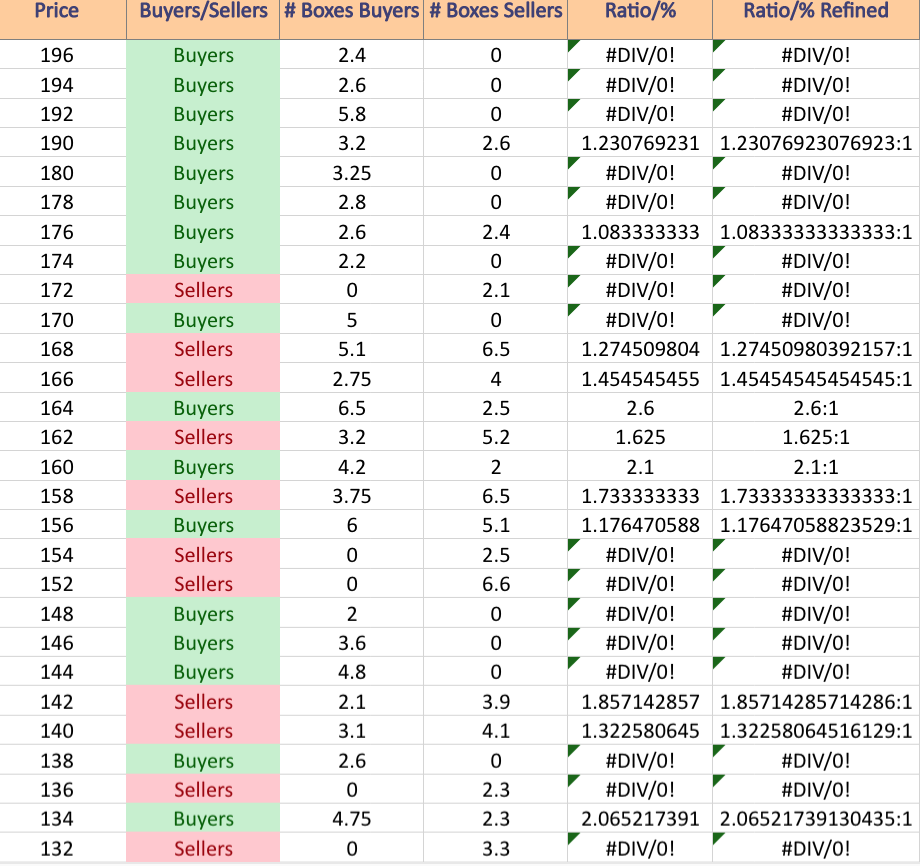
Each corresponding price level using a ratio of Buyers:Sellers (or Sellers:Buyers), NULL values denote that there was not enough data, so the ratio would’ve been 0:0.
Ratios with a 0 for the denominator/constant are denoted with an *, but reported as is as we are accounting for volume/sentiment.
Also, as there is such a wide spread between price levels, many of the resistance levels are marked NULL, as there was limited volume data for them & they were not included in the long list.
NVIDIA Corp. NVDA Stock’s Volume By Price Level, Including At Support & Resistance Levels From The Past Year
NVIDIA Corp. NVDA Stock’s Volume By Price Level, Including At Support & Resistance Levels From The Past Year
NVIDIA Corp. NVDA Stock’s Volume By Price Level, Including At Support & Resistance Levels From The Past Year
NVDA Stock’s Volume By Price Level
$400 – Buyers – 4.75:0*
$396 – Buyers – 3.1:0*
$392 – Sellers – 2.4:0*
$388 – Buyers – 2.3:1
$384 – Buyers – 1.11:1
$376 – Buyers – 1.53:1
$372 – Buyers – 2.5:0*
$316 – Buyers – 3.8:0*
$312 – Sellers – 2.3:0*
$308 – Sellers – 2:0*
$304 – Sellers – 5.5:0*
$300 – Buyers – 2.2:0*
$292 – Buyers – 2.3:0*
$288 – Buyers – 8:0*
$284 – Sellers – 1.78:1
$280 – Sellers – 3.3:0*
$276 – Buyers -5.89:1
$272 – Buyers – 1.67:1
$268 – Buyers – 1.51:1
$264 – Sellers – 1.67:1
$260 – Buyers – 1.56:1
$256 – Buyers – 6.5:0*
$252 – Buyers – 3:0*
$240 – Buyers – 7.6:0*
$236 – Buyers – 7.7:0*
$232 – Sellers – 2.98:1
$228 – Buyers – 2.39:1
$224 – Sellers – 4.4:0*
$220 – Buyers – 8.9:0*
$216 – Buyers – 2.48:1
$212 – Sellers – 5.2:0*
$208 – Sellers – 1.38:1
$204 – Buyers – 1.19:1
$200 – Buyers – 2.7:0*
$196 – Buyers 2.4:0*
$194 – Buyers – 2.6:0*
$192 – Buyers – 5.8:0*
$190 – Buyers – 1.23:1
$180 – Buyers – 3.25:0*
$178 – Buyers – 2.8:0*
$176 – Buyers – 1.08:1
$174 – Buyers – 2.2:0*
$172 – Sellers – 2.1:0*
$170 – Buyers – 5:0*
$168 – Sellers- 1.27:1
$166 – Sellers – 1.45:1
$164 – Buyers – 2.6:1
$162 – Sellers – 1.63:1
$160 – Buyers – 2.1:1
$158 – Sellers – 1.73:1
$156 – Buyers – 1.18:1
$154 – Sellers – 2.5:0*
$152 – Sellers – 6.6:0*
$148 – Buyers – 2:0*
$146 – Buyers – 3.6:0*
$144 – Buyers – 4.8:0*
$142 – Sellers – 1.86:1
$140 – Sellers – 1.32:1
$138 – Buyers – 2.6:0*
$136 – Sellers 2.3:0*
$134 – Buyers – 2.07:1
$132 – Sellers – 3.3:0*
Tying It All Together
The list & image above paint the picture as to how investors & traders have behaved at various price levels that NVDA has been at over the past one-to-two years.
It is not meant to serve as investment/trading advice, and is simply a way to visualize what investor/trader sentiment has been like at each of the price levels mentioned, as well as what it was at levels of support & resistance that are denoted in the image & list.
As always, do your own due diligence before making investing/trading decisions.
For more on the methodology on how the data was collected & put together, please refer to our original Price:Volume analysis.
*** I DO NOT OWN SHARES OR OPTIONS CONTRACT POSITIONS IN NVDA AT THE TIME OF PUBLISHING THIS ARTICLE ***
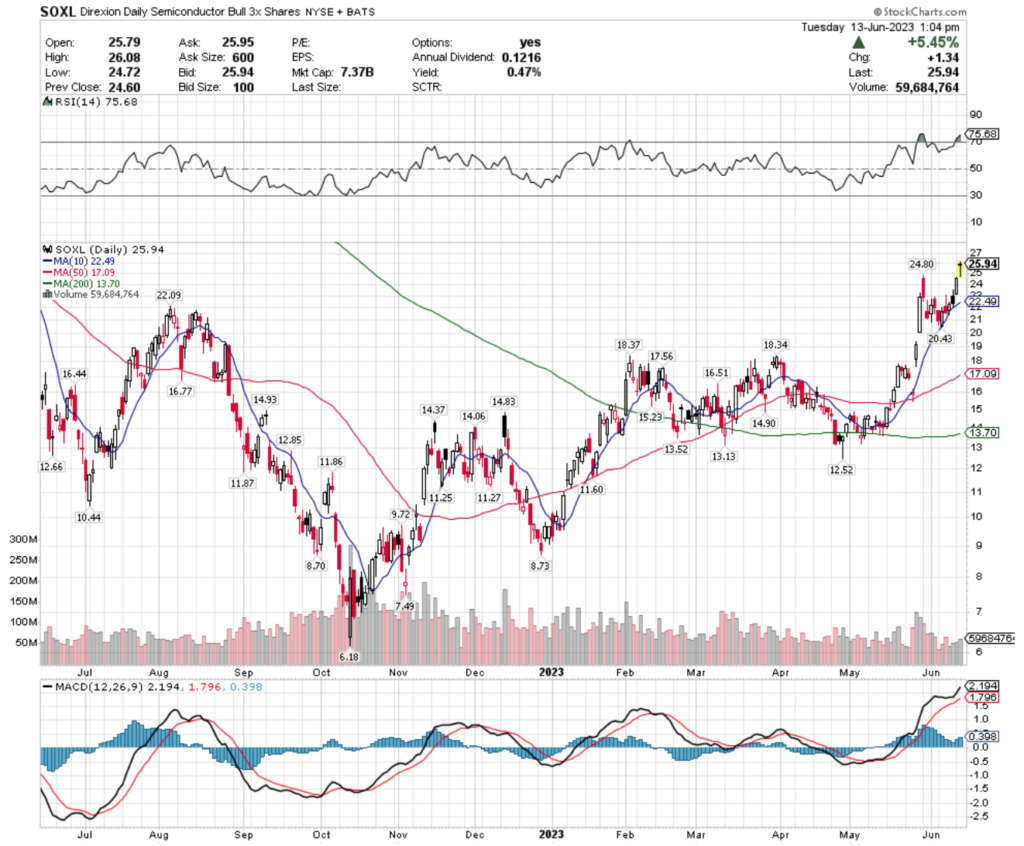
It’s no surprise that semiconductors have been leading the charge throughout 2023, as they have been one of the strongest performing areas of the market.
After publishing about SOXL in this week’s weekly market review I decided to dig a bit deeper into how well they’ve performed by doing a price:volume analysis, as they & other semiconductor ETFs have been atop my technical analysis ratings system output seemingly every week in recent memory.
Before we begin the analysis, let’s address who SOXL is.
The more popular semiconductors are in the market, the better SOXL will perform, ideally at 3x.
As more & more investors want to get exposure to the space, they can provide an easy way to profit, but also come with their own additional risk (3x gains can be counteracted by 3x losses, after-all…).
Some of their largest holdings include NVDA, TXN, AVGO & others, which you can find at the link to their prospectus three paragraphs above for more information.
Volume is a measure of investor enthusiasm (or lack thereof) & we are going to review how investor sentiment has been at various price levels, as well as pointing out what the dominant sentiment at various levels of support & resistance have been in the past year & change.
SOXL ETF’s Price:Volume Analysis Breakdown
As mentioned earlier, SOXL has had a strong year from a technical standpoint amongst other ETFs, driven by the outperformance of the underlying stocks in the industry.
SOXL ETF’s Technical Performance Over The Past Year
Their share price has appreciated +319.74% since their 52-week low in October of 2022 (ex-distributions & using their price from 1:04pm on 6/13/23 as denoted in the upper right hand corner of the chart).
After taking their support levels (I had to go to a 2 year chart to find resistance as they’re above their 52-week high) I constructed this list, which not surprisingly has limited/no data for the prices that are above their current share price.
Note that the prices in bold denote a moving average, which are treated as support/resistance levels themselves.
SOXL ETF’s Volume By Price Level, Including At Support & Resistance Levels From The Past One to Two Years
The list below maps out the volume sentiment at each corresponding price level using a ratio of Buyers:Sellers (or Sellers:Buyers), NULL values denote that there was not enough data, so the ratio would’ve been 0:0.
Ratios with a 0 for the denominator/constant are denoted with an *, but reported as is as we are accounting for volume/sentiment.
SOXL Volume By Price Level:
$27 – NULL – 0:0*
$26 – NULL – 0:0*
$25 – NULL – 0:0*
$24 – Buyers – 0.75:0*
$23 – NULL – 0:0*
$22 – Buyers – 1.75:1 (10 Day Moving Average is $22.49)
$21 – Buyers – 1.33:1
$20 – Sellers – 2.5:1
$19.50 – Buyers – 1.45:1
$19 – Buyers – 2.29:1
$18.50 – Buyers – 2.3:0*
$18 – Buyers – 2.25:0*
$17.50 – Buyers – 2.89:1
$17 – Buyers – 1.14:1 (50 Day Moving Average is $17.09)
$16.50 – Buyers – 1.36:1
$16 – Sellers – 1.85:1
$15.50 – Sellers – 1.56:1
$15 – Even – 1:1
$14.50 – Buyers – 1.46:1
$14 – Sellers – 1.43:1
$13.50 – Buyers – 1.20:1 (200 Day Moving Average)
$13 – Buyers – 1.55:1
$12.50 – Buyers – 1.01:1
$12 – Buyers – 2.44:1
$11.50 – Sellers – 2.35:1
$11 – Sellers – 2.17:1
$10.50 – Buyers – 2.69:1
$10 – Buyers – 1.97:1
$9.50 – Sellers – 1.01:1
$9 – Sellers – 1.47:1
$8.50 – Buyers – 1.12:1
$8 – Sellers – 7:0*
$7.50 – Buyers – 1.89:1
$7 – Buyers – 2.81:1
$6.50 – Sellers – 2.6:0*
$6 – NULL – 0:0*
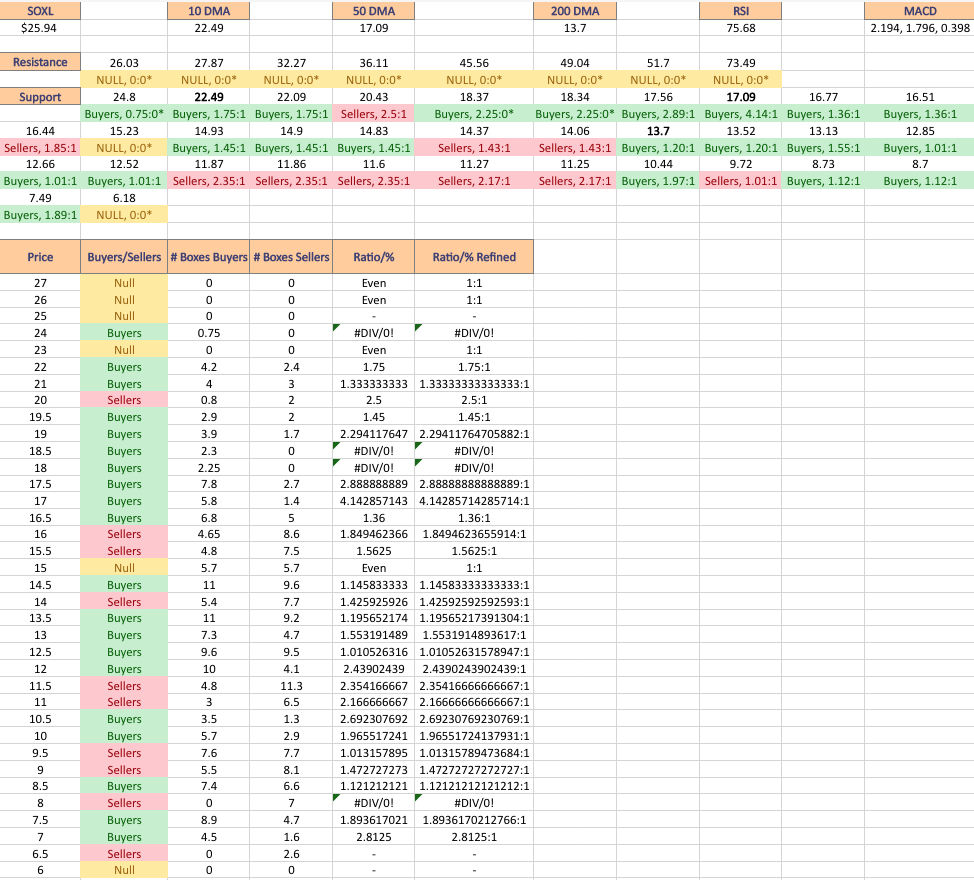
The two year chart is below:
SOXL ETF’s Technical Performance Over The Past Two Years
Tying It All Together
The list & image above paint the picture as to how investors & traders have behaved at various price levels that SOXL has been at over the past one-to-two years.
It is not meant to serve as investment/trading advice, and is simply a way to visualize what investor/trader sentiment has been like at each of the price levels mentioned, as well as what it was at levels of support & resistance that are denoted in the image.
As always, do your own due diligence before making investing/trading decisions.
For more on the methodology on how the data was collected & put together, please refer to our original Price:Volume analysis.
*** I DO NOT OWN SHARES OR OPTIONS CONTRACT POSITIONS IN SOXL AT THE TIME OF PUBLISHING THIS ARTICLE ***
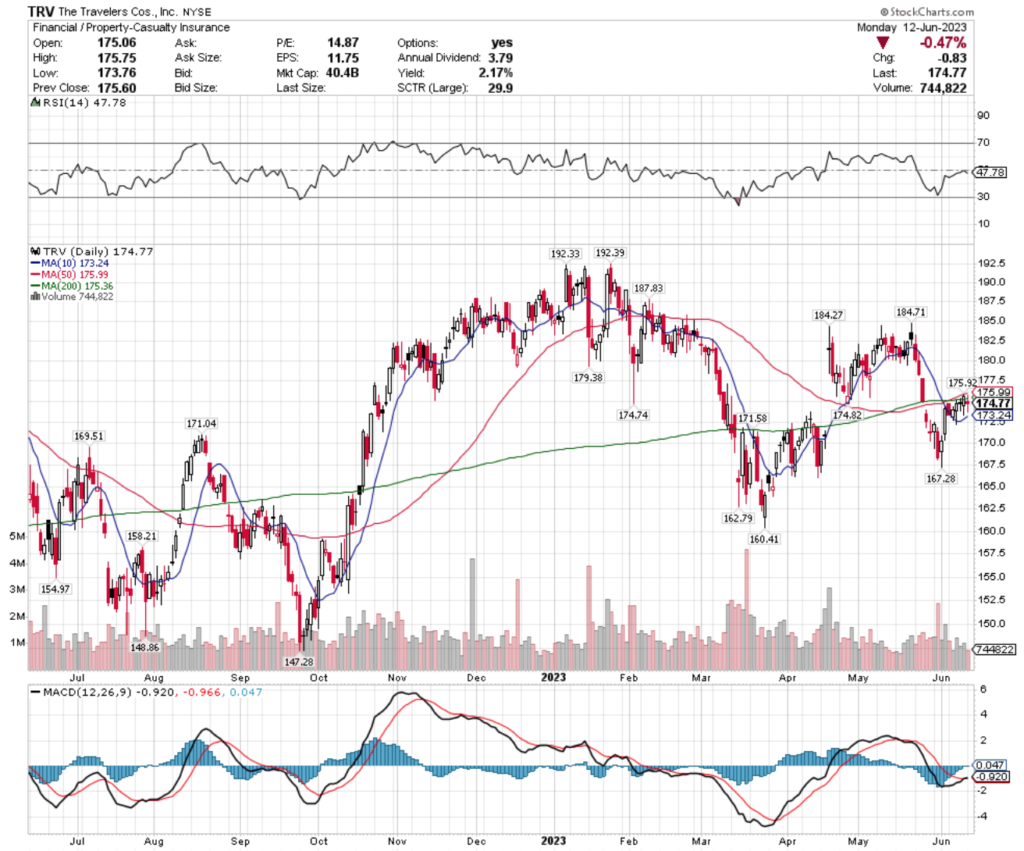
The Travelers Cos., Inc. stock trades under the ticker TRV & has shown recent bullish signals that traders & investors should research further into.
TRV stock closed at $174.77/share on 6/12/2023.
The Travelers Cos., Inc. TRV Stock’s Technical Performance Broken Down
The Travelers Cos., Inc. TRV Stock’s Technical Performance Over The Past Year
TRV Stock Price: $174.77
10 Day Moving Average: $173.24
50 Day Moving Average: $175.99
200 Day Moving Average: $175.36
RSI: 47.78
MACD: -0.92, -0.966, 0.047
Yesterday, TRV stock completed a bullish MACD crossover, despite closing -0.47% on the day’s session.
Their RSI is on the oversold end of neutral at 47.78, with trading volumes in recent sessions being below average compared to the year prior, signaling uncertainty among investors.
The past week has featured some spinning top candlesticks & a doji, all of which were contained inside of their moving averages noted above, which is where most price action clumped.
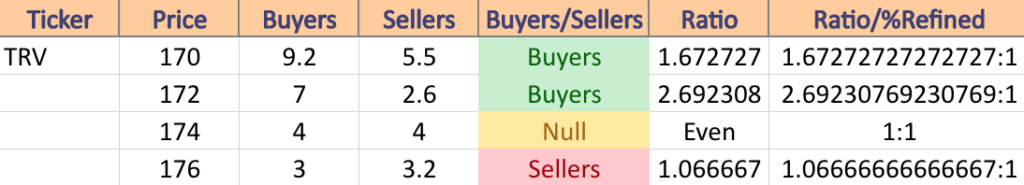
TVR has support at the $174.74 (Volume Sentiment: Even, 1:1), $173.24 (10 Day Moving Average; Volume Sentiment: Buyers, 2.69:1), $171.58 (Volume Sentiment: Buyers, 1.67:1) & $171.04/share (Volume Sentiment: Buyers, 1.67:1), with resistance at the $174.82 (Volume Sentiment: Even, 1:1), $175.36 (200 Day Moving Average; Volume Sentiment: Even, 1:1), $175.92 (Volume Sentiment: Even, 1:1) & $175.99/share (50 Day Moving Average; Volume Sentiment: Even, 1:1) price levels.
The Volume Sentiment for the $176-177.99/share price level is favoring the sellers, 1.07:1.
TRV Stock’s Volume Sentiment At Neighboring Price Levels
The Travelers Cos., Inc. TRV Stock As A Long-Term Investment
Long-term oriented investors will like TRV stock’s valuation metrics, with a 14.87 P/E (ttm) & a 1.75 P/B (mrq).
They recently reported 10.2% Quarterly Revenue Growth Y-o-Y, with -4.2% Quarterly Earnings Growth Y-o-Y, which is something that should be looked deeper into before investing.
Their balance sheet will also require a more thorough review, with $4.01B of Total Cash (mrq) & $7.29B of Total Debt (mrq).
TRV stock pays a 2.12% dividend, which appears to be sustainable in the long-run, as their payout ratio is 31.66%.
85.4% of TRV stock’s outstanding share float is owned by institutional investors.
The Travelers Cos., Inc. TRV Stock As A Short-Term Trade Using Options
Traders with shorter time horizons can trade options to profit from price movements in TRV stock, while protecting their portfolios from volatility.
I am looking at the contracts with the 7/21 expiration date.
The $175, $170 & $165 call options are all in-the-money, listed from highest to lowest level of open interest.
The $180, $185 & $190 puts are also all in-the-money, with the former being more liquid than the latter strikes.
Tying It All Together
TRV stock has many interesting characteristics that traders & investors will find appealing.
Investors will like their dividend yield, as well as their valuation metrics, but may want to look deeper into their balance sheet.
Traders will like their recent technical performance, as well as how liquid their options are.
Overall, it is worth taking a closer look into how TRV stock fits into your portfolio strategy.
*** I DO NOT OWN SHARES OR OPTIONS CONTRACT POSITIONS IN TRV STOCK AT THE TIME OF PUBLISHING THIS ARTICLE ***
SPY, the SPDR S&P 500 ETF added +0.46% last week, with stocks remaining relatively flat in the index all week, prior to Thursday’s session & Friday’s +0.18% gap up day on a gravestone doji candlestick (we will jump into that in a moment).
SPY ETF – SPDR S&P 500 ETF’s Technical Performance Over The Past Year
Their RSI is approaching overbought levels at 66.68 (per Friday’s close), with volumes being average at best during the week compared to the year prior, as this week’s data & rates announcements are high on investors’ minds.
SPY’s MACD is still showing bullishness, but their candlesticks are signaling a bit of uncertainty amongst investors.
Monday through Thursday, their candles look like a shelf of books, all tightly tied to the closing price of the previous Friday’s session (which also happened to be a gap up).
The gravestone doji is a major showing of uncertainty, if not bearishness, as the day’s session had enough range of prices to create the shadows of the candlestick, but the opening & closing price were near identical, and on the lower end of the day’s overall trading range.
Clearly, there are some concerns about the near-term future performance about the S&P 500, which the CPI, PPI & Fed interest rate announcement are causing.
SPY has support at the $426.37 (Volume Sentiment: Sellers, 1.56:1), $424.85 (10 Day Moving Average; Volume Sentiment: Sellers, 1.56:1) , $416.72 (Volume Sentiment: Sellers, 1.33:1) & $414.13/share (50 Day Moving Average; Volume Sentiment: Buyers, 3:1) price levels, with resistance at the $438.53 (Volume Sentiment: Sellers, 1.32:1), $442.12 (Volume Sentiment: Sellers, 1.35:1), $449.09 (Volume Sentiment: Buyers, 1.89:1) & $454.37/share (Volume Sentiment: Sellers, 1.25:1) price levels.
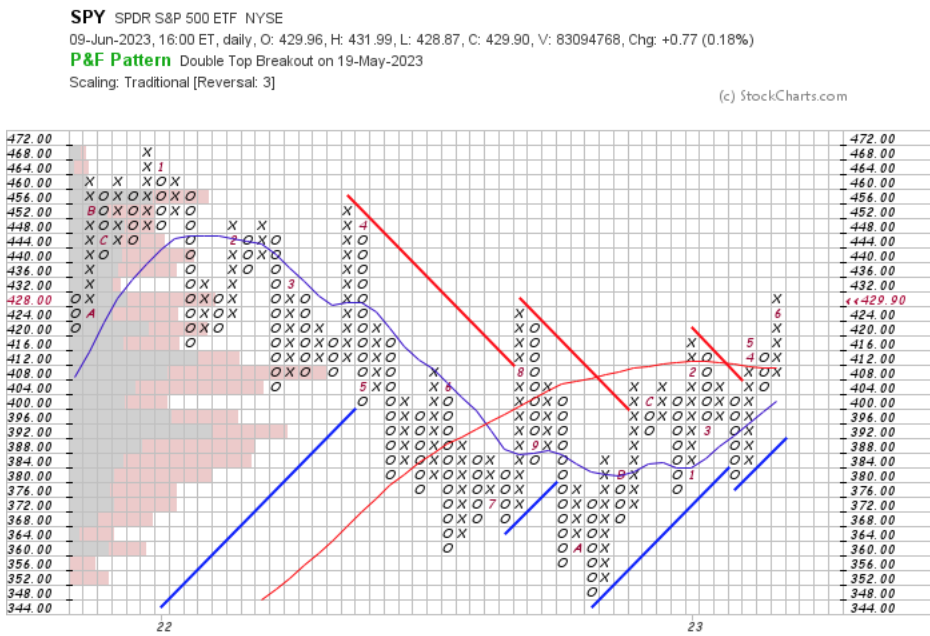
SPY ETF Point & Figure Chart With Volume Overlay
SPY Volume Sentiment At Current Price & Next Support & Resistance Levels
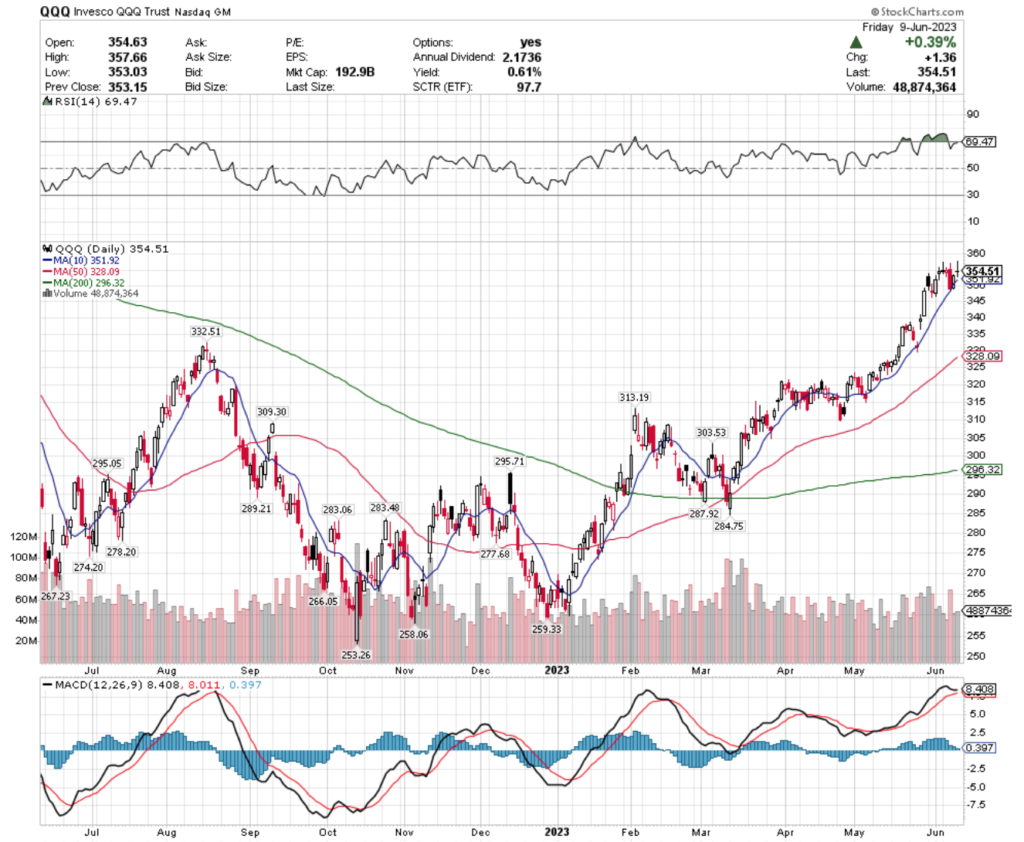
QQQ, the Invesco QQQ Trust ETF took a modest -0.04% decline last week, in a slightly more bearish, but similar appearing week to the S&P 500.
QQQ ETF – Invesco QQQ Trust ETF’s Technical Performance Over The Past Year
Their RSI looks set to cross back into overbought territory after closing on Friday at 69.47, but trading volumes all week were nothing spectacular & their MACD looks ready to make a bearish crossover in the coming days’ sessions.
QQQ’s Monday through Thursday candlesticks also behaved as an extension of the range that the previous Friday’s gap up created, with a similar gravestone doji candlestick on Friday’s +0.39% gap up session.
It goes without saying that this would be the case for the tech heavy NASDAQ index, who would be more adversely impacted by further interest rate hikes, whether one happens on Wednesday, or one becomes evident in the coming months based on the data being reported Tuesday & Wednesday before the announcement.
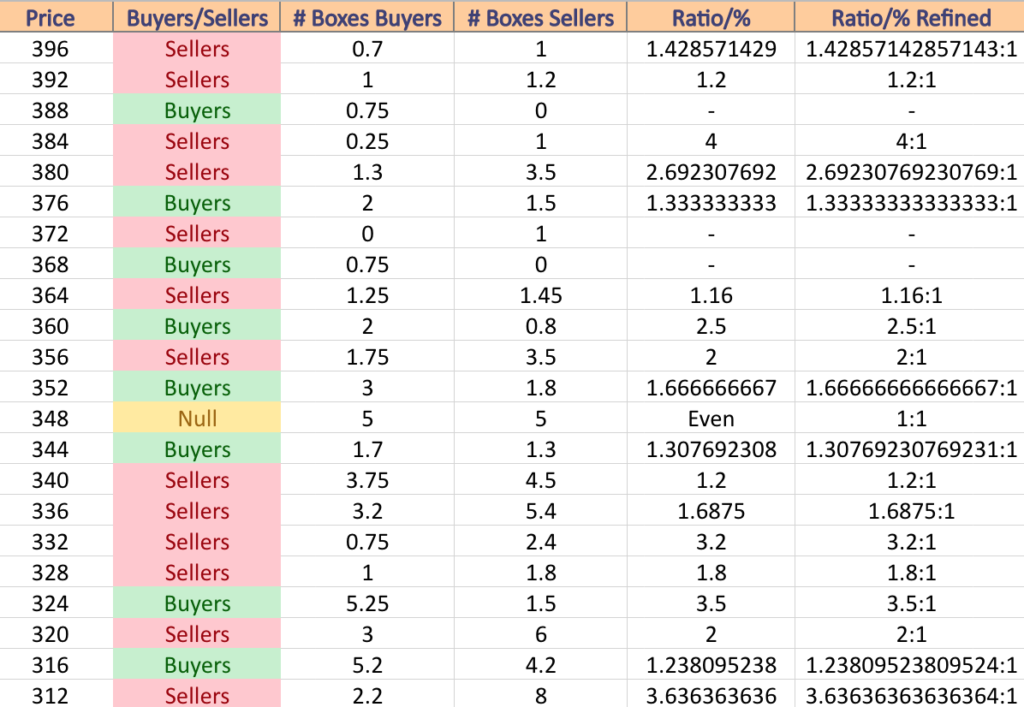
QQQ has support at the $351.92 (10 Day Moving Average; Volume Sentiment: Even, 1:1), $332.51 (Volume Sentiment: Sellers, 3.2:1), $328.09 (50 Day Moving Average; Volume Sentiment: Sellers, 1.8:1) & $313.19 (Volume Sentiment: Sellers, 3.64:1), with resistance a the $368.99 (Volume Sentiment: Buyers, 0.75:0*), $375.07 (Volume Sentiment: Sellers, 1:0*) , $378.49 (Volume Sentiment: Buyers, 1.33:1) & $401/share (Volume Sentiment: Even, 0:0*).
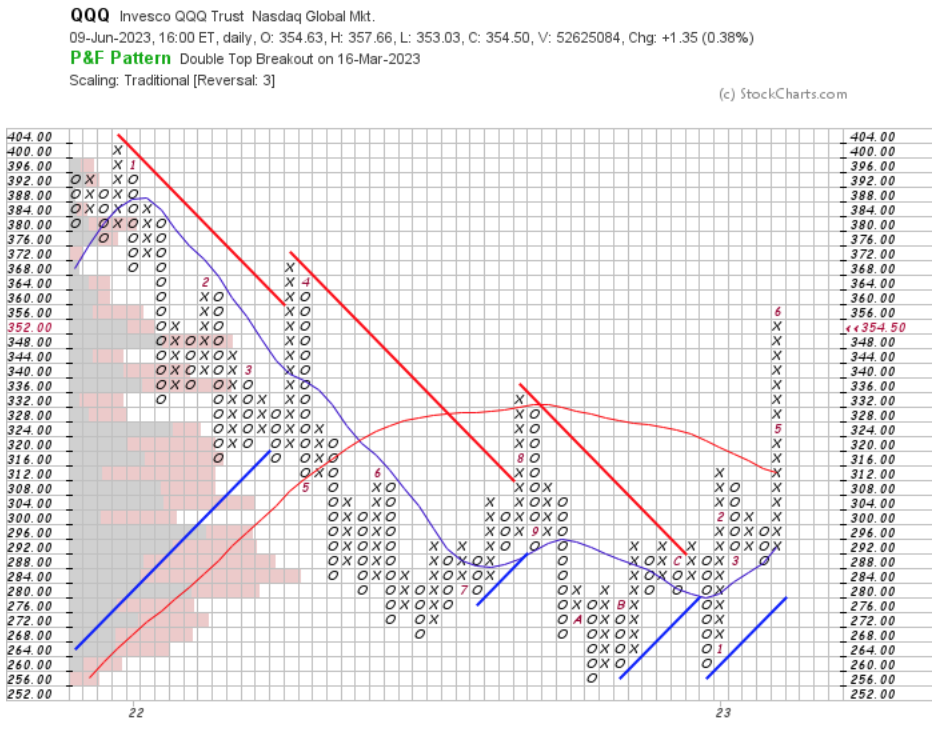
QQQ ETF Point & Figure Chart With Volume Overlay
QQQ Volume Sentiment At Current Price & Next Support & Resistance Levels
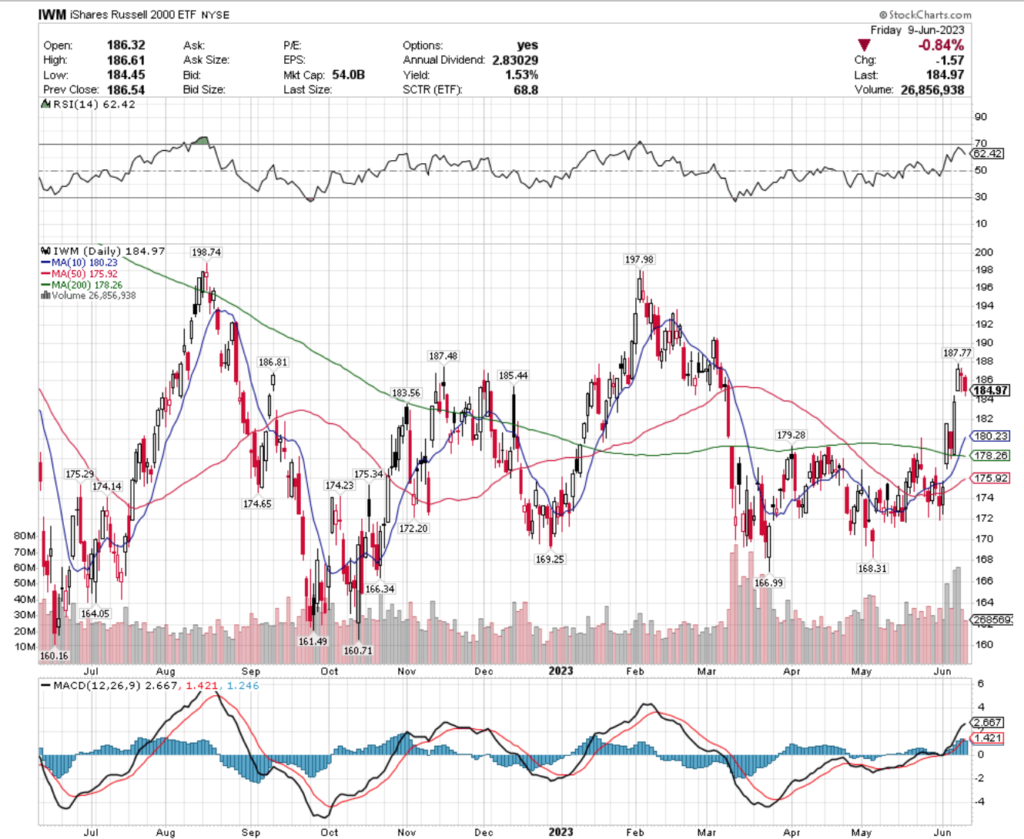
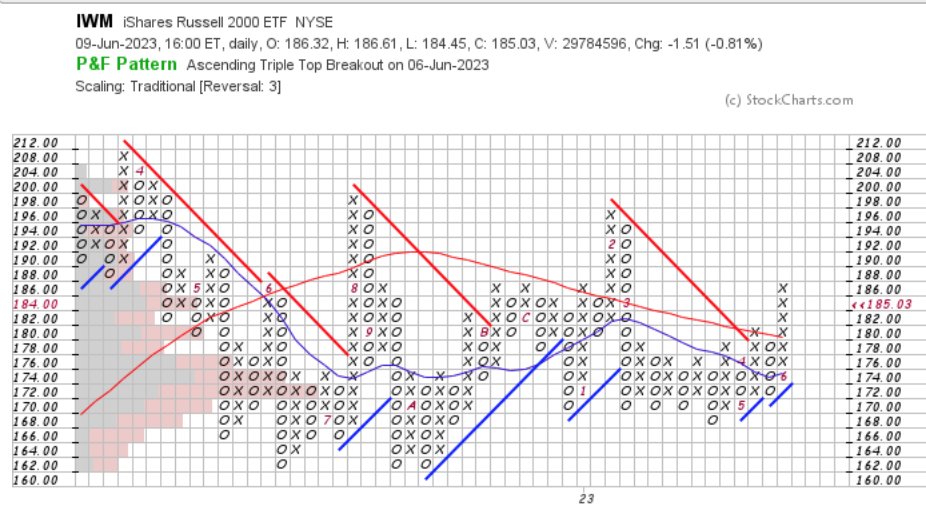
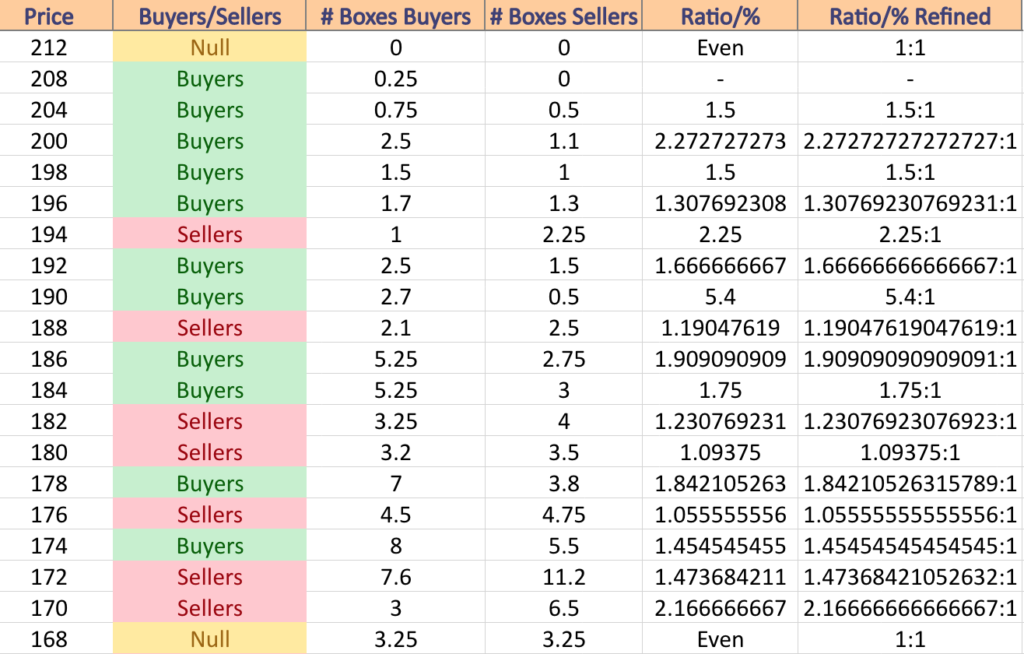
IWM, the iShares Russell 2000 ETF gained +1.93% last week, as investors retreated to safety in small cap stocks in anticipation of further uncertainty.
IWM ETF – iShares Russell 2000 ETF’s Technical Performance Over The Past Year
To no surprise, the small cap oriented Russell 2000’s chart offers a different view than the S&P 500 & NASDAQ’s, with IWM’s RSI being at 62.42 & with the week’s overall volume being above average compared to the year prior.
Their MACD has been in a steep bullish incline, but is beginning to show signs of faltering in the near-term.
Friday’s session confirmed that even the investors who flocked into the small cap names are still on edge & nervous, as Wednesday’s gap up was followed by a down session with a spinning top & then a -0.84% Friday session.
IWM has support at the $183.56 (Volume Sentiment: Sellers, 1.23:1), $180.23 (10 Day Moving Average; Volume Sentiment: Sellers, 1.1:1), $179.28 (Volume Sentiment: Buyers, 1.84:1) & $178.26/share (200 Day Moving Average; Volume Sentiment: Buyers, 1.84:1) , with resistance at the $185.44 (Volume Sentiment: Buyers, 1.84:1) , $186.81 (Volume Sentiment: Buyers, 1.91:1), $187.48 (Volume Sentiment: Buyers, 1.91:1) & $187.77/share (Volume Sentiment: Buyers, 1.91:1) price levels.
IWM ETF Point & Figure Chart With Volume Overlay
IWM Volume Sentiment At Current Price & Next Support & Resistance Levels
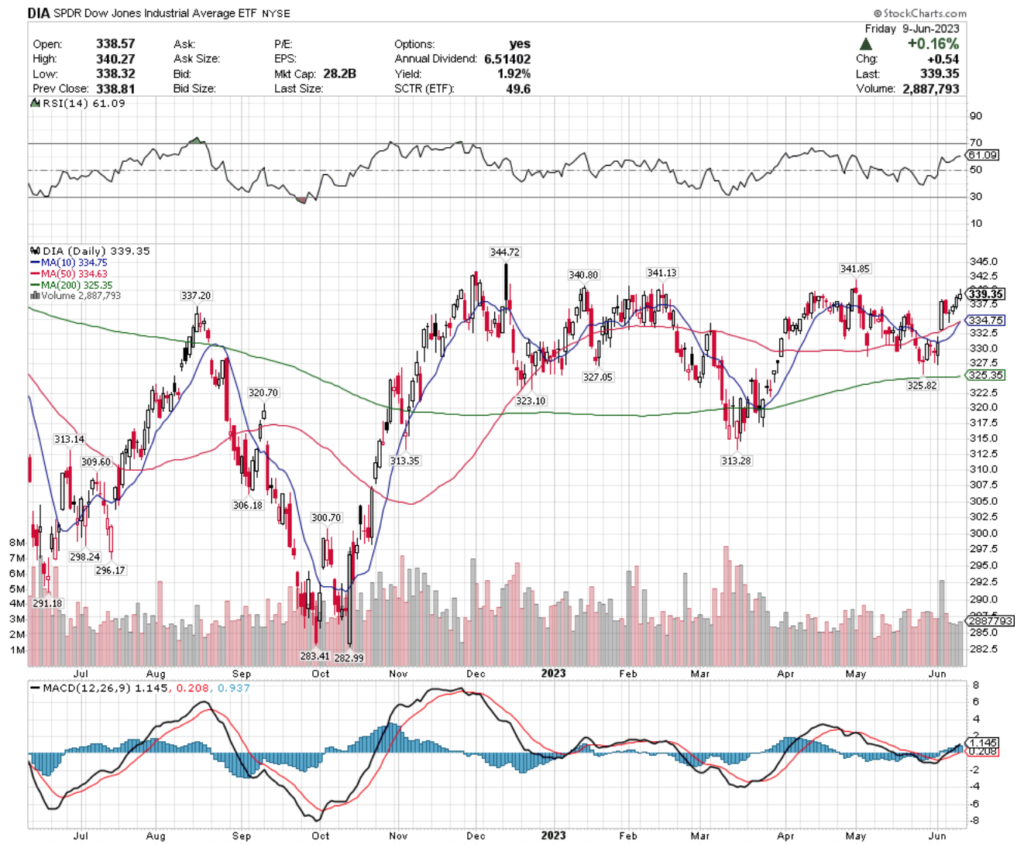
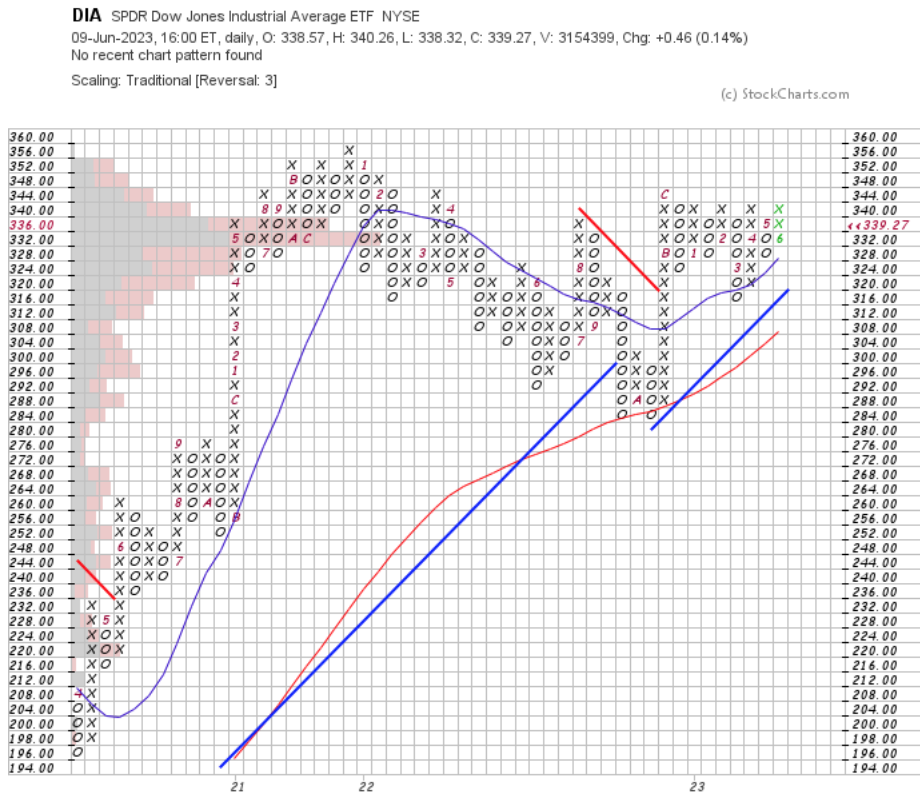
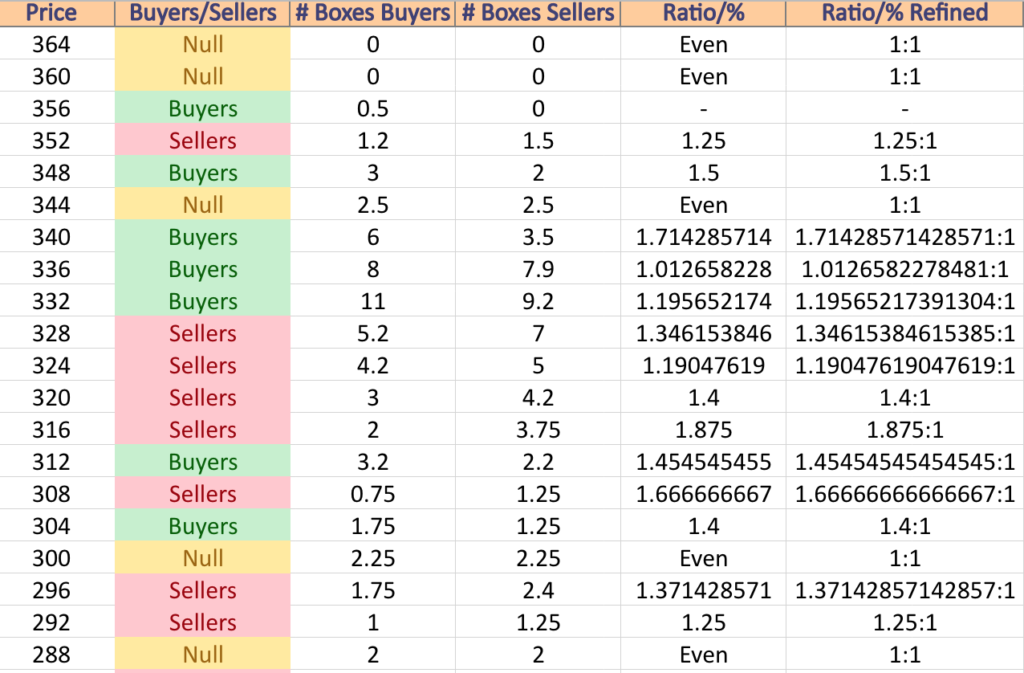
DIA ETF – SPDR Dow Jones Industrial Average ETF’s Technical Performance Over The Past Year
Their RSI is trending towards overbought, but remains at 61.09, but the week’s volumes were subdued compared to the year prior.
Their MACD is still bullish, but beginning to show signals of weakening sentiment.
Tuesday’s dragonfly doji prompted the rally into the end of the week after Monday’s losses, but their upcoming resistance tests pose some difficulty for the index.
DIA has support at the $337.20 (Volume Sentiment: Buyers, 1.01:1), $334.75 (10 Day Moving Average; Volume Sentiment: Buyers, 1.20:1), $334.63 (50 Day Moving Average; Volume Sentiment: Buyers, 1.20:1) & $327.05/share (Volume Sentiment: Sellers, 1.19:1) & resistance at the $340.80 (Volume Sentiment: Buyers, 1.71:1) , $341.13 (Volume Sentiment: Buyers, 1.71:1) , $341.85 (Volume Sentiment: Buyers, 1.71:1) & $344.72/share (Volume Sentiment: Even 1:1) price levels.
DIA ETF Point & Figure Chart With Volume Overlay
DIA Volume Sentiment At Current Price & Next Support & Resistance Levels
Semiconductors (SOXL), Brazil (BRZU), Latin America 40 (ILF) & Housing (HOMZ) Have All Been Bullishly Leading The Market
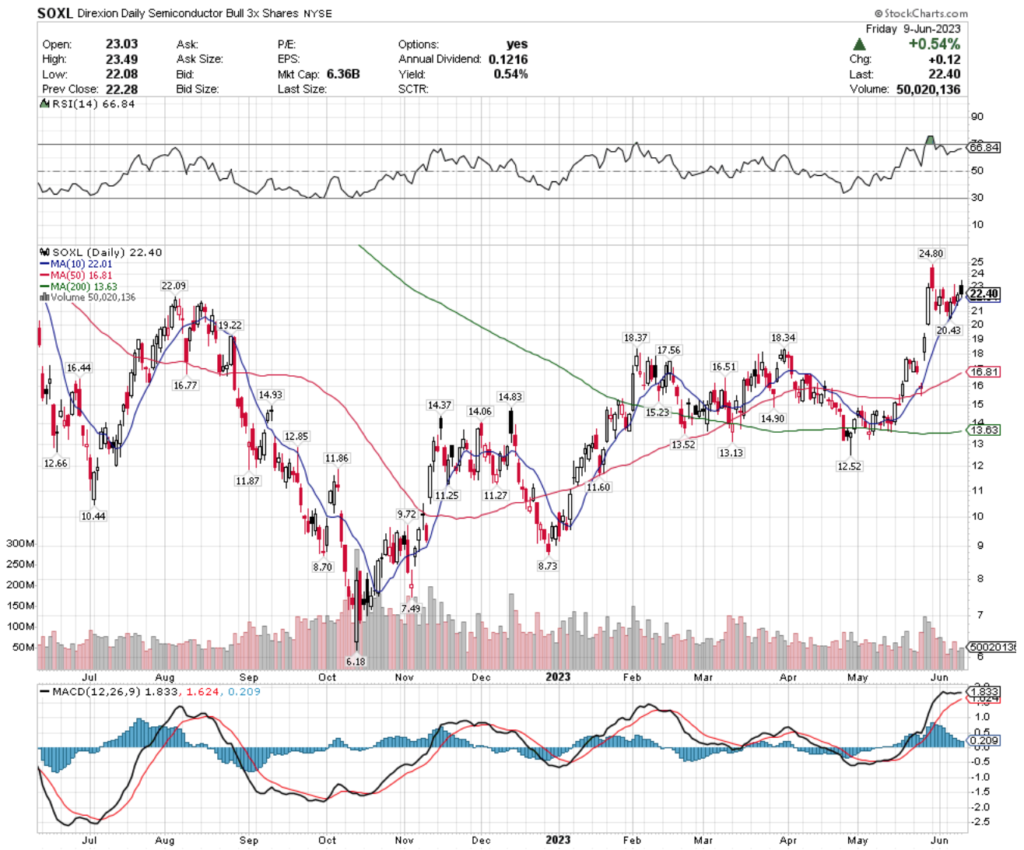
SOXL, the Direxion Daily Semiconductors Bull 3x Shares ETF has gained +45.44% over the past year, gaining an impressive +260.71% since its 52-week low in October of 2022 (ex-distributions), to close at $22.40/share (Volume Sentiment: Buyers, 1.57:1).
SOXL ETF – Direxion Daily Semiconductors Bull 3x Shares ETF’s Technical Performance Over The Past Year
Their RSI is approaching overbought territory (at 66.84 at Friday’s close), but their MACD is beginning to signal a bearish crossover in the coming week.
Weaker than average volumes last week compared to the week prior confirm investors are feeling on the fence with SOXL & their sentiment is a signal of impending weakness.
Last week’s candlesticks’ opening & closing levels being tied tightly to a $22-range also confirm that investors are feeling on the fence at the moment.
Their 0.54% distribution yield does not provide much of a cushion to protect against losses.
Shareholders who are not looking to trim positions should have an insurance policy (selling calls, buying puts) & non-shareholders should be eyeing how they behave around their support levels in the near-term to find where they might like to enter a position when an uptrend has been established.
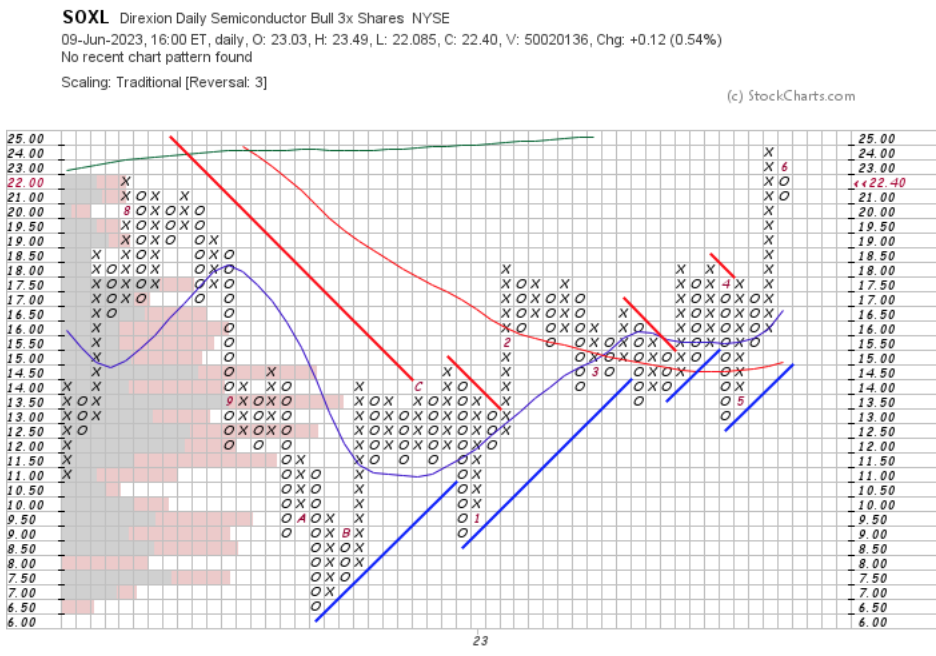
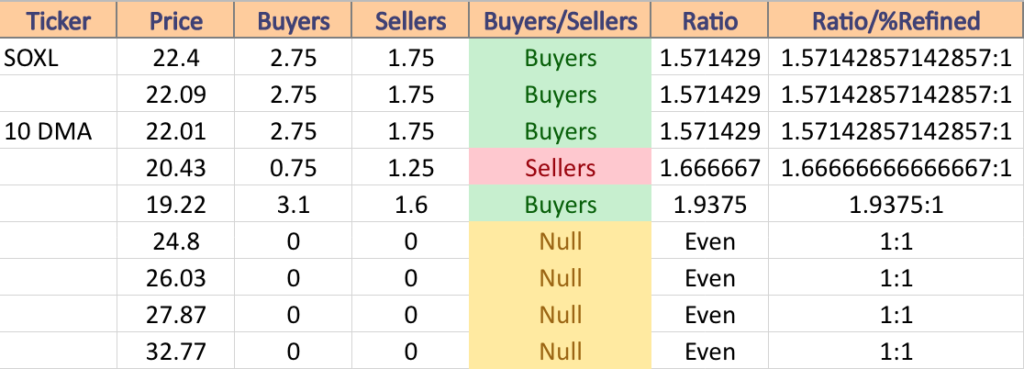
SOXL has support at the $22.09 (Volume Sentiment: Buyers, 1.57:1), $22.01 (10 Day Moving Average; Volume Sentiment: Buyers, 1.57:1), $20.43 (Volume Sentiment: & $19.22 (Volume Sentiment: Buyers, 1.94:1) , with resistance at the $24.80 (Volume Sentiment: NULL, 0:0*), $26.03 (Volume Sentiment: NULL, 0:0*), $27.87 (Volume Sentiment: NULL, 0:0*) & $32.77/share (Volume Sentiment: NULL, 0:0*) price levels.
SOXL ETF Point & Figure Chart With Volume Overlay
SOXL Volume Sentiment At Current Price & Next Support & Resistance Levels
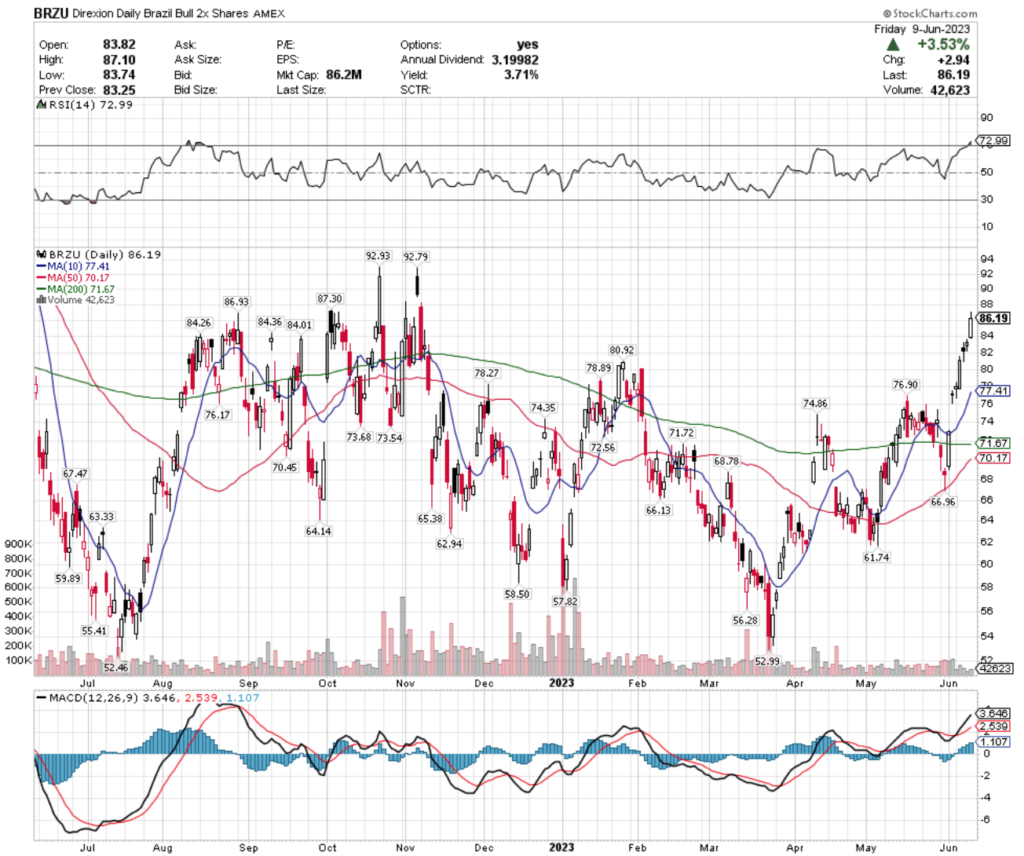
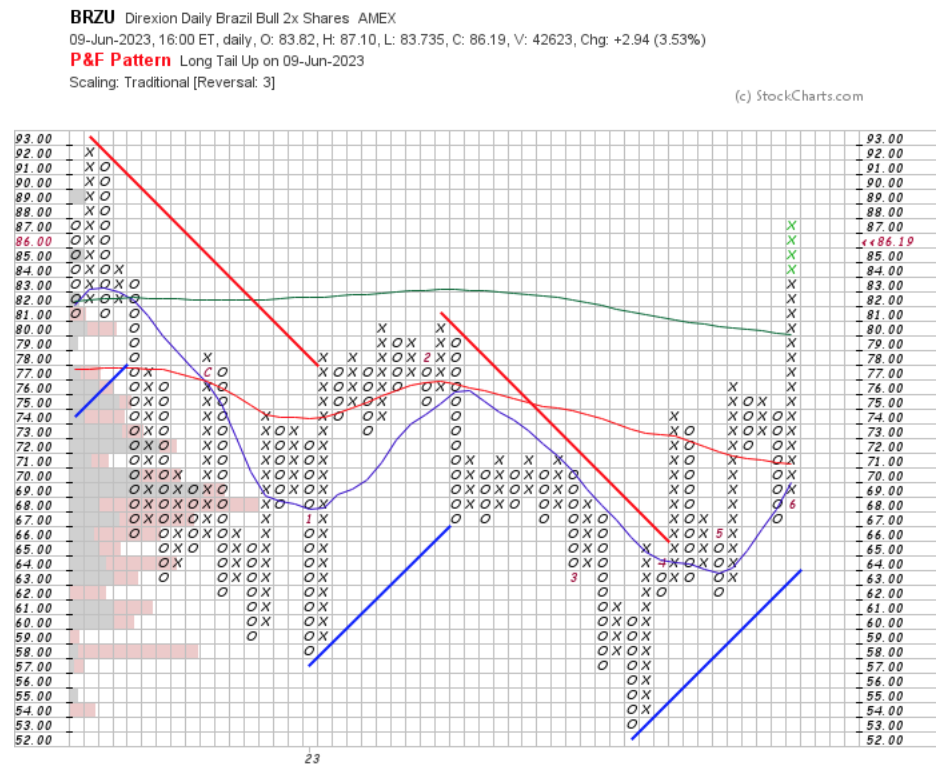
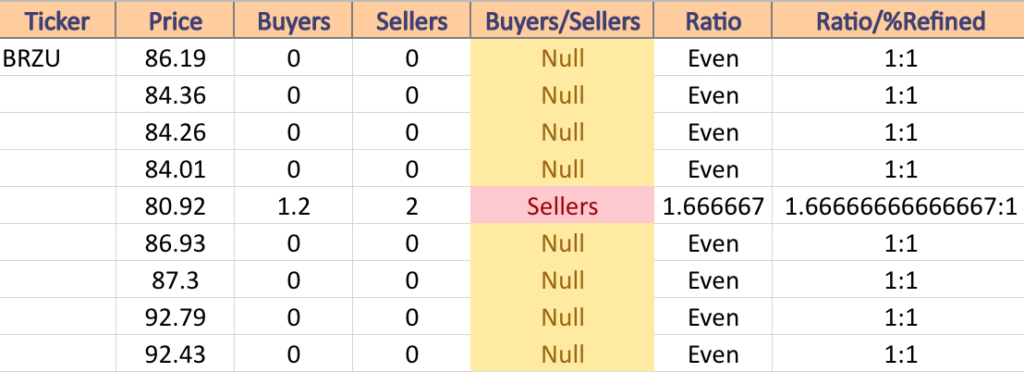
BRZU, the Direxion Daily Brazil Bull 2x Shares ETF has climbed +22.47% over the past year, posting a +62.7% gain since their 52-week low in February of 2023 (ex-distributions) to close at $86.19/share on Friday (Volume Sentiment: Even, 0:0*).
BRZU ETF – Direxion Daily Brazil Bull 2x Shares ETF’s Technical Performance Over The Past Year
Their RSI is overbought at 72.99 (per Friday’s close), after the prior Friday’s gap up spurred an +11.67% climb last week.
While their MACD is still bullish, volumes have been lighter than the year prior’s average, signaling uncertainty, which is confirmed by the many spinning top candlesticks of last week & Friday’s candle’s open & close occupying the bottom of the candle, with an upper shadow but no lower shadow.
BRZU pays a 3.71% distribution yield, which offers some protection for investors against losses, but an additional insurance policy through an options strategy would be wise in the near-term, while watching their behavior at support levels.
BRZU has support at the $84.36 (Volume Sentiment: NULL, 0:0*), $84.26 (Volume Sentiment: NULL, 0:0*), $84.01 (Volume Sentiment: NULL, 0:0*) & $80.92/share (Volume Sentiment: Sellers, 1.67:1) price levels, with resistance at the $86.93 (Volume Sentiment: NULL, 0:0*), $87.30 (Volume Sentiment: NULL, 0:0*), $92.79 (Volume Sentiment: NULL, 0:0*) & $92.93/share (Volume Sentiment: NULL, 0:0*) price levels, with resistance at the $86.93 (Volume Sentiment: NULL, 0:0*), $87.30 (Volume Sentiment: NULL, 0:0*), $92.79 (Volume Sentiment: NULL, 0:0*) & $92.93/share (Volume Sentiment: NULL, 0:0*) price levels.
BRZU ETF Point & Figure Chart With Volume Overlay
BRZU Volume Sentiment At Current Price & Next Support & Resistance Levels
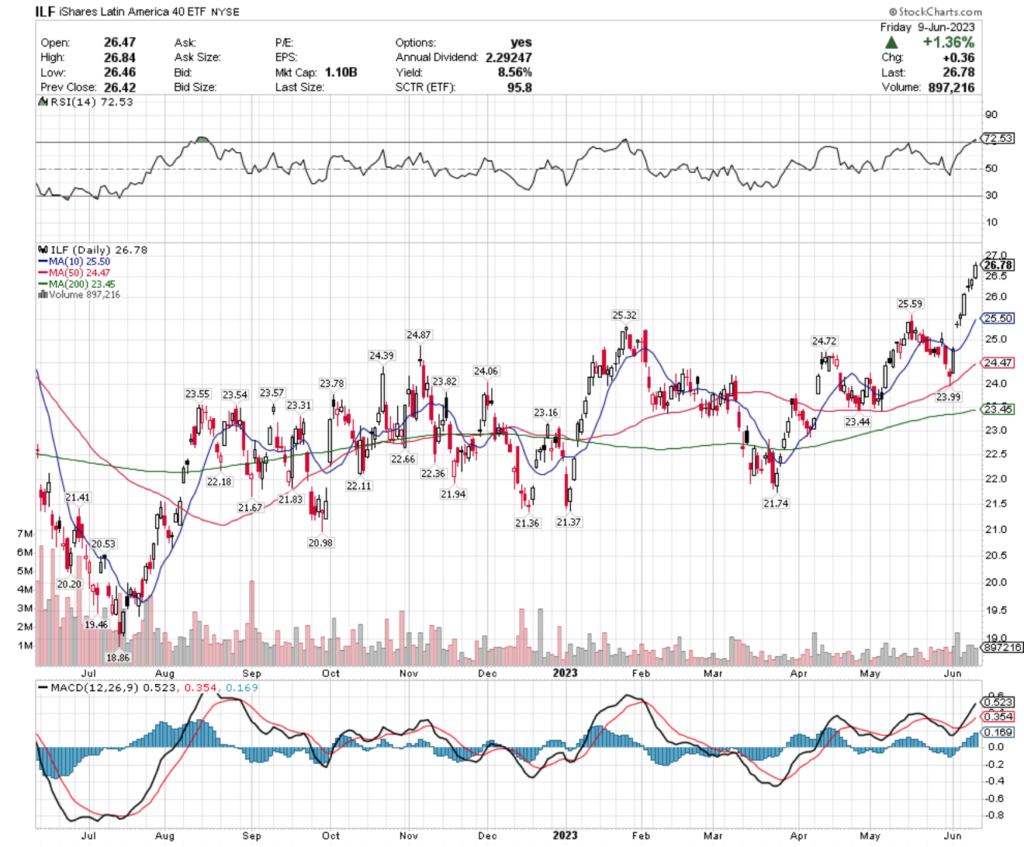
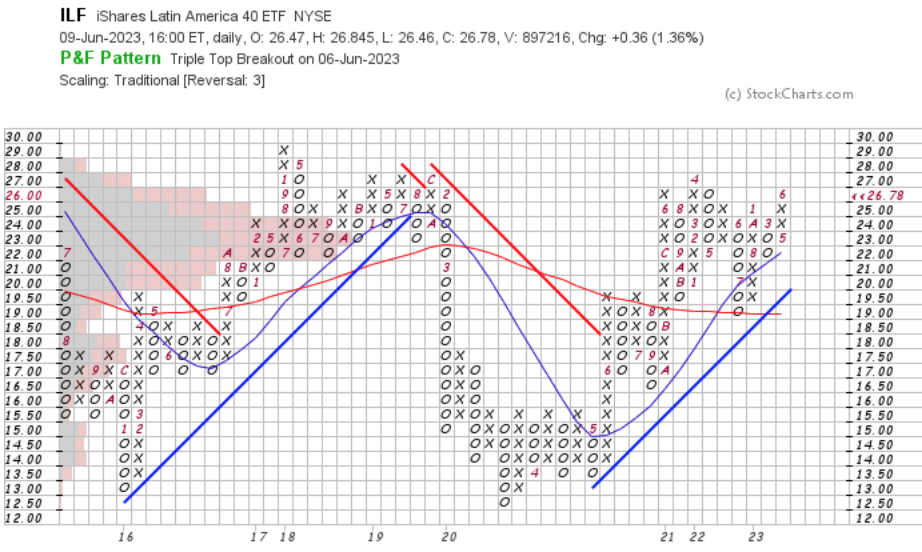
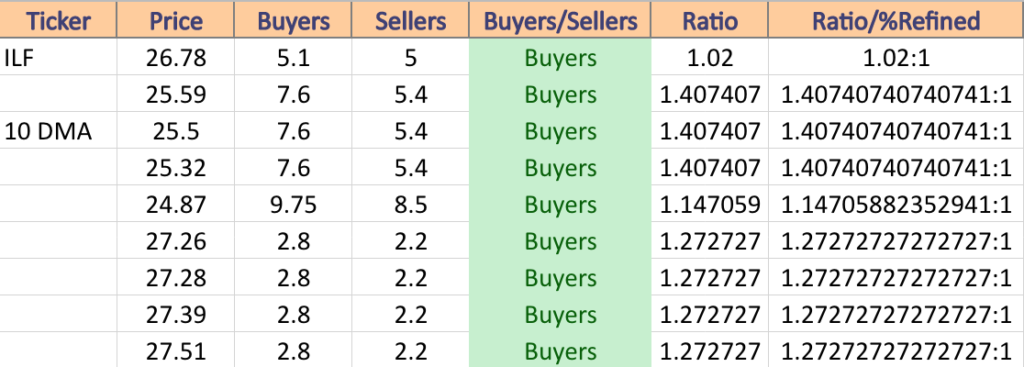
ILF, iShares Latin America 40 ETF has risen +23.77% over the past year, notching +29.1% since their 52-week low of July in 2022 (ex-distributions) to close at $26.78/share (Volume Sentiment: Buyers, 1.02:1).
ILF ETF – iShares Latin America 40 ETF’s Technical Performance Over The Past Year
Their RSI is overbought at 72.53 & their MACD is bullish, after last week’s rally continued the jump of the previous Friday’s gap up session.
Last week’s volumes were below average compared to the week prior, which when combined with the candlesticks of the week signal that investors are beginning to feel nervous in the near-term & a consolidation is imminent.
ILF offers an 8.56% distribution yield, which will provide some protection against declines, but shareholders should be looking for an insurance play to protect themselves in the near-term, while watching their behavior at support levels.
ILF has support at the $25.59 (Volume Sentiment: Buyers, 1.41:1), $25.50 (10 Day Moving Average; Volume Sentiment: Buyers, 1.41:1), $25.32 (Volume Sentiment: Buyers, 1.41:1) & $24.87/share (Volume Sentiment: Buyers, 1.15:1) price levels, with resistance at the $27.26 (Volume Sentiment: Buyers, 1.27:1), $27.28 (Volume Sentiment: Buyers, 1.27:1), $27.39 (Volume Sentiment: Buyers, 1.27:1) & $27.51/share (Volume Sentiment: Buyers, 1.27:1) price levels.
ILF ETF Point & Figure Chart With Volume Overlay
ILF Volume Sentiment At Current Price & Next Support & Resistance Levels
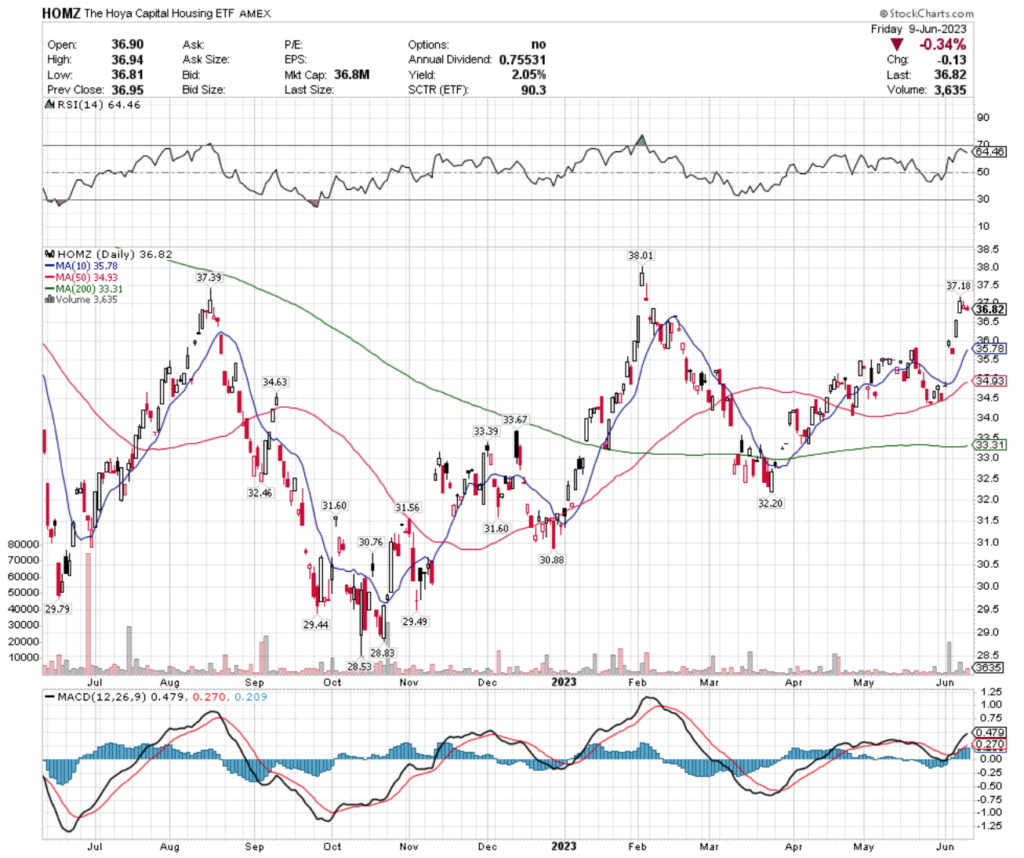
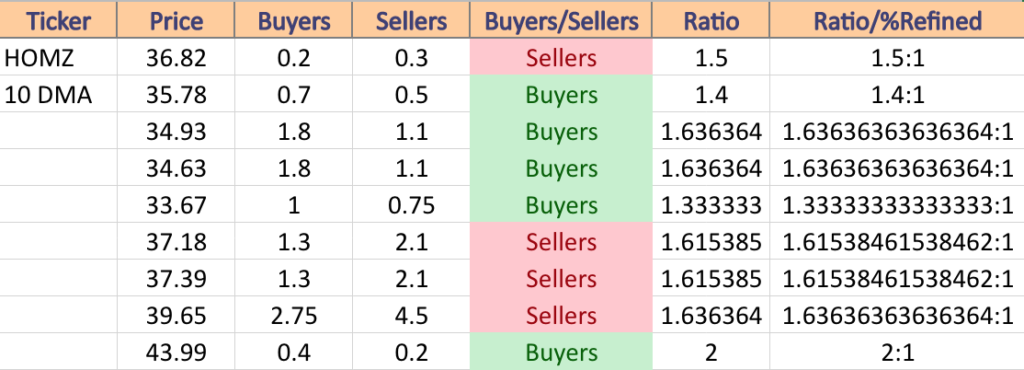
HOMZ, the Hoya Capital Housing ETF has posted +17.42% gains over the past year, climbing +27.1% from their 52-week low in October of 2022 (ex-distributions) to close at $36.82/share (Volume Sentiment: Sellers, 1.15:1).
HOMZ ETF – Hoya Capital Housing ETF’s Technical Performance Over The Past Year
Their RSI is returning towards neutral, but still close to overbought at 64.46 & their MACD looks primed to roll over bearish in the near-term.
Wednesday’s gap up session was followed by two days whose price action was entirely contained within the range of Wednesday’s candle, showing that investors are somewhat unsure as to which way to go.
While they offer a 2.05% distribution yield as a cushion, caution should be exercised in regards to opening a new position until seeing how their support levels hold up in the near-term, and trading an insurance style options strategy in the meantime will provide portfolio protection until a stronger uptrend emerges.
HOMZ has support at the $35.78 (10 Day Moving Average; Volume Sentiment: Buyers, 1.4:1), $34.93 (50 Day Moving Average; Volume Sentiment: Buyers, 1.64:1), $34.63 (Volume Sentiment: Buyers, 1.64:1) & $33.67/share (Volume Sentiment: Buyers, 1.33:1) price levels, with resistance at the $37.18 (Volume Sentiment: Sellers, 1.62:1), $37.39 (Volume Sentiment: Sellers, 1.62:1), $39.65 (Volume Sentiment: Sellers, 1.64:1) & $43.99/share (Volume Sentiment: Buyers, 2:1).
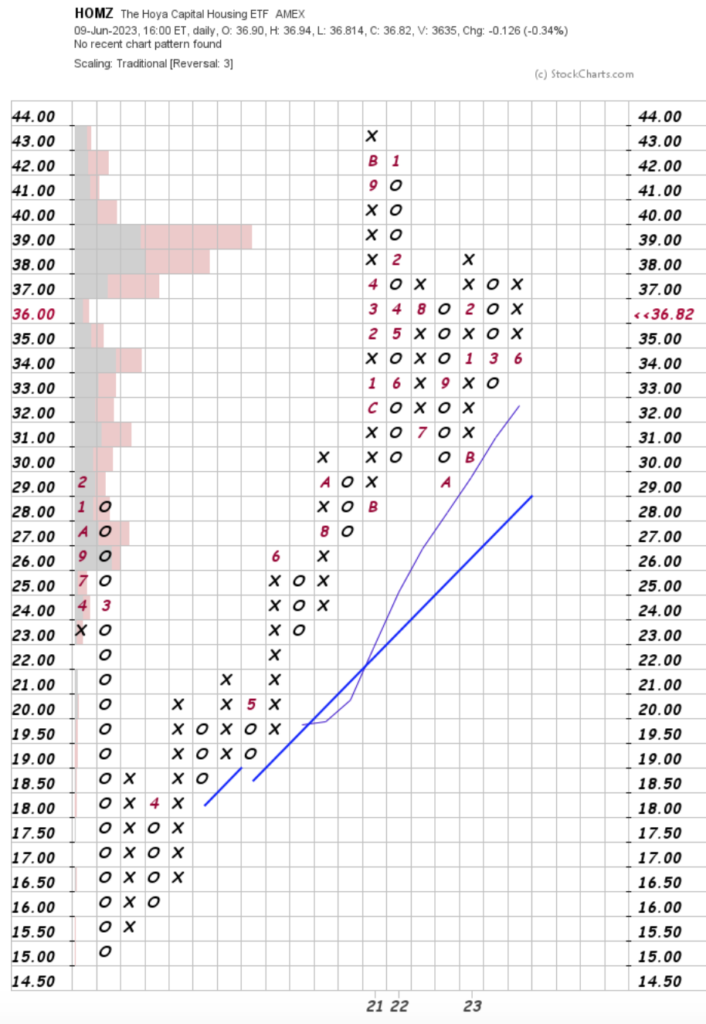
HOMZ ETF Point & Figure Chart With Volume Overlay
HOMZ Volume Sentiment At Current Price & Next Support & Resistance Levels
Utilities (UTSL), Malaysia (EWM), Energy (PXI) & Zero Coupon 25+ U.S. Treasury (ZROZ) Have All Been Bearishly Lagging The Market
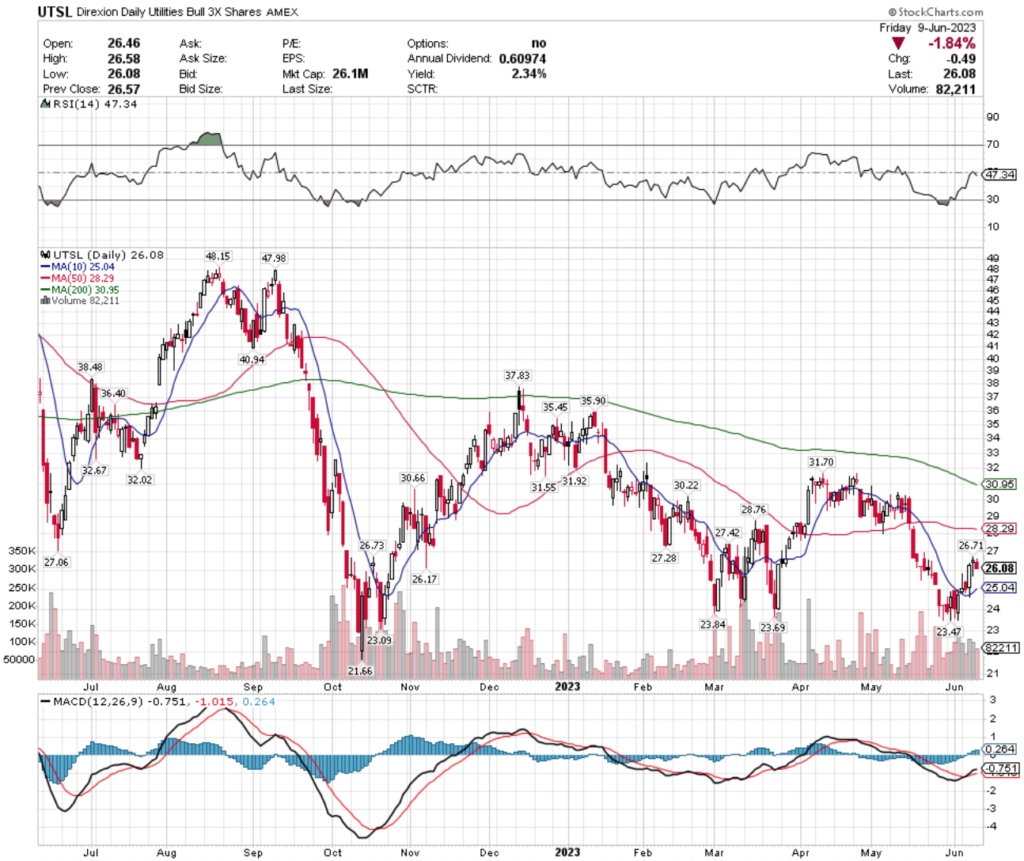
UTSL, the Direxion Daily Utilities Bull 3x Shares ETF has fallen -19.09% over the past year, losing -46.6% from their 52-week high in August of 2022, but reclaiming +19.03% from their 52-week low in October of 2022 (ex-distributions), to close at $26.08/share (Volume Sentiment: Buyers, 1.13:1).
UTSL ETF – Direxion Daily Utilities Bull 3x Shares ETF’s Technical Performance Over The Past Year
Their RSI is on the oversold end of neutral at 47.34, with last week’s volume being above average compared to the year prior.
However, their MACD is signaling further near-term weakness, with a bearish crossover on the horizon.
While their 2.34% distribution yield offers some form of protection against losses, unless trading an insurance strategy with options, it will be best to watch how their support levels hold up in the coming weeks before entering or adding to a position.
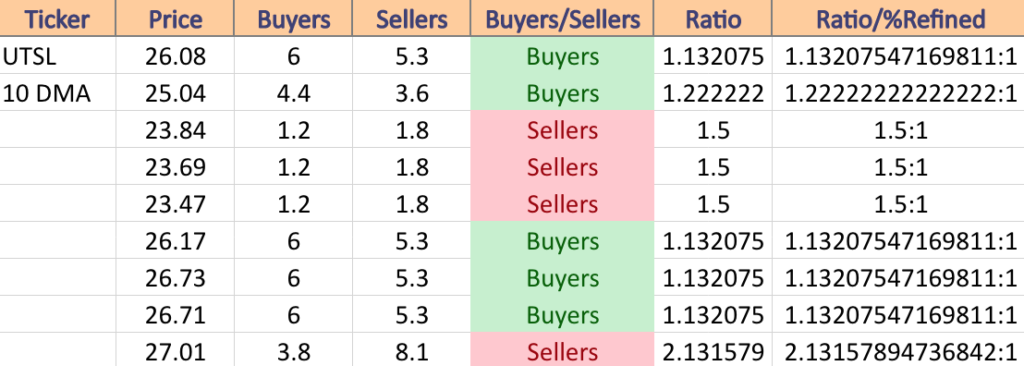
UTSL has support at the $25.04 (10 Day Moving Average; Volume Sentiment: Buyers, 1.22:1), $23.84 (Volume Sentiment: Sellers, 1.5:1), $23.69 (Volume Sentiment: Sellers, 1.5:1) & $23.47/share (Volume Sentiment: Sellers, 1.5:1) price levels, with resistance at the $26.17 (Volume Sentiment: Buyers, 1.13:1), $26.71 (Volume Sentiment: Buyers, 1.13:1) , $26.73 (Volume Sentiment: Buyers, 1.13:1) & $27.01/share (Volume Sentiment: Sellers, 2.13:1) price levels.
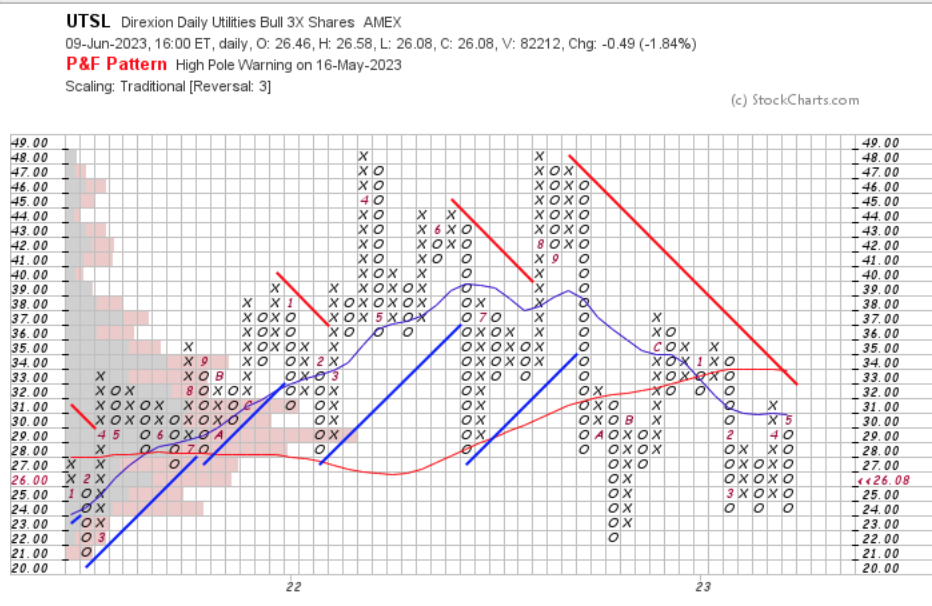
UTSL ETF Point & Figure Chart With Volume Overlay
UTSL Volume Sentiment At Current Price & Next Support & Resistance Levels
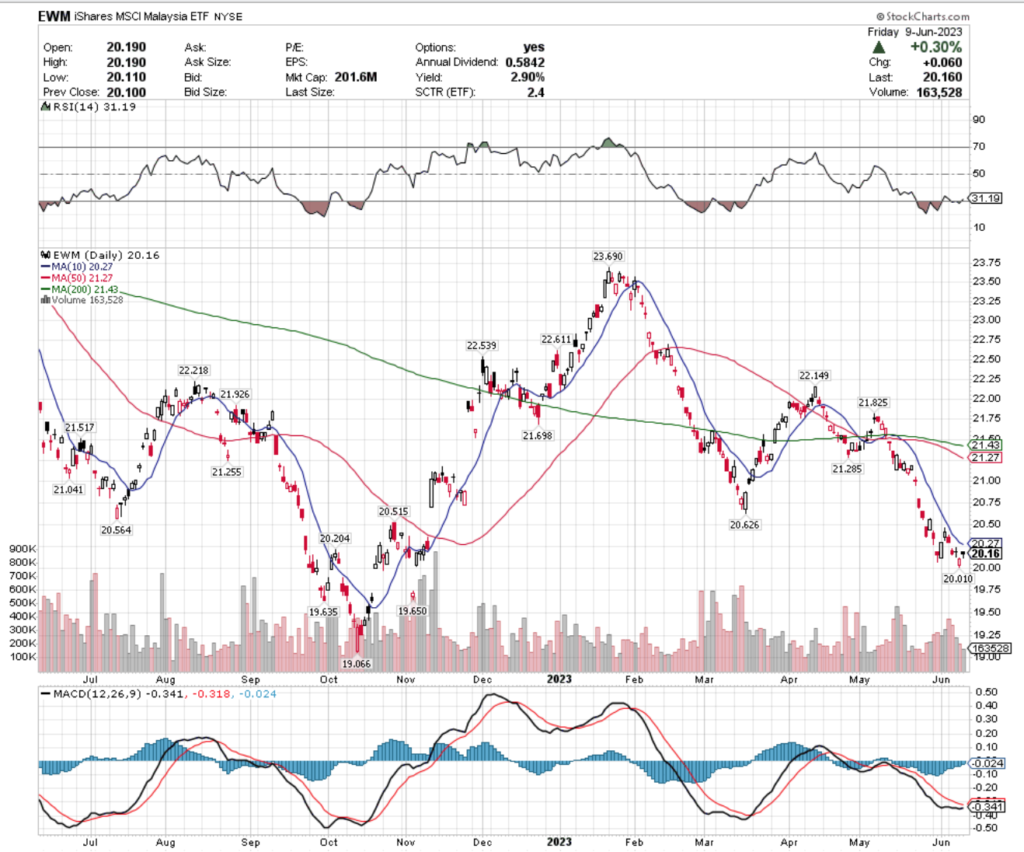
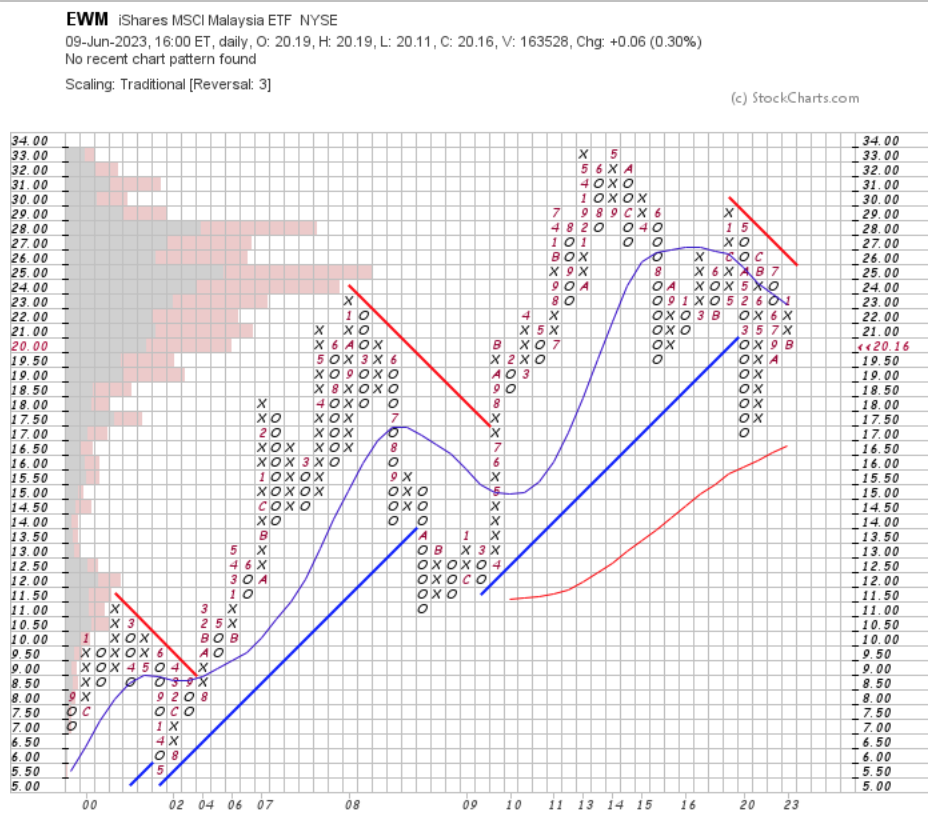
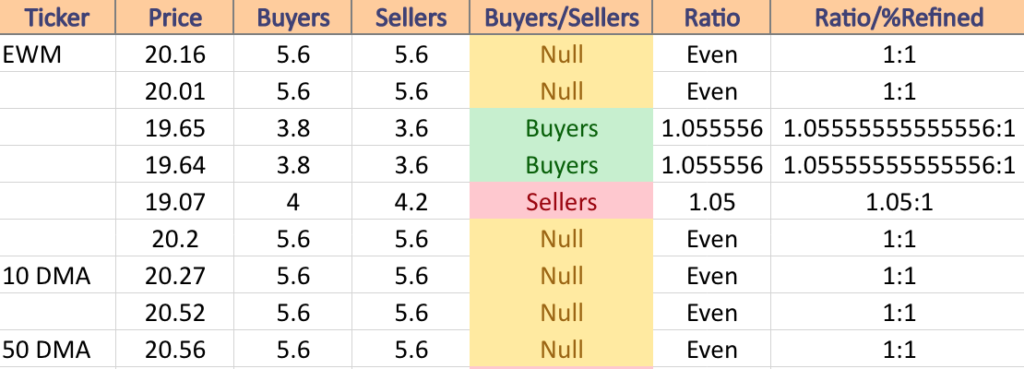
EWM, the iShares MSCI Malaysia ETF has lost -5.84% over the past year, losing -16.42% from their 52-week high in January of 2023, but has recovered +2.86% since their 52-week low in October of 2022 (ex-distributions), to close at $20.16/share (Volume Sentiment: Even, 1:1).
EWM ETF – iShares MSCI Malaysia ETF’s Technical Performance Over The Past Year
Their RSI is approaching oversold levels at 31.19, with last week’s volumes falling relatively in line with the year prior’s average.
Their MACD is about to cross over bullishly, which may help them break free of the range that their candlesticks were trading in on Tuesday, Wednesday & Friday.
Friday’s hanging man candle is a cause for concern among investors thought, and their distribution yield only provides 2.9% of protection against losses for longterm holders.
EWM has support at the $20.01 (Volume Sentiment: Even, 1:1), $19.65 (Volume Sentiment: Buyers, 1.06:1), $19.64 (Volume Sentiment: Buyers, 1.06:1) & $19.07/share (Volume Sentiment: Sellers, 1.05:1) & resistance at the $20.20 (Volume Sentiment: Even, 1:1), $20.27 (50 Day Moving Average; Volume Sentiment: Even, 1:1) , $20.52 (Volume Sentiment: Even, 1:1) & $20.56/share (Volume Sentiment: Even, 1:1) price levels.
EWM ETF Point & Figure Chart With Volume Overlay
EWM Volume Sentiment At Current Price & Next Support & Resistance Levels
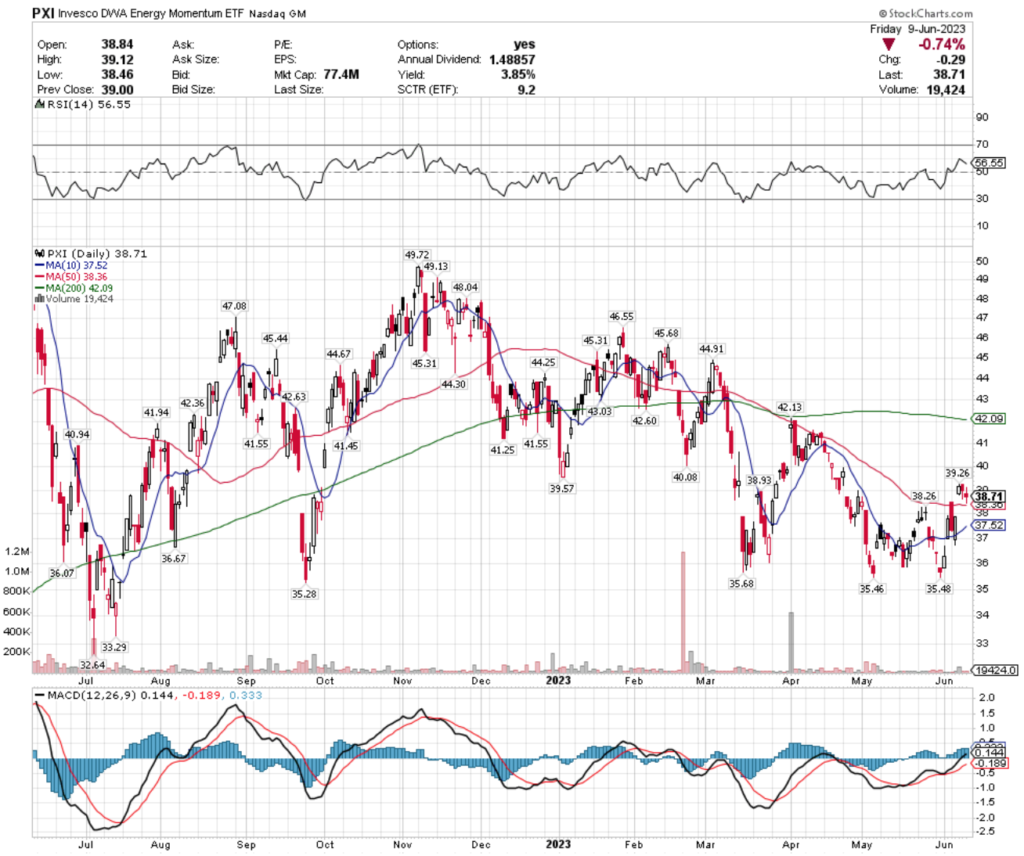
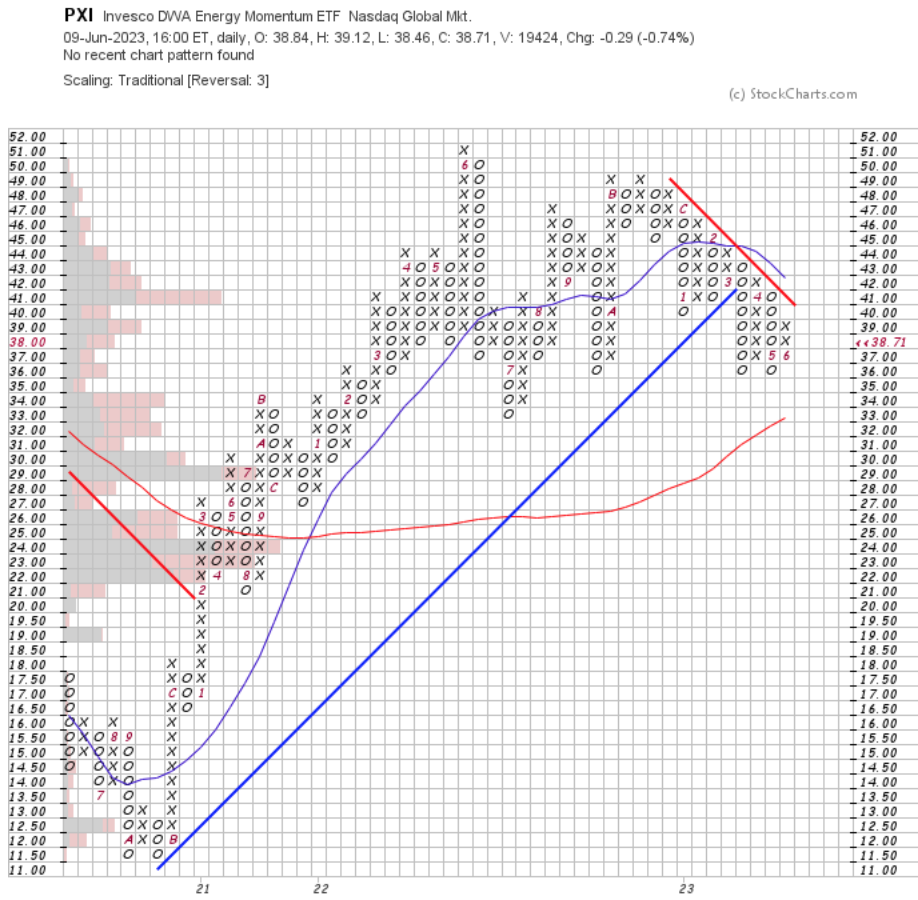
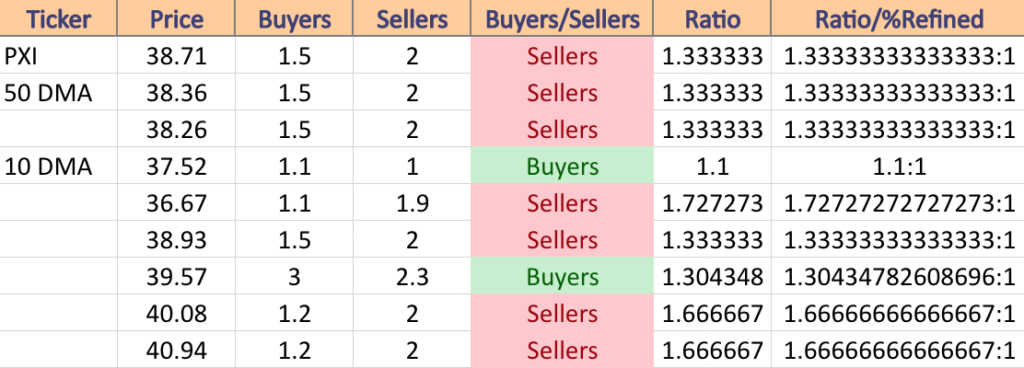
PXI, the Invesco DWA Energy Momentum Fund ETF has fallen -14.57% over the past year, declining -23.17% from their 52-week high in November of 2022, but has reclaimed +15.04% since their 52-week low in July of 2022 (ex-distributions), to close at $38.71/share (Volume Sentiment: Sellers, 1.33:1).
PXI ETF – Invesco DWA Energy Momentum Fund ETF’s Technical Performance Over The Past Year
Their RSI is on the overbought end of neutral at 56.55, while their MACD is still bullish.
Volumes were below average last week, signaling uncertainty by investors, and it will be interesting to see if their 50 day moving average can provide enough support to keep them from filling the gap from Wednesday’s session.
They offer a 3.85% distribution yield for long-term holders, which can provide some protection against losses, but an insurance strategy would be beneficial to have in the near-term.
PXI has support at the $38.36 (50 Day Moving Average; Volume Sentiment: Sellers, 1.33:1), $38.26 (Volume Sentiment: Sellers, 1.33:1), $37.52 (10 Day Moving Average; Volume Sentiment: Buyers, 1.1:1) & $36.67 (Volume Sentiment: Sellers, 1.73:1), with resistance at the $38.93 (Volume Sentiment: Sellers, 1.33:1), $39.57 (Volume Sentiment: Buyers, 1.30:1), $40.08 (Volume Sentiment: Sellers, 1.67:1) & $40.94/share (Volume Sentiment: Sellers, 1.67:1) price levels.
PXI ETF Point & Figure Chart With Volume Overlay
PXI Volume Sentiment At Current Price & Next Support & Resistance Levels
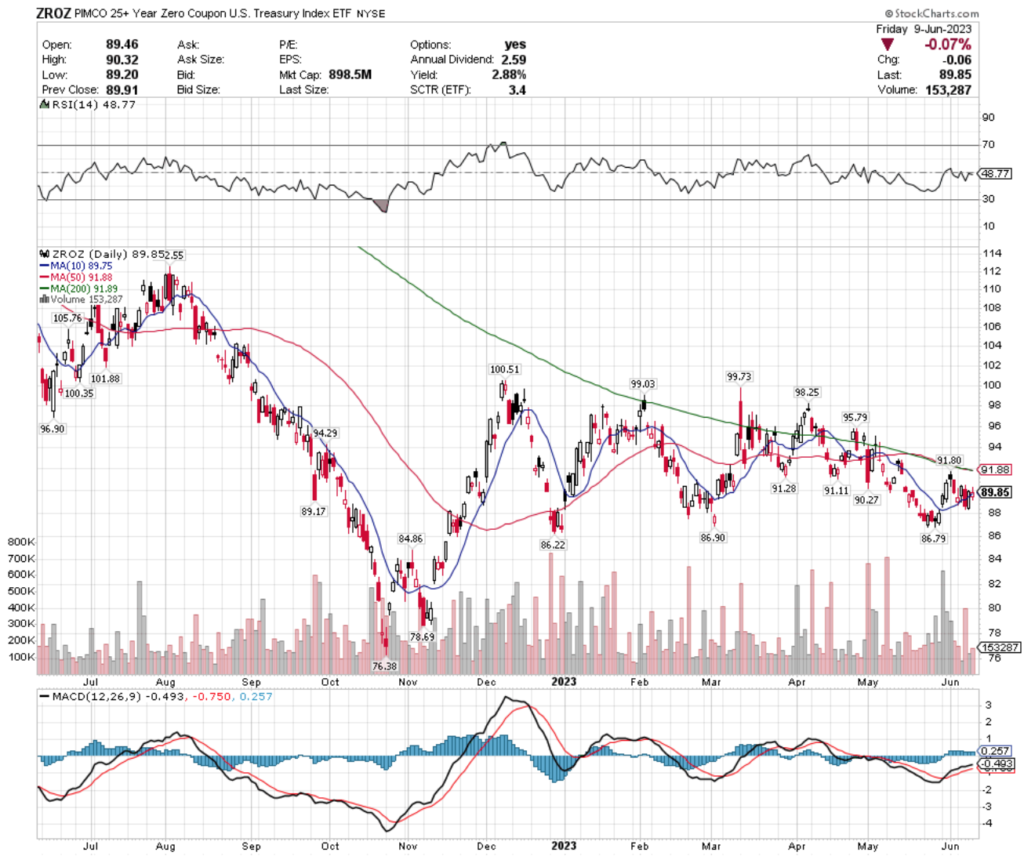
ZROZ, the PIMCO 25+ Year Zero Coupon U.S. Treasury ETF has lost -10.37% over the past year, falling -21.87% from their 52-week high in August of 2022, but has gained +15.92% since their 52-week low in October of 2022 (ex-distributions), to close at $89.85/share (Volume Sentiment: Sellers, 1.67:1).
ZROZ ETF – PIMCO 25+ Year Zero Coupon U.S. Treasury ETF’s Technical Performance Over The Past Year
Their RSI is on the oversold end of neutral at 48.77, with their MACD signaling a bearish crossover in the coming days.
Volumes were below average last week compared to the year prior, as their price consolidated, signaling uncertainty among investors.
Their 2.88% distribution yield will provide some relief against potential losses, but watching to see how their support levels hold up in the coming week will be important before deciding on where to enter a position.
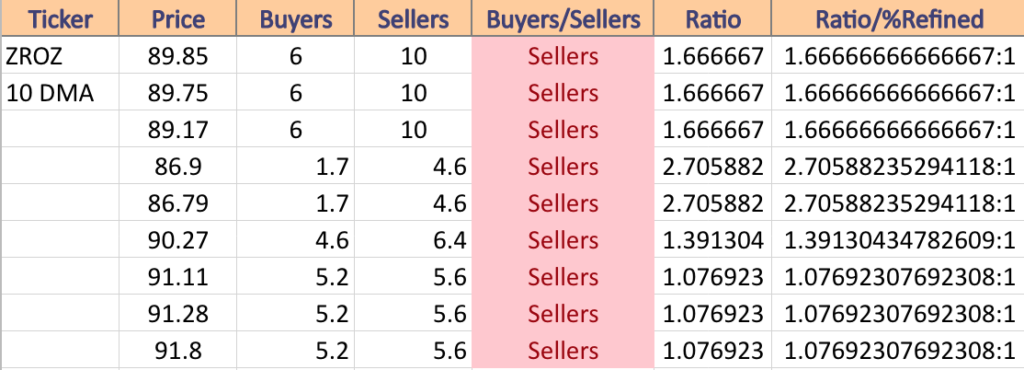
ZROZ has support at the $89.75 (10 Day Moving Average; Volume Sentiment: Sellers, 1.67:1), $89.17 (Volume Sentiment: Sellers, 1.67:1), $86.90 (Volume Sentiment: Sellers, 2.71:1) & $86.79/share (Volume Sentiment: Sellers, 2.71:1), with resistance at the $90.27 (Volume Sentiment: Sellers, 1.39:1), $91.11 (Volume Sentiment: Sellers, 1.08:1), $91.28 (Volume Sentiment: Sellers, 1.08:1) & $91.80/share (Volume Sentiment: Sellers, 1.08:1) price levels.
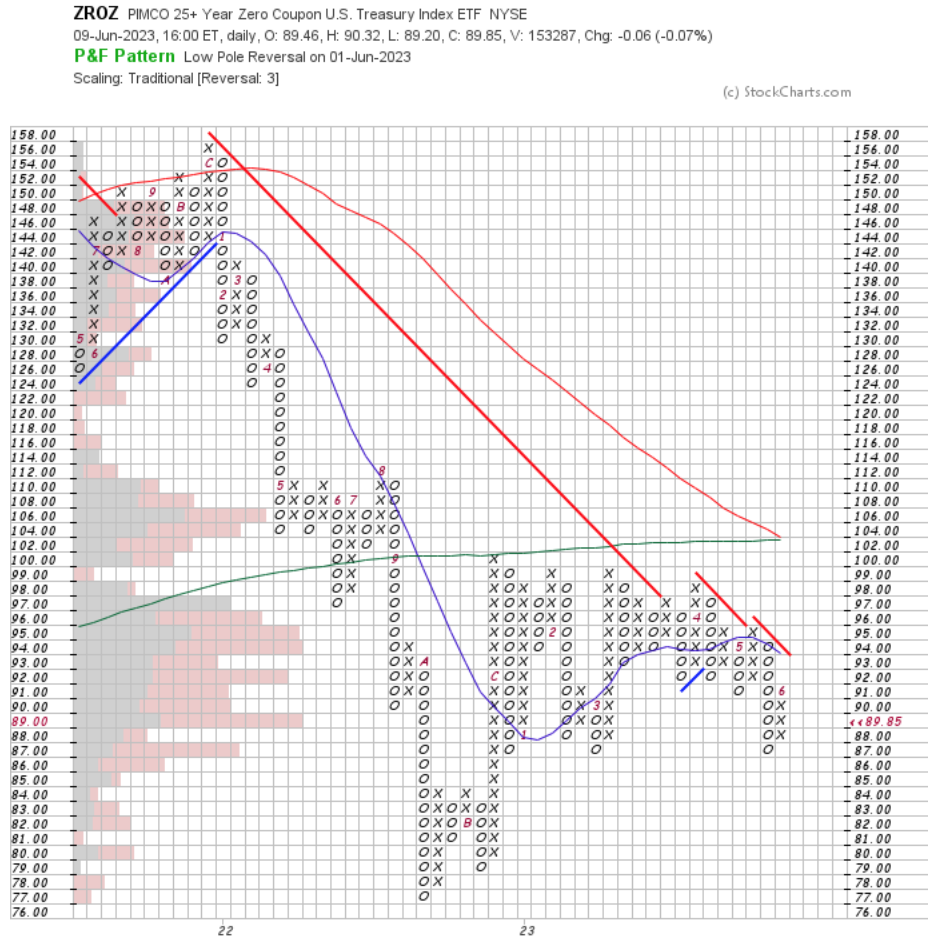
ZROZ ETF Point & Figure Chart With Volume Overlay
ZROZ Volume Sentiment At Current Price & Next Support & Resistance Levels
Tying It All Together & The Week Ahead
Monday looks to be quiet on the data being reported front next week, with Oracle’s earnings report being the most anticipated data for the day.
Tuesday heats up with the NFIB Optimism Index at 6 am, followed by the Consumer Price Index, Core CPI, CPI Year-over-Year & Core CPI Year-over-Year being reported at 8:30 am, with no noteworthy earnings reports on tap.
Wednesday kicks off at 8:30 am with the Producer Price Index, Core PPI, PPI Year-over-Year & Core PPI Year-over-Year being reported at 8:30 am, with the biggest news of the week coming at 2 pm when the Fed Decision on Interest-Rate Policy is announced & Chairman Powell gives his press conference at 2:30 pm.
Lennar will also be reporting earnings on Wednesday.
Thursday will have a busy day on the data reporting front, with the morning kicking off at 8:30 am for Initial Jobless Claims, U.S. Retail Sales, Retail Sales minus Autos, Import Price Index, Import Price minus Fuel, the Empire State Manufacturing Survey & Philadelphia Fed Manufacturing Survey data, followed by Industrial Production & Capacity Utilization at 9:15 am & Business Inventories data at 10 am.
Thursday’s earnings reports include Adobe & Kroger, along with some others.
The week winds down quietly on Friday, with Consumer Sentiment reported at 10 am & no noteworthy earnings calls on schedule.
See you back here next week!
*** I DO NOT OWN SHARES OR OPTIONS CONTRACT POSITIONS IN SPY, QQQ, IWM, DIA, SOXL, BRZU, ILF, HOMZ, UTSL, EWM, PXI, or ZROZ AT THE TIME OF PUBLISHING THIS ARTICLE ***
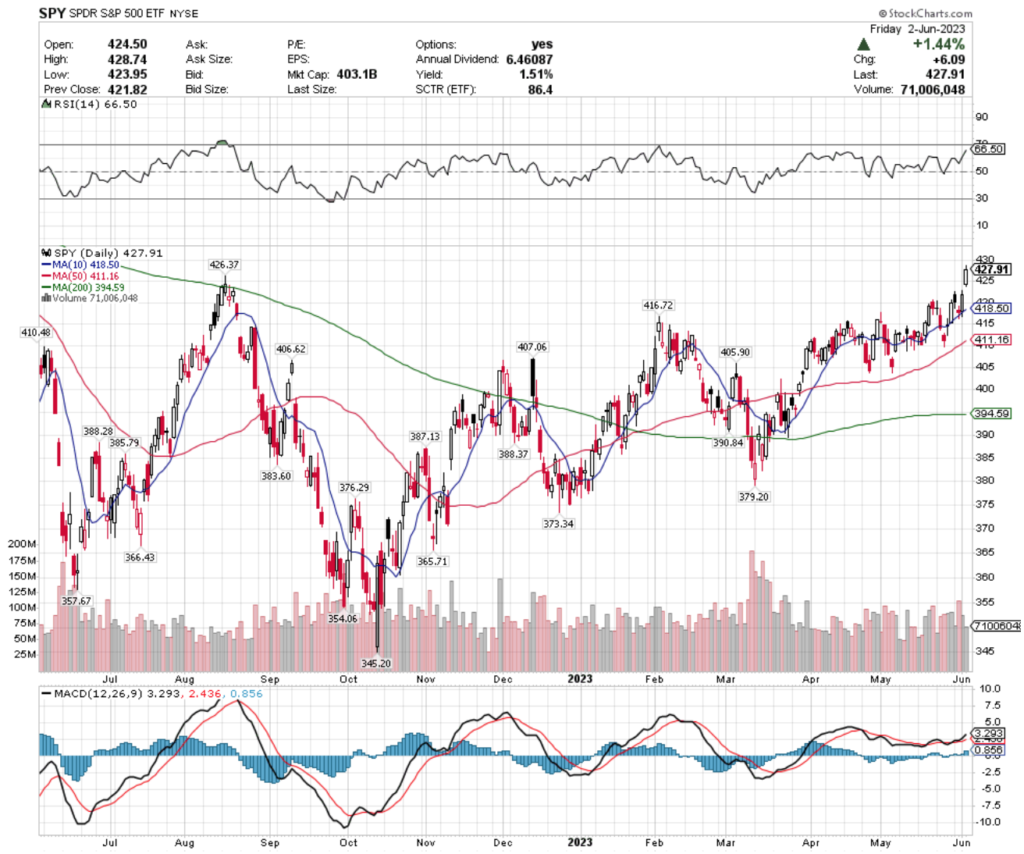
SPY, the SPDR S&P 500 ETF gained +1.88% over the past week, as the largest U.S. stocks & A.I. related names continued to show strength over the past week.
SPY ETF – SPDR S&P 500 ETF’s Technical Performance Over The Past Year
Their RSI is approaching overbought territory at 66.5, with healthy volume all week with the exception of Friday’s session, which was a +1.44% gap up.
Their MACD is still bullish, however, their $426.37/share support level will be a key mark to watch next week, as they try to not fill in Friday’s gap.
SPY has support a the $426.37 (Volume Sentiment: Sellers, 1.24:1), $418.50 (10 day moving average; Volume Sentiment: 1.33:1) , $416.72 (Volume Sentiment: 1.33:1) & $410.48/share (Volume Sentiment: Sellers, 1.57:1) price levels, with resistance overhead at the $438.53 (Volume Sentiment: Sellers, 1.32:1), $442.12 (Volume Sentiment: Sellers, 1.35:1) , $449.09 (Volume Sentiment: Buyers, 1.89:1) & $454.37/share (Volume Sentiment: Sellers, 1.25:1)
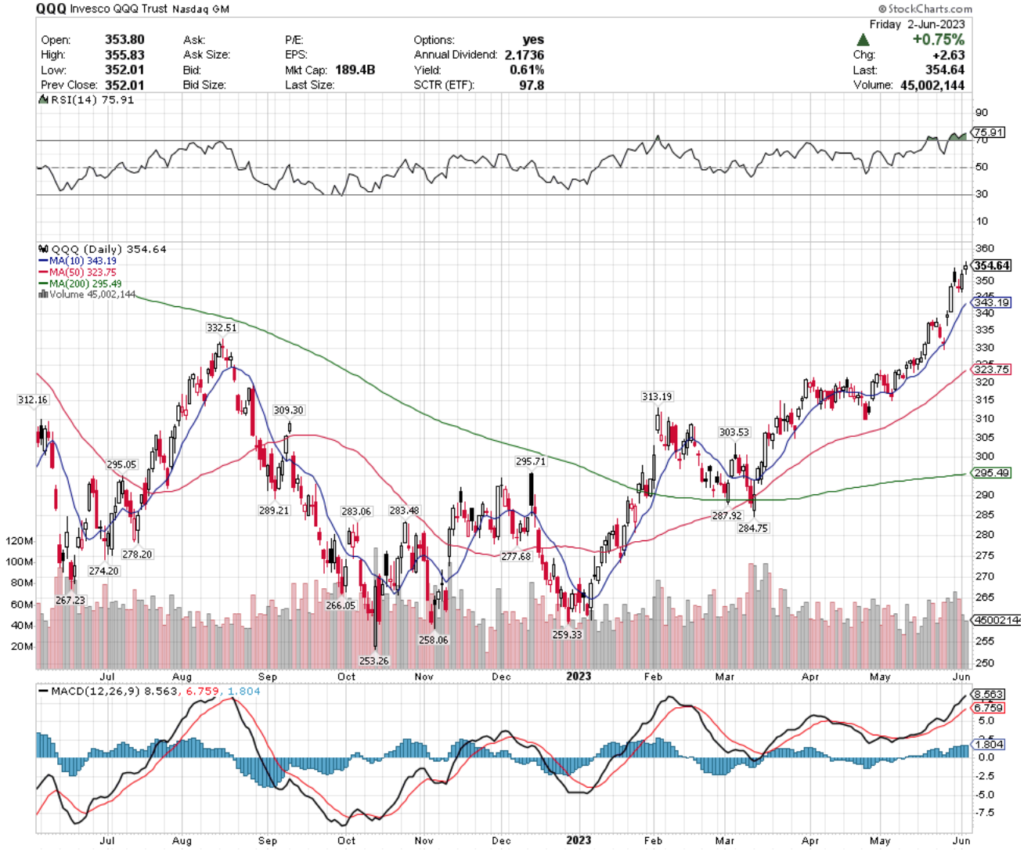
QQQ, the Invesco QQQ Trust ETF added +1.79% over the past week, but closed on a spinning top candle, which was an odd twist to the week, as suddenly the low-volume spinning top Friday showed there is some hesitancy & uncertainty after a week & a half of strong performance for NASDAQ names.
QQQ ETF – Invesco QQQ Trust ETF’s Technical Performance Over The Past Year
Their RSI has gone into overbought territory following Monday’s session & is currently at 75.91, with strong volume all week with the exception of Thursday & Friday.
QQQ’s MACD is also bullish, but Friday’s session’s spinning top on a +0.75% day signals that there is uncertainty in the strength of their near-term performance.
QQQ has support at the $343.19 (10 Day Moving Average; Volume Sentiment: Sellers, 1.2:1), $332.51 (Volume Sentiment: Sellers, 3.2:1), $323.75 (50 Day Moving Average; Volume Sentiment: Sellers, 2:1) & $313.19/share (Volume Sentiment: 1.55:1), with resistance at the $368.99 (Volume Sentiment: Buyers, 0.75:0*), $375.07 (Volume Sentiment: Sellers, 1:0*), $378.49 (Volume Sentiment: Buyers, 1.33:1) & $401.00/share (Volume Sentiment: NULL, 0:0*) price levels.
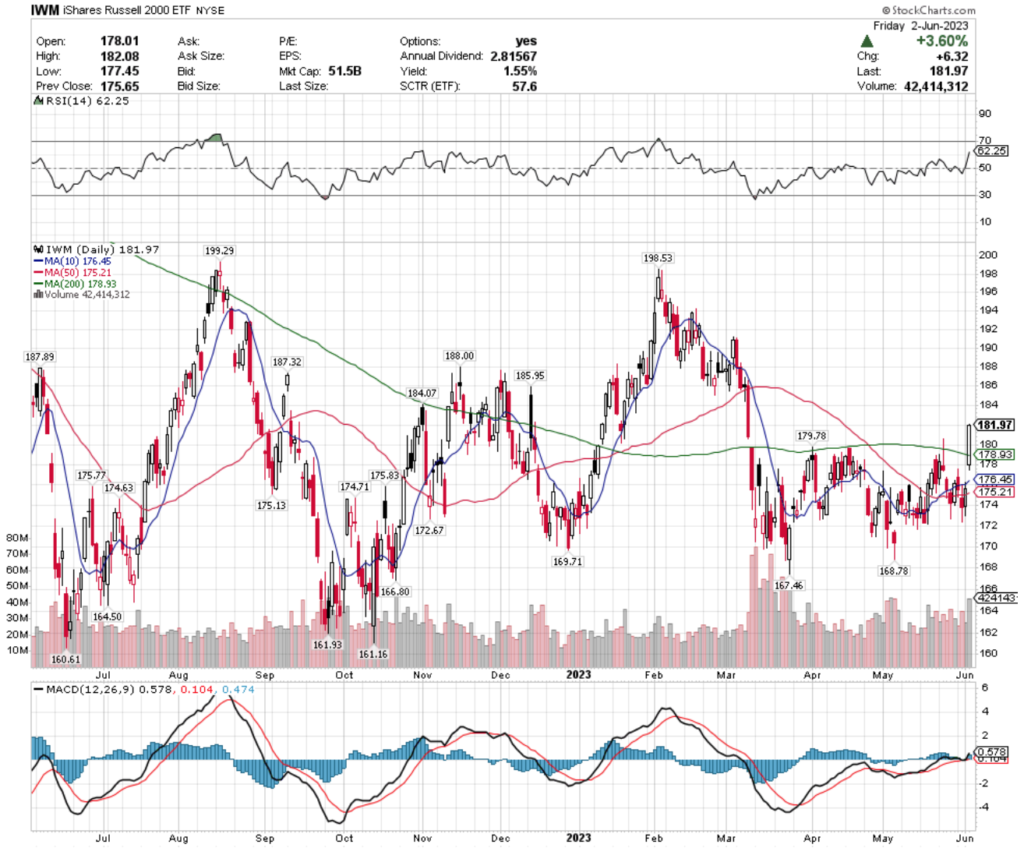
IWM, the iShares Russell 2000 ETF fared the best this past week, climbing +3.3%, as small cap names also showed strength alongside the mega-cap names that dominated the week’s headlines.
IWM ETF – iShares Russell 2000 ETF’s Technical Performance Over The Past Year
Their RSI has remained the most tame, but is still approaching overbought conditions at 62.25, with Friday’s volume being the strongest of the week on their +3.6% gap up session.
Their MACD is bullish, but their 200 & 10 day moving averages will be the main places to watch next week, as they fall within the range of Friday’s gap & will be the primary support for keeping it from filling.
IWM has support at the $179.78 (Volume Sentiment: Buyers, 1.84:1), $178.93 (200 Day Moving Average; Volume Sentiment: Buyers, 1.84:1), $176.45 (10 Day Moving Average; Volume Sentiment: Sellers, 1.06:1) & $175.83/share (Volume Sentiment: Buyers, 1.45:1) price levels, with resistance at the $184.07 (Volume Sentiment: Buyers, 1.75:1), $185.95 (Volume Sentiment: Buyers, 1.75:1), $187.32 (Volume Sentiment: Buyers, 1.91:1 ) & $187.89/share (Volume Sentiment: Buyers, 1.91:1) price levels.
Let’s dive into some of the best & worst performing sectors, industries & geo-locations in the market now, based on our technical analysis ratings of their respective ETFs!
South Korea (KORU), Greece (GREK), Russell 1000 (IWB) & Industrials Momentum Stocks (PRN) Are All Bullishly Leading The Market
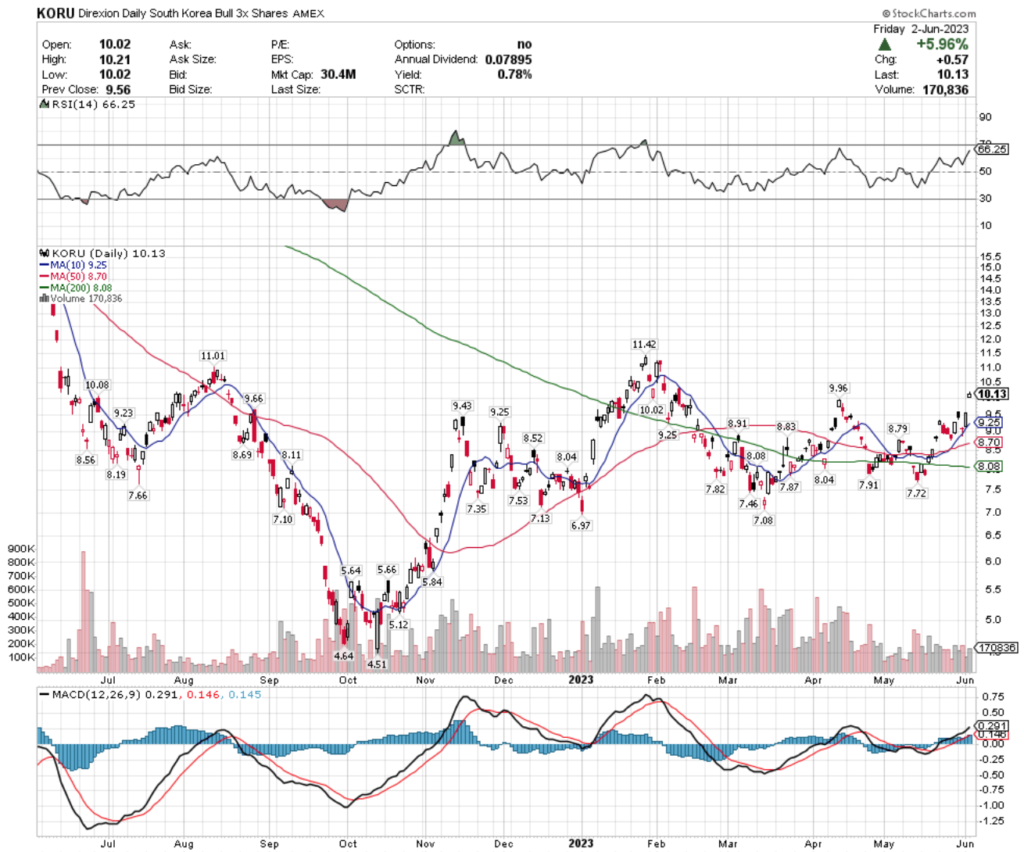
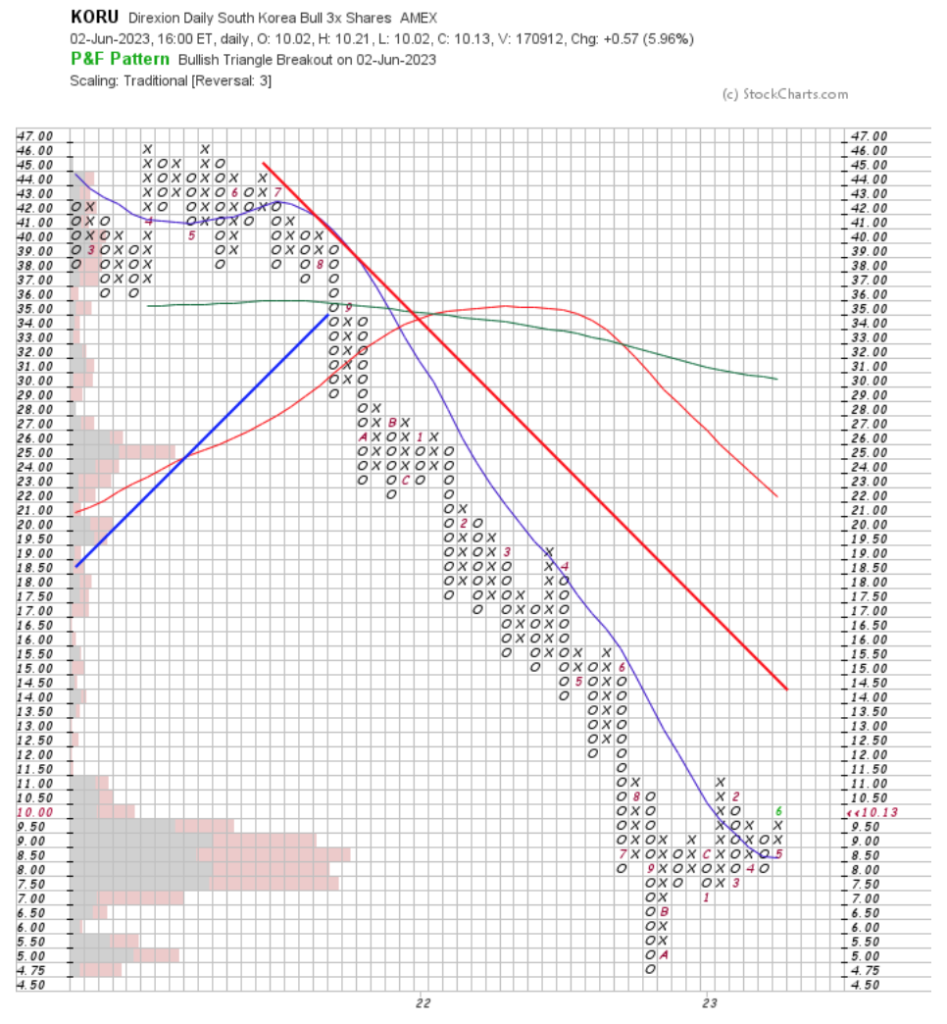
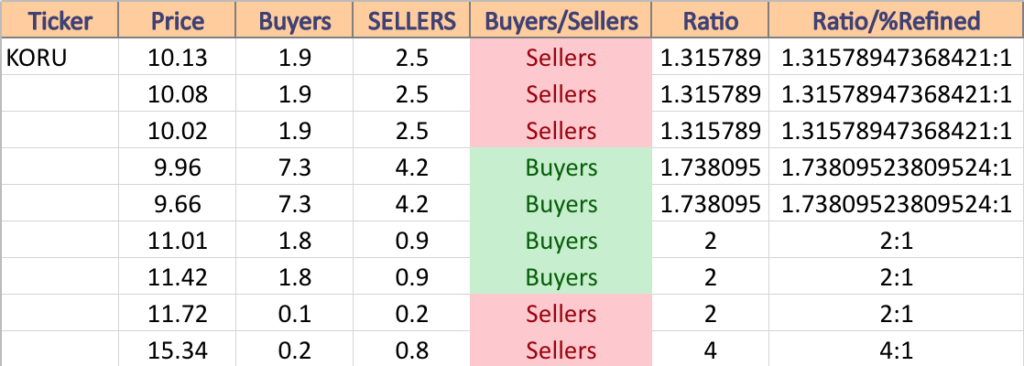
KORU, the Direxion Daily South Korea Bull 3x Shares ETF has fallen -38.05% over the past year, but rebounded a remarkable +109.65% from their 52-week low in October of 2022 (ex-distributions), to close at $10.13/share (Volume Sentiment: Sellers, 1.32:1).
KORU ETF – Direxion Daily South Korea Bull 3x Shares ETF’s Technical Performance Over The Past Year
Their RSI is approaching overbought territory at 66.25, with below average volume over the past week, signaling uncertainty among investors.
Their MACD is still pointing bullishly, but Friday’s candlestick confirms the uncertainty implied by the week’s volume, with the open & the close taking place in a very narrow range.
Investors thinking about entering a position in KORU would be best suited to watch their behavior around support levels in the near-term, to find a target entry level for when the market has returned into an uptrend.
Their 0.78% distribution yield will not provide much cushion against losses, highlighting the importance of having an defensive insurance policy at play, such as buying puts or selling calls.
KORU has support at the $10.08 (Volume Sentiment: Sellers, 1.32:1), $10.02 (Volume Sentiment: Sellers, 1.32:1), $9.96 (Volume Sentiment: Buyers, 1.74:1) & $9.66/share (Volume Sentiment: Buyers, 1.74:1) price levels, with resistance at the $11.01 (Volume Sentiment: Buyers, 2:1), $11.42 (Volume Sentiment: Buyers, 2:1), $11.72 (Volume Sentiment: Sellers, 2:1) & $15.34/share (Volume Sentiment: Sellers, 4:1) price levels.
KORU ETF Point & Figure Chart With Volume Overlay
KORU Volume Sentiment At Current Price & Next Support & Resistance Levels
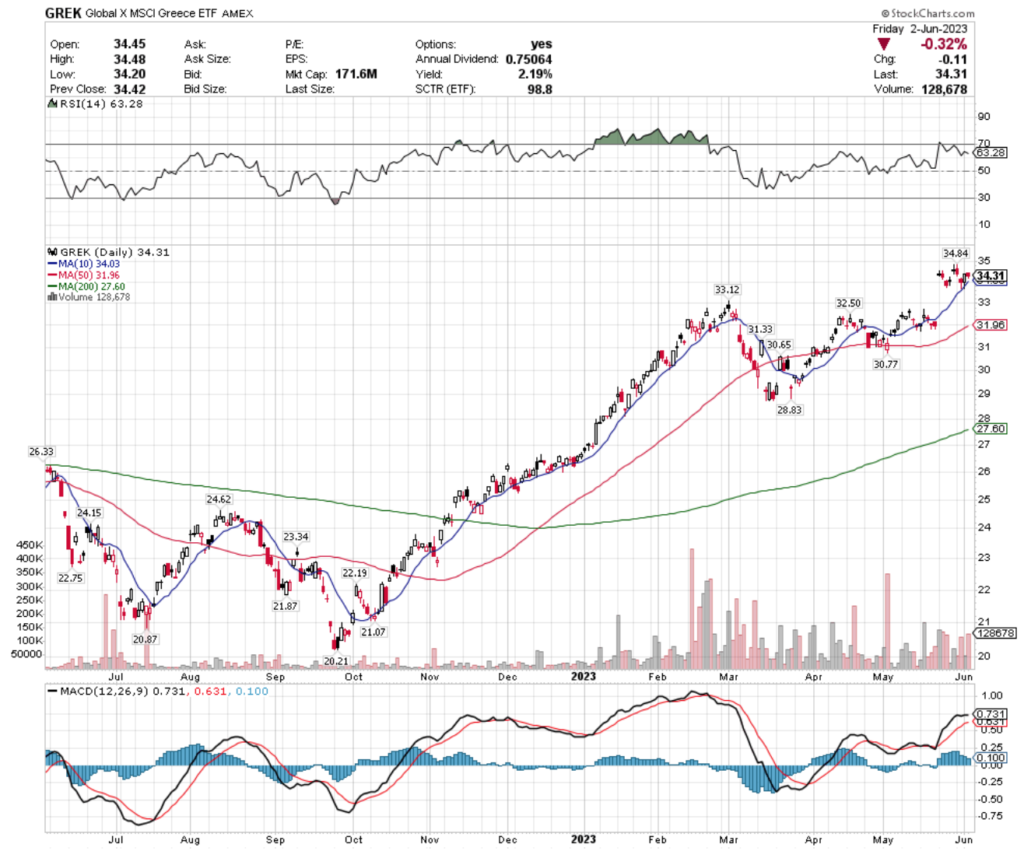
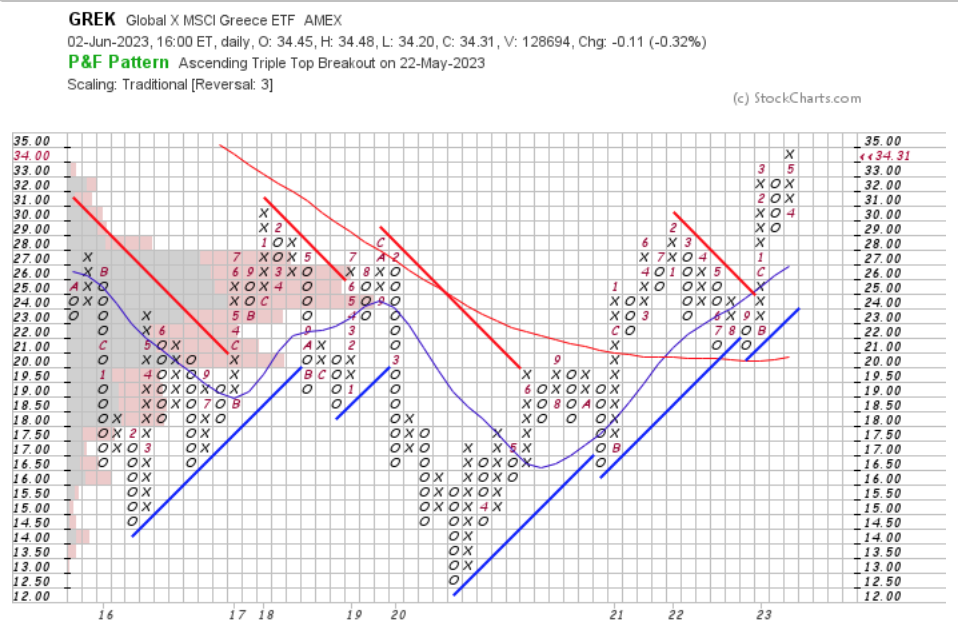
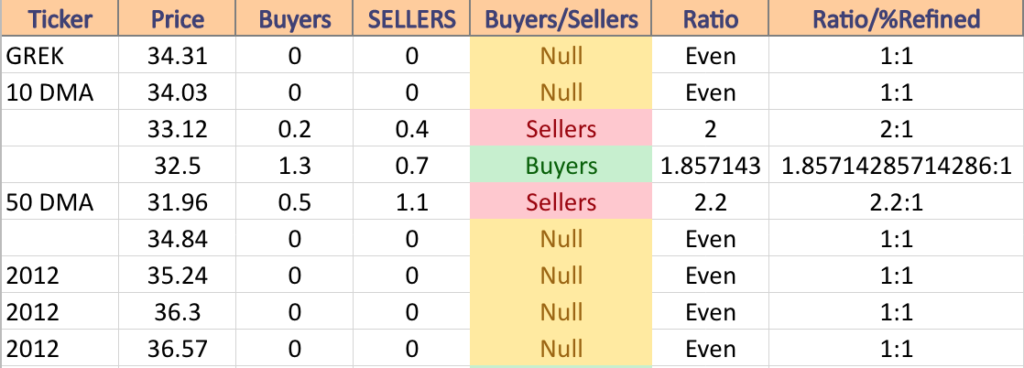
GREK, the Global X MSCI Greece ETF has improved +31.03% over the past year, but climbed +65.96% from their 52-week low in September of 2022 (ex-distributions) to close at $34.31/share (Volume Sentiment: Even, 1:1).
GREK ETF – Global X MSCI Greece ETF’s Technical Performance Over The Past Year
Their RSI has retreated slightly from the verge of overbought conditions during the past week, after their gap up on 5/22/2023, with last week’s volume being above average on selling sessions, but underwhelming on the positive days.
Their MACD has begun to curl over bearishly & a bearish crossover looks impending in the coming week, which is confirmed by the uncertainty seen in their candlesticks since the 5/22 gap up, where there are a couple of spinning tops & hanging men (and close but not quite hanging men), with most of the candles’ being contained in the range of Friday’s closing price.
While GREK offers a 2.19% distribution yield for long-term holders, this will have limited impact in terms of cushioning investors against losses, making it imperative to have an options strategy in place for loss protection in the near-term.
Investors should have their eyes peeled to see how they behave around support levels in the near-term, especially the 10 day moving average, as that is the last line of defense before they begin to refill the end of May gap mentioned prior.
GREK has support at the $34.03 (10 Day Moving Average; Volume Sentiment: Even, 1:1), $33.12 (Volume Sentiment: Sellers, 2:1), $32.50 (Volume Sentiment: Buyers, 1.86:1) & $31.96/share (50 Day Moving Average; Volume Sentiment: Sellers, 2.2:1) price levels, with resistance at the $33.84 (Volume Sentiment: Even, 1:1), $35.24 (Volume Sentiment: No Data, 2012 Level), $36.30 (Volume Sentiment: No Data, 2012 Level) & $36.57/share (Volume Sentiment: No Data, 2012 Level) price levels.
GREK ETF Point & Figure Chart With Volume Overlay
GREK Volume Sentiment At Current Price & Next Support & Resistance Levels
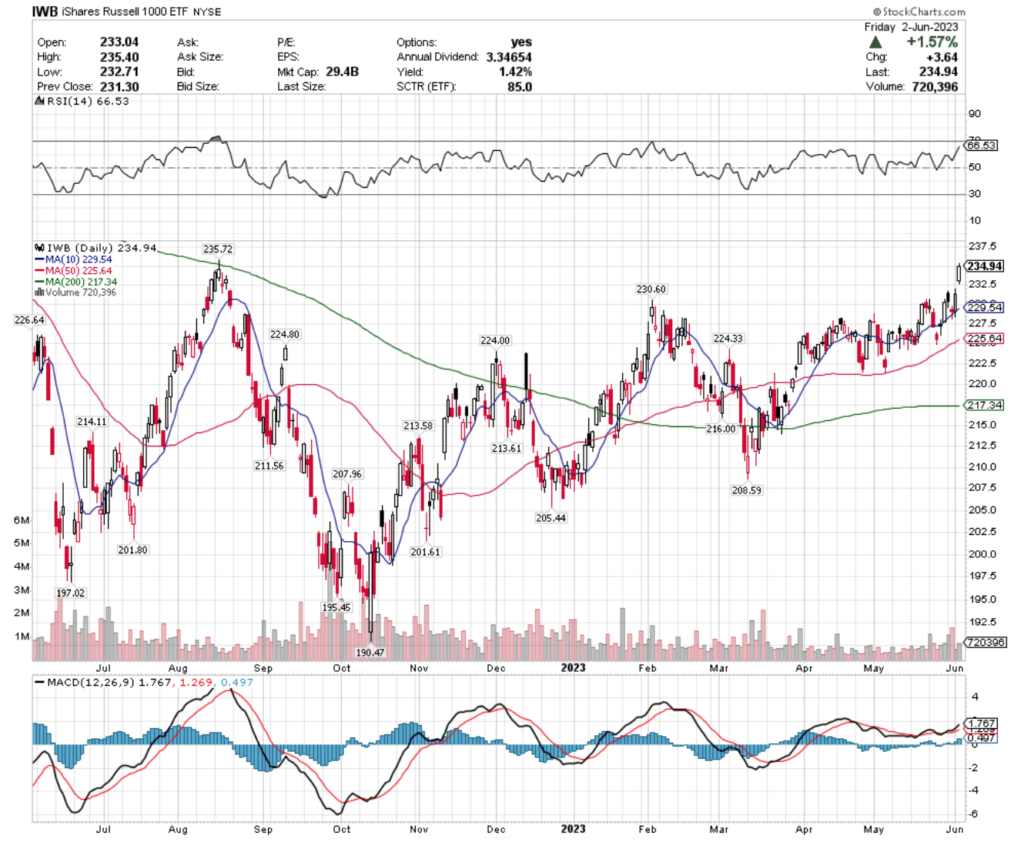
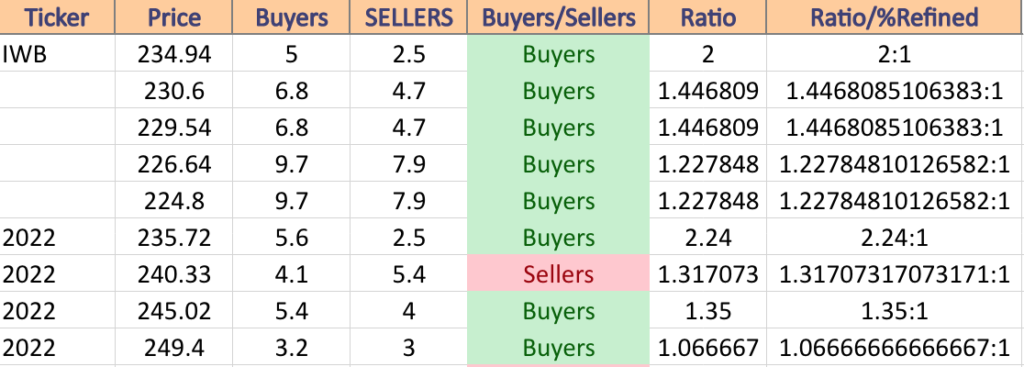
IWB, the iShares Russell 1000 ETF has gained +2.09% over the past year, while climbing +20.46% from their 52-week low in October of 2022 (ex-distributions) to close at $234.94/share (Volume Sentiment: Buyers, 2:1).
IWB ETF – iShares Russell 1000 ETF’s Technical Performance Over The Past Year
Their RSI is approaching overbought conditions at 66.53, with the past week’s volume levels being below average compared to the year prior (including on Friday’s +1.57% gap up session).
Their MACD is still bullish, but it will be interesting to see if they try to fill in the gap created at the end of last week.
With a 1.42% distribution yield for long-term holders, there is limited cushion against losses, calling for an options strategy to protect existing shareholders against near-term losses.
For those considering entering a position, it would be advised to watch how they behave in the coming weeks, especially around support levels that fall below Friday’s gap window.
IWB has support at the $230.60 (Volume Sentiment: Buyers, 1.45:1), $229.54 (Volume Sentiment: Buyers, 1.45:1), $226.64 (Volume Sentiment: Buyers, 1.23:1) & $224.80/share (Volume Sentiment (Buyers, 1.23:1), with resistance at the $235.72 (Volume Sentiment: Buyers, 2.24:1), $240.33 (Volume Sentiment: Sellers, 1.32:1), $245.02 (Volume Sentiment: Buyers, 1.35:1) & $249.40/share (Volume Sentiment: Buyers, 1.07:1) price levels.
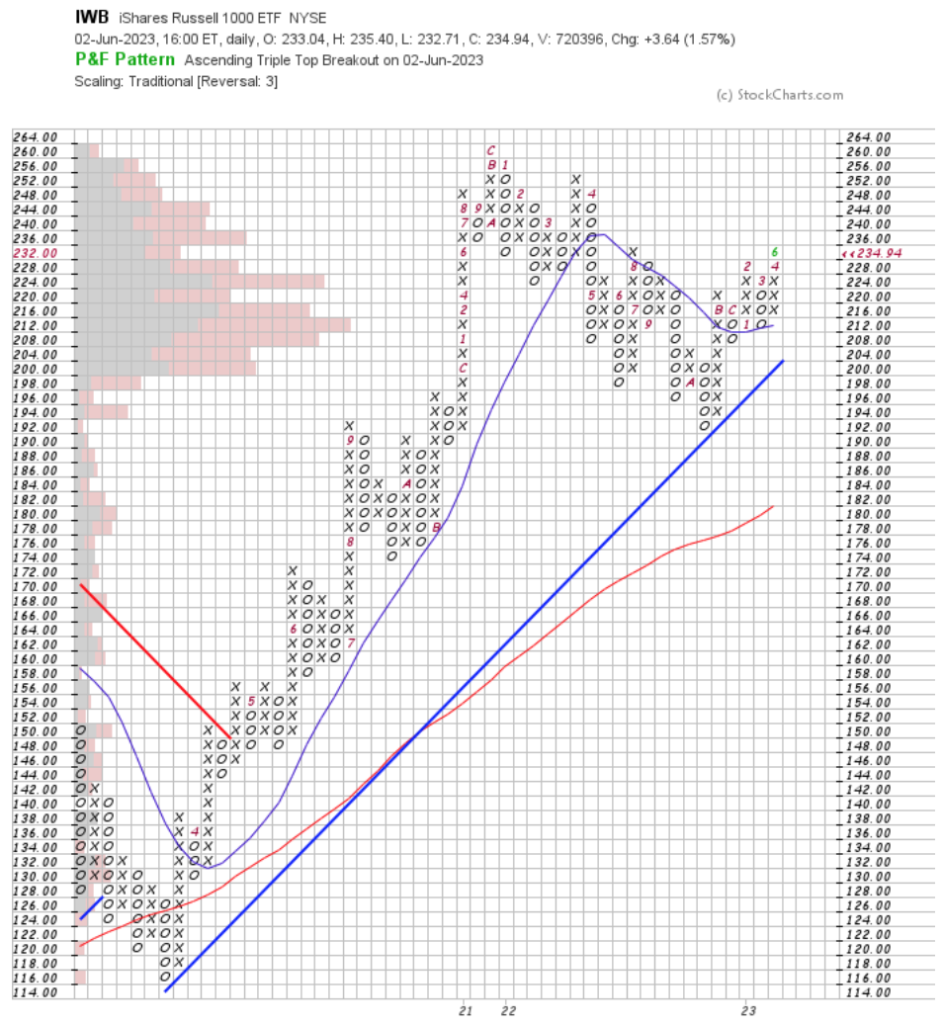
IWB ETF Point & Figure Chart With Volume Overlay
IWB Volume Sentiment At Current Price & Next Support & Resistance Levels
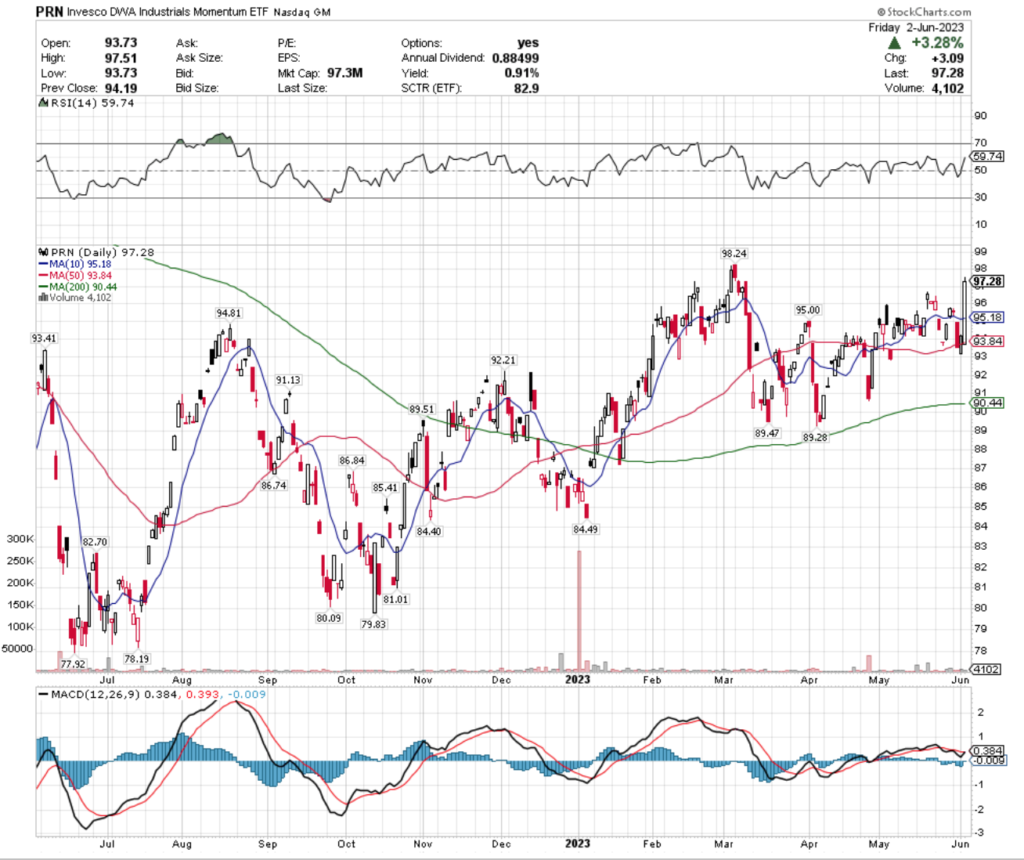
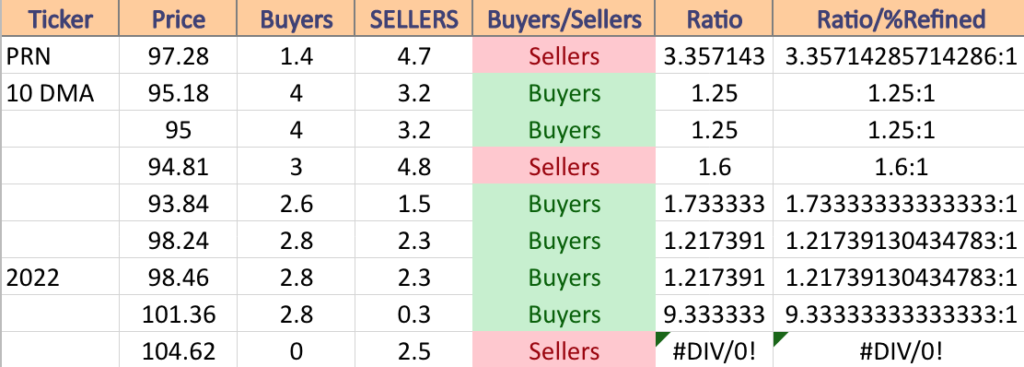
PRN, the Invesco DWA Industrials Momentum ETF has risen +2.52% over the past year, but has gained +19.65% since their 52-week low in June of 2022 (ex-distributions) to close at $97.28/share (Volume Sentiment: Sellers, 3.36:1).
PRN ETF – Invesco DWA Industrials Momentum ETF’s Technical Performance Over The Past Year
Their RSI is on the overbought end of neutral at 59.74, with slightly above average volume this past week.
Their MACD looks primed to cross over bullishly after Friday’s +3.28% session, which has one of the largest candle real body sizes of the year on their chart.
With only a 0.91% distribution yield for long-term holders, those who are not in the name yet may want to see how their 10 & 50 day moving averages hold up as support, as both fall within Friday’s candle’s real body, before watching how their other support levels behave to time an entry.
Existing holders would be wise to purchase some insurance in the form of options to protect their holdings from losses, while generating some additional money for when the market begins trending upwards again.
PRN has support at the $95.18 (10 Day Moving Average; Volume Sentiment: Buyers, 1.25:1), $95 (Volume Sentiment, 1.25:1), $94.81 (Volume Sentiment: Sellers, 1.6:1) & $93.84/share (Volume Sentiment: 1.73:1) price levels, with resistance at the $98.24 (Volume Sentiment: Buyers, 1.22:1), $98.46 (Volume Sentiment: Buyers, 1.22:1), $101.36 (Volume Sentiment, Buyers, 9.33:1) & $104.62/share (Volume Sentiment, Sellers, 0.25:0*) price levels.
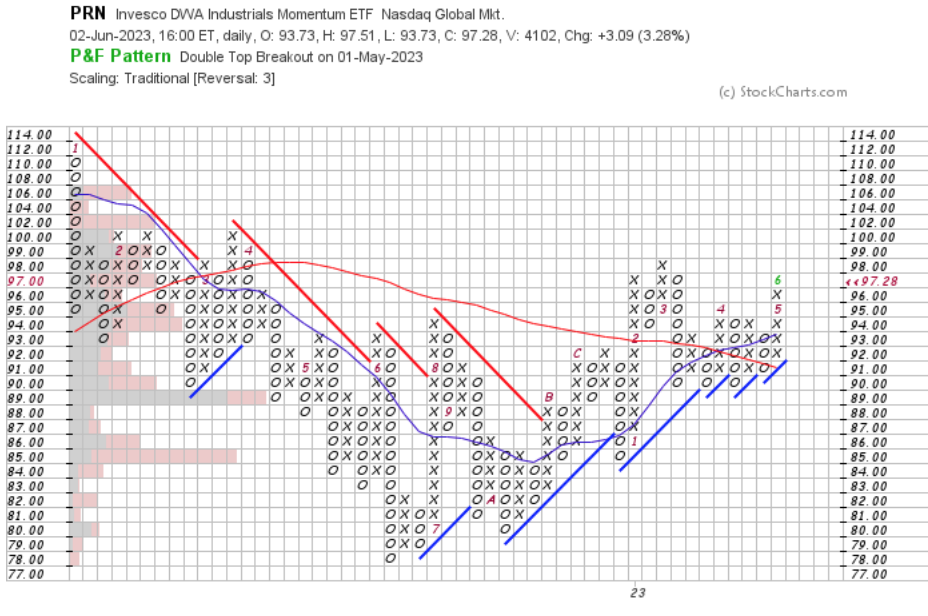
PRN ETF Point & Figure Chart With Volume Overlay
PRN Volume Sentiment At Current Price & Next Support & Resistance Levels
North American Natural Resources (NANR), Pharmaceuticals (XPH), Metals & Mining (XME) & Global Energy (IXC) Are All Bearishly Lagging The Market
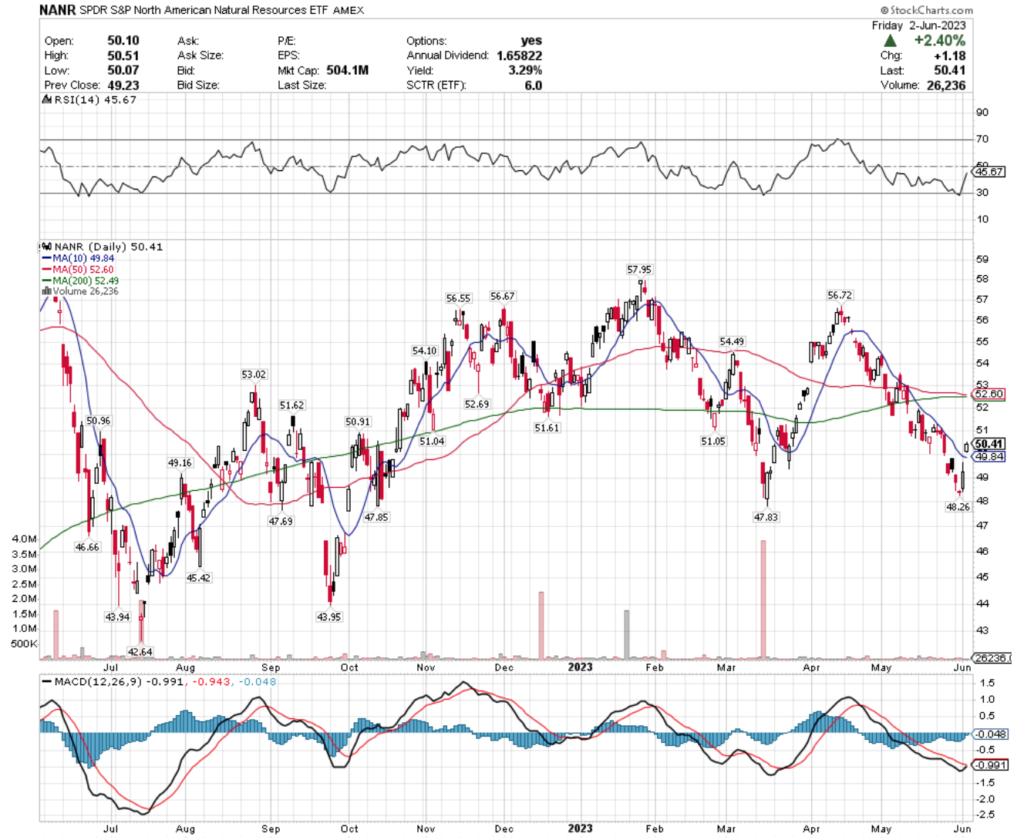
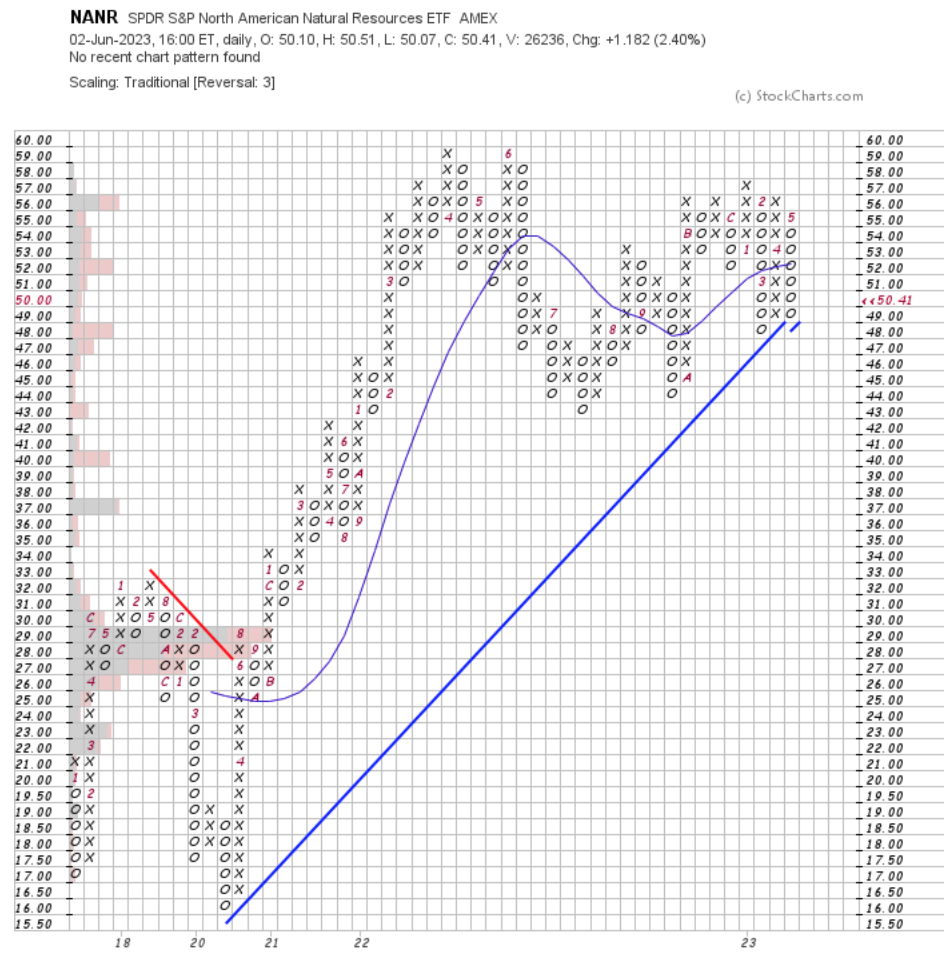
NANR, the SPDR S&P North American Natural Resources ETF has declined -15.08% over the past year, falling -19.21% from their 52-week high in June of 2022, while regaining +11.8% from their 52-week low of July 2022 (ex-distributions) to close at $50.41/share (Volume Sentiment:Buyers, 2:1).
NANR ETF – SPDR S&P North American Natural Resources ETF’s Technical Performance Over The Past Year
Their RSI is approaching the neutral level of 50 (currently at 45.67), after being in oversold conditions following their most recent selloff.
Friday’s gap up created a bullish MACD crossover, but recent trading volumes have been below average, putting Friday’s 2.4% gap up session in question in terms of a signal of strength.
While they offer a 3.29% distribution yield to long-term holders, an insurance position using options would be best advised in the near-term, while waiting to see how their price holds up at support levels.
The 10 day moving average in particular will be of interest, as it is at the beginning of the window created by Friday’s gap & will act as the gatekeeper that determines whether or not they will continue to decline through filling it or not.
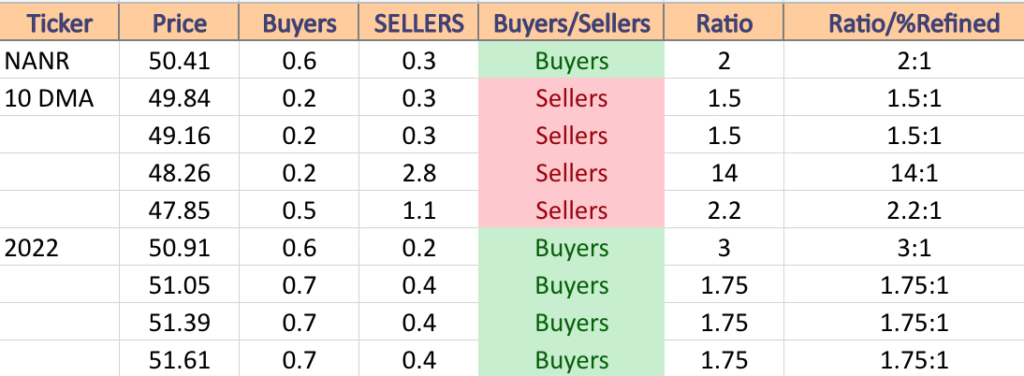
NANR has support at the $49.84 (10 Day Moving Average; Volume Sentiment: Sellers, 1.5:1), $49.16 (Volume Sentiment: Sellers, 1.5:1), $48.26 (Volume Sentiment: Sellers, 14:1) & $47.85/share (Volume Sentiment: Sellers, 2.2:1), with resistance at the $50.91 (Volume Sentiment: Buyers, 3:1), $51.05 (Volume Sentiment: Buyers, 1.75:1), $51.39 (Volume Sentiment: Buyers, 1.75:1) & $51.61/share (Volume Sentiment: Buyers, 1.75:1) price levels.
NANR ETF Point & Figure Chart With Volume Overlay
NANR Volume Sentiment At Current Price & Next Support & Resistance Levels
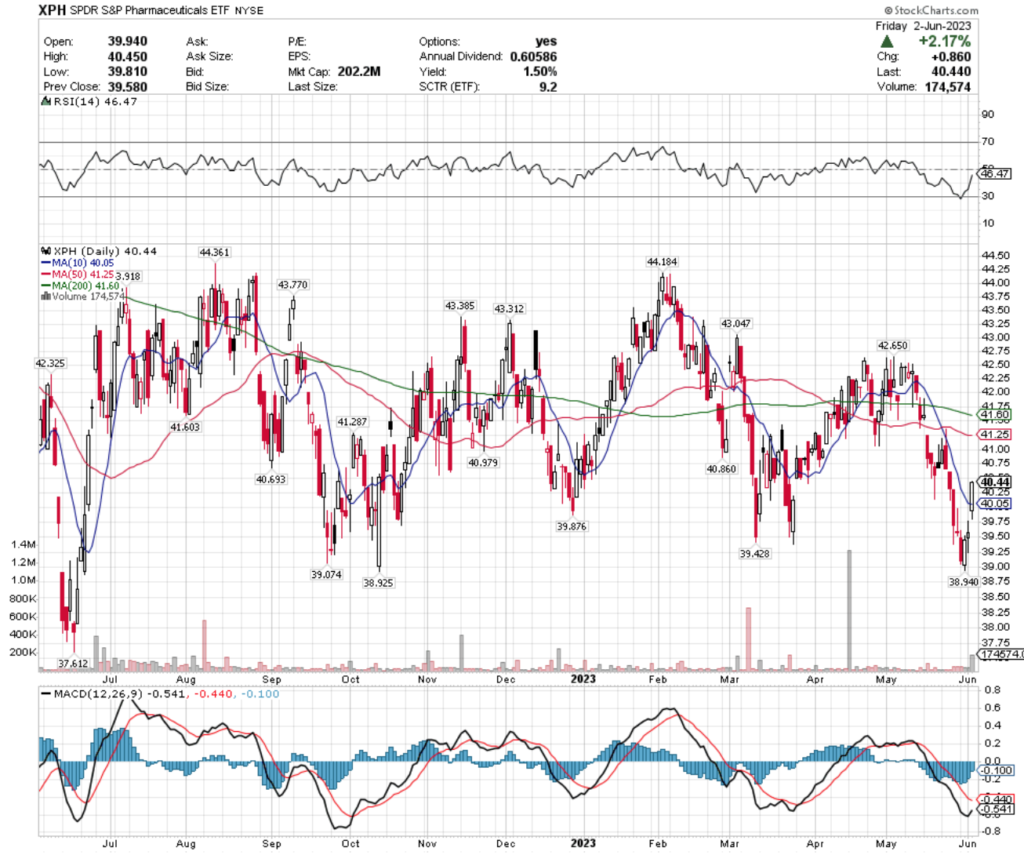
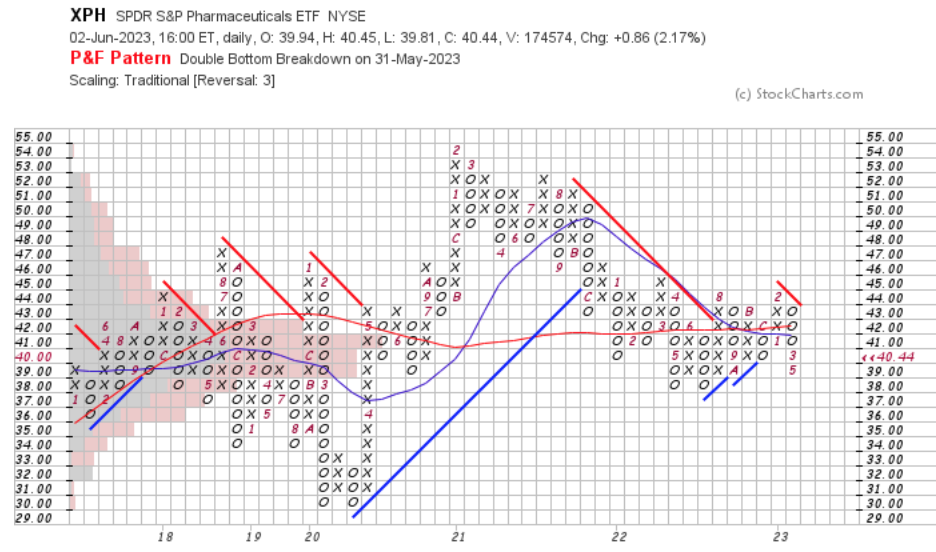
XPH, the SPDR S&P Pharmaceuticals ETF has lost -4.1% over the past year, losing -11.73% from their 52-week high in August of 2022, while recovering +3.67% from their 52-week low in June of 2022 (ex-distributions) to close at $40.44/share (Volume Sentiment: Buyers, 1.19:1).
XPH ETF – SPDR S&P Pharmaceuticals ETF’s Technical Performance Over The Past Year
Their RSI is returning to the neutral level as well (currently at 46.47), after crossing into oversold territory a handful of sessions prior.
Their MACD is sharply bullish, after 3 straight advancing days, including Friday’s +2.17% gap up, with recent trading volumes being slightly above average compared to the year prior.
Thursday’s spinning top candle before Friday’s gap up also adds another layer of uncertainty into how strong the last 3 sessions were vs. how much of it was just broader market influence on an ETF that had recently been oversold on their RSI.
With a 1.5% distribution yield there is a small amount of cushion against losses for long-term holders, making an insurance policy important for the near-term.
With limited support levels between Friday’s window, it would not be prudent to enter a new position now, but watching how they behave at support levels on their descent will help investors figure out where they might want to enter once an upward trend begins.
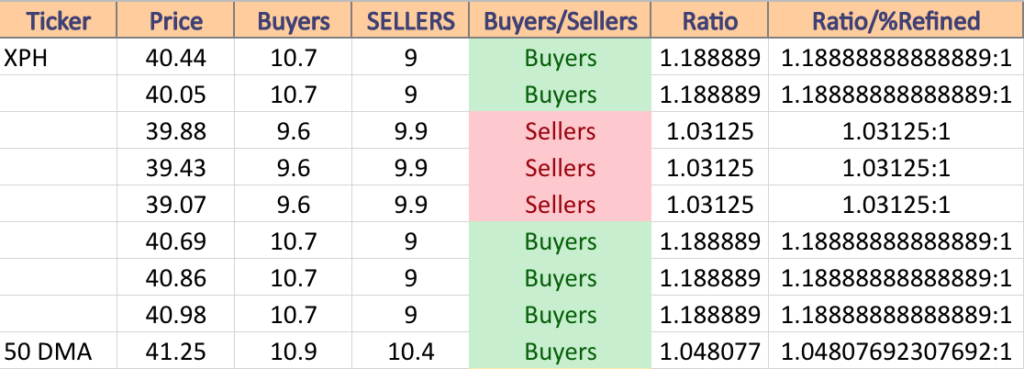
XPH has support at the $40.05 (Volume Sentiment: Buyers 1.19:1), $39.88 (Volume Sentiment: Sellers, 1.03:1), $39.43 (Volume Sentiment: Sellers, 1.03:1) & $39.07/share (Volume Sentiment: Sellers, 1.03:1), with resistance at the $40.69 (Volume Sentiment: Buyers, 1.19:1), $40.86 (Volume Sentiment: Buyers, 1.19:1), $40.98 (Volume Sentiment: Buyers, 1.19:1) & $41.25/share (Volume Sentiment: Buyers, 1.05:1) price levels.
XPH ETF Point & Figure Chart With Volume Overlay
XPH Volume Sentiment At Current Price & Next Support & Resistance Levels
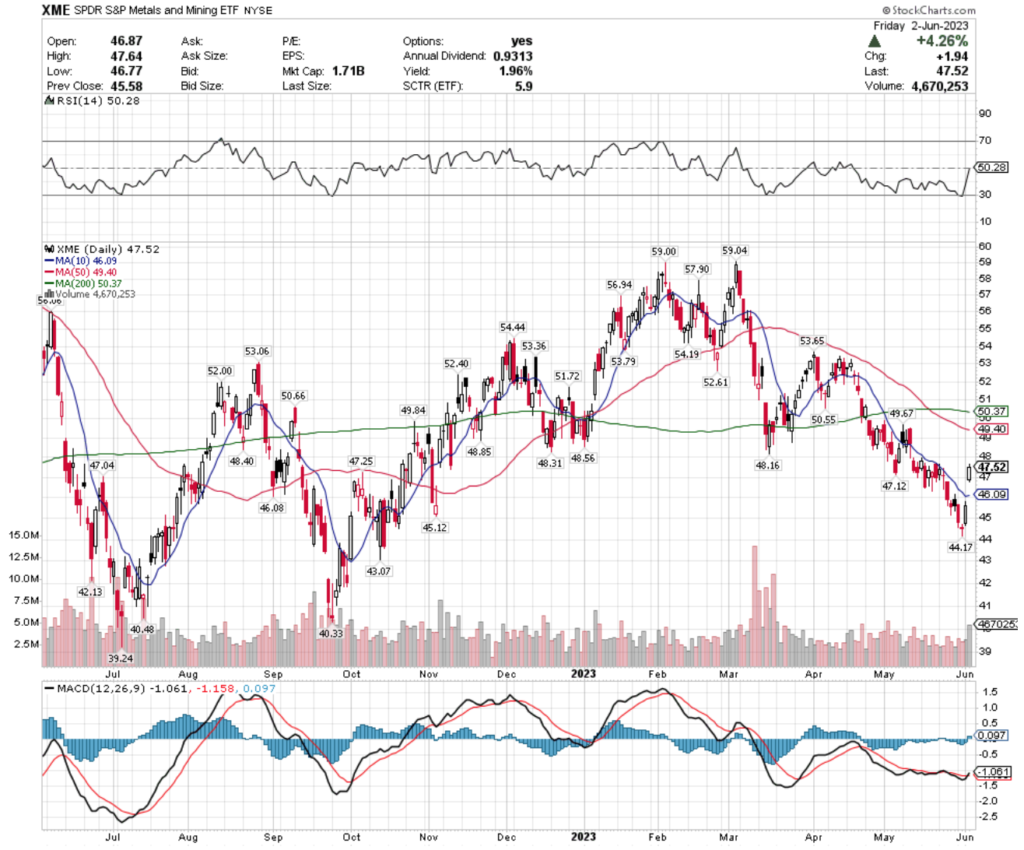
XME, the SPDR S&P Metals & Mining ETF has shed -5.25% over the past year, declining -20.7% from their 52-week high of March 2023, while reclaiming +17.95% from their 52-week low of July of 2022 (ex-distributions) to close at $47.52/share (Volume Sentiment: Even, 1:1).
XME ETF – SPDR S&P Metals & Mining ETF’s Technical Performance Over The Past Year
Their RSI is neutral at 50.28, but this past week’s volume was below average compared to the year prior, bringing questions about how sure investors were behind the +4.26% gap up during Friday’s session.
While their MACD has recently crossed bullish, there does not look to be enough enthusiasm among investors to take a position, until after seeing how they handle Friday’s gap & whether or not it begins to fill in the near-term.
While watching their support levels, there is a profit opportunity for traders looking to employ an options strategy to fundraise for buying more shares after the market begins an uptrend again.
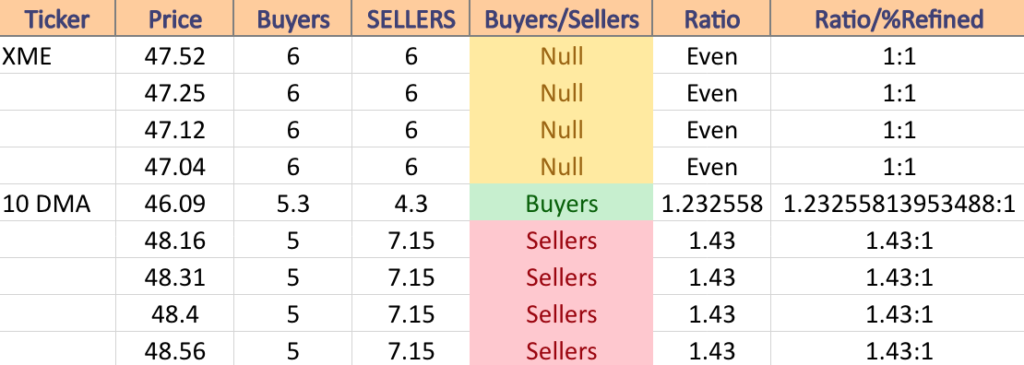
XME has support at the $47.25 (Volume Sentiment: Even, 1:1), $47.12 (Volume Sentiment: Even, 1:1), $47.04 (Volume Sentiment: Even, 1:1) & $46.09/share (10 Day Moving Average; Volume Sentiment: Buyers, 1.23:1), with resistance at the $48.16 (Volume Sentiment: Sellers, 1.43:1), $48.31 (Volume Sentiment: Sellers, 1.43:1), $48.40 (Volume Sentiment: Sellers, 1.43:1) & $48.56/share (Volume Sentiment: Sellers, 1.43:1) price levels.
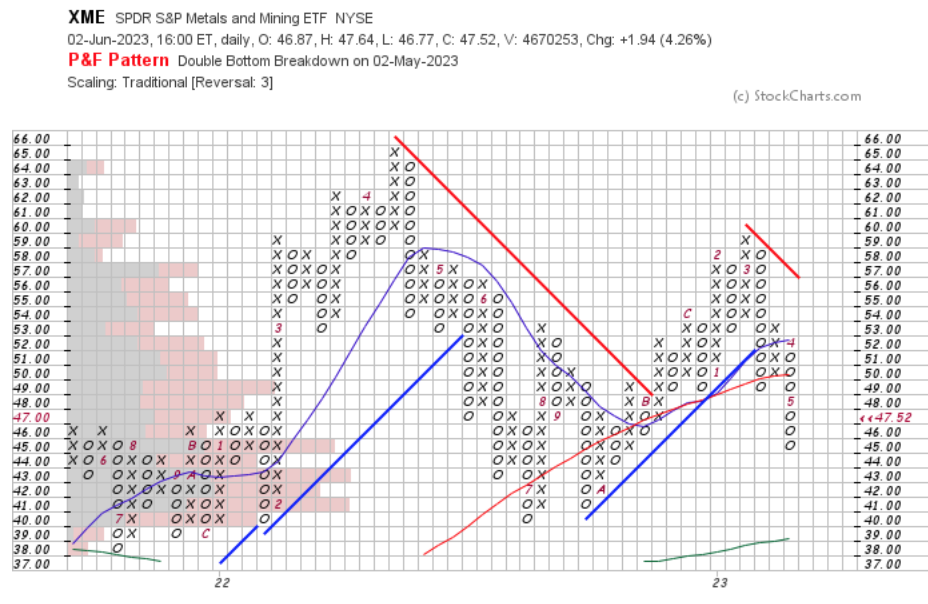
XME ETF Point & Figure Chart With Volume Overlay
XME Volume Sentiment At Current Price & Next Support & Resistance Levels
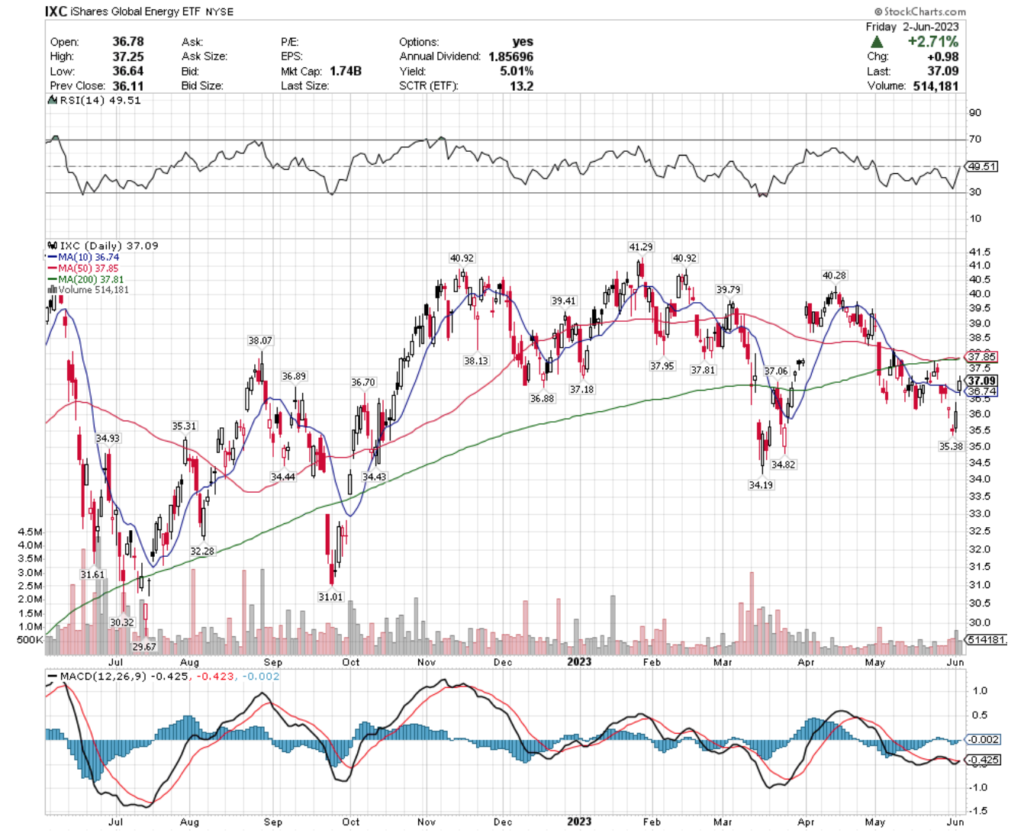
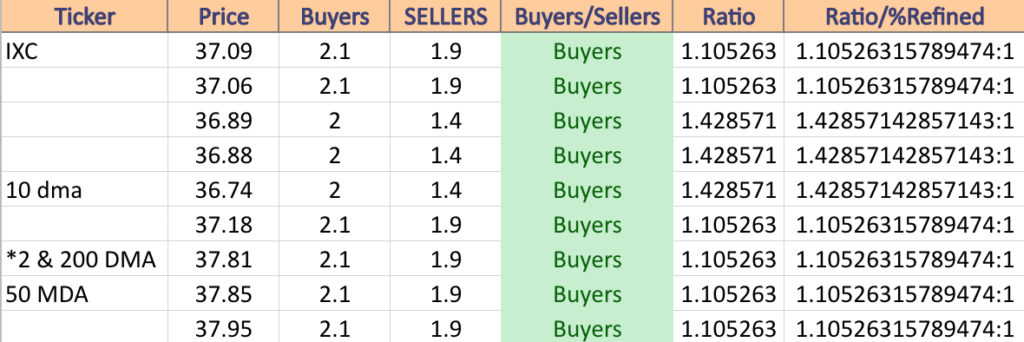
IXC, the iShares Global Energy ETF has lost -7.72% over the past year, losing -15.98% from their 52-week high in June of 2022, but notching +18.28% from their 52-week low in July of 2022 (ex-distributions) to close at $37.09/share (Volume Sentiment: Buyers, 1.11:1).
IXC ETF – iShares Global Energy ETF’s Technical Performance Over The Past Year
Their RSI is approaching the neutral 50 mark (currently at 49.51), with investors showing hesitance at these price levels, as volumes have been below average over the past week.
Their MACD looks set to crossover bullishly, but the 10 day moving average will be the main place to be watching, as that will act as the gatekeeper for the window created by Friday’s gap up.
Like the other names we’ve mentioned, this is another “wait & see” case for those who are not in positions actively & those that do not wish to sell their positions would be best suited with a protective options strategy in the meantime, while waiting for IXC to resume an uptrend.
IXC has support at the $37.06 (Volume Sentiment: Buyers, 1.11:1), $36.89 (Volume Sentiment: Buyers, 1.43:1), $36.88 (Volume Sentiment: 1.43:1) & $36.74/share (10 Day Moving Average; Volume Sentiment: 1.43:1), with resistance at the $37.18 (Volume Sentiment: Buyers, 1.11:1), $37.81 (200 Day Moving Average & Additional Support Touchpoint on Chart; Volume Sentiment: Buyers, 1.11:1), $37.85 (50 Day Moving Average; Volume Sentiment: Buyers, 1.11:1) & $37.95/share (Volume Sentiment: Buyers, 1.11:1) price levels.
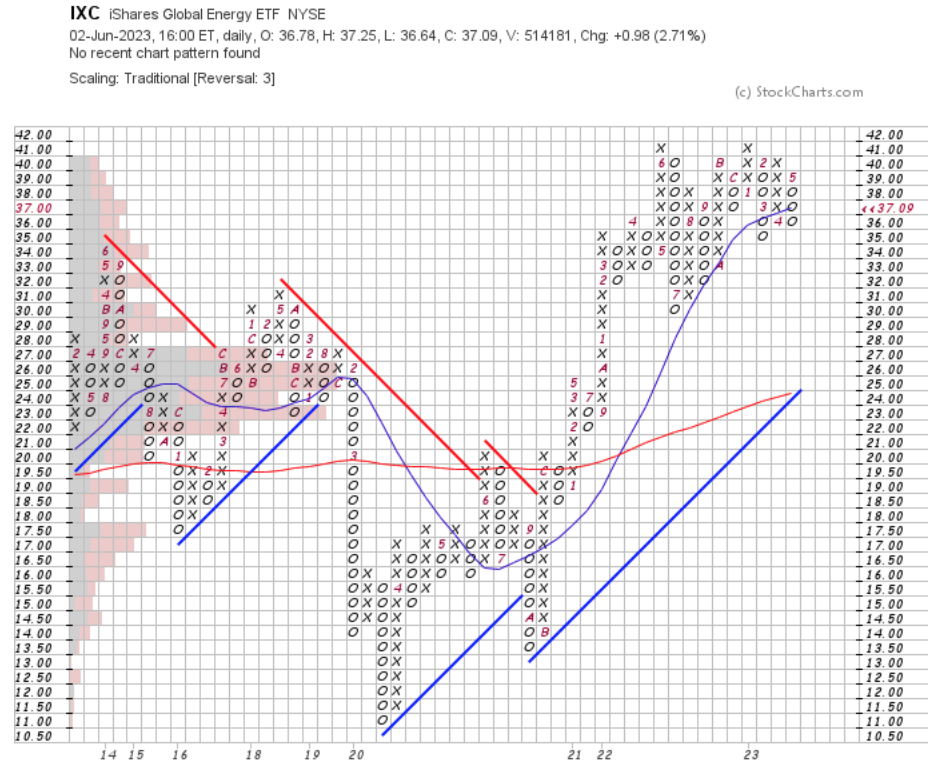
IXC ETF Point & Figure Chart With Volume Overlay
IXC Volume Sentiment At Current Price & Next Support & Resistance Levels
Tying It All Together & The Week Ahead
Next week is relatively quiet on the data front.
Monday kicks off with S&P U.S. Services PMI data at 9:45 am, followed by Factory Orders & ISM Services reports at 10 am.
GitLab & Science Applications will report earnings on Monday.
Tuesday currently has no scheduled data announcements.
Cracker Barrel Old Country Store is set to report earnings on Tuesday, along with Casey’s General, Dave & Buster’s, J.M. Smucker, Stitch Fix, Thor Industries & others.
U.S. Trade Deficit data is reported on Wednesday at 8:30 am, with Consumer Credit at 3pm.
Campbell Soup, Lovesac, Ollie’s Bargain Outlet, United Natural Foods & Verint Systems are some of the more notable earnings reports due out on Wednesday.
Thursday morning we get Initial Jobless Claims data at 8:30 am, with Wholesale Inventories data reported at 10 am.
Friday currently has no data scheduled for reporting & the most anticipated earnings report for the day will be from Nio.
See you back here next week!
*** I DO NOT OWN SHARES OR OPTIONS CONTRACT POSITIONS IN SPY, QQQ, IWM, KORU, GREK, IWB, PRN, NANR, XPH, XME, or IXC AT THE TIME OF PUBLISHING THIS ARTICLE ***
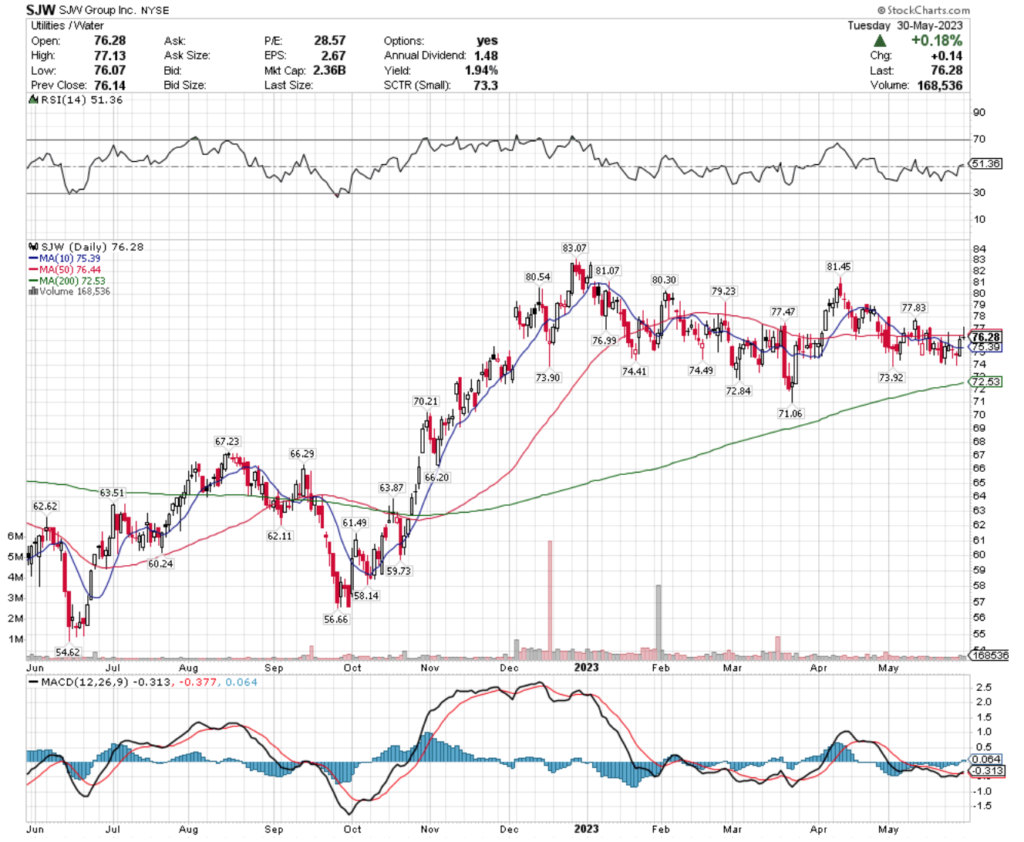
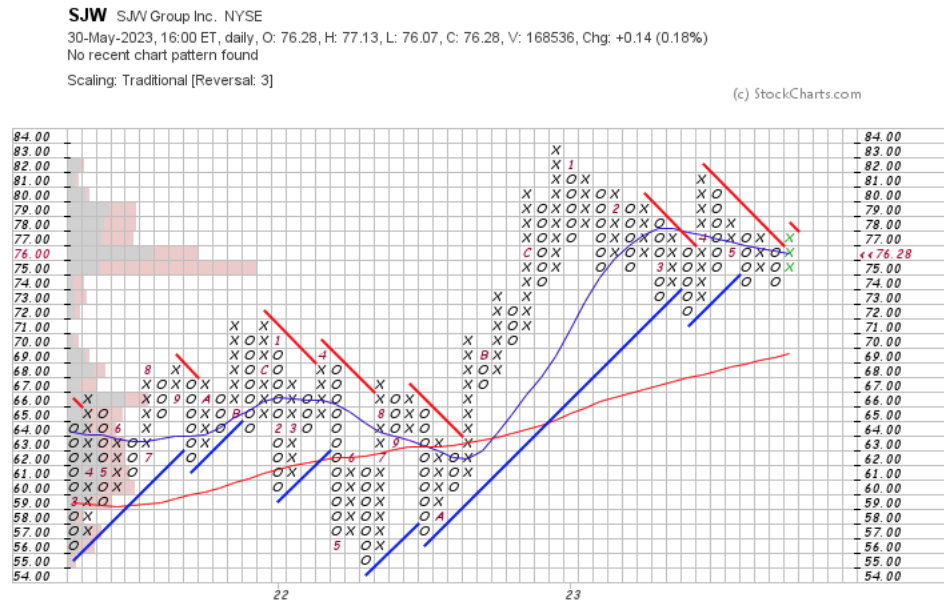
SJW Group Inc. stock trades under the ticker SJW & has shown some recent bullish signals that traders & investors should research further into for when markets become less consolidated.
SJW stock closed at $76.28/share on 5/30/2023.
SJW Group Inc. SJW Stock’s Technical Performance Broken Down
SJW Group Inc. SJW Stock’s Technical Performance Over The Past Year
SJW Stock Price: $76.28
10 Day Moving Average: $75.39
50 Day Moving Average: $76.44
200 Day Moving Average: $72.53
RSI: 51.36
MACD: -0.313, -0.377, 0.064
Yesterday, SJW stock completed a bullish MACD crossover, gaining +0.18% on the day’s session.
Their RSI is neutral at 51.36 & recent trading volumes have been about average compared to the year prior.
However, yesterday’s session resulted in a gravestone doji candle, which signals more bearish sentiment is on the horizon, making it best for investors to wait to see how they behave around support levels in the near-term, while waiting for the market to break out of its recent sideways trend.
SJW stock has support at the $75.39 (10 day moving average, Volume Sentiment: Sellers, 5.19:1) , $74.49 (Volume Sentiment: Sellers, 1.63:1) , $74.41 (Volume Sentiment: Sellers, 1.63:1) & $73.92/share (Volume Sentiment: Sellers, 1.4:1) price levels, with resistance at the $76.44 (50 day moving average, Volume Sentiment: Buyers, 1.81:1) , $76.99 (Volume Sentiment: Buyers, 1.81:1) , $77.47 (Volume Sentiment: Sellers, 1.09:1) & $77.83/share (Volume Sentiment: Sellers, 1.09:1) price levels.
SJW Group Inc. SJW Stock Point & Figure Chart With Volume Level Overlay, 10 & 50 Day Moving Averages & Trend Lines
SJW Group Inc. SJW Stock As A Long-Term Investment
Long-term focused investors will like SJW stock’s valuation metrics, with a 31.2 P/E (ttm) & a 2.11 P/B (mrq).
They recently reported 10.5% Quarterly Revenue Growth Y-o-Y, with 208.5% Quarterly Earnings Growth Y-o-Y.
Their balance sheet will require a more thorough analysis, with $23.33M of Total Cash (mrq) & $1.64B of Total Debt (mrq).
SJW stock pays a 1.92% dividend, which may not be sustainable in the long-run, as their payout ratio is 54.58%.
91.88% of SJW stock is owned by institutional investors.
SJW Group Inc. SJW Stock As A Short-Term Trade Using Options
Traders with shorter time horizons can trade options to profit from SJW stock’s price movements, while protecting their portfolio from broader market volatility.
I am looking at the contracts with the 6/16 expiration date.
The $75 call options are the only strike price that is in-the-money at that expiration date.
The $85 & $80 puts are in-the-money, with the former being more liquid than the latter strike.
Tying It All Together
SJW stock has many interesting characteristics that traders & investors should research further into.
Investors will like their recent growth metrics & dividend, but may want to research how sustainable their yield is, as well as dig deeper into their balance sheet.
Traders will like their recent technical performance, but may be disappointed by how illiquid their options are.
Overall, it is worth taking a closer look into SJW stock to see how it fits into your portfolio strategy for once the markets have begun trending upwards again.
*** I DO NOT OWN SHARES OR OPTIONS CONTRACT POSITIONS IN SJW AT THE TIME OF PUBLISHING THIS ARTICLE ***
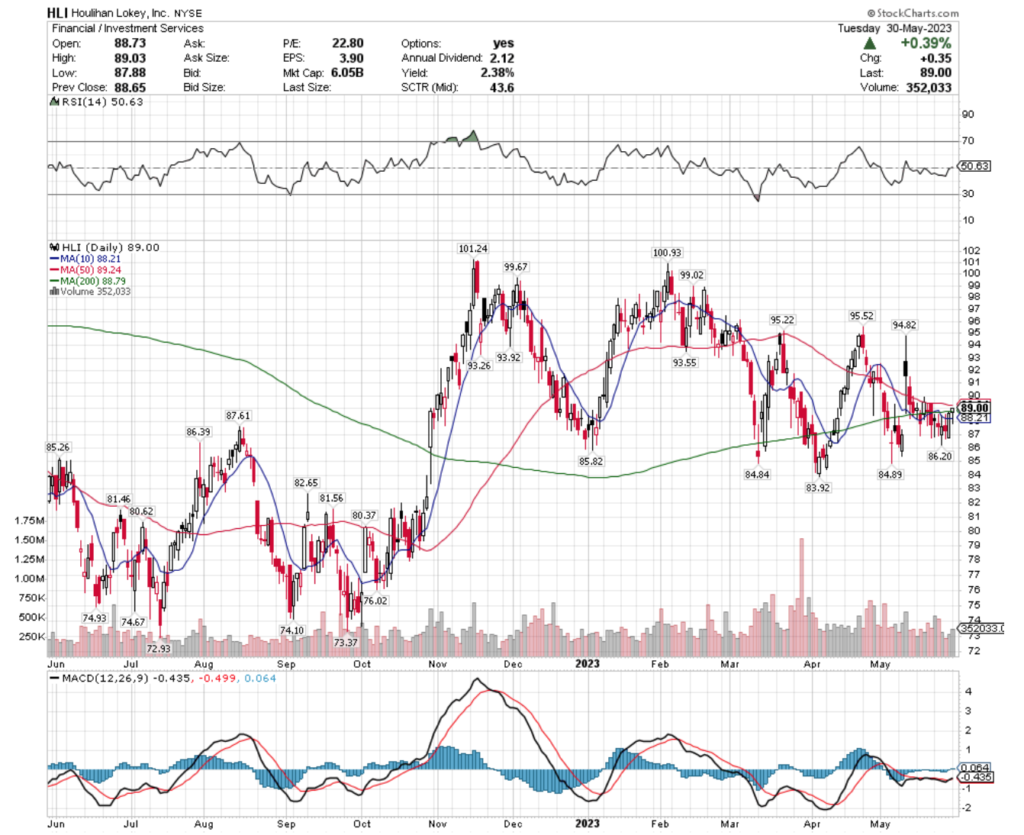
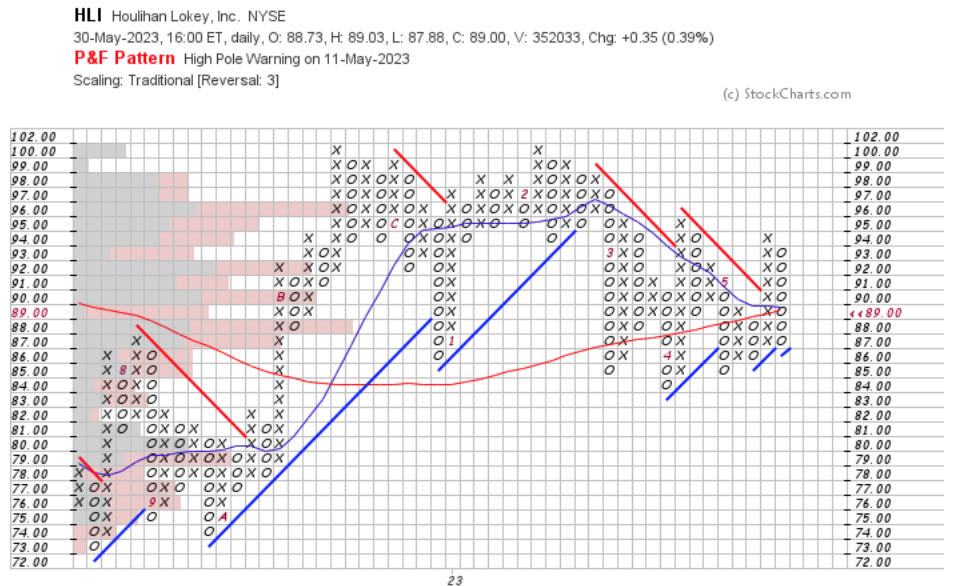
Houlihan Lokey, Inc. stock trades under the ticker HLI & has shown recent bullish signals that traders & investors should research further into, in anticipation of when market conditions become less rangebound.
HLI stock closed at $89.00/share on 5/30/2023.
Houlihan Lokey, Inc. HLI Stock’s Technical Performance Broken Down
Houlihan Lokey, Inc. HLI Stock’s Technical Performance Over The Past Year
HLI Stock Price: $89.00
10 Day Moving Average: $88.21
50 Day Moving Average: $89.24
200 Day Moving Average: $88.79
RSI: 50.63
MACD: -0.435, -0.499, 0.064
Yesterday, HLI stock completed a bullish MACD crossover, gaining +0.39% on the day’s session.
Their RSI is neutral at 50.63 & recent trading volumes have been about average compared to the year prior.
Given how markets have been stuck in a range for the past month, investors would be best suited to watch how they behave around support levels & wait to make a move on HLI until they are in a non-sideways trend again.
HLI stock has support at the $88.21 (10 day moving average; Volume Sentiment: Sellers, 1.33:1), $87.61 (Volume Sentiment: Buyers, 1.14:1), $86.39 (Volume Sentiment: Sellers, 1.68:1) & $86.20/share (Volume Sentiment: 1.68:1) price levels, with resistance at the $89.24 (50 day moving average; Volume Sentiment: Sellers, 10.75:1), $93.26 (Volume Sentiment: Sellers, 2.07:1), $93.55 (Volume Sentiment: Sellers, 2.07:1) & $93.92/share (Volume Sentiment: Sellers, 2.07:1) price level.
Houlihan Lokey, Inc. HLI Stock Point & Figure Chart With Volume Level Overlay, 10 & 50 Day Moving Averages & Trend Lines
Houlihan Lokey, Inc. HLI Stock As A Long-Term Investment
Long-term oriented investors will like HLI stock’s 23.53 P/E (ttm), but may find their 3.95 P/B (mrq) to be a bit too rich.
Before investing, investors may want to look deeper into their recently reported -5.6% Quarterly Revenue Growth Y-o-Y, with -8.5% Quarterly Earnings Growth Y-o-Y.
Their balance sheet looks strong, with $714.44M of Total Cash (mrq) & $374.87M of Total Debt (mrq).
HLI stock pays a 2.39% dividend, but investors should make sure that they are able to cover it in the long-term sustainably, as their payout ratio is 53.27%.
98.47% of HLI stock’s outstanding share float is owned by institutional investors.
Houlihan Lokey, Inc. HLI Stock As A Short-Term Trade Using Options9
Traders with shorter time horizons can trade options to profit from HLI stock’s price movements, while protecting their portfolios from volatility.
I am looking at the contracts with the 6/16 expiration date.
There are currently no in-the-money call options for this expiration date.
The $90, $95 & $100 puts are all in-the-money, listed from highest to lowest level of open interest.
Tying It All Together
HLI stock has many interesting attributes that traders & investors will find appealing.
Investors will like their balance sheet & dividend yield, but may want to look into their recent growth metrics, before investing once markets have broken out of the recent sideways trend.
Traders will like their recent technical performance, but will dislike how illiquid their options are.
All-in-all, it is worth taking a closer look into HLI stock to see how it fits into your portfolio strategy.
*** I DO NOT OWN SHARES OR OPTIONS CONTRACT POSITIONS IN HLI STOCK AT THE TIME OF PUBLISHING THIS ARTICLE ***
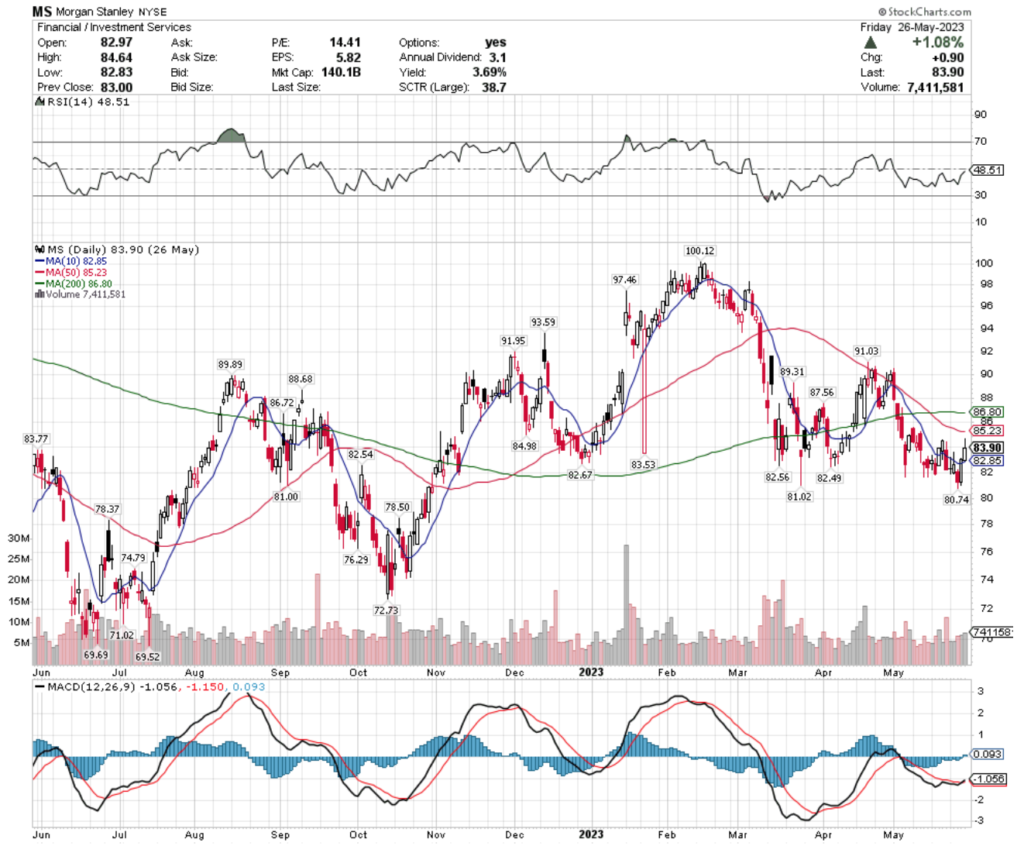
Morgan Stanley stock trades under the ticker MS & has shown recent bullishness that traders & investors should look further into.
MS stock closed at $83.90/share on 5/26/2023.
Morgan Stanley MS Stock’s Technical Performance Broken Down
Morgan Stanley MS Stock’s Technical Performance Over The Past Year
MS Stock Price: $83.90
10 Day Moving Average: $82.85
50 Day Moving Average: $85.23
200 Day Moving Average: $86.80
RSI: 48.51
MACD: -1.056, -1.150, 0.093
On Friday, MS stock completed a bullish MACD crossover, settling +1.08% 0n the day’s session.
Their RSI is about neutral at 48.51 & recent trading volumes have been roughly average compared to the year prior.
Investors now would be wisest to watch how their price behaves around their support levels in the near-term, while planning where they may want to enter into a position once their price is in an uptrend again.
MS stock has support at the $83.77 (Volume Sentiment: Sellers,1.23:1), $83.53 (Volume Sentiment: Sellers,1.23:1), $82.85 (10 day moving average, Volume Sentiment: Sellers, 1.08:1) & $82.67/share (Volume Sentiment: Sellers, 1.08:1) price levels, with resistance at the $84.98 (Volume Sentiment: Sellers, 1.06:1), $85.23 (50 day moving average; Volume Sentiment: Sellers, 1.63:1), $86.72 (Volume Sentiment: Sellers, 1.18:1) & $86.80/share (200 day moving average; Volume Sentiment: Sellers, 1.18:1) price levels.
Morgan Stanley MS Stock As A Long-Term Investment
Investors with long time horizons will like MS stock’s valuation metrics, with a 14.56 P/E (ttm) & a 1.54 P/B (mrq).
They will want to look closer into their recent growth metrics though, with a reported -3.1% Quarterly Revenue Growth Y-o-Y & -18.7% Quarterly Earnings Growth Y-o-Y.
Their balance sheet looks appealing, with $573.24B of Total Cash (mrq) & $363.96B of Total Debt (mrq).
MS stock pays a 3.73% dividend, which appears to be sustainable in the long-run, as their payout ratio is 51.89%.
63.44% of MS stock’s outstanding share float is owned by institutional investors.
Morgan Stanley MS Stock As A Short-Term Trade Using Options
Traders with shorter time horizons can trade options to profit from movements in MS stock’s price, while hedging their portfolios against market volatility.
I am looking at the contracts with the 6/16 expiration date.
The $82.50, $80 & $83 call options are all in-the-money, listed from highest to lowest level of open interest.
The $85, $87.50 & $84 puts are also all in-the-money, with the former being more liquid than the latter strike prices.
Tying It All Together
MS stock has many interesting characteristics that traders & investors will find appealing.
Investors will like their dividend yield, valuation metrics & balance sheet, but will want to look a bit deeper into their recent growth.
Traders will like their recent technical performance, as well as how liquid their options are.
All-in-all, it is worth taking a closer look into how MS stock fits into your portfolio strategy.
*** I DO NOT OWN SHARES OR OPTIONS CONTRACT POSITIONS IN MS STOCK AT THE TIME OF PUBLISHING THIS ARTICLE ***
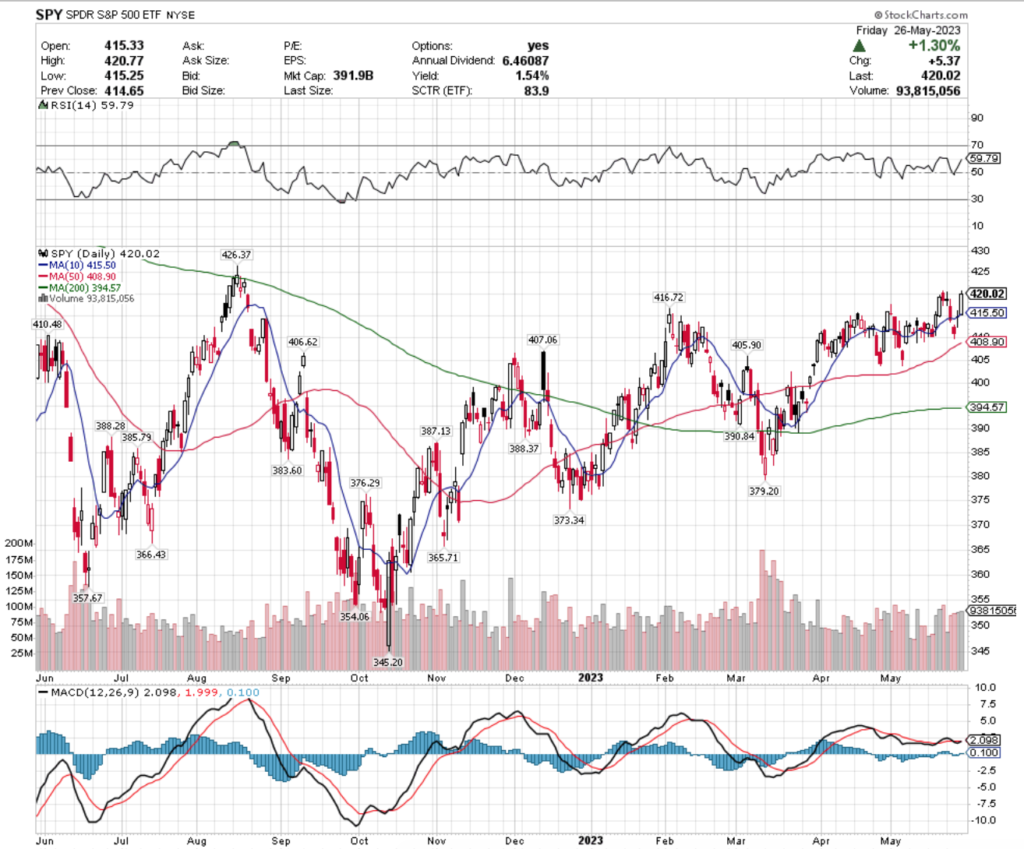
SPY, the SPDR S&P 500 ETF gained +0.33% over the past week, as S&P 500 stocks recovered from their early week losses over Thursday & Friday, led by NVIDIA’s strong earnings.
SPY ETF – SPDR S&P 500 ETF’s Technical Performance Over The Past Year
Their RSI is still on the overbought end of neutral at 59.79, with volumes being about average compared to the year prior.
Their MACD has been in limbo for the last few weeks while they’ve been relatively rangebound, as investors are still unsure about which direction the market is going to head in in the near-term.
SPY has support at the $416.72 (Volume Sentiment: Sellers, 1.33:1), $415.50 (10 day moving average, Volume Sentiment: Buyers 3:1), $410.48 (Volume Sentiment: Sellers, 1.57:1) & $408.90/share (50 day moving average, Volume Sentiment: Sellers, 1.57:1), with resistance at the $426.37 (Volume Sentiment: Sellers, 1.24:1), $438.53 (Volume Sentiment: Sellers, 1.32:1), $442.12 (Volume Sentiment: Sellers, 1.35:1)& $449.09/share (Volume Sentiment: Buyers, 1.89:1) price levels.
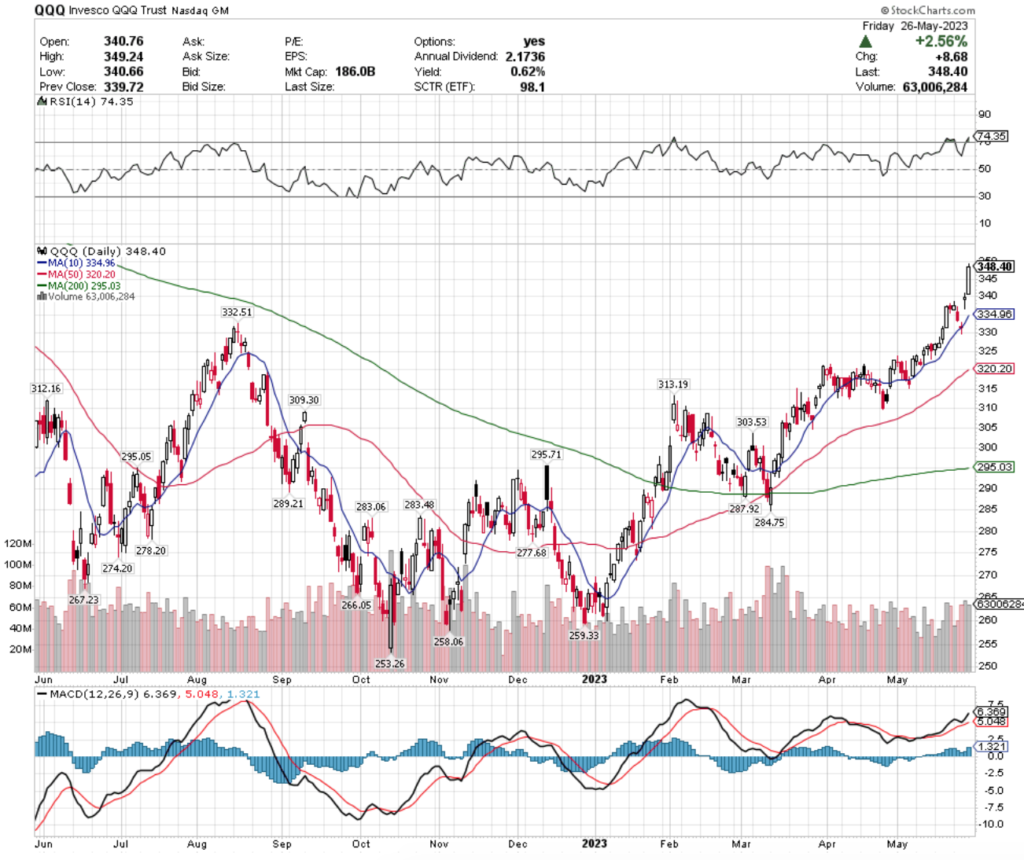
QQQ, the Invesco QQQ Trust ETF gained +3.53% over the past week, as investors favored Technology names after the NVDA earnings news, causing a gap up on Thursday’s session, after gapping done the session prior.
QQQ ETF – Invesco QQQ Trust ETF’s Technical Performance Over The Past Year
Volumes remained relatively average compared to the year prior, with their RSI being in overbought territory at 74.35.
Their MACD is bullish, with their 10 day moving average closing in on the price range that they ended the week prior in to act as support.
QQQ has support at the $334.96 (10 day moving average, Volume Sentiment: Sellers, 3.2:1), $332.51 (Volume Sentiment: Sellers, 3.2:1), $320.20 (Volume Sentiment: Sellers, 2:1) & $313.19/share (Volume Sentiment: Sellers, 3.64:1) price levels, with resistance overhead at the $368.99 (Volume Sentiment: Buyers, 0.75:0*), $375.07 (Volume Sentiment: Sellers, 1:0*), $378.49 (Volume Sentiment: Buyers, 1.33:1) & $401.00/share (Volume Sentiment: NULL, 0:0*)
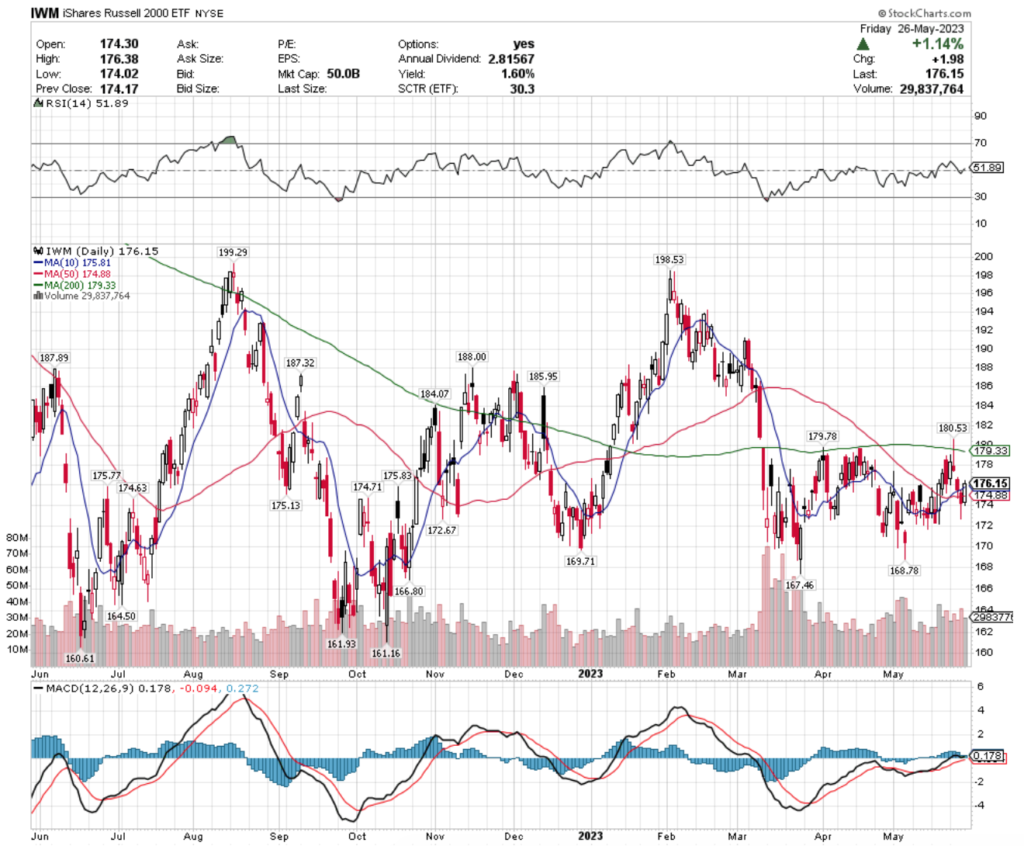
IWM ETF – iShares Russell 2000 ETF’s Technical Performance Over The Past Year
Their RSI is neutral at 51.89, with volumes increasing week-over-week to be above average compared to the year prior.
Their MACD looks set to cross over bearishly in the coming days & their 10 & 50 day moving averages are both within Friday’s session’s candlestick.
IWM has support at the $175.83 (Volume Sentiment: Buyers, 1.45:1), $175.81 (10 day moving average; Volume Sentiment: Buyers, 1.45:1), $175.77 (Volume Sentiment: Buyers, 1.45:1) & $175.13/share (Volume Sentiment: Buyers, 1.45:1) price levels, with resistance at the $179.33 (200 day moving average, Volume Sentiment: Buyers, 1.84:1), $179.78 (Volume Sentiment: Buyers, 1.84:1), $180.53 (Volume Sentiment: Sellers, 1.09:1) & $184.07/share (Volume Sentiment: Buyers, 1.75:1) price levels.
Let’s dive into some of the best & worst performing market sectors, industries & geo-locations in this week’s technical analysis rating review!
NASDAQ Technology Dividend (TDIV), Japanese Hedged Equities (DXJ), Emerging Market Dividend (EDIV) & Autonomous & Electric Vehicles (DRIV) Are All Bullishly Leading The Market
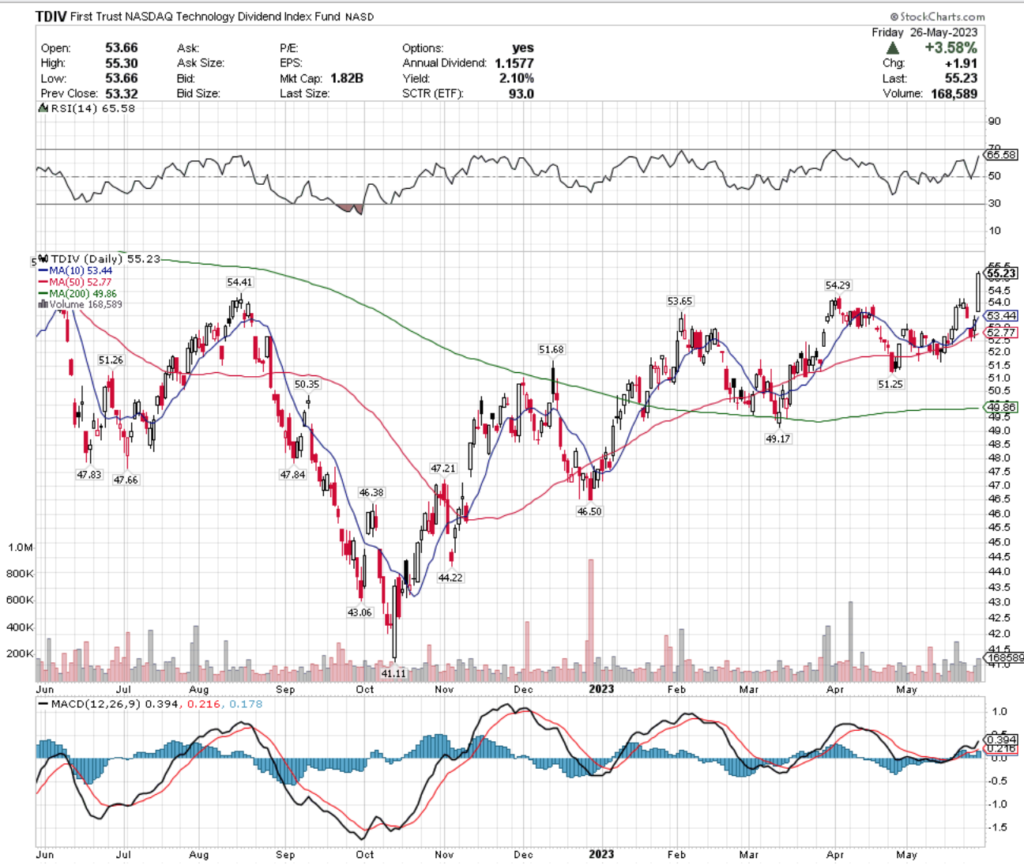
TDIV ETF – First Trust NASDAQ Technology Dividend Fund’s Technical Performance Over The Past Year
Their RSI is approaching overbought territory at 65.58, on about average volume compared to the year prior.
Their MACD is bullishly climbing, with Friday’s gap up adding strength to its bullish curve.
Given market volatility & that they’re approaching their 52-week high level, investors would be smart to watch how they behave around their resistance & support levels, while eyeing where to enter a position once volatility has cooled down.
In the meantime, a protective options strategy would be beneficial, as their 2.10% distribution yield for long-term holders does not protect against much in the event of price consolidation.
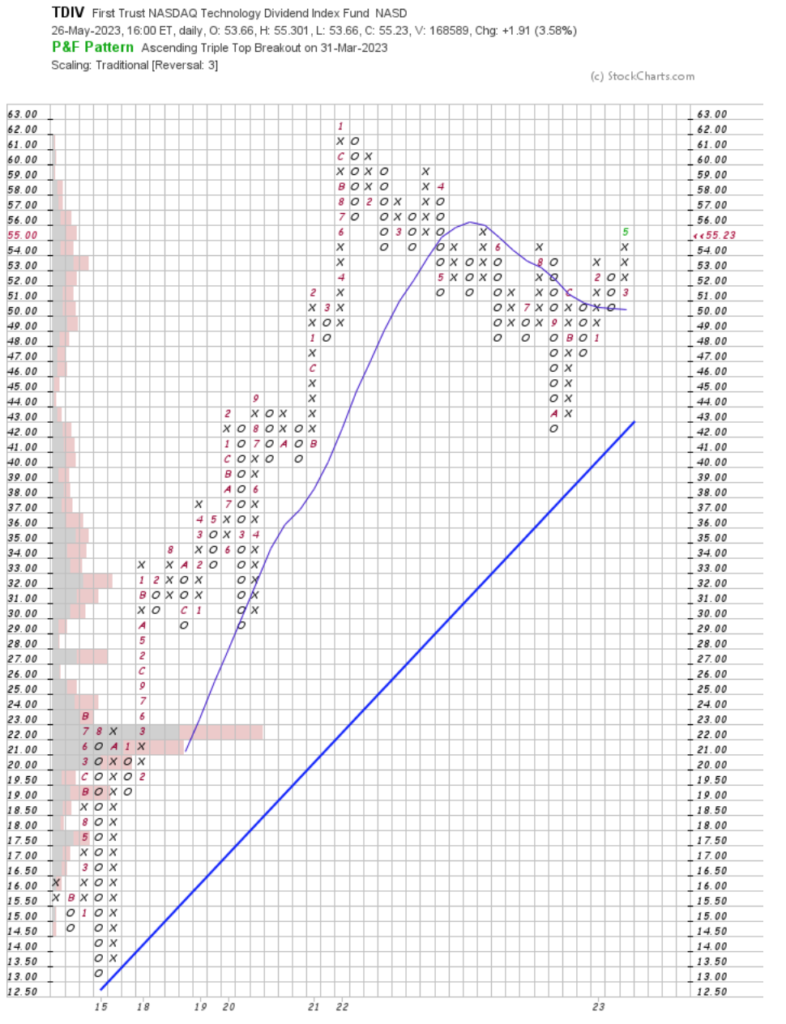
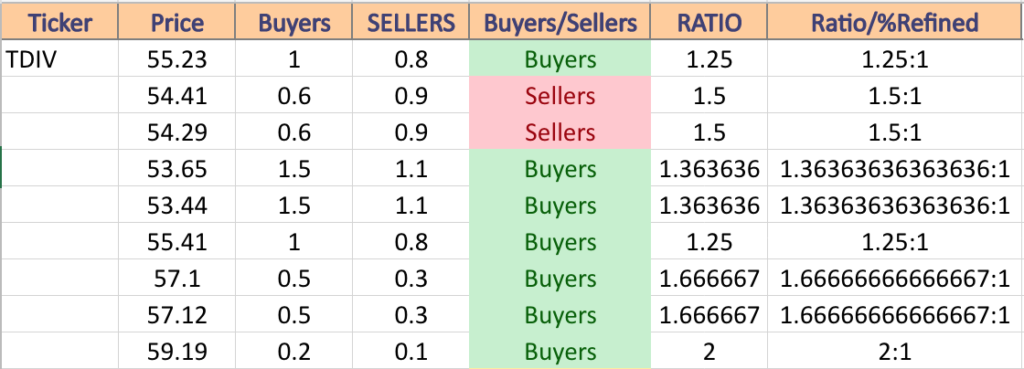
TDIV has support at the $54.41 (Volume Sentiment: Sellers, 1.5:1), $54.29 (Volume Sentiment: Sellers, 1.5:1), $53.65 (Volume Sentiment: Buyers, 1.36:1) & $53.44/share (10 day moving average; Volume Sentiment: Buyers, 1.36:1) price levels, with resistance at the $55.41 (Volume Sentiment: Buyers, 1.25:1), $57.10 (Volume Sentiment: Buyers, 1.67:1), $57.12 (Volume Sentiment: Buyers, 1.67:1) & $59.19/share (Volume Sentiment: Buyers, 2:1) price levels.
TDIV Point & Figure Chart With Volume Overlay
TDIV Volume Sentiment At Current Price & Next Support & Resistance Levels
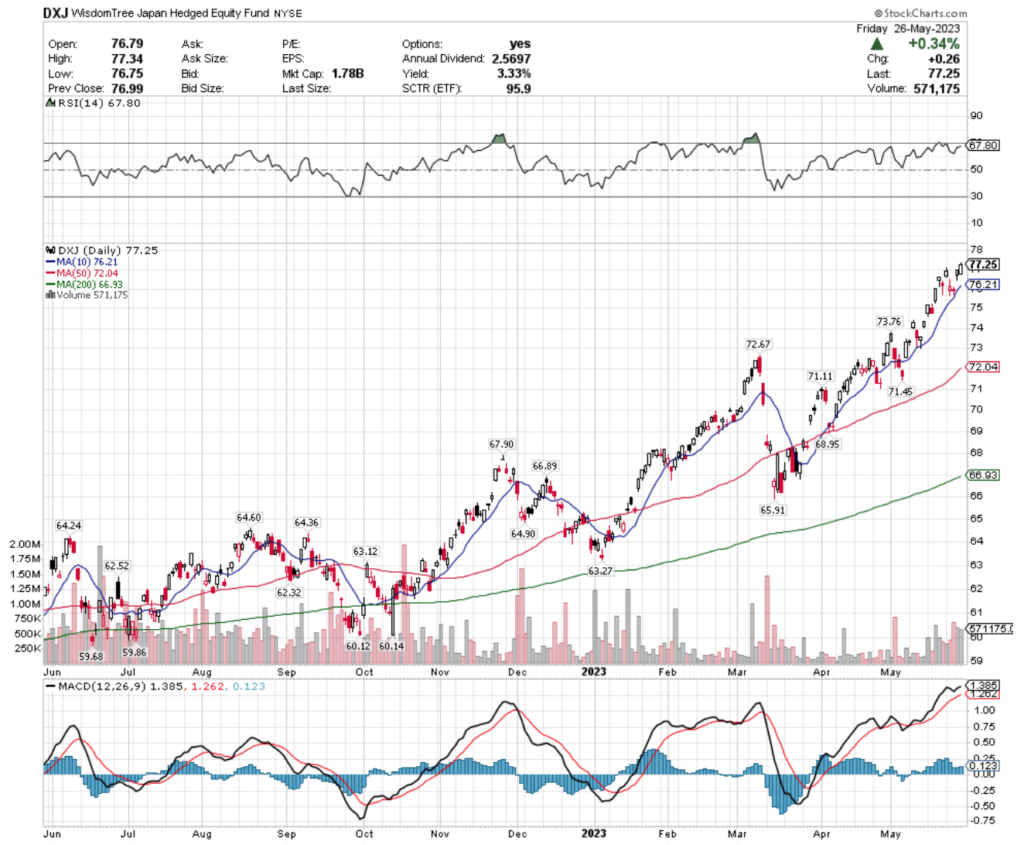
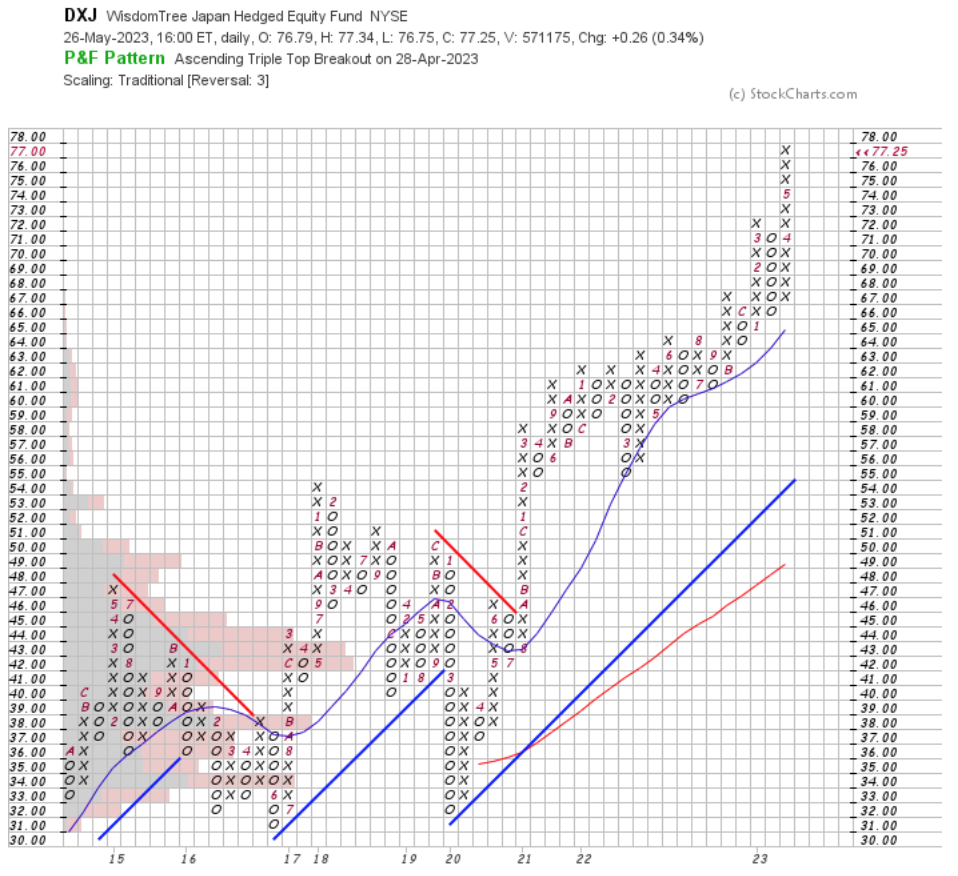
DXJ ETF – WisdomTree Japan Hedged Equity Fund’s Technical Performance Over The Past Year
They have been on a relatively steady ascent since March 2023, with exception to one week in April.
DXJ’s RSI is approaching overbought at 67.8, but recent volumes have been roughly average compared to the year prior, signaling investors have confidence.
Their MACD is beginning to curl down bearishly, after Tuesday & Wednesday’s sessions produced losses for the ETF.
DXJ is at the highest price level in its history, making caution imperative to investors.
With a 3.33% distribution yield for long-term holders there is some protection against losses, but an options strategy such as selling calls or buying puts would be advisable while waiting to see how they behave at their support levels upon consolidation.
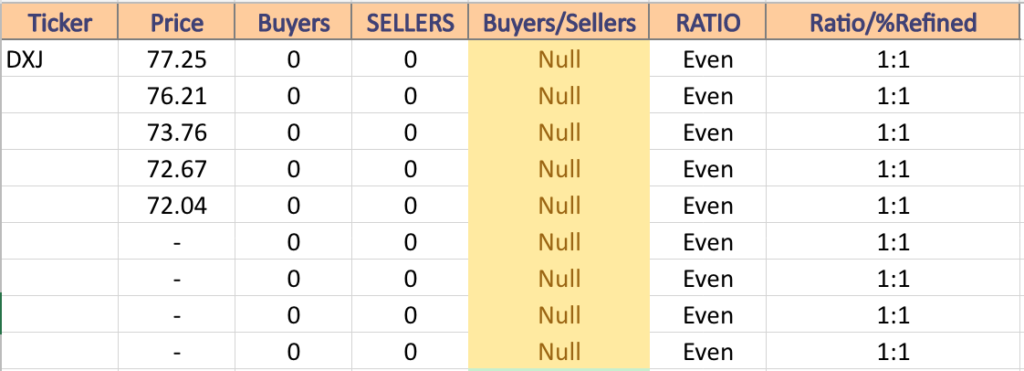
DXJ has support at the $76.21 (10 day moving average), $73.76, $72.67, $72.04/share (50 day moving average) price levels, with no overhead resistance, as they are at their all time high price level.
As the charts below show, there is very limited volume data at these levels.
DXJ Point & Figure Chart With Volume Overlay
DXJ Volume Sentiment At Current Price & Next Support & Resistance Levels
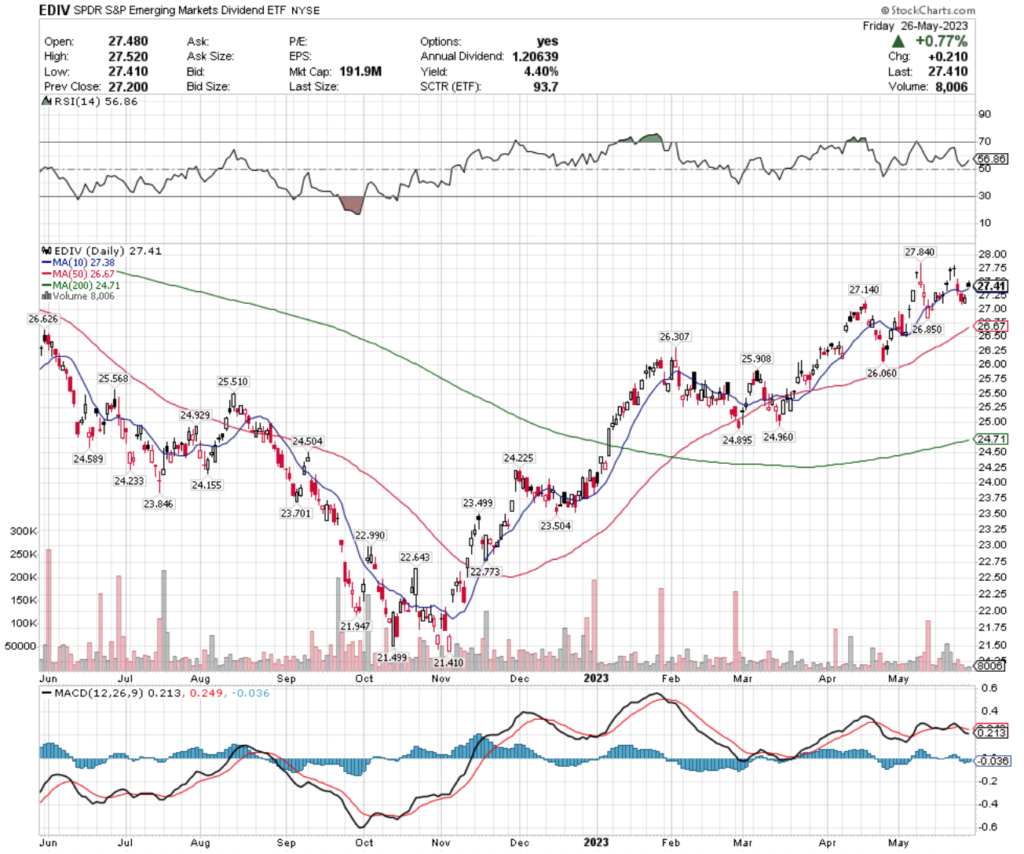
EDIV ETF – SPDR S&P Emerging Markets Dividend ETF’s Technical Performance Over The Past Year
Their RSI is on the overbought end of neutral at 56.86, but volumes sunk towards the end of the week into below average levels compared to the year prior, signaling uncertainty & caution among investors.
Their MACD is currently bearish, as a result of Tuesday’s gap down & Wednesday’s losing session.
EDIV offers a 4.4% distribution yield for long-term holders, but given the uncertainty in their volume & Friday’s gap up whose candlestick closed lower than it opened, there is a need to have insurance protection in the near-term, while watching their behavior around support levels.
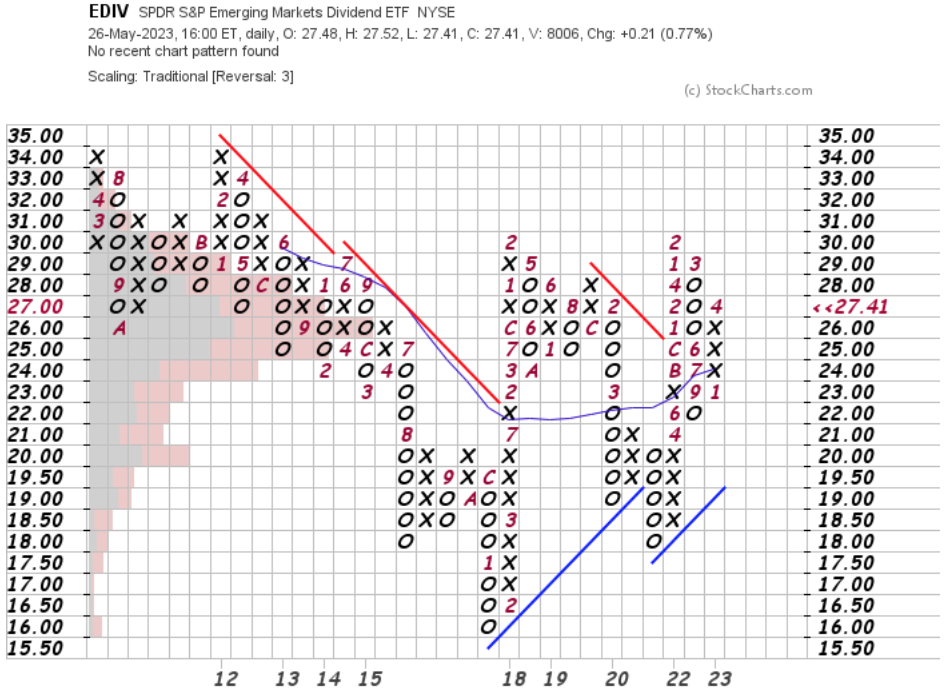
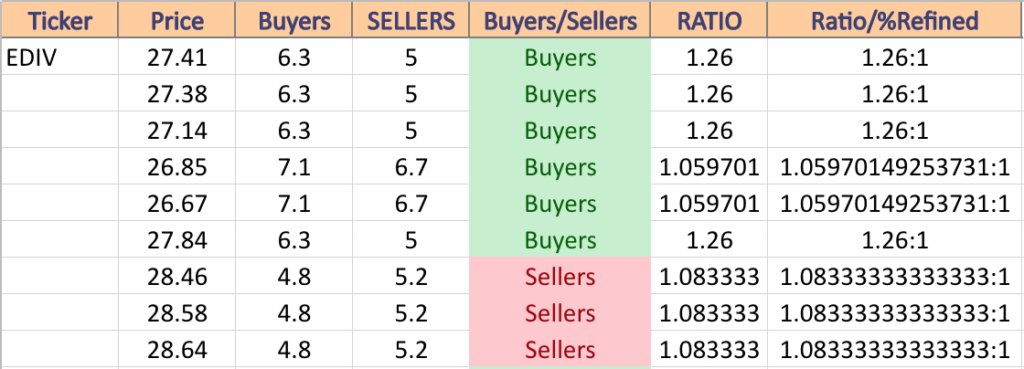
EDIV has support at the $27.38 (Volume Sentiment: Buyers, 1.26:1), $27.14 (Volume Sentiment: Buyers, 1.26:1), $26.85 (Volume Sentiment: 1.06:1) & $26.67/share (50 day moving average; Volume Sentiment: 1.06:1) price levels, with resistance at the $27.84 (Volume Sentiment: Buyers, 1.26:1), $28.46 (Volume Sentiment: Sellers, 1.08:1), $28.58 (Volume Sentiment: Sellers, 1.08:1) & $28.64/share (Volume Sentiment: Sellers, 1.08:1) price levels.
EDIV Point & Figure Chart With Volume Overlay
EDIV Volume Sentiment At Current Price & Next Support & Resistance Levels
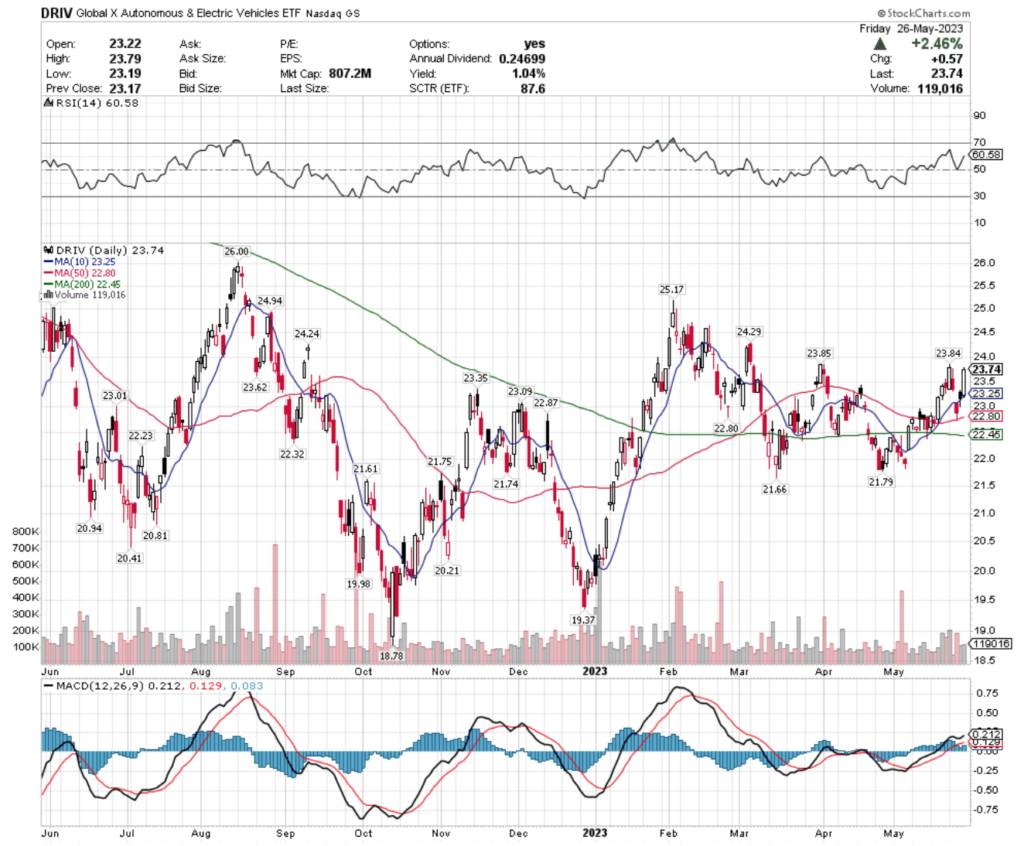
DRIV ETF – Global X Autonomous & Electric Vehicles ETF’s Technical Performance Over The Past Year
Their RSI is approaching oversold territory as it climbed over 60 in Friday’s session, with volumes coming in at about average level.
Their MACD is still bullish due in part to Friday’s +2.46% session, as they look to retest the $23.74/share price level.
With a modest 1.04% distribution yield for long-term holders, there is not much cushion against losses, making an insurance policy essential while waiting to see how they fare in the near-term.
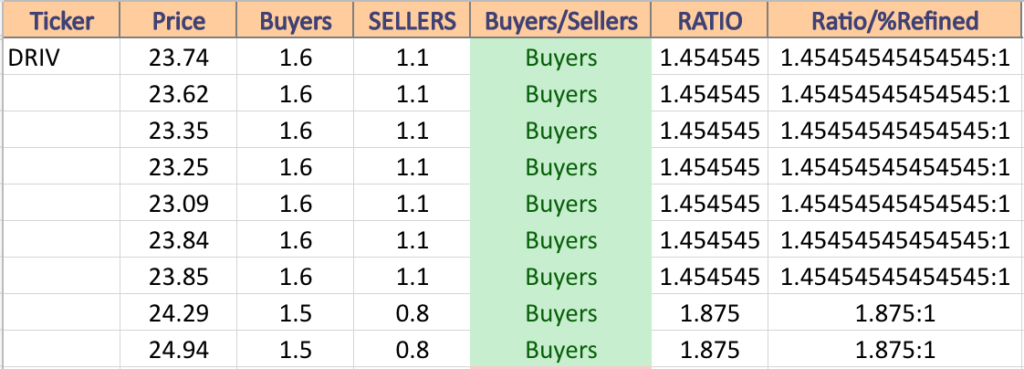
DRIV has support at the $23.62 (Volume Sentiment: Buyers, 1.45:1), $23.35 (Volume Sentiment: Buyers, 1.45:1), $23.25 (10 day moving average; Volume Sentiment: Buyers, 1.45:1), $23.09/share (Volume Sentiment: Buyers, 1.45:1) price levels, with resistance at the $23.84 (Volume Sentiment: Buyers, 1.45:1), $23.85 (Volume Sentiment: Buyers, 1.45:1), $24.29 (Volume Sentiment: Buyers, 1.87:1) & $24.94/share (Volume Sentiment: Buyers, 1.87:1) price levels.
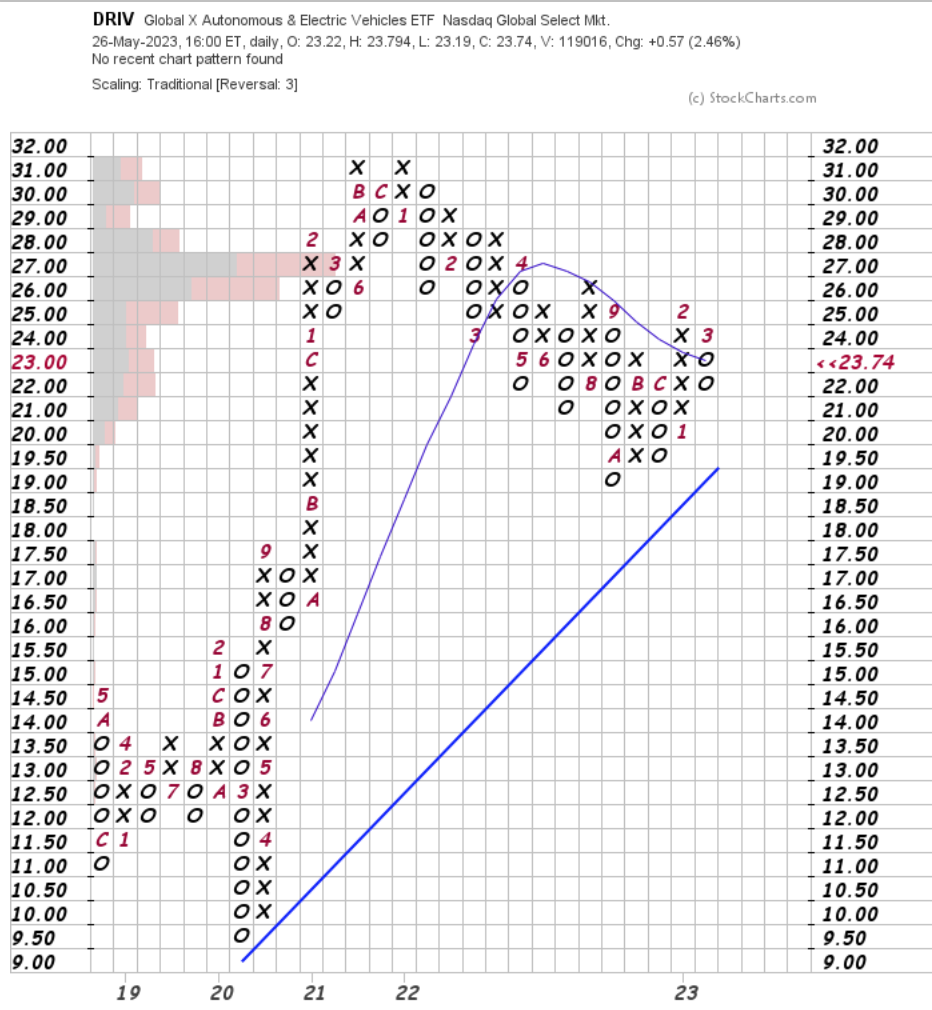
DRIV Point & Figure Chart With Volume Overlay
DRIV Volume Sentiment At Current Price & Next Support & Resistance Levels
South Africa (EZA), Base Metals (DBB), China (GXC) & Retail (XRT) Are All Bearishly Lagging The Market
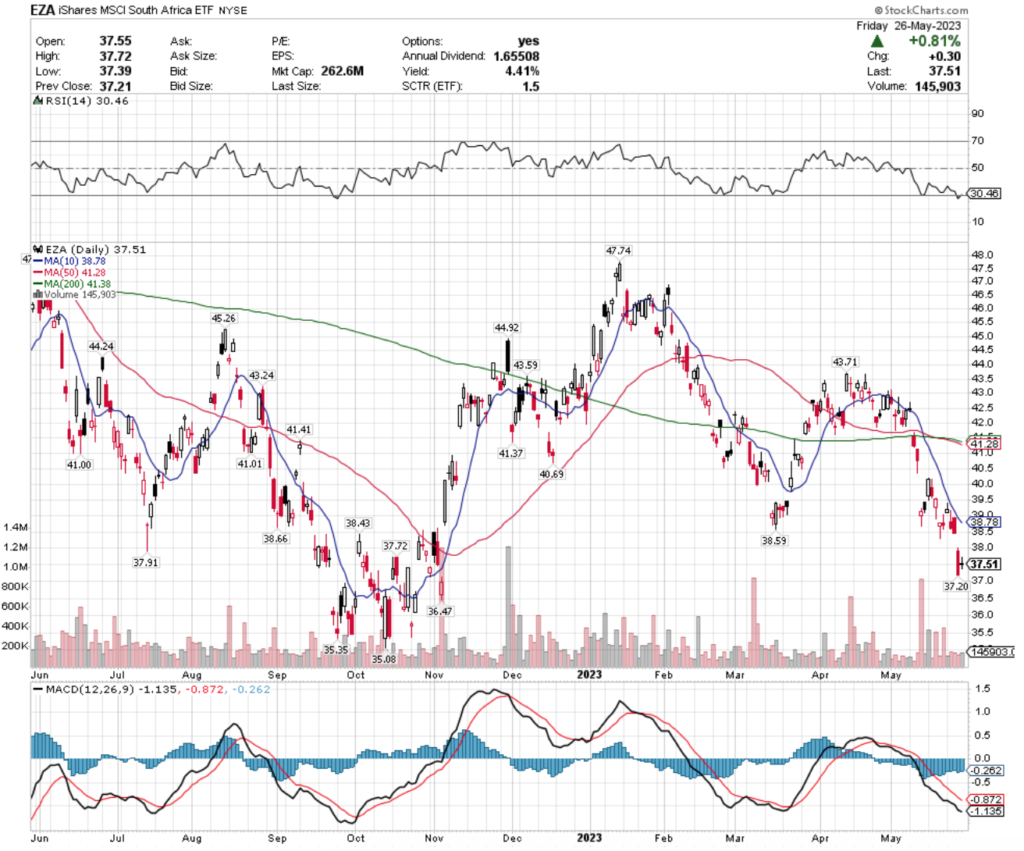
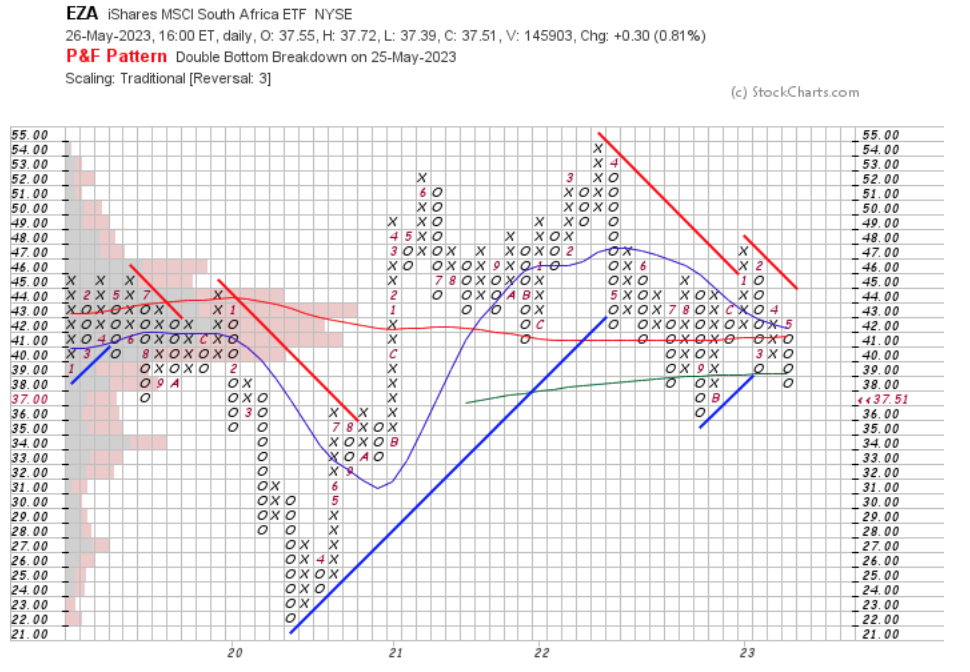
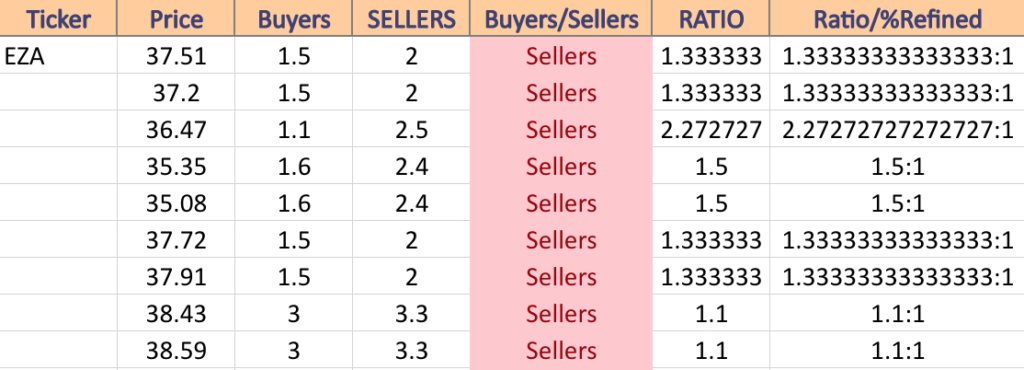
EZA, the iShares MSCI South Africa ETF has lost -18.74% over the past year, falling -23.76% since their 52-week high in May of 2022 & has recovered +5.28% since their 52-week low in October of 2022 (ex-distributions).
EZA ETF – iShares MSCI South Africa ETF’s Technical Performance Over The Past Year
Their RSI just exited official oversold territory & currently sites at 30.46, but very timid below average volume last week is signaling that there is still uncertainty among investors regarding their near-term performance prospects, which is confirmed by Friday’s doji candlestick.
Their MACD is still in a bearish downtrend, which became steeper after Thursday’s gap down session, where they’ll try to hold $37.20/share at support.
Despite a 4.41% cushion for long-term holders in the form of a distribution yield, a wait & see approach appears best while watching how EZA behaves at its support levels in the coming weeks, unless you are holding an insurance position with options as a hedge.
EZA has support at the $37.20 (Volume Sentiment: Sellers, 1.33:1), $36.47 (Volume Sentiment: 2.72:1), $35.35 (Volume Sentiment: 1.5:1) & $35.08/share (Volume Sentiment: 1.5:1) price levels, with resistance at the $37.72 (Volume Sentiment: Sellers, 1.33:1), $37.91 (Volume Sentiment: Sellers, 1.33:1), $38.43 (Volume Sentiment: Sellers 1.1:1) & $38.59/share (Volume Sentiment: Sellers 1.1:1) price levels.
EZA Point & Figure Chart With Volume Overlay
EZA Volume Sentiment At Current Price & Next Support & Resistance Levels
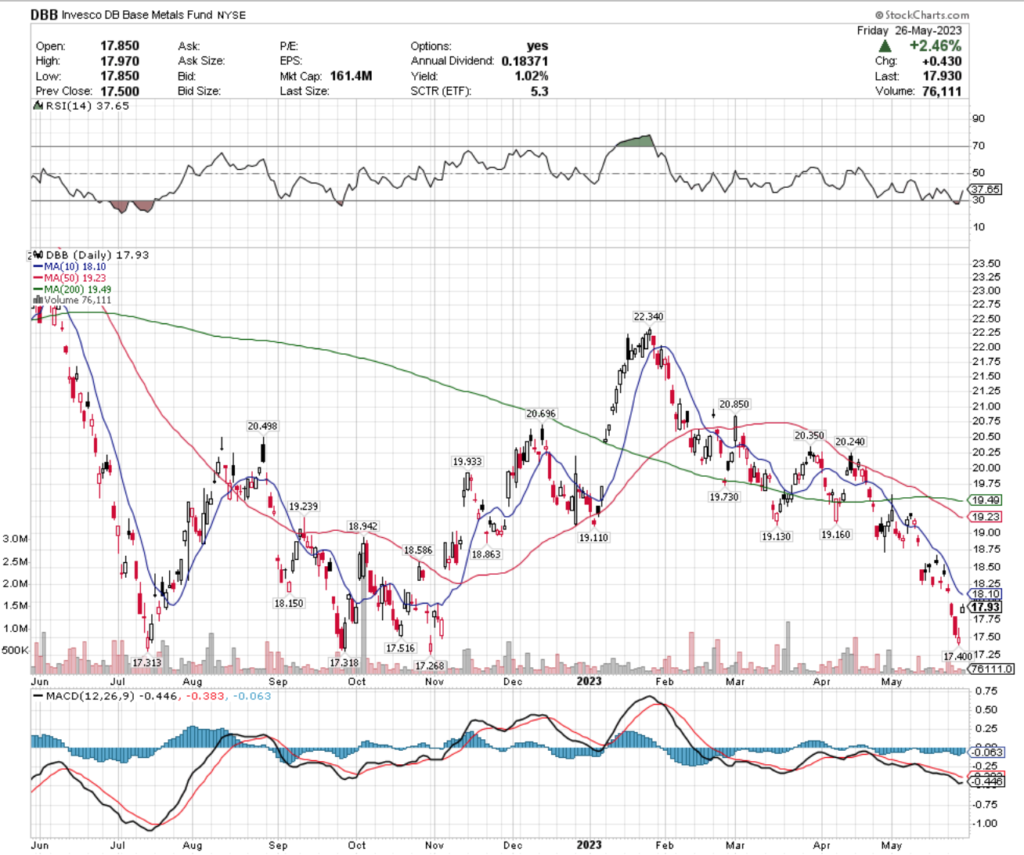
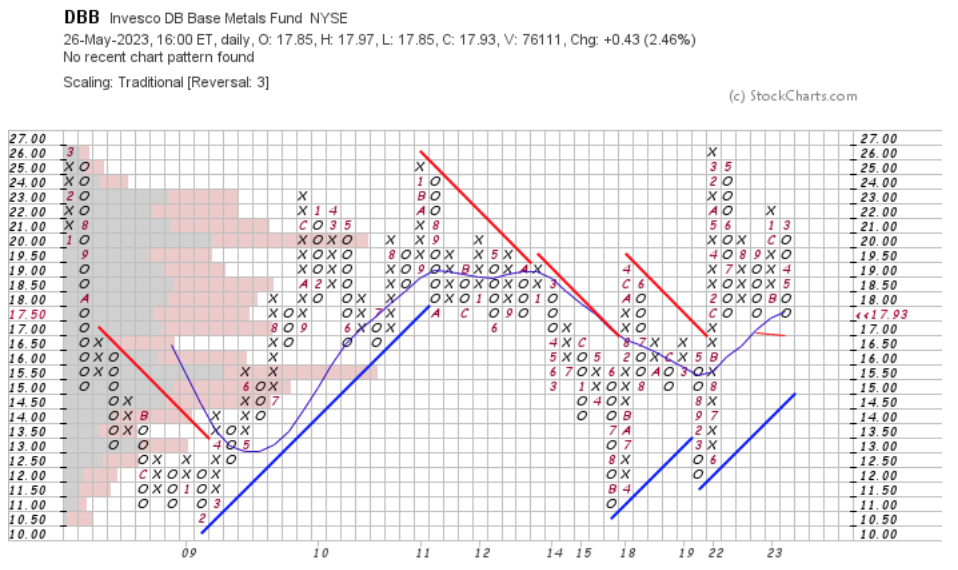
DBB, the Invesco DB Base Metals Fund ETF has fallen -21.82% over the past year, losing -24.19% since their 52-week high in June of 2022, but has reclaimed +3.05% since their 52-week low in May of 2023 (ex-distributions).
DBB ETF – Invesco DB Base Metals Fund ETF’s Technical Performance Over The Past Year
Their RSI has just recovered from oversold territory & is currently at 37.65 & their MACD has smoothed & looks to cross over bullishly in early next week after Friday’s gap up of +2.46%.
Volumes have been very low compared to average this past week, as investors will see how they feel about the $17.40-17.93 price range, with the current signal being uncertainty.
DBB’s modest 1.02% distribution yield for long-term holders provides limited downside protection, making it wisest to wait to see how their support levels hold up, with some type of hedge against possible poor performance.
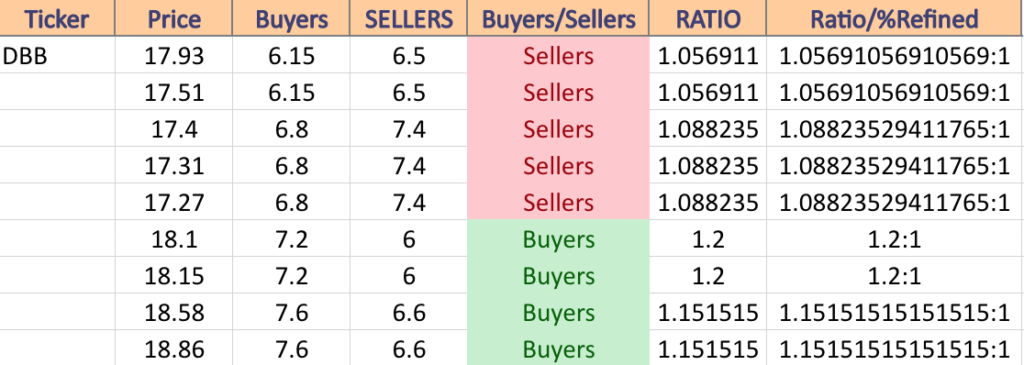
DBB has support at the $17.51 (Volume Sentiment: Sellers, 1.06:1), $17.40 (Volume Sentiment: Sellers, 1.09:1), $17.31 (Volume Sentiment: Sellers, 1.09:1) & $17.27/share (Volume Sentiment: Sellers, 1.09:1) price levels, with resistance at the $18.10 (10 day moving average; Volume Sentiment: Buyers, 1.2:1), $18.15 (Volume Sentiment: Buyers, 1.2:1), $18.58 (Volume Sentiment: Buyers, 1.15:1) & $18.86/share (Volume Sentiment: Buyers, 1.15:1) price levels.
DBB Point & Figure Chart With Volume Overlay
DBB Volume Sentiment At Current Price & Next Support & Resistance Levels
GXC, the SPDR S&P China ETF has shed -9.21% over the past year, declining -21.39% from their 52-week high in June of 2022, but has reclaimed +22.85% since their 52-week low in October of 2022 (ex-distributions).
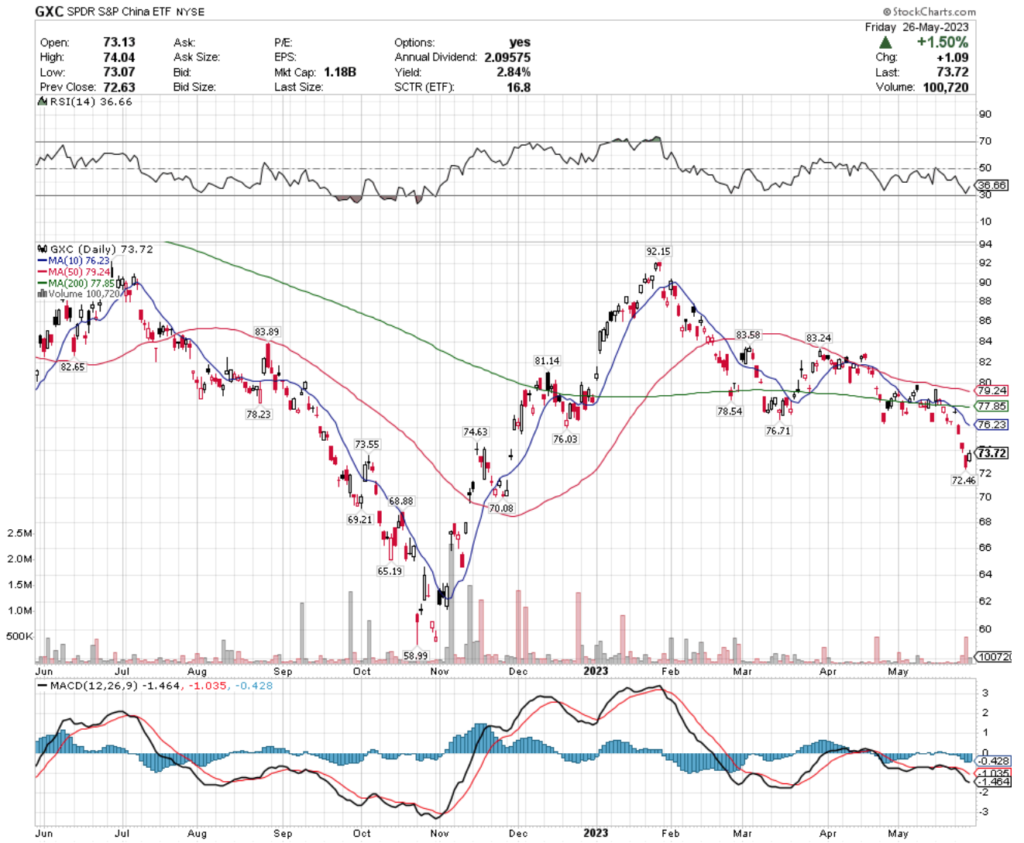
GXC ETF – SPDR S&P China ETF’s Technical Performance Over The Past Year
Their MACD is still in bearish descent, despite their RSI spiking after Friday’s +1.5% session to settle at 36.66.
Volumes has been above average the last 3 sessions, with Friday’s session attempting to fill in the gap down caused by Thursday’s session.
GXC offers a 2.84% distribution yield for long-term shareholders, which provides a slight cushion against losses, but they do not appear to be out of the woods just yet, as investors should be eyeing where to target an entry in less volatile markets.
GXC has support at the $73.55 (Volume Sentiment: Sellers, 36:1), $72.46 (Volume Sentiment: Buyers, 2.75:1), $70.08 (Volume Sentiment: Buyers, 4.73:1) & $69.21/share (Volume Sentiment: Sellers, 2:1) price levels, with resistance at the $74.63 (Volume Sentiment: Buyers, 4.33:1), $76.03 (Volume Sentiment: Sellers, 36:1), $76.23 (10 day moving average; Volume Sentiment: Sellers, 36:1) & $76.71/share (Volume Sentiment: Sellers, 36:1) price levels.
GXC Point & Figure Chart With Volume Overlay
GXC Volume Sentiment At Current Price & Next Support & Resistance Levels
XRT, the SPDR S&P Retail ETF has lost -16.06% over the past year, losing -22.41% since their 52-week high in April of 2022, while climbing back +11.19% from their 52-week low in September of 2022 (ex-distributions).
XRT ETF – SPDR S&P Retail ETF’s Technical Performance Over The Past Year
Their RSI climbed to 38.22 after Friday’s +0.83% session, which had higher than average volume.
Their MACD is still bearish, but is flatting out to attempt a bullish cross in the coming week.
XRT’s 2.41% distribution yield is a small cushion against potential losses, but unless you’re hedging against a position there is still more risk than worth taking here, but eyeing their behavior at support will give clues as to what levels to buy at when markets have calmed down.
XRT has support at the $58.01 (Volume Sentiment: Sellers, 2.9:1), $57.61 (Volume Sentiment: Sellers, 1.93:1), $57.28 (Volume Sentiment: Sellers, 1.93:1) & $56.44/share (Volume Sentiment: Sellers, 20:1) price levels, with resistance overhead at the $58.60 (Volume Sentiment: Sellers, 2.9:1), $58.80 (Volume Sentiment: Sellers, 2.9:1), $58.97 (Volume Sentiment: Sellers, 2.9:1) & $59.19/share (Volume Sentiment: Sellers, 1.47:1) price levels.
XRT Point & Figure Chart With Volume Overlay
XRT Volume Sentiment At Current Price & Next Support & Resistance Levels
Tying It All Together
Monday the markets will be closed in observance of Memorial Day, so there will be no data being reported, nor earnings reports; thank you to all readers who have served our country.
Tuesday’s data kicks off with the S&P Case-Schiller Home Price Index (20 cities) at 9 am, followed by Consumer Confidence at 10 am & Richmond Fed President Barkin speaking at 1pm.
Tuesday’s earnings include Ambarella, Box, Canopy Growth, Hewlett Packard Enterprise, HP & Sportsman’s Warehouse.
ADP Employment data is reported Wednesday at 8:15 am, followed by the Chicago Business Barometer at 9:45 am, Job Openings at 10 am, Philadelphia Fed President Patrick Harker speaking at 12:30 pm & the Federal Reserve Beige Book at 2pm.
Salesforce is the most anticipated earnings call on Wednesday, along with Advanced Auto Parts, C3.ai, Chewy, Conn’s, CrowdStrike, GameStop, NetApp, Nordstrom, Victoria’s Secret & others.
Thursday at 8:30 am we get Initial Jobless Claims & U.S. Productivity data, with IS&P U.S. Manufacturing PMI data at 9:45 am, ISM Manufacturing & Construction Spending data at 10 am & Philadelphia Fed President Patrick Harker speaking at 1pm.
Thursday’s earnings calls include Broadcom, Lululemon Athletica, Cooper, Dell Technologies, Dollar General, Five Below, Hormel Foods, Macy’s, MongoDB, VMware & more.
Friday the week winds down at 8:30 am when we get U.S. Employment Report, U.S. Unemployment Rate, U.S. Hourly Wages & Hourly Wages Year-Over-Year reported, with limited earnings calls being held.
See you back here next week!
*** I DO NOT OWN SHARE OR OPTIONS CONTRACT POSITONS IN SPY, QQQ, IWM, TDIV, DXJ, EDIV, DRIV, EZA, DBB, GXC or XRT AT THE TIME OF PUBLISHING THIS ARTICLE ***