Fulton Financial Corp. stock trades under the ticker FULT & has shown recent bullishness that traders & investors may want to research further into once market volatility calms down.
FULT stock closed at $13.49/share on 4/7/2023.
Fulton Financial Corp. FULT Stock’s Technical Performance Broken Down
Fulton Financial Corp. FULT Stock’s Technical Performance Over The Past Year
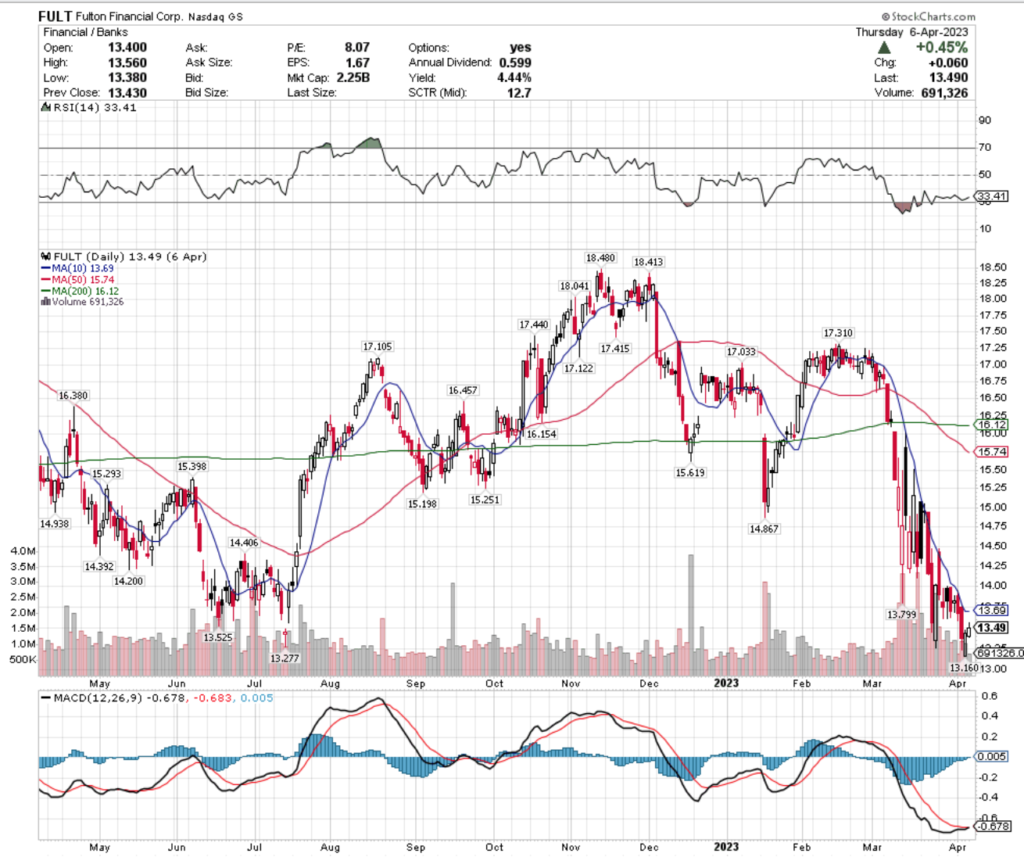
FULT Stock Price: $13.49
10 Day Moving Average: $13.69
50 Day Moving Average: $15.74
200 Day Moving Average: $16.12
RSI: 33.41
MACD: -0.678
On Friday, FULT stock completed a bullish MACD crossover, gaining +0.45% on the day’s session.
Their RSI is approaching oversold conditions, after declining for the past month & recent trading volumes have been above average.
Broader market volatility will continue to impact FULT stock, but their behavior at support levels throughout it will provide clues into where to enter a position once the volatility subsides.
FULT stock has support at the $13.28 & $13.16/share price level, as they look to break out & above the $13.53, $13.69 (10 day moving average) & $13.80/share price level.
Fulton Financial Corp. FULT Stock As A Long-Term Investment
Long-term oriented investors will like FULT stock’s valuation metrics, with an 8.08 P/E (ttm) & a 0.94 P/B (mrq).
They recently reported 16.6% Quarterly Revenue Growth Y-o-Y, with 32.2% Quarterly Earnings Growth Y-o-Y.
Their balance sheet will require a more thorough examination, with $835.49M of Total Cash (mrq) & $3.26B of Total Debt (mrq).
FULT stock pays a 4.47% dividend, which appears to be sustainable in the long-run, as their payout ratio is 35.93%.
67.9% of FULT stock’s outstanding share float is owned by institutional investors.
Fulton Financial Corp. FULT Stock As A Short-Term Trade Using Options
Traders with shorter-term time horizons can trade options to profit from price movements in FULT stock, while protecting their portfolios from volatility.
I am looking at the contracts with the 4/21 expiration date.
The $12.50 call options are in-the-money.
The $17.50 & $15 puts are also in-the-money, with the former being more liquid than the latter strike.
Tying It All Together
FULT stock has many interesting characteristics that are worth researching into for when their share price stabilizes & broader market volatility subsides.
Investors will like their dividend yield, as well as their valuation metrics, but should research more into their balance sheet structure.
Traders will like their recent technical performance, but may be disappointed in how illiquid their options are.
Overall, it is worth taking a closer look into how FULT stock fits into your portfolio strategy for once market volatility dies down.
*** I DO NOT OWN SHARES OR OPTIONS CONTRACT POSITIONS IN FULT STOCK AT THE TIME OF PUBLISHING THIS ARTICLE ***
BOK Financial Corp. stock trades under the ticker BOKF & has shown recent bullishness that traders & investors may want to research further into for the future.
BOKF closed at $82.24/share on 4/7/2023.
BOK Financial Corp. BOKF Stock’s Technical Performance Broken Down
BOK Financial Corp. BOKF Stock’s Technical Performance Over The Past Year
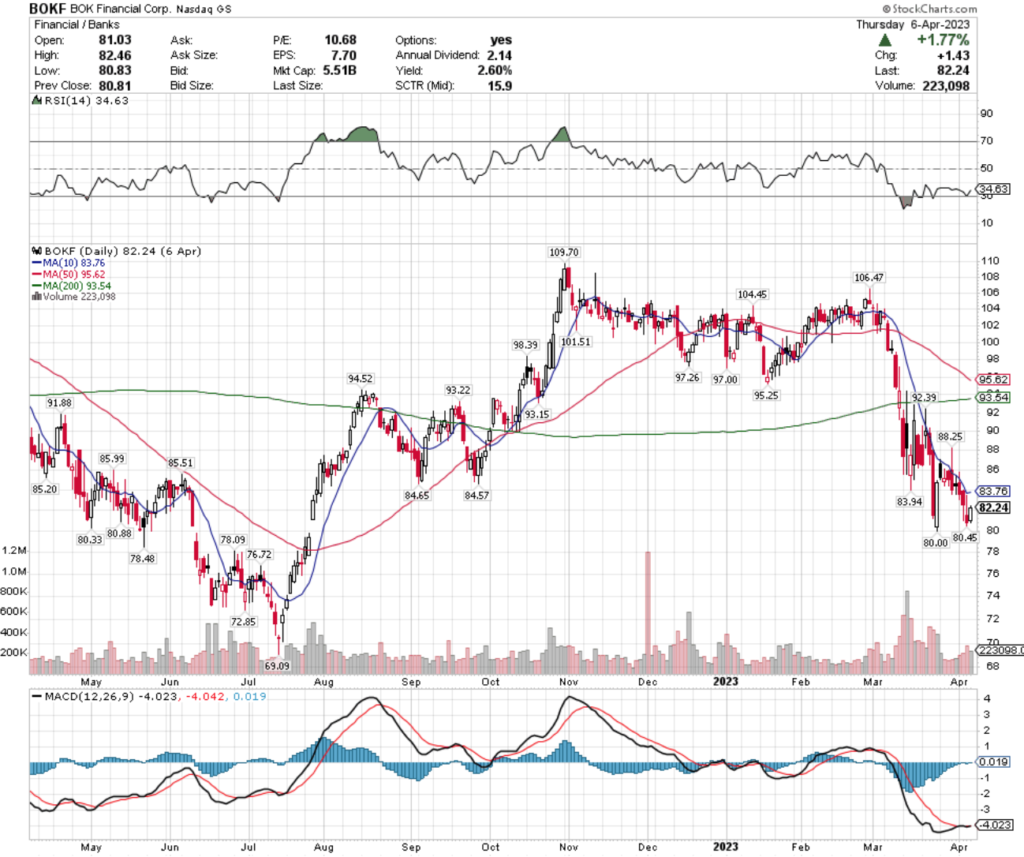
BOKF Stock Price: $82.24
10 Day Moving Average: $83.76
50 Day Moving Average: $95.62
200 Day Moving Average: $93.54
RSI: 34.63
MACD: -4.023
On Friday, BOKF stock completed a bullish MACD crossover, after steadily declining since late February.
Recent trading volumes have been above average compared to the year prior & their RSI is on the oversold end of neutral after the aforementioned decline.
Their chart is still not signaling it is safe to enter, but watching how they behave at their support levels will help identify a safe entry in the future.
BOKF stock has support at the $80.88, $80.45 & $80.33/share price level, with resistance at the $83.76 (10 day moving average), $83.94 & $84.57/share price level.
BOK Financial BOKF Stock As A Long-Term Investment
Long-term oriented investors will like BOKF stock’s valuation metrics, with a 10.71 P/E (ttm) & a 1.17 P/B (mrq).
They recently reported 18.4% Quarterly Revenue Growth Y-o-Y, with 43.6% Quarterly Earnings Growth Y-o-Y.
Their balance sheet also looks appealing, with $6.75B of Total Cash (mrq) & $7.91B of Total Debt (mrq).
BOKF stock pays a 2.67% dividend, which appears to be sustainable in the long-run, as their payout ratio is 27.73%.
38.8% of BOKF stock’s outstanding share float is owned by institutional investors.
BOK Financial Corp. BOKF Stock As A Short-Term Trade Using Options
Traders focused on shorter time horizons can trade options to profit from price movements in BOKF stock, while protecting their portfolios from volatility.
I am looking at the contracts with the 4/21expiration date.
The $85 & $90 puts are also in-the-money, with the former being more liquid than the latter strike.
Tying It All Together
BOKF has many interesting attributes that traders & investors may find appealing after the coming market volatility passes by.
Investors will like their dividend yield, valuation metrics & balance sheet.
Traders will like their recent technical performance, but may be disappointed in how liquid their options are.
All-in-all, it is worth taking a closer look into how BOKF stock may fit into your portfolio strategy down the line after market volatility settles down.
*** I DO NOT OWN SHARES OR OPTIONS CONTRACT POSITIONS IN BOKF STOCK AT THE TIME OF PUBLISHING THIS ARTICLE ***
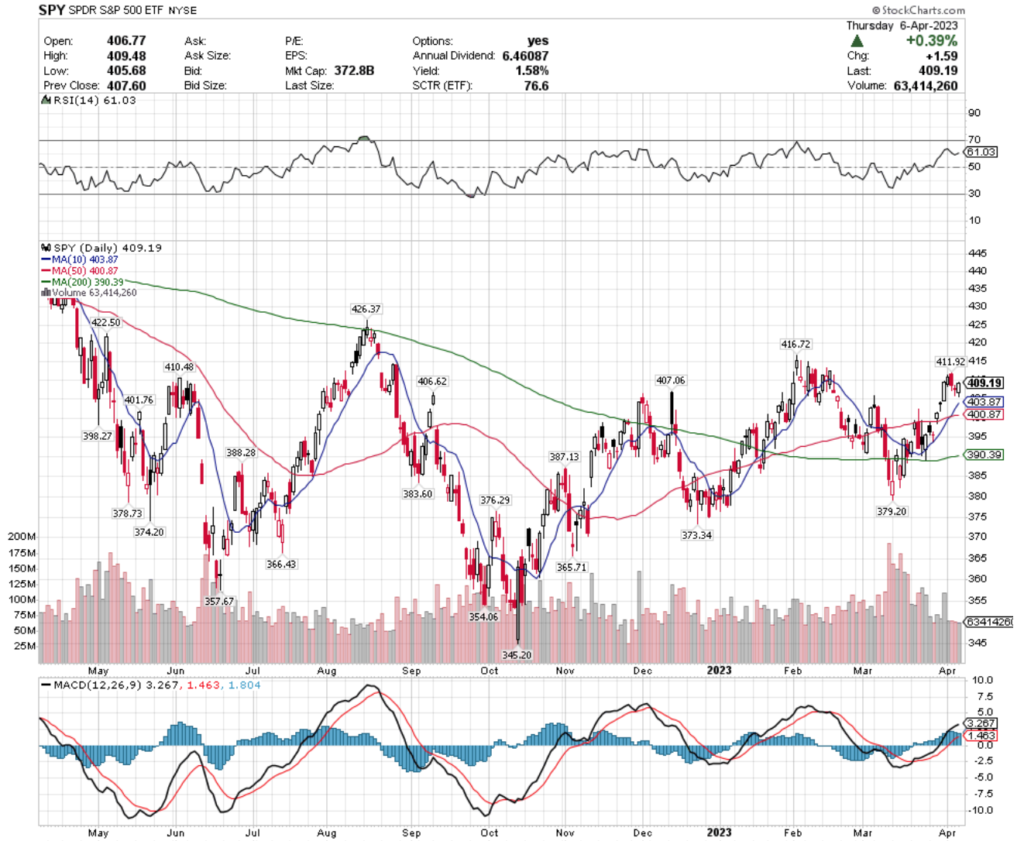
SPY, the SPDR S&P 500 ETF lost -0.05% this past week, faring the best of the indexes that we review here this week, as investors sought safety in larger cap names.
SPY ETF – SPDR S&P 500 ETF’s Technical Performance Over The Past Year
Their RSI & MACD are beginning to show more signs of weakness compared to last week & this past week’s trading volumes subsided, signaling less confidence than last week’s jumpy but bullish week.
SPY has support at the $407.06, $406.62 & $403.87/share (10 day moving average) price levels, with resistance overhead at the $410.48, $411.92 & $416.72/share price levels.
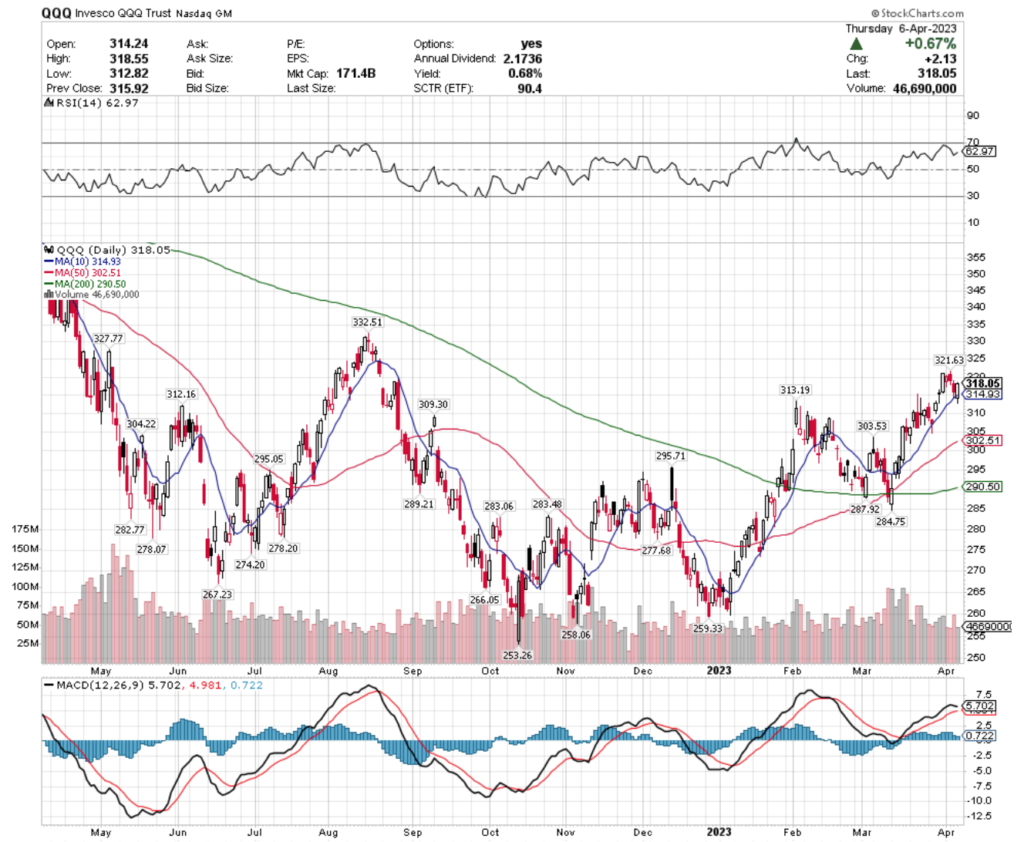
QQQ, the Invesco QQQ Trust ETF dropped -0.9% last week; trailing the S&P 500, but being preferred over the Russell 2000 small cap names.
QQQ ETF – Invesco QQQ Trust ETF’s Technical Performance Over The Past Year
Their RSI is slightly more overbought than SPY’s & their MACD is beginning to curl over bearishly, with relatively average volume to confirm the sentiment.
QQQ has support at the $314.93 (10 day moving average), $313.19 & $312.16/share price levels, making for a decent zone before the next level at $309.30 & they have resistance at the $321.63, $327.77 & $332.51/share price levels.
IWM, the iShares Russell 2000 ETF lost -2.53% over the past week, as investors looked to flee smaller cap names & many pivoted into large cap, safer stocks.
Their RSI is below neutral trending towards oversold & their MACD is beginning to signal bearishness, after a month & change of above average trading volume to confirm sentiment.
IWM has support at the $172.67, $169.71 & $169.05/share price levels, with resistance at the $174.63, $174.93 (10 day moving average) & $175.13/share price levels.
Let’s dive into some of the best & worst performing sectors & geo-locations based on this week’s technical ratings data!
Euro STOXX 50 (FEZ), Argentina (ARGT), Aerospace & Defense (DFEN) & Fundamental International Large Companies (FNDF) Are All Bullishly Leading The Market
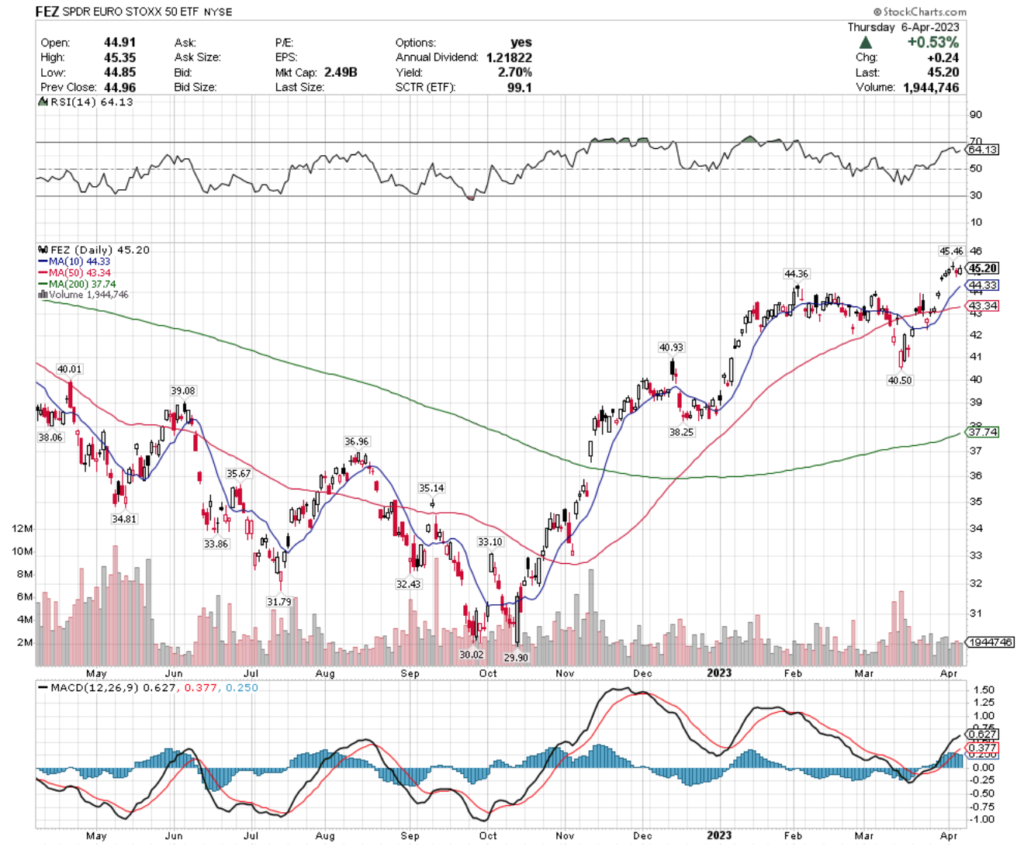
FEZ, the SPDR EURO STOXX 50 ETF has gained +16.81% over the past year, rebounding +50.02% from their 52 week low on 10/13/2022 (ex-distributions).
FEZ ETF – SPDR EURO STOXX 50 ETF’s Technical Performance Over The Past Year
Their RSI is approaching overbought conditions at 64 & their MACD is beginning to show signs of weakness, as they’ve consolidated after a gap up 2 weeks ago.
Recent volumes have been below average compared to the year prior & their most recent candlestick configuration is signaling to proceed with caution in the near-term.
While their distribution yield provides a 2.7% cushion to long-term holders, unless employing an options strategy for protection, it would be wise to wait & see how they behave around their recent support levels before entering or adding to a position.
FEZ has support at the $44.36, $44.33 (10 day moving average) & $43.34/share price levels, which all appear below the aforementioned gap, with the only overhead resistance from the past 52 weeks occurring at the $45.46/share price level.
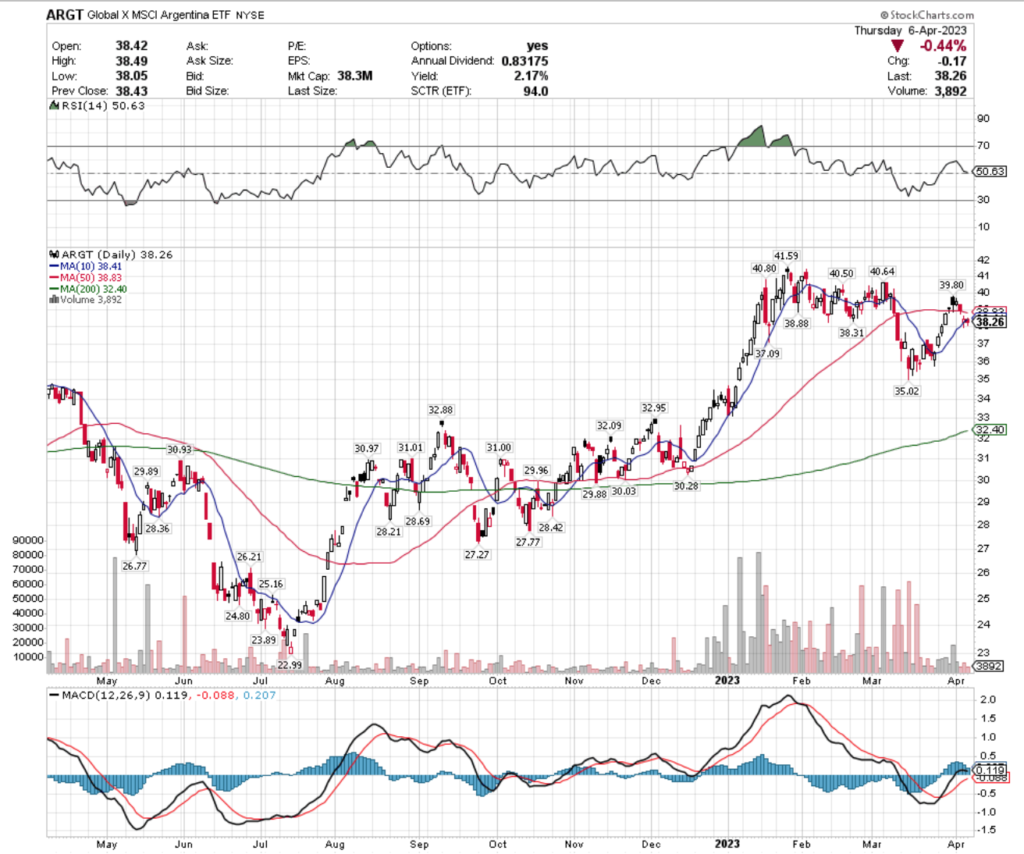
ARGT, the Global X MSCI Argentina ETF has climbed +10.91% over the past year & has grown +64.28% from their 52 week low on 7/14/2022 (ex-distributions).
ARGT ETF – Global X MSCI Argentina ETF’s Technical Performance Over The Past Year
Their RSI is neutral at 50.63, with their MACD signaling a near-term decline is on the horizon.
Recent trading volumes have been about average compared to the year prior, although their volume levels have been quite volatile over that time period & their Tuesday gap down has led to a range of uncertainty.
While they offer a 2.17% distribution yield for long-term holders annually, unless using a long/short strategy for protection against the downside, it looks best to wait to enter or add to a position until their price has further consolidated.
ARGT has support at the $37.09, $35.02 & $32.95/share price levels, with resistance at the $38.31, $38.41 (10 day moving average) & $38.83/share (50 day moving average) price levels.
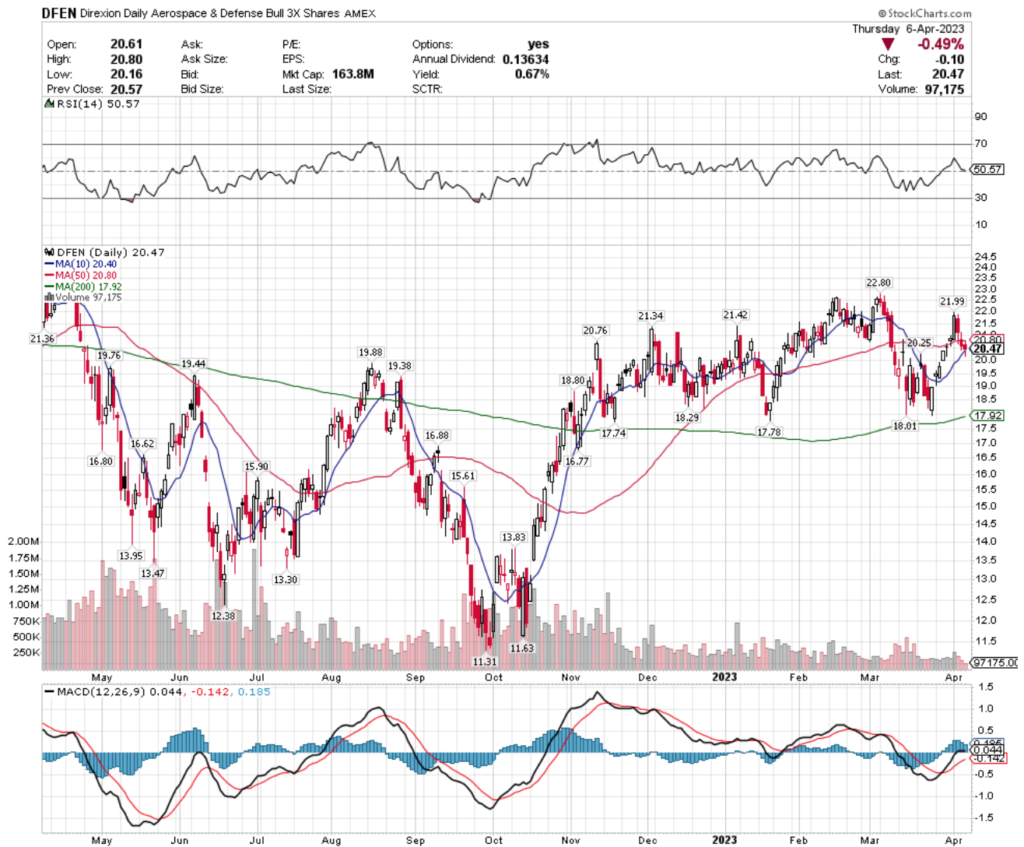
DFEN ETF – Direxion Daily Aerospace & Defense Bull ETF’s Technical Performance Over The Past Year
Like ARGT, DFEN also has a neutral RSI at 50.57 & a MACD signaling that there is a near-term price correction on the horizon.
With trading volumes for 2023 being very low compared to the year prior, there is still uncertainty among market participants as to the value of DFEN’s shares.
With a modest 0.67% distribution yield for long-term shareholders they are another name worth following to wait for a more opportune entry point for.
DFEN has support at the $20.40 (10 day moving average), $20.25, $19.88/share price levels, as they try to break out & above their $20.76, $20.80 (50 day moving average) & $21.34/share resistance levels.
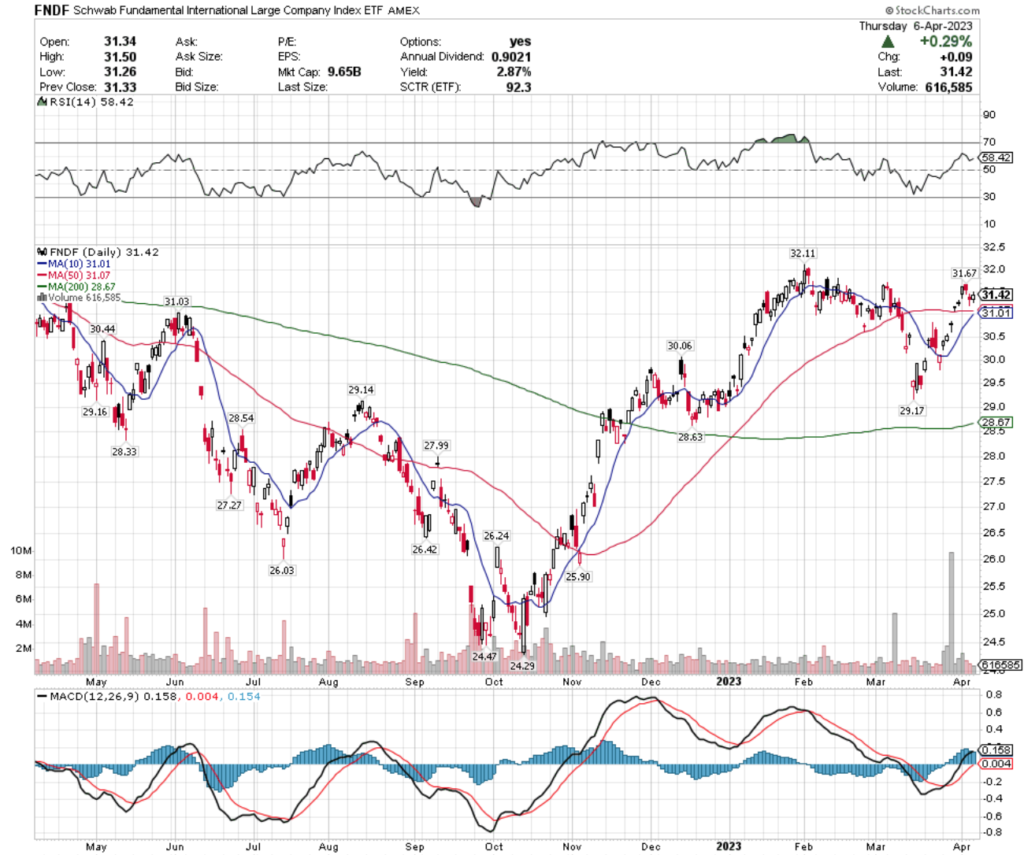
FNDF ETF – Schwab Fundamental International Large Company Index ETF’s Technical Performance Over The Past Year
While their 10 & 50 day moving averages are primed to cross bullishly in the coming week, their MACD is signaling near-term losses & consolidation.
With an RSI approaching the overbought end of neutral & roughly average volume, minus one of the gap up days recently, there still looks to be uncertainty in the near-term & their past week’s candlesticks are not particularly appealing.
With only 2.87% of protection to the downside via distribution yields for long-term shareholders, this one is worth watching for a more favorable entry-point, with opportunities to build profits with a long/short strategy that can be applied to new shares in the future.
FNDF has support at the $31.07 (50 day moving average), $31.03 & $31.01 (10 day moving average) price levels, with resistance at the $31.67, $31.86 & $32.11/share price levels.
Uranium (URA), SuperDividends (FDIV), Retail (XRT) & Global Timber & Forestry (WOOD) Are All Bearishly Lagging The Market
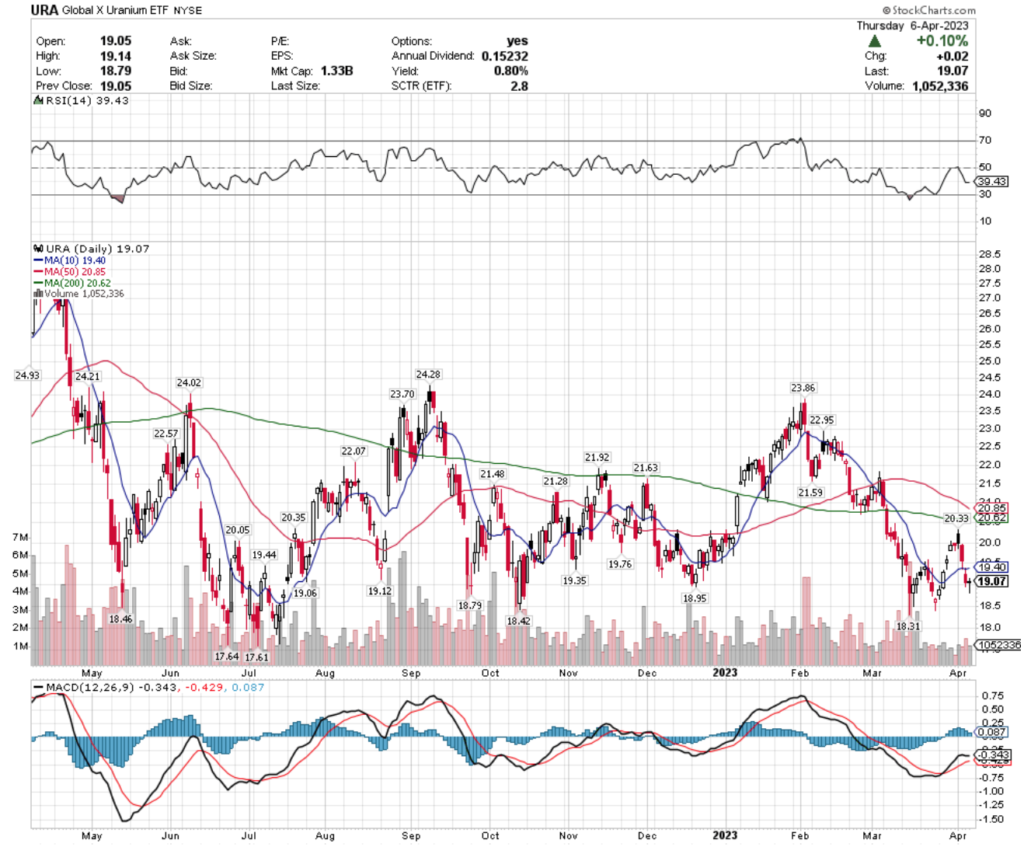
URA, the Global X Uranium ETF has dropped -29.5% over the past year, losing -33.06% from their 52 week high in April of 2022, but have recovered +8.05% since their 52 week low on 7/6/2022 (ex-distributions).
URA ETF – Global X Uranium ETF’s Technical Performance Over The Past Year
Their MACD is beginning to show bearish signals for the near-term, as their RSI enters into the oversold end of the neutral range at 39.43.
With lower than average recent trading volumes & the impending death cross of their 50 & 200 day moving averages, there appears to be more near-term pain in store for URA.
With only a 0.8% distribution yield annually for long-term holders, this will require a wait & see approach about an entry-point after observing how it behaves at support, but some insurance on the short side is worth looking into.
URA has support at the $19.06, $18.95 & $18.46/share price level, with resistance overhead at the $19.12, $19.35 & $19.40/share (10 day moving average) price levels.
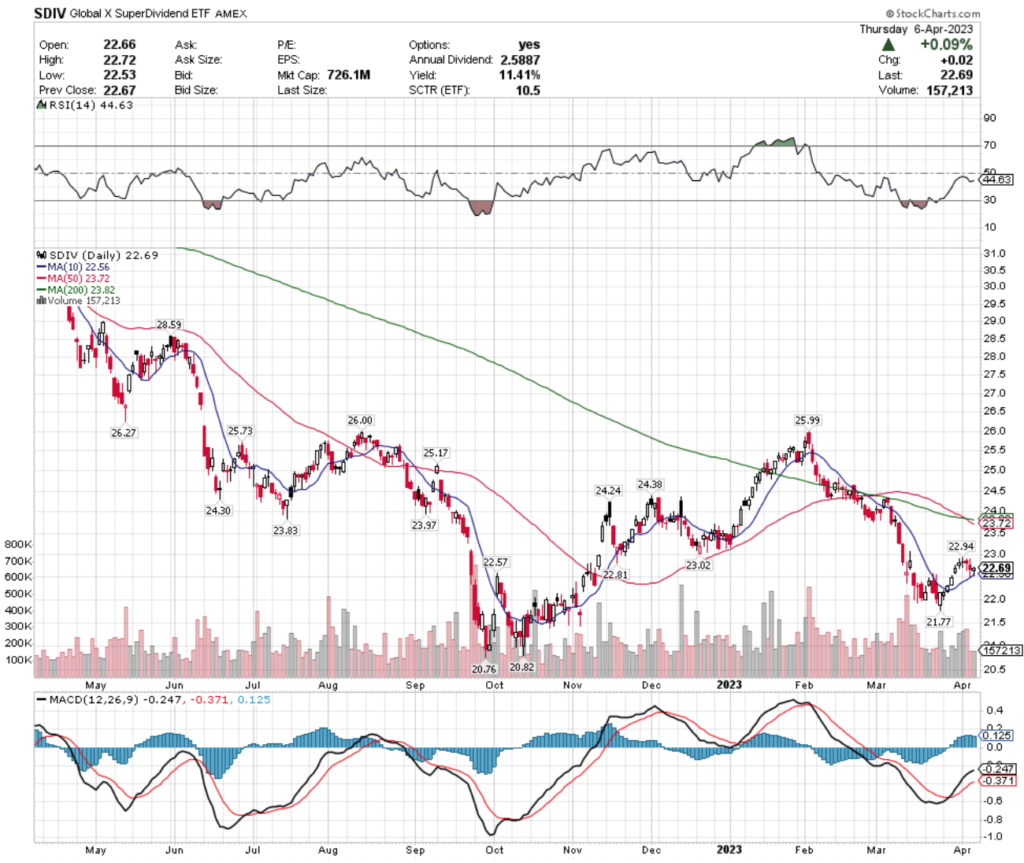
SDIV, the Global X SuperDividend ETF has lost -6.14% over the past year, falling -7.04% from their 52 week high in April of 2022, but has gained +3.97% from their 52 week low on 10/21/2022 (ex-distributions).
SDIV ETF – Global X SuperDividend ETF’s Technical Performance Over The Past Year
Recent trading volumes have been about average compared to the year prior & their RSI is neutral.
SDIV’s MACD is beginning to signal short-term weakness & their behavior at their 10 day moving average will be important to see how it holds up as a support level.
Despite having an 11.41% distribution yield for long-term holders, that only covers losses up to $20.10/share, which based on the last 52 weeks of support points looks risky (current lowest is $20.76/share), making this name another to approach with caution or defensively.
SDIV has support at the $22.57, $22.56 (10 day moving average) & $21.77/share price levels, with resistance at the $22.81, $22.94 & $23.02/share price levels.
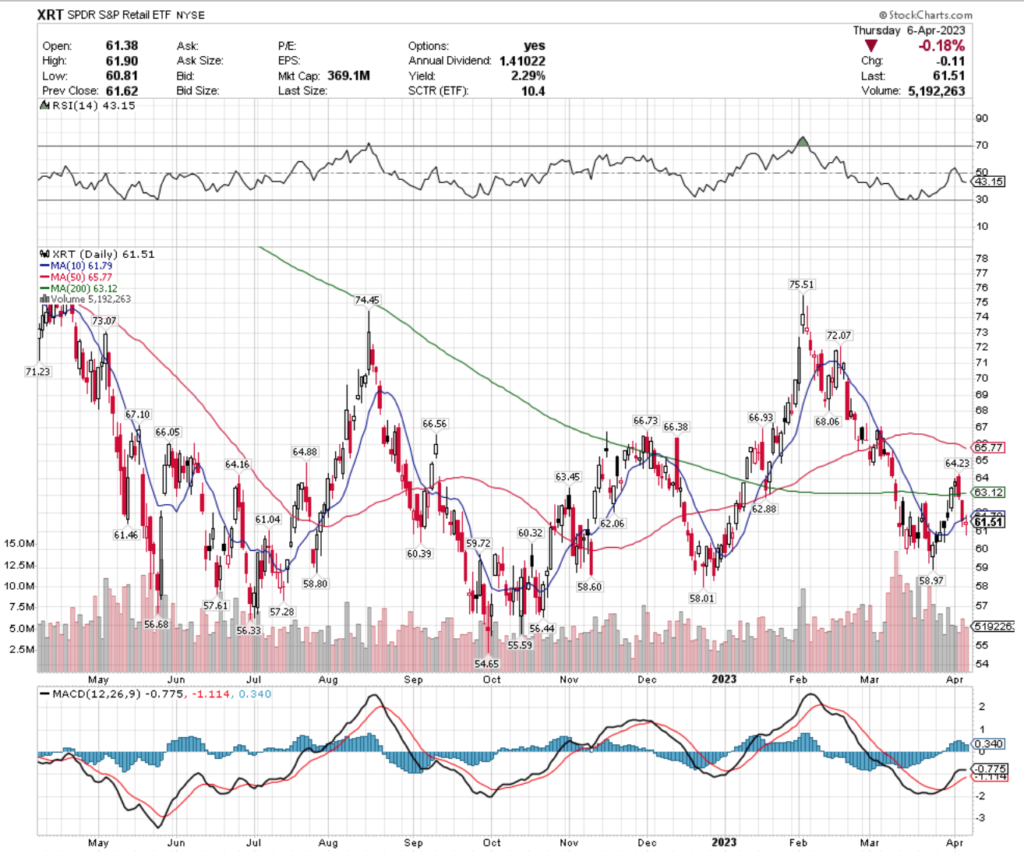
XRT, the SPDR S&P Retail ETF shed -16.06% over the past year, losing -22.41% from their 52 week high in April 2022, but has reclaimed +11.19% since their 52 week low of 9/30/2022 (ex-distributions).
XRT ETF – SPDR S&P Retail ETF’s Technical Performance Over The Past Year
Recent trading volumes have been about average compared to the year prior, with their RSI trending bearishly & their MACD is looking to roll over bearishly in the coming trading sessions.
With a 2.29% distribution yield, there is limited downside protection making it risky to be eyeing an entry or consider adding to an existing position & it would be more prudent to wait & see how they interact with support levels, or play a long/short defensive play while waiting on their price to become less volatile.
XRT has support at the $61.46, $61.04 & $60.39/share price levels, with resistance at the $61.79. $62.06 & $62.88/share price levels.
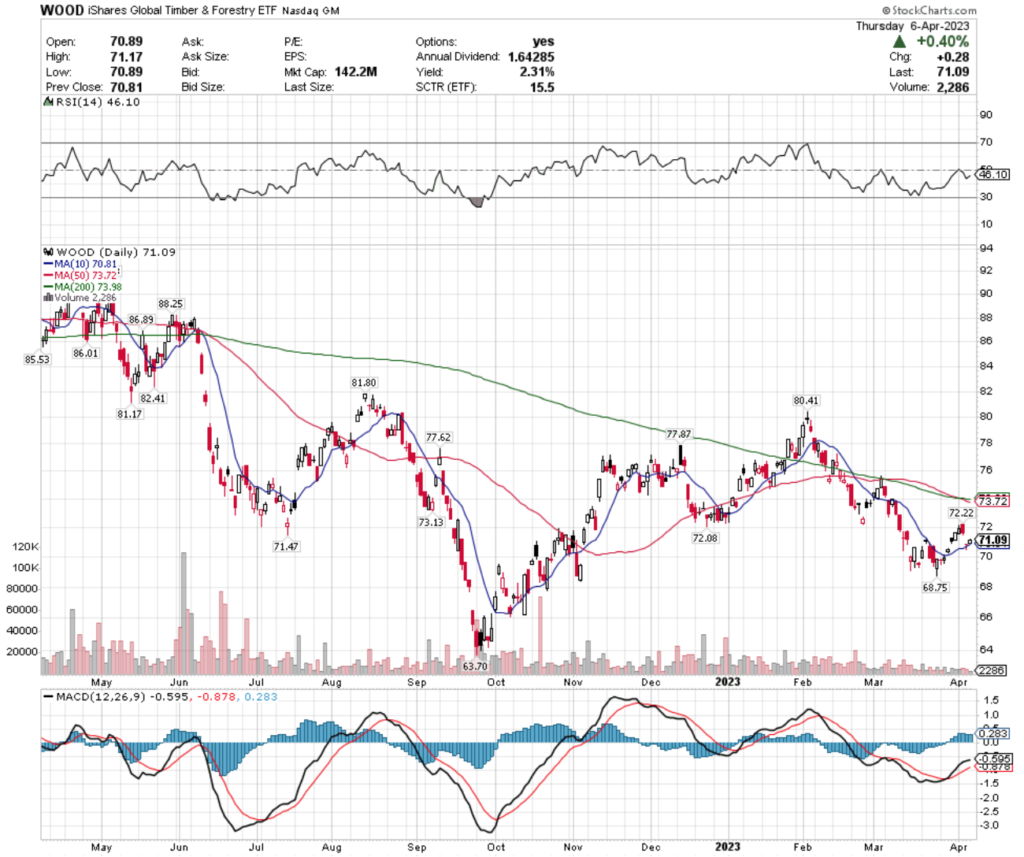
WOOD, the iShares Global Timber & Forestry ETF has fallen -17.47% over the past year, losing -24.64% since their 52 week high in April 2022, but gaining +11.46% since their 52 week low on 9/26/2022 (ex-distributions).
WOOD ETF – iShares Global Timber & Forestry ETF’s Technical Performance Over The Past Year
Trading volumes have been much lower than average compared to the year prior recently, after the death cross of the 50 & 200 day moving averages earlier in the week, showing traders aren’t sure of their proper valuation currently.
Their RSI & MACD appear ready to turn bearish, after Thursday’s +0.4% bounce helped keep them from falling more aggressively.
WOOD pays a 2.31% distribution yield to long-term holders, but that will not provide adequate protection against losses, making it advisable to watch how they interact with support levels & or play defensively while looking for an opportune entry point.
WOOD has support at the $70.81, $68.75 & $63.70/share price levels, with resistance overhead at the $71.47, $72.08 & $72.22/share price levels.
Tying It All Together
This upcoming week features many interesting bits of data being reported.
Monday we get Wholesale Inventories data at 10 am, with New York Fed President Williams speaking at 4:15 pm.
Tuesday at 6 am we get the NFIB Optimism Index, followed by Chicago Fed President Goolsbee speaking at 1:30 pm, Philadelphia Fed President Harker speaking at 6:30 pm & at 7:30 pm Minneapolis Fed President Kashkari speaks.
Wednesday will be the most eagerly anticipated day, with Consumer Price Index data, Core CPI, CPI Y-o-Y & Core CPI Y-o-Y all reported at 8:30 am, followed by Richmond Fed President Barkin speaking at 9:00 am, San Francisco Fed President Daly speaking at 12 pm & at 2 pm we get the Treasury Budget & FOMC minutes reported.
Thursday will also be important, with Producer Price Index, Core PPI, PPI Y-o-Y, Initial Jobless Claims & Continuing Jobless Claims all being reported at 8:30 am.
Friday will also be a busy day, with US Retail Sales, Retail Sales minus Autos, Import Price Index, & Import Prices minus Fuel being reported at 8:30 am
At 8:45 am Fed Governor Waller speaks, followed by Industrial Production & Capacity Utilization data at 9:15 am & Business Inventories & Consumer Sentiment reports out at 10 am.
It promises to be an interesting week ahead – see you back here next week!
*** I DO NOT OWN SHARES OR OPTIONS CONTRACT POSITIONS IN FEZ, ARGT, DFEN, FNDF, URA, SDIV, XRT or WOOD AT THE TIME OF PUBLISHING THIS ARTICLE ***
Cigna Corp. stock trades under the ticker CI & has shown recent bullishness that traders & investors should research further into.
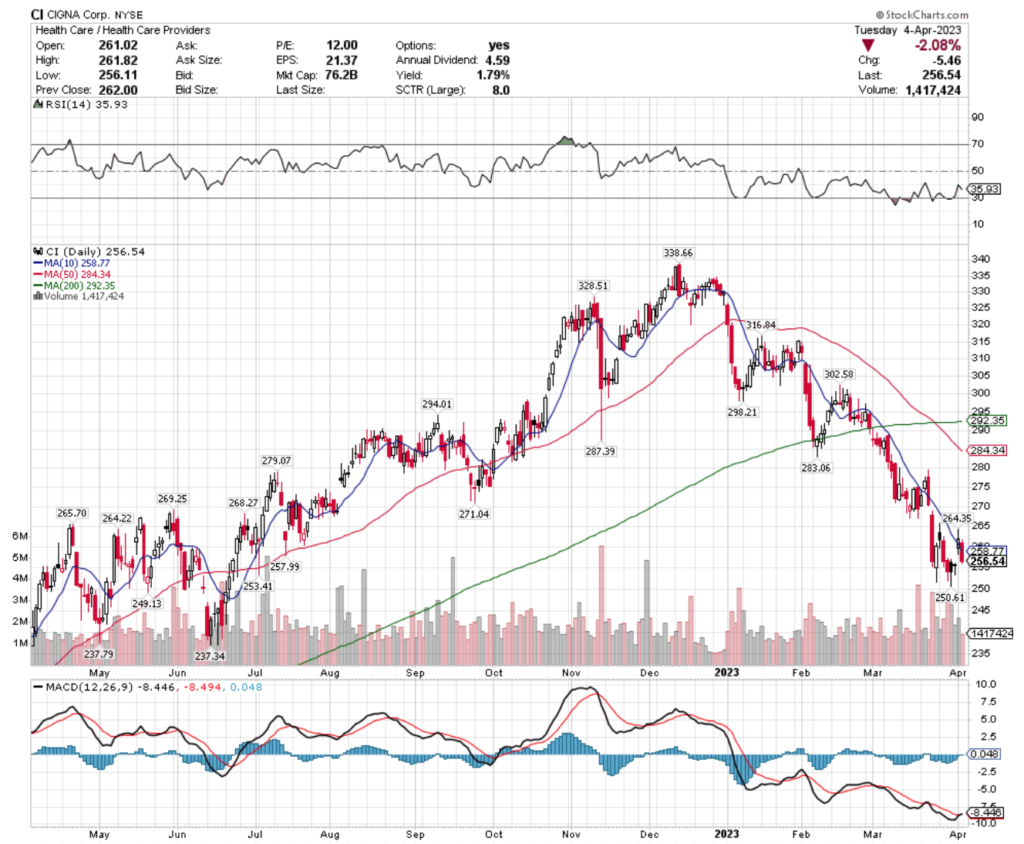
CI stock closed at $256.54/share on 4/4/2023.
Cigna Corp. CI Stock’s Technical Performance Over The Past Year
Cigna Corp. CI Stock’s Technical Performance Over The Past Year
CI Stock Price: $256.54
10 Day Moving Average: $258.77
50 Day Moving Average: $284.34
200 Day Moving Average: $292.35
RSI: 35.93
MACD: -8.446
Yesterday, CI stock completed a bullish MACD crossover, losing -2.08% on the day’s session.
Their RSI is approaching oversold at 35.9 & recent trading volumes have been about average compared to the year prior, as they have steadily declined throughout Q1 2023.
CI stock has support at the $253.41, $250.61 & $249.13/share price level, as they look to break out above their $257.99, $258.77 (10 day moving average) & $264.22/share price levels.
Cigna Corp. CI Stock As A Long-Term Investment
Long-term oriented investors will like CI stock’s valuation metrics, with a 12.05 P/E (ttm) & a 1.7 P/B (mrq).
They recently reported 0% Quarterly Revenue Growth Y-o-Y, with 4.7% Quarterly Earnings Growth Y-o-Y.
Their balance sheet will require a more thorough review, with $6.76B of Total Cash (mrq) & $31.55B of Total Debt (mrq).
CI stock pays a 1.71% dividend, which appears to be sustainable in the long-run, as their payout ratio is 21.03%.
90.79% of CI stock’s outstanding share float is owned by institutional investors.
Cigna Corp. CI Stock As A Short-Term Trade Using Options
Short-term traders can use options to hedge their portfolios against volatility, while profiting from CI price movements.
I am looking at the contracts with the 5/19 expiration date.
The $250, $240 & $210 call options are all in-the-money, listed from highest to lowest level of open interest.
The $260, $270 & $280 puts are also all in-the-money, with the former being more liquid than the latter strikes.
Tying It All Together
CI stock has many interesting characteristics that traders & investors are sure to find appealing.
Investors will like their valuation metrics & dividend yield, but may want to review their balance sheet more thoroughly.
Traders will like their recent technical performance.
All-in-all, it is worth taking a closer look into CI stock to see how it fits into your portfolio strategy.
*** I DO NOT OWN SHARES OR OPTIONS CONTRACT POSITIONS IN CI STOCK AT THE TIME OF PUBLISHING THIS ARTICLE ***
PetMed Express, Inc. stock trades under the ticker PETS & has shown recent bullishness that traders & investors should research further into.
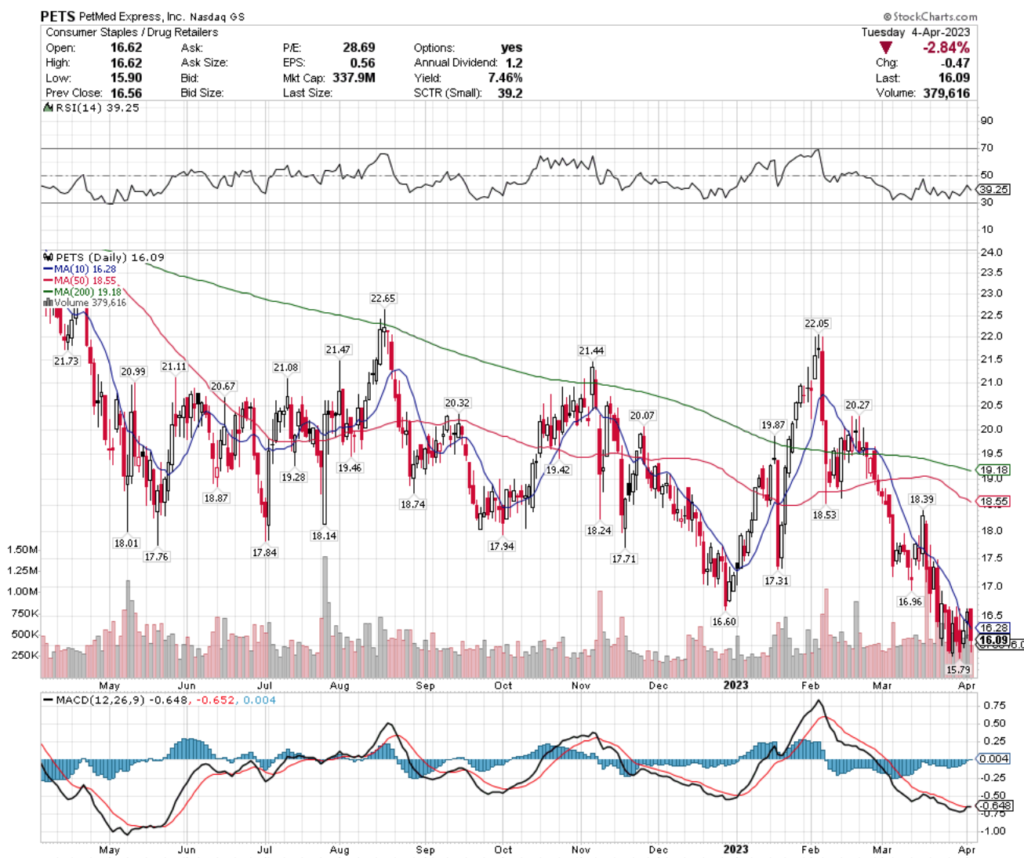
PETS stock closed at $16.09/share on 4/4/2023.
PetMed Express, Inc. PETS Stock’s Technical Performance Broken Down
PetMed Express, Inc. PETS Stock ‘s Technical Performance Over The Past Year
PETS Stock Analysis: $16.09
10 Day Moving Average: $16.28
50 Day Moving Average: $18.55
200 Day Moving Average: $19.18
RSI: 39.25
MACD: -0.648
Yesterday, PETS stock completed a bullish MACD crossover, but lost -2.84% on the day’s session.
Their RSI is approaching oversold at 39 & recent trading volumes have been about average compared to the year prior, as their price has slid throughout March 2023.
PETS stock has support at the $15.09 & $12.79/share price levels, with resistance at the $16.28 (10 day moving average), $16.60 & $16.96/share price levels.
PetMed Express, Inc. PETS Stock As A Long-Term Investment
Long-term oriented investors will like PETS stock’s 29.84 P/E (ttm), but may find their 2.64 P/B (mrq) to be a bit too rich.
They recently reported -3% Quarterly Revenue Growth Y-o-Y, which may warrant a closer review.
Investors will like their balance sheet, which contains $102.43M of Total Cash (mrq) & no Total Debt (mrq).
PETS stock pays a 7.25% dividend yield, which appears to be unsustainable in the long-run & will require more research, as their payout ratio is 214.29%.
82.38% of PETS stock’s outstanding share float is owned by institutional investors.
PetMed Express, Inc. PETS Stock As A Short-Term Trade Using Options
Traders with shorter time horizons can trade options to profit from price movements in PETS stock, while hedging their portfolios from volatility.
I am looking at the contracts with the 5/19 expiration date.
The $12.50 & $15 call options are in-the-money, listed in order of highest to lowest open interest level.
The $17.50, $30 & $20 puts are also all in-the-money, with the former being more liquid than the latter strikes.
Tying It All Together
PETS stock has many interesting attributes that traders & investors will find appealing.
Investors will like their balance sheet & hefty dividend yield, but may want to research deeper into its longevity potential.
Traders will like their recent technical performance, but may wish their options were more liquid.
Overall, it is worth taking a closer look into PETS stock to see how it fits into your portfolio strategy.
*** I DO NOT OWN SHARES OR OPTIONS CONTRACT POSITIONS IN PETS STOCK AT THE TIME OF PUBLISHING THIS ARTICLE ***
Macy’s Inc. stock trades under the ticker M & has shown recent bullishness that traders & investors should research further into.
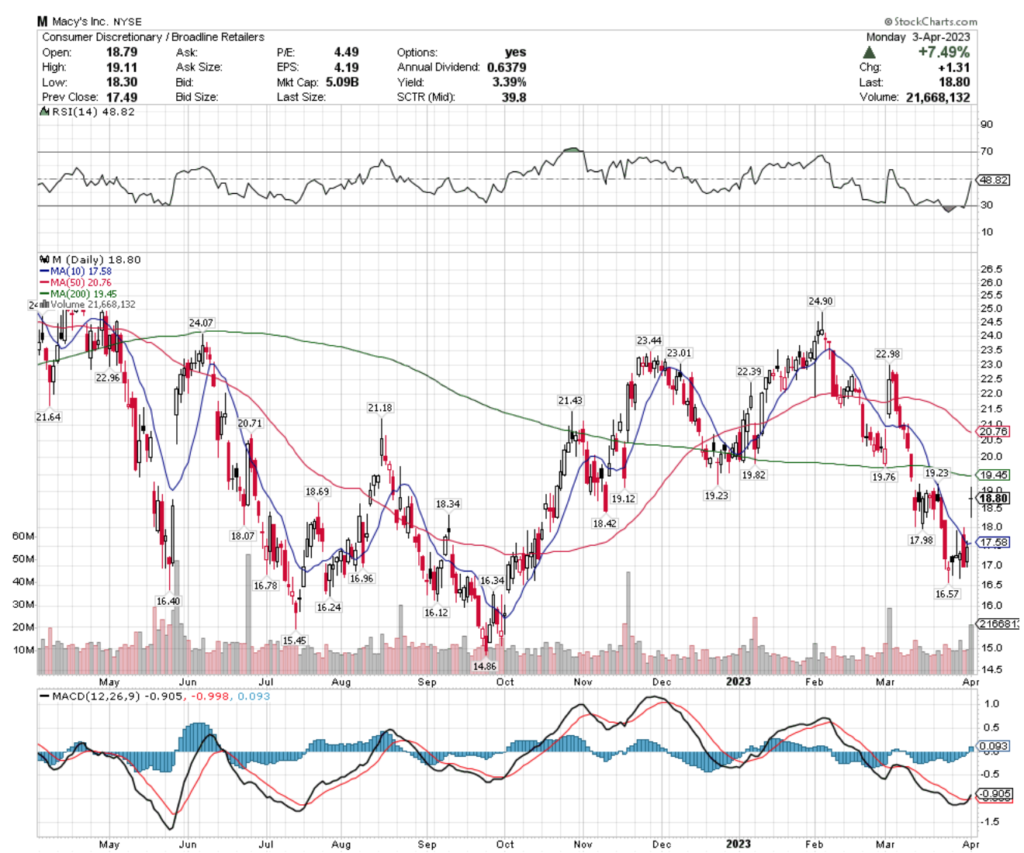
M stock closed at $18.80/share on 3/3/2023.
Macy’s Inc. M Stock’s Technical Performance Broken Down
Macy’s Inc. M Stock’s Technical Performance Over The Past Year
M Stock Price: $18.80
10 Day Moving Average: $17.58
50 Day Moving Average: $20.76
200 Day Moving Average: $19.45
RSI: 48.82
MACD: -0.905
Yesterday, M stock completed a bullish MACD crossover, gaining +7.49% on the day’s session.
Their RSI is neutral & recent trading volumes have been about average compared to the year prior, but there is uncertainty in yesterday’s doji candlestick.
M stock has support at the $18.69, $18.42 & $18.34/share price levels, as they look to break out above the $19.12, $19.23 (2 points in last 52 weeks) & $19.45 (200 day moving average).
Macy’s Inc. M Stock As A Long-Term Investment
Long-term oriented investors will like M stock’s 3.24 P/E (ttm).
They recently reported -4.5% Quarterly Revenue Growth Y-o-Y, with -31.5% Quarterly Earnings Growth Y-o-Y, which will require a closer examination.
Their balance sheet also will require a more thorough review, with $862M of Total Cash (mrq) & $6.4B of Total Debt (mrq).
M stock pays a 3.6% dividend, which appears to be sustainable in the long-run, as their payout ratio is 15.04%.
85.67% of M stock’s outstanding share float is owned by institutional investors.
Macy’s Inc. M Stock As A Short-Term Trade Using Options
Traders with shorter time horizons can trade options to profit from M stock’s price movements, while protecting their portfolio from volatility.
I am looking at the contracts with the 5/19 expiration date.
The $18, $17 & $14 call options are all in-the-money, listed from highest to lowest level of open interest.
The $19, $20 & $23 puts are also all in-the-money, with the former being more liquid than the latter strikes.
Tying It All Together
M stock has many interesting characteristics that traders & investors are sure to find appealing.
Investors will like their dividend yield, but may want to look closer into their balance sheet & recent growth troubles.
Traders will like their liquid options & recent technical performance.
Overall, it is worth taking a closer look into how M stock fits into your portfolio strategy.
*** I DO NOT OWN SHARES OR OPTIONS CONTRACT POSITIONS IN M STOCK AT THE TIME OF PUBLISHING THIS ARTICLE ***
Patrick Industries, Inc. stock trades under the ticker PATK & has shown recent bullishness that traders & investors should research further into.
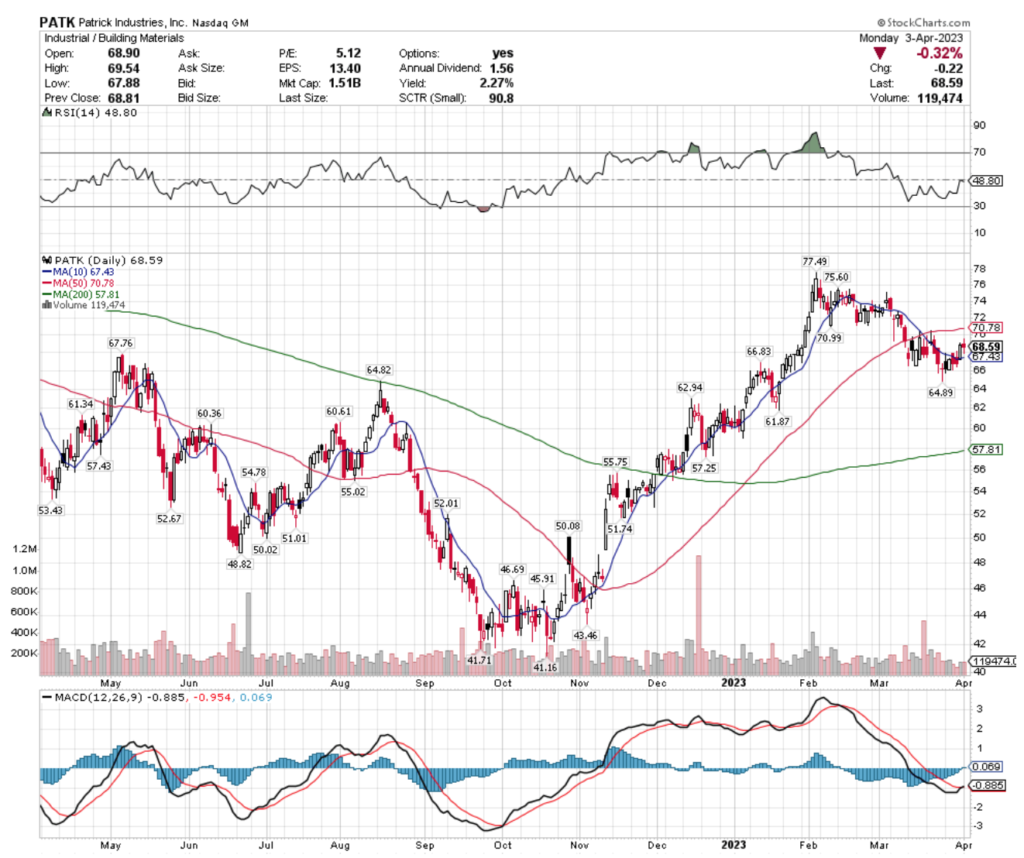
PATK stock closed at $68.59/share on 4/3/2023.
Patrick Industries, Inc. PATK Stock’s Technical Performance Broken Down
Patrick Industries, Inc. PATK Stock’s Technical Performance Over The Past Year
PATK Stock Price: $68.59
10 Day Moving Average: $67.43
50 Day Moving Average: $70.78
200 Day Moving Average: $57.81
RSI: 48.8
MACD: -0.885
Yesterday, PATK stock completed a bullish MACD crossover, losing -0.32% on the day’s session.
Their RSI is neutral, with recent trading volumes being lighter than average compared to the year prior, signaling uncertainty by the market as to where to price them.
PATK has support at the $67.43 (10 day moving average), $66.83 & $64.89/share price levels, with resistance at the $67.76, $70.78 (50 day moving average) & $70.99/share price levels.
Patrick Industries, Inc. PATK Stock As A Long-Term Investment
Long-term oriented investors will like PATK stock’s 4.95 P/E (ttm), as well as their 1.57 P/B (mrq).
Their recently reported growth metrics will require a more thorough examination, with -17% Quarterly Revenue Growth Y-o-Y & -34.2% Quarterly Earnings Growth Y-o-Y.
Their balance sheet will also require a more thorough examination, with $22.85M of Total Cash (mrq) & $1.45B of Total Debt (mrq).
PATK stock pays a 2.09% dividend, which appears to be sustainable in the long-run, as their payout ratio is 10.67%.
Patrick Industries, Inc. PATK Stock As A Short-Term Trade Using Options
Traders with shorter time horizons can trade options to profit from PATK stock’s price movements, while protecting their portfolios from volatility.
I am looking at the contracts with the 5/19 expiration date.
The $55, $65 & $60 call options are all in-the-money, listed from highest to lowest level of open interest.
The $70 & $75 puts are also all in-the-money, with the former being more liquid than the latter strike.
Tying It All Together
PATK stock has many interesting attributes that traders & investors will find appealing.
Investors will like their valuation metrics & sustainable dividend yield, but may want to look deeper into recent growth trouble & their balance sheet.
Traders will like their recent technical performance, but may be disappointed by how liquid their options are.
Overall, it is worth taking a closer look into PATK stock to see how it fits into your portfolio strategy.
*** I DO NOT OWN SHARES OR OPTIONS CONTRACT POSITIONS IN PATK STOCK AT THE TIME OF PUBLISHING THIS ARTICLE ***
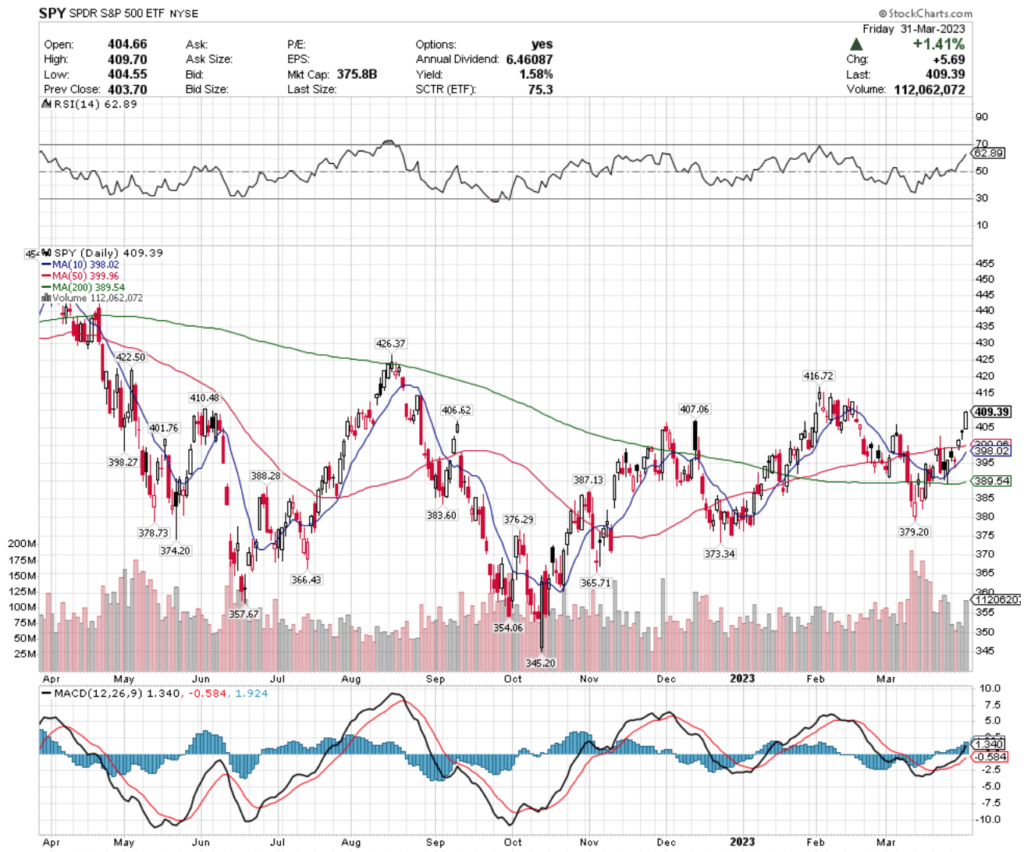
SPY, the SPDR S&P 500 ETF gained +3.45% this past week, with trading volumes falling more back in line with the average over the past year.
SPY ETF – SPDR S&P 500 ETF’s Technical Performance Over The Past Year
Their MACD is very bullish, but their 62.89 RSI is approaching overbought territory.
Resistance after the past week’s rally is at $410.48, $416.72 & $422.50, with support at the $407.06, $406.62 & $401.76/share price level.
QQQ, the Invesco QQQ Trust ETF added +3.23% over the past week, with volumes also returning more to the average level for the past 52 weeks.
QQQ ETF – Invesco QQQ Trust ETF’s Technical Performance Over The Past Year
At 68, QQQ’s RSI is almost overbought, although their MACD is still showing bullish signals.
QQQ has support at the $313.93, $312.16 & $310.83 (10 day moving average), with overhead resistance at the $327.77, $331.51 & $338.56/share price levels.
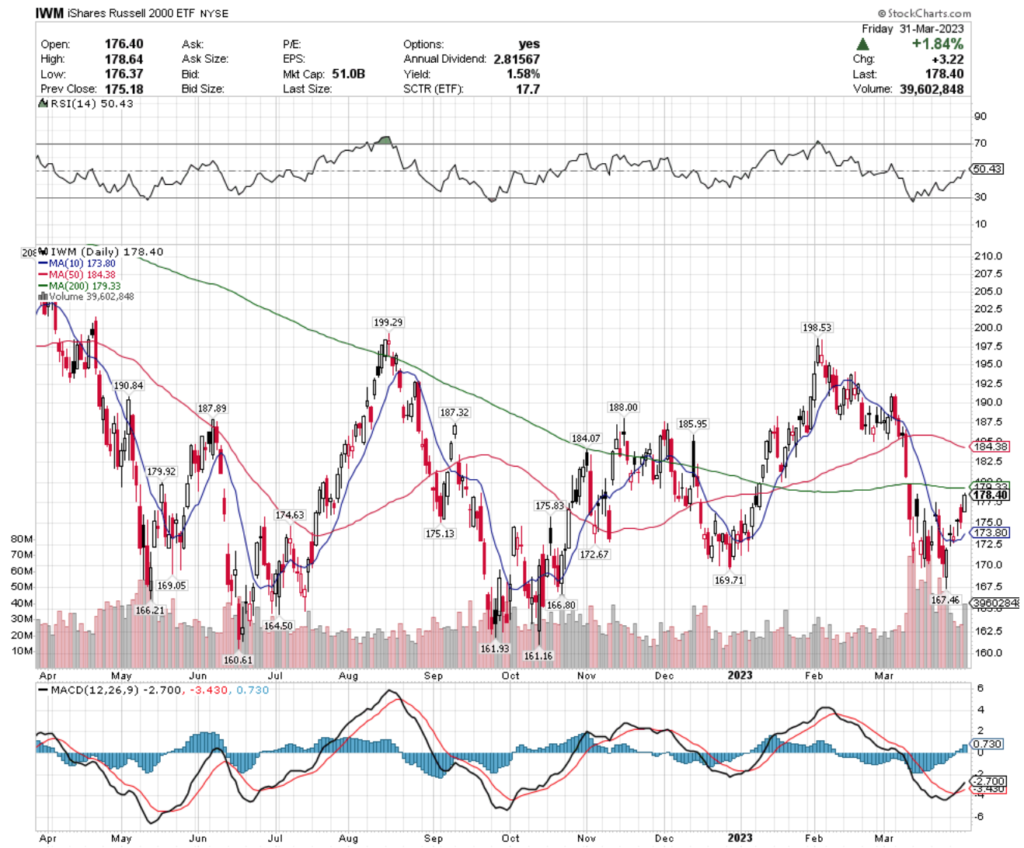
IWM ETF – iShares Russell 2000 ETF’s Technical Performance Over The Past Year
They bucked the trend & has above average volume, during a volatile, but successful week.
Their RSI is neutral at 50.43 & MACD is bullish, but their 200 day moving average is 0.52% away & will be an interesting resistance point to watch for more insight into their future performance.
IWM has support at the $175.83, $175.13 & $174.63/share price levels, with resistance at the $179.33 (200 day moving average), $179.92 & $184.07/share price levels.
Let’s dive into the week’s report.
Global Gold Miners (RING), Europe (EURL), North American Tech (IGM) & Global Comm Services (IXP) Are All Bullishly Leading The Market
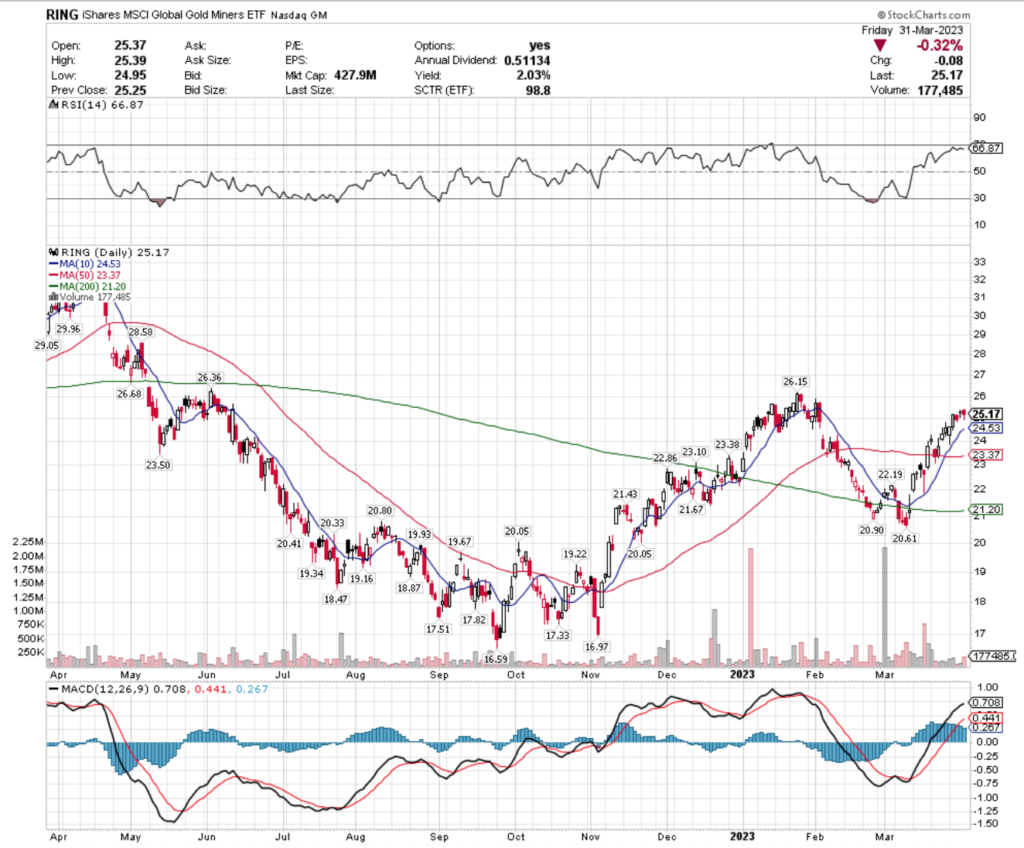
RING, the iShares MSCI Global Gold Miners ETF’s Technical Performance Over The Past Year
Their RSI is approaching overbought at 66.87 & their MACD has begun curling over, signaling a cool down period in the near-term.
Given that their distribution yield is only 2.03% for long-term shareholders, it may be wisest to wait to see how they behave at their next test of support or trade an options strategy rather than buying long shares into uncertainty.
RING has support at the $24.53 (10 day moving average), $23.50, $23.38 & $23.37 (50 day moving average), with resistance overhead at the $26.15, $26.36, $26.68 & $28.58/share price levels.
EURL, the Direxion Daily FTSE Europe Bull 3x Shares ETF’s Technical Performance Over The Past Year
Their MACD is still bullish, while their RSI is neutral & recent trading volumes have been about average compared to the year prior.
After Thursday & Friday’s candlesticks & the back to back gap up day mid-week EURL should also be approached with caution, as their 1.68% distribution yield will only provide so much safety from a near-term shakeup in price.
EURL has support at the $21.15, $20.83 (50 day moving average), $20.74 & $19.95/share price levels, with resistance at the $21.83, $22.52, $22.73 & $23.08/share price levels, which are the key areas to be watching their behavior at currently.
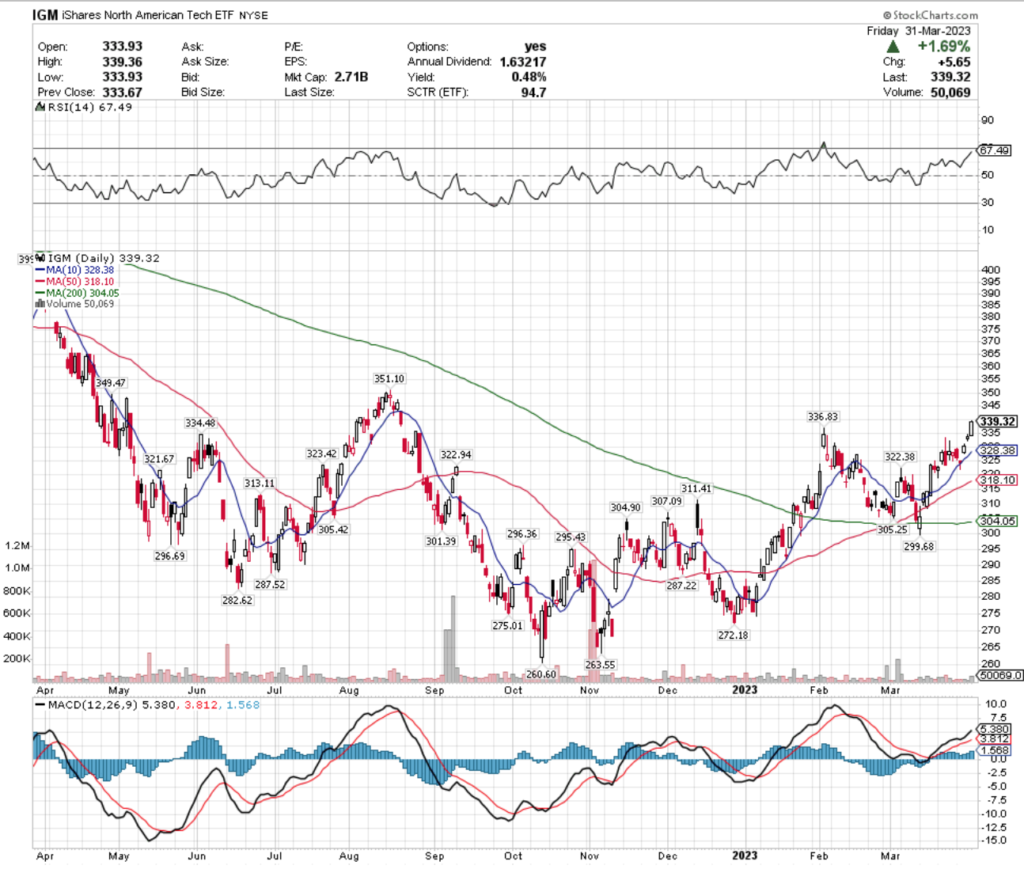
IGM ETF – iShares North American Tech ETF’s Technical Performance Over The Past Year
Their RSI is approaching overbought conditions at 67.49, as their MACD begins to show signals of exhausting.
Recent trading volumes have been below average compared to the year prior & their 0.48% distribution yield will not provide much cushion for safety, making IGM another candidate for options trading while waiting for their price to stabilize.
IGM has support levels to keep an eye on at the $336.83, $334.48, $328.38 (10 day moving average) & $323.42/share price level, with resistance at the $349.47, $351.10, $352.90 & $359.78/share levels.
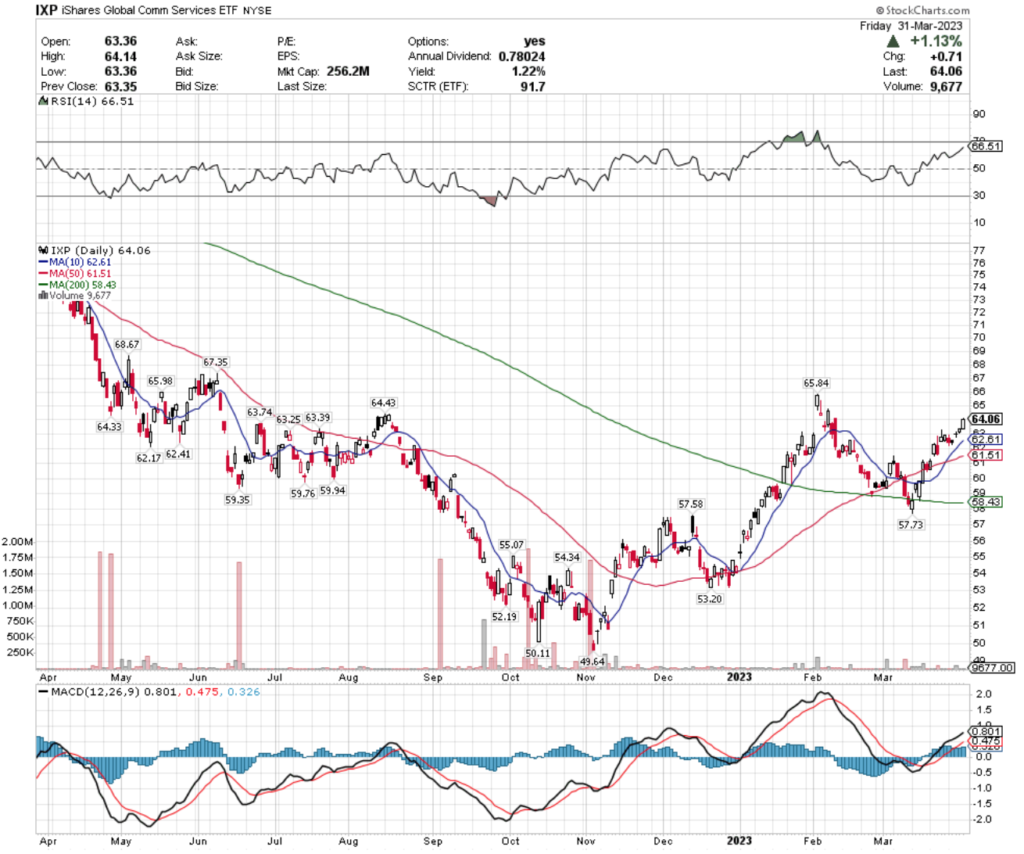
IXP ETF – iShares Global Comm Services ETF’s Technical Performance Over The Past Year
Their RSI is also approaching the overbought level & their MACD is beginning to show signals of losing momentum.
While long-term holders will receive 1.22% annually in the form of distributions, patchy low trading volumes raise concerns about IXP’s strength in the near-term & signal to hold off on a long-term position entry.
IXP has support at the $63.74, $63.39, $63.25 & $62.61 (10 day moving average) price levels, with resistance at the $64.33, $64.43, $65.84 & $65.98/share price levels.
Banks (KBE), Genomics Immunology and Healthcare (IDNA), Mortgage Real Estate (REM) & Brazil (BRZU) Are All Bearishly Lagging The Market
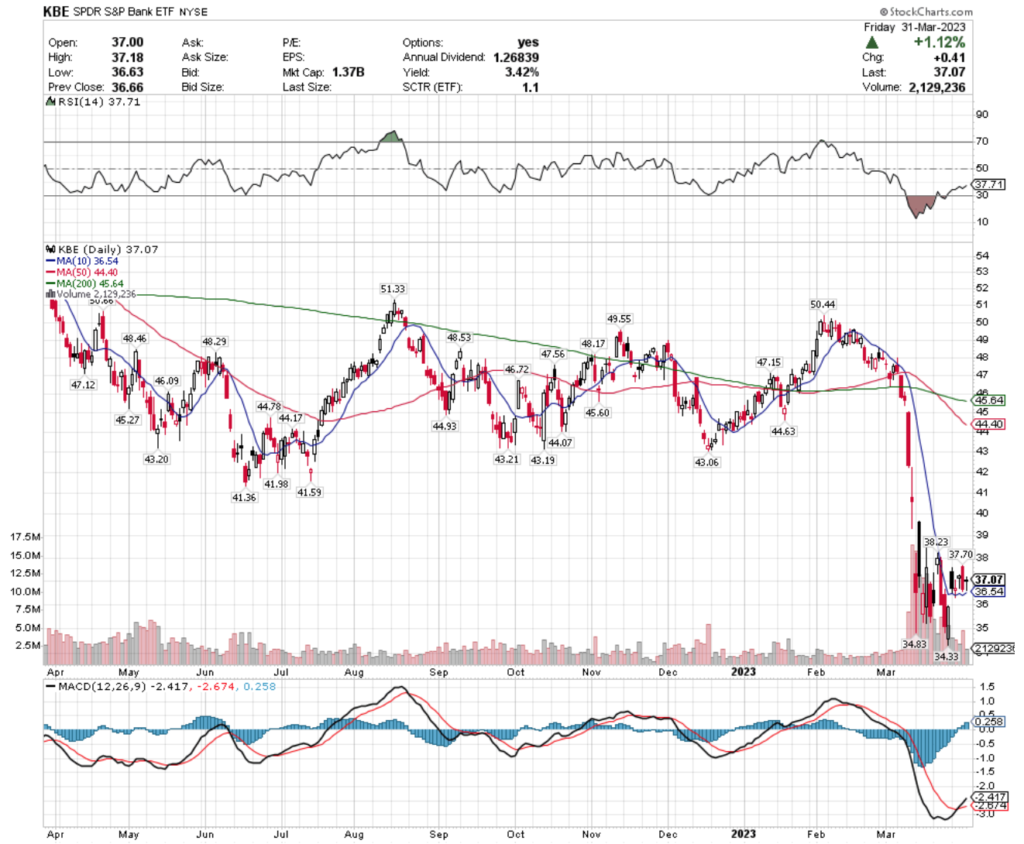
KBE, the SPDR S&P Bank ETF has lost -30.32% over the past year, losing -30.49% from the high of April 2022, but reclaiming +7.89% (ex-distributions) since their recent low.
KBE ETF – SPDR S&P Bank ETF’s Technical Performance Over The Past Year
Their RSI has recently recovered from being in oversold territory but remains on the oversold end of neutral after suffering sharp declines in March 2023 & MACD has crossed over bullishly while the price has consolidated over the past month.
Recent trading volumes have been very high compared to the year prior, and their 3.42% annual distribution yield will provide some protection against loss for long-term holders, but the price may still require more time to settle down making any near-term moves in the name without options protection unwise.
KBE has support at the $36.54 (10 day moving average), $34.83 & $34.33/share price levels, with resistance at the $37.70, $38.23 & $41.36/share price levels.
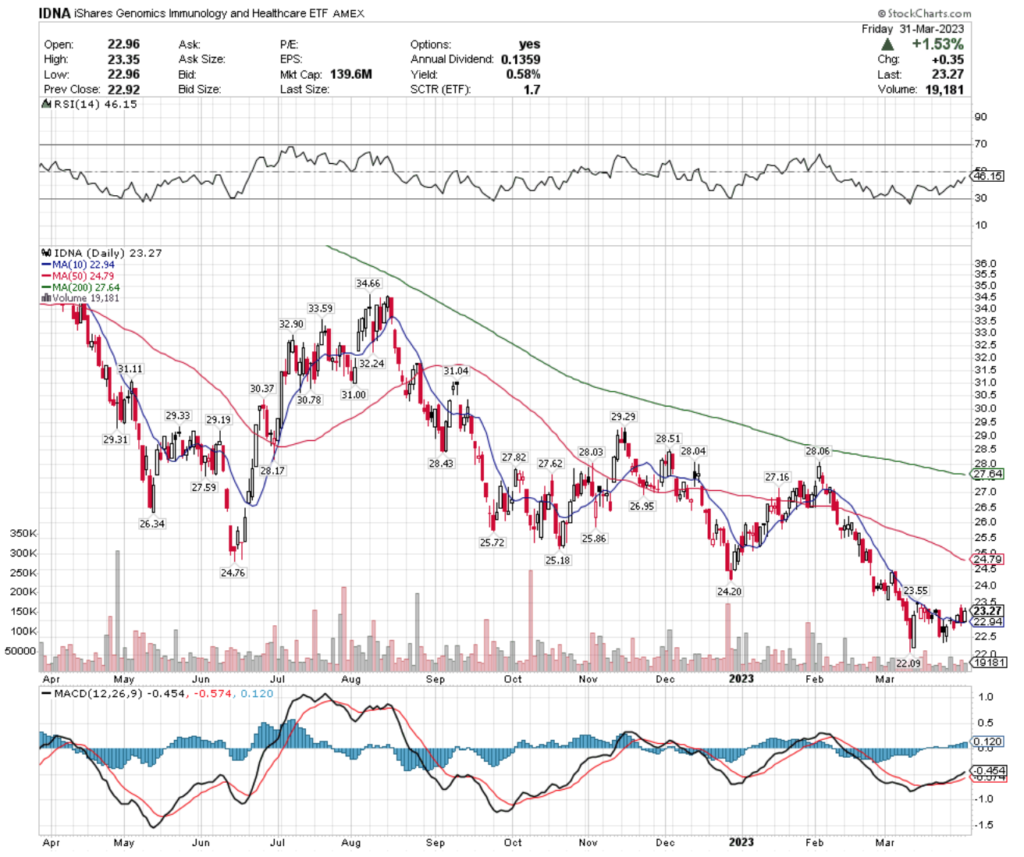
IDNA ETF – iShares Genomics Immunology & Healthcare ETF’s Technical Performance Over The Past Year
Their RSI is approaching neutral again, while their MACD is still bullish, but recent trading volumes have been very light compared to the year prior.
IDNA’s 0.58% distribution yield will not provide much protection for investors, so waiting to see how their price behaves around support/resistance areas will be imperative to find the most opportune entry point.
IDNA has support at the $22.94 & $22.09/share price levels, with resistance at the $23.55, $24.20 & $24.76/share price levels.
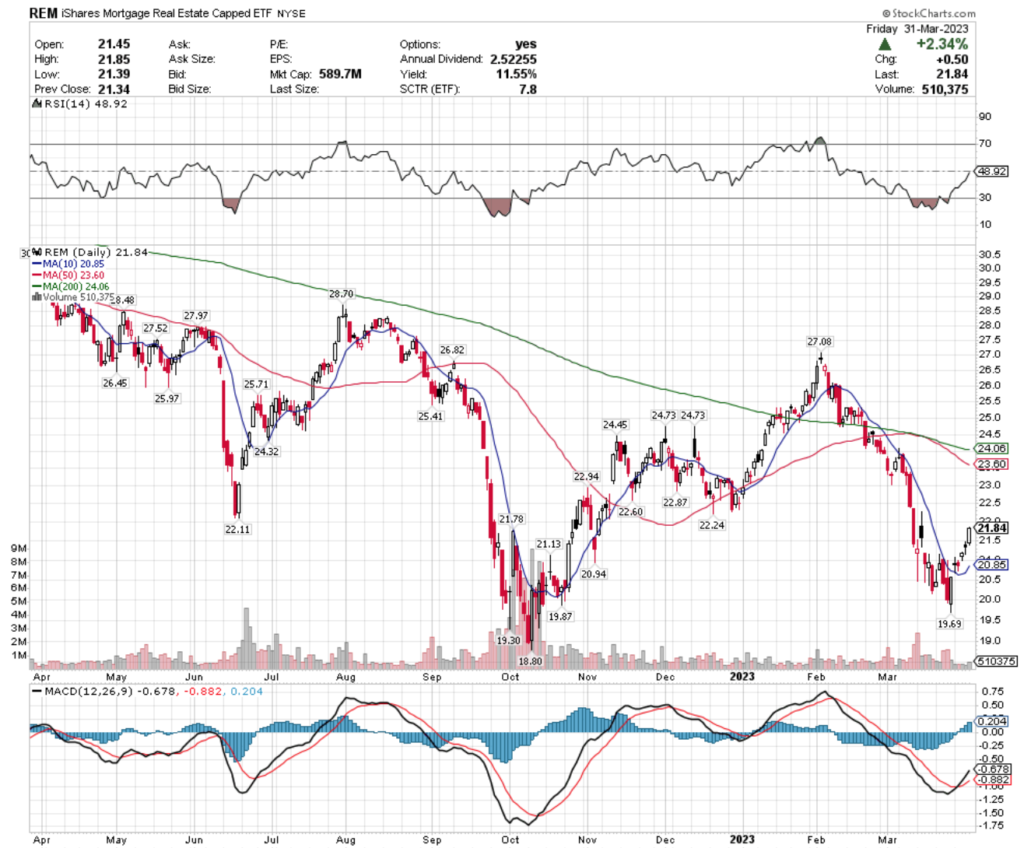
REM, the iShares Mortgage Real Estate Capped ETF has lost -26.34% over the past 52 weeks, losing -27.56% since their high in April 2022, while regaining +16.17% since their low in October 2022 (ex-distributions).
REM ETF – iShares Mortgage Real Estate Capped ETF’s Technical Performance Over The Past Year
With a bullish MACD, REM’s RSI has recovered to just below neutral levels after their price slid most of the past 2 months.
While long-term holders receive an 11.55% distribution yield, their shaky recent trading volumes show that there is still uncertainty around where to value these shares at & it would be wisest to approach with caution.
REM has support at the $21.78, $21.13, $20.94 & $20.85 (10 day moving average)price levels, with resistance at the $22.11, $22.24, $22.60 & $22.87/share price levels.
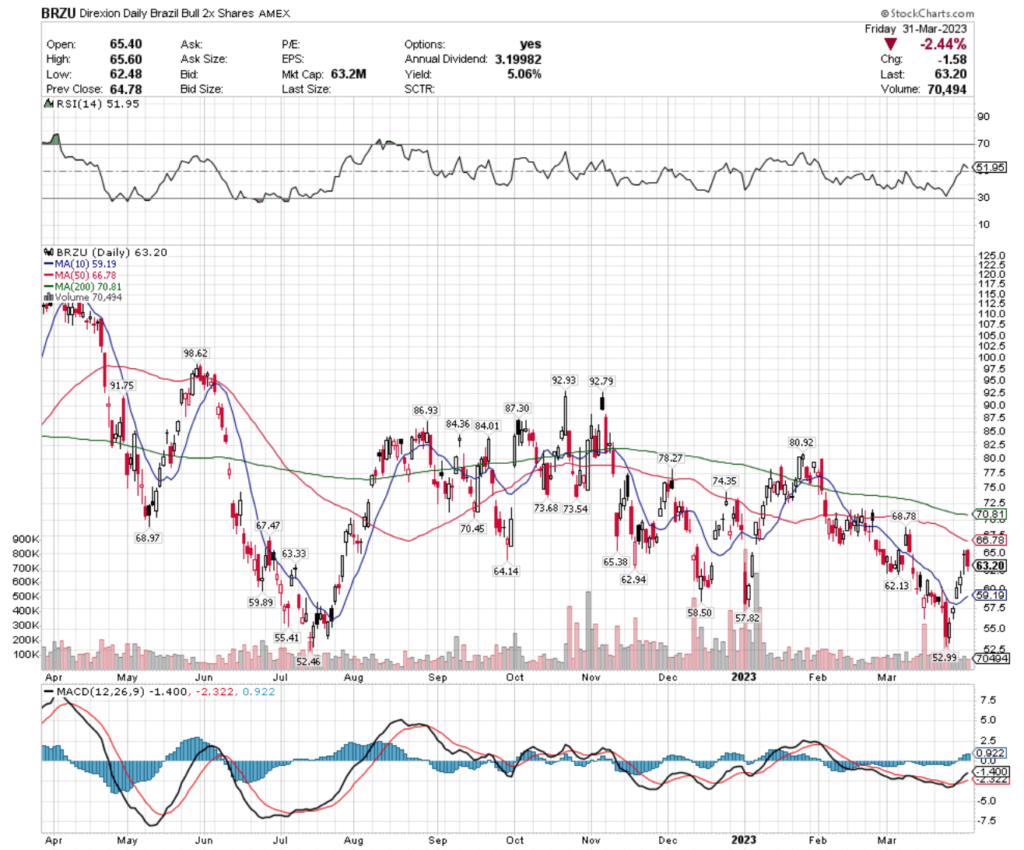
BRZU, the Direxion Daily Brazil Bull 2x Shares ETF has lost -43.75% over the past year, shedding -48.5% since their high of April 2022 & has gained +20.47% (ex-distributions) since their low in July 2022.
BRZU ETF – Direxion Daily Brazil Bull 2x Shares ETF’s Technical Performance Over The Past Year
Their MACD is beginning to show signs of waning enthusiasm, as their RSI is is re-approaching neutral, which when paired with their below average recent trading volumes is a good reason to wait & see how they interact with their nearest support/resistance levels before making an investment in them.
While their distribution yield is 5.06%, that is not enough protection to justify entry into a long-term position here.
BRZU has support at the $62.94, $62.13, $59.89 & $59.19 (10 day moving average) price levels, with resistance overhead at the $63.33, $64.14, $65.38 & $67.47/share price levels.
Tying It All Together
This week we hit the pavement running Monday, with St. Louis Fed President Bullard speaking at 8:30 am, followed by S&P final U.S. Manufacturing PMI at 9:45 am, ISM Manufacturing & Construction Spending data at 10 am & closing out with Fed. Governor Cook speaking at 4:15 pm.
Factory Orders & Job Openings data get reported on Tuesday at 10 am & at 6 pm Cleveland Fed President Mester speaks.
On Wednesday we get the ADP Employment data at 8:15 am, with U.S. Trade Balance data at 8:30 am, S&P Final U.S. Services PMI data at 9:45 am & the ISM Services report at 10 am.
Thursday kicks off with Initial Jobless Claims & Continuing Jobless Claims data at 8:30 am, with St. Louis Fed President Bullard Speaking at 10 am.
We close out with the US Unemployment Report, US Unemployment Rate, Average Hourly Wages & Average Hourly Wages Y-o-Y at 8:30 am on Friday, followed by Consumer Credit data at 3 pm.
See you back here next week!
*** I DO NOT OWN SHARES OR OPTIONS CONTRACT POSITIONS IN SPY, QQQ, IWM, RING, EURL, IGM, IXP, KBE, IDNA, REM or BRZU AT THE TIME OF PUBLISHING THIS ARTICLE ***
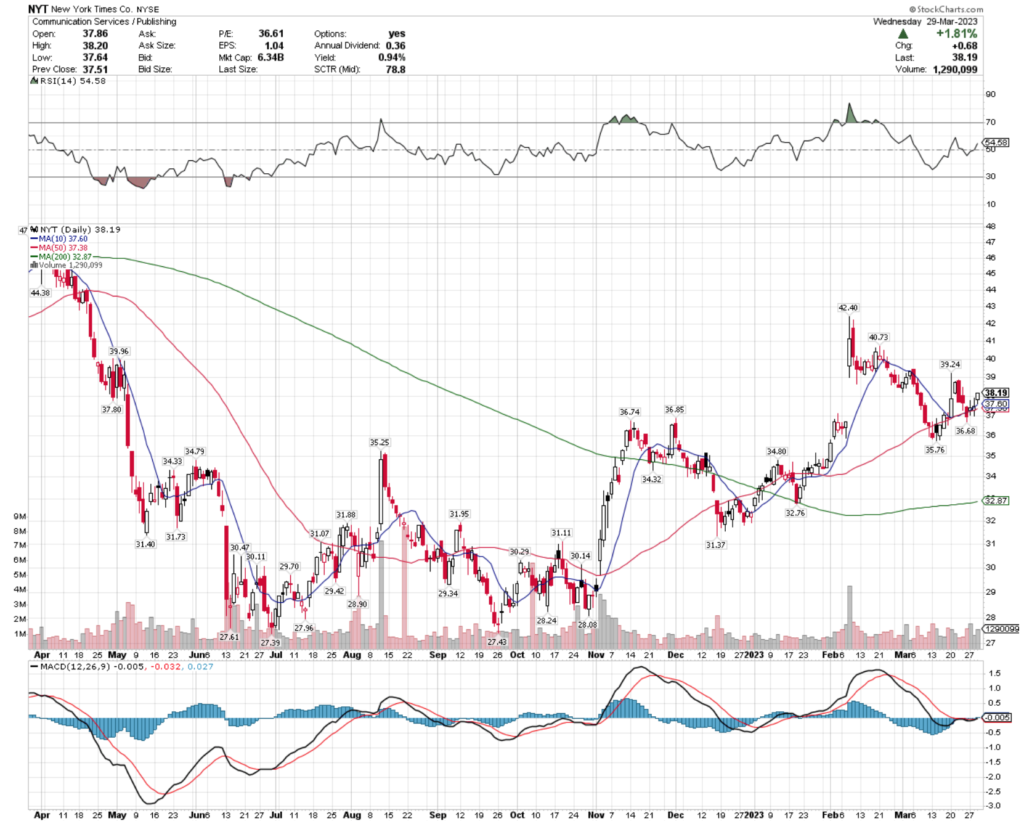
New York Times Co. stock trades under the ticker NYT & has shown recent bullishness that traders & investors should research further into.
NYT stock closed at $38.19/share on 3/29/2023.
New York Times Co. NYT Stock’s Technical Performance Broken Down
New York Times Co. NYT Stock’s Technical Performance Over The Past Year
NYT Stock Price: $38.19
10 Day Moving Average: $37.60
50 Day Moving Average: $37.38
200 Day Moving Average: $32.87
RSI: 54.58
MACD: -0.005
Yesterday, NYT stock completed a bullish MACD crossover, gaining +1.81% on the day’s session.
Their RSI is neutral & recent trading volumes have been about average compared to the year prior.
NYT stock has support at the $37.80, $37.60 (10 day moving average) & $37.38/share price levels, with resistance at the $39.24, $39.96 & $40.73/share price levels.
New York Times Co. NYT Stock As A Long-Term Investment
Long-term oriented investors will like NYT stock’s 36.22 P/E (ttm), but may find their 3.88 P/B (mrq) to be a bit too rich.
They recently reported 12.5% Quarterly Revenue Growth Y-o-Y, with 1.3% Quarterly Earnings Growth Y-o-Y.
Their balance sheet looks solid, with $347.36M in Total Cash (mrq) & $69.03M of Total Debt (mrq).
NYT stock pays a modest 0.96% dividend, which appears to be sustainable in the long-run, as their payout ratio is 34.62%.
93.54% of NYT stock’s outstanding share float is owned by institutional investors.
New York Times Co. NYT Stock As A Short-Term Trade Using Options
Short-term focused traders can use options to hedge their portfolios against volatility, while profiting from price movements in NYT stock.
I am looking at the contracts with the 4/21 expiration date.
The $38, $37 & $36 call options are all in-the-money, listed from highest to lowest level of open interest.
The $41, $39 & $40 puts are also all in-the-money, with the former being more liquid than the latter strikes.
Tying It All Together
NYT stock has many interesting attributes that traders & investors should look deeper into.
Investors will like their balance sheet & modest, but sustainable dividend.
Traders will like their recent technical performance & liquid options.
Overall, it is worth taking a closer look into NYT stock to see how it fits into your portfolio strategy.
*** I DO NOT OWN SHARES OR OPTIONS CONTRACT POSITIONS IN NYT STOCK AT THE TIME OF PUBLISHING THIS ARTICLE ***
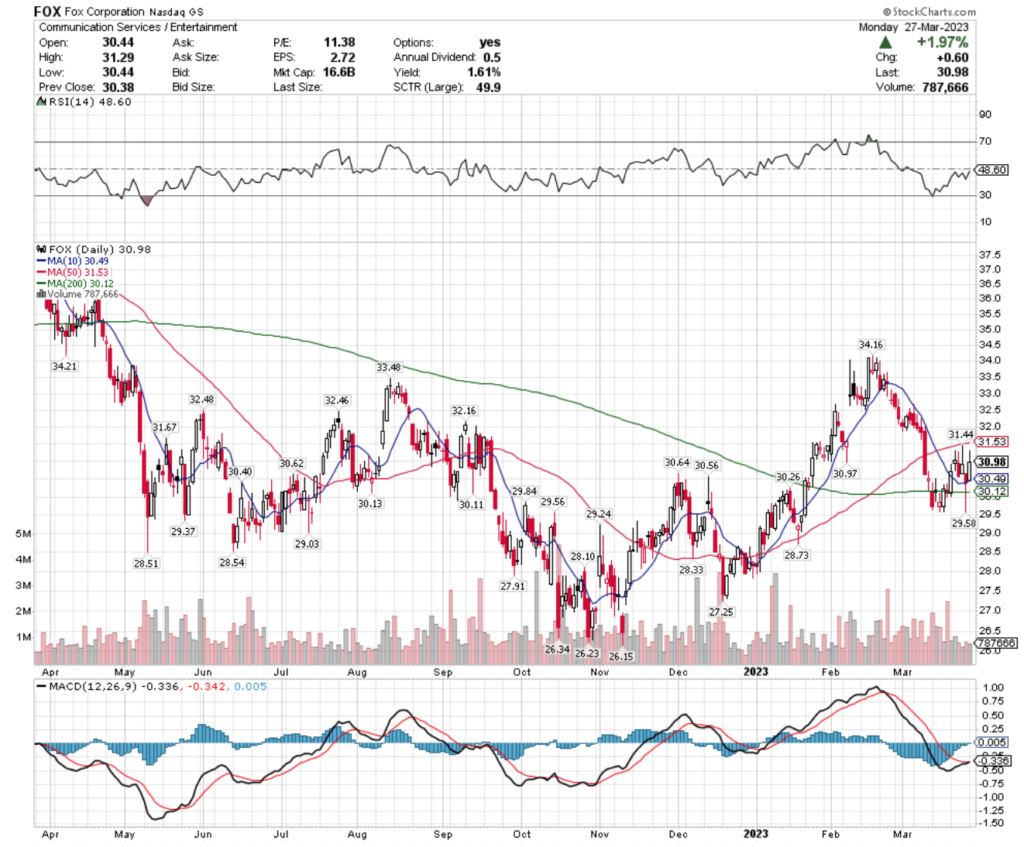
Fox Corporation stock trades under the ticker FOX & has shown recent bullishness that traders & investors should research further into.
FOX stock closed at $30.98/share on 3/27/2023.
Fox Corporation FOX Stock’s Technical Performance Broken Down
Fox Corporation FOX Stock’s Technical Performance Over The Past Year
FOX Stock Price: $30.98
10 Day Moving Average: $30.49
50 Day Moving Average: $31.53
200 Day Moving Average: $30.12
RSI: 48.6
MACD: -0.336
Yesterday, FOX stock completed a bullish MACD crossover, gaining +1.97% on the day’s session.
Their RSI is neutral & recent trading volumes have been about average.
FOX stock has support at the $30.64, $30.62 & $30.56/share price levels, with resistance at the $31.44, $31.53 (50 day moving average) & $31.67/share price levels.
Fox Corporation FOX Stock As A Long-Term Investment
Long-term oriented investors will like FOX stock’s 11.07 P/E (ttm) & their 1.39 P/B (mrq).
Their balance sheet will require a more thorough examination, with $4.06B of Total Cash (mrq) & $8.22B of Total Debt (mrq).
FOX stock pays a 1.61% dividend, which appears to be sustainable as their payout ratio is 18.01%.
54.26% of FOX stock’s outstanding share float is owned by institutional investors.
Fox Corporation FOX Stock As A Short-Term Trade Using Options
Traders focused on shorter time horizons can trade options to profit from FOX stock’s price movements, while protecting their portfolios from volatility.
I am looking at the contracts with the 4/21 expiration date.
The $30, $25 & $20 call options are all in-the-money, with the former being more liquid than the latter two strike prices.
The $35 & $40 puts are also both in-the-money, listed from highest to lowest level of open interest.
Tying It All Together
FOX stock has many interesting attributes that traders & investors are sure to find appealing.
Investors will like their valuation metrics, as well as their sustainable dividend.
Traders will like their recent technical performance, but may wish that their options were more liquid.
Overall, it is worth taking a closer look into FOX stock to see how it fits into your portfolio strategy.
*** I DO NOT OWN SHARES OR OPTIONS CONTRACT POSITIONS IN FOX STOCK AT THE TIME OF PUBLISHING THIS ARTICLE ***