SPY, the SPDR S&P 500 ETF gained +1.46% this past week, lagging the performance of the NASDAQ names.
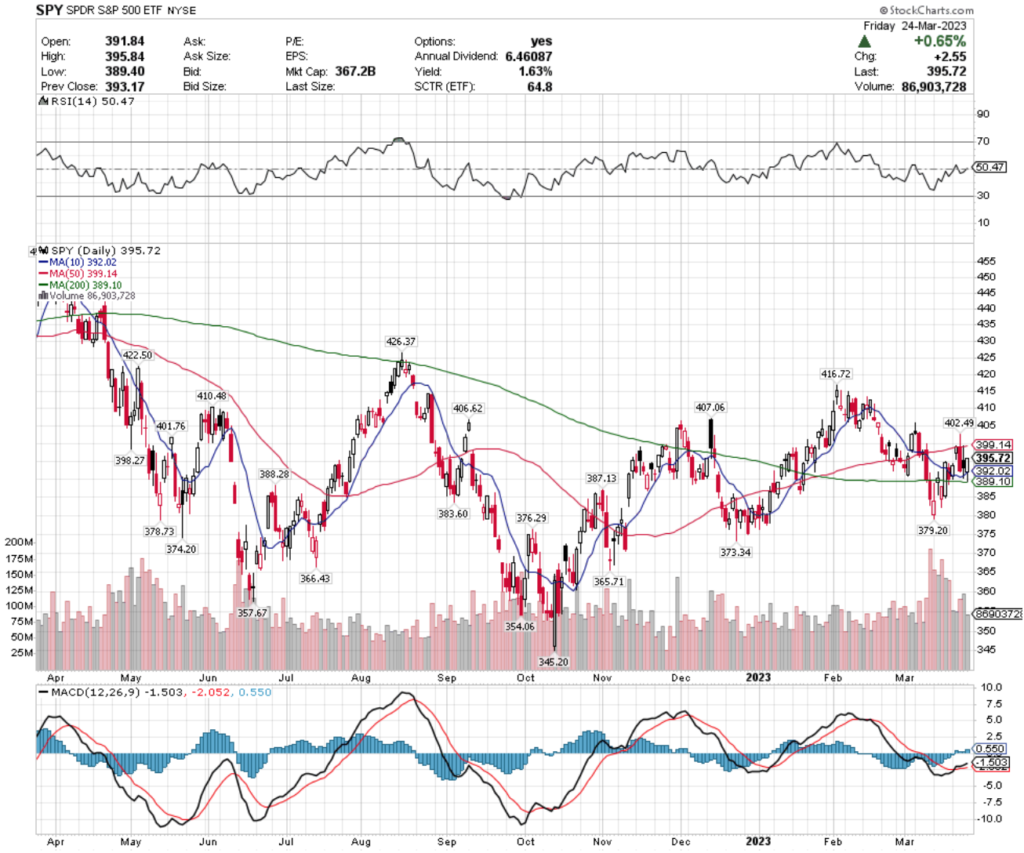
Their RSI is neutral & recent trading volumes have been above average compared to the year prior.
SPY’s MACD is showing signs of slowing down, with signals of a downtrend from Tuesday on last week.
SPY has support at the $392.02 (10 day moving average), $389.10 (200 day moving average), $388.28 & $387.13/share price levels, with overhead resistance at the $398.27, $399.14 (50 day moving average), $401.76 & $402.49/share price levels.
QQQ, the Invesco QQQ Trust ETF closed +1.97% higher this week vs. last, outperforming the large caps of the S&P 500, as well as the smaller cap Russell 2000 stocks for the week.
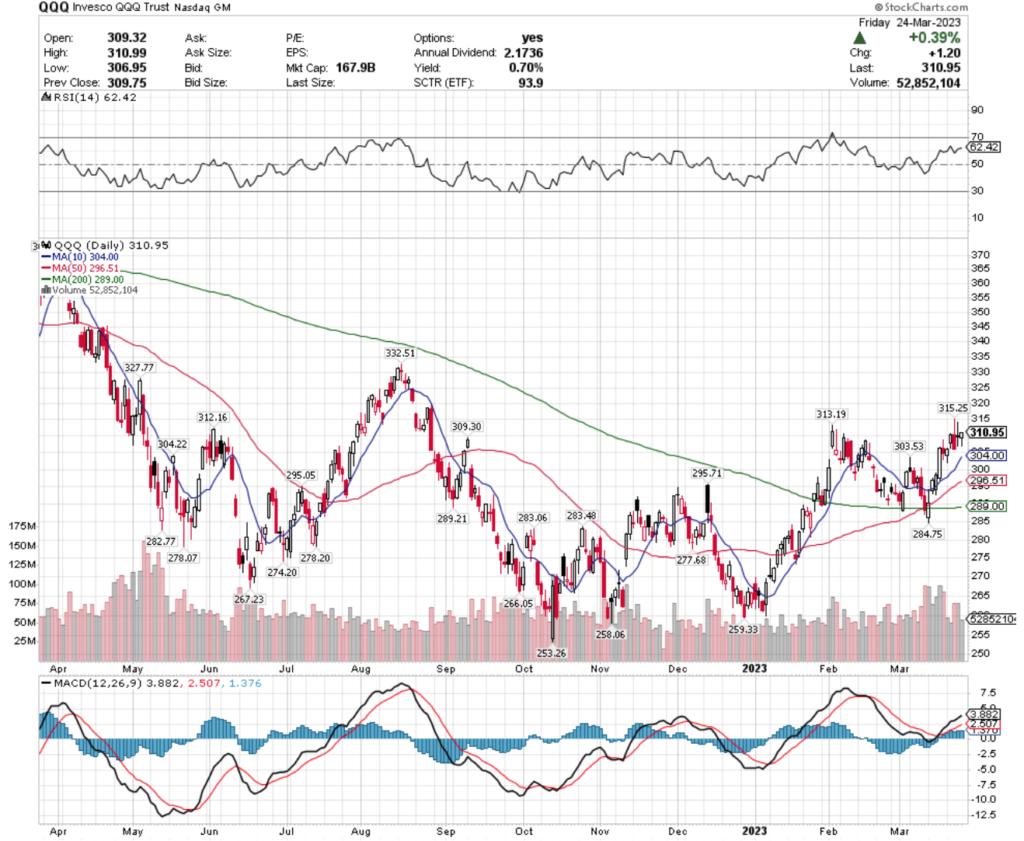
As a result, their RSI is on the more overbought end of neutral (62) & their MACD is bullish, but beginning to show signs of weakness as it rolls over & recent trading volumes have been about average compared to the year prior.
QQQ has support at the $309.30, $304.22, $304.00 (10 day moving average) & $303.53/share price levels, with resistance at the $312.16, $313.19, $315.25 & $327.77/share price levels.
IWM, the iShares Russell 2000 ETF gained +0.69% this past week, as small cap names did not enjoy the same strength as their S&P 500 & NASDAQ peers.
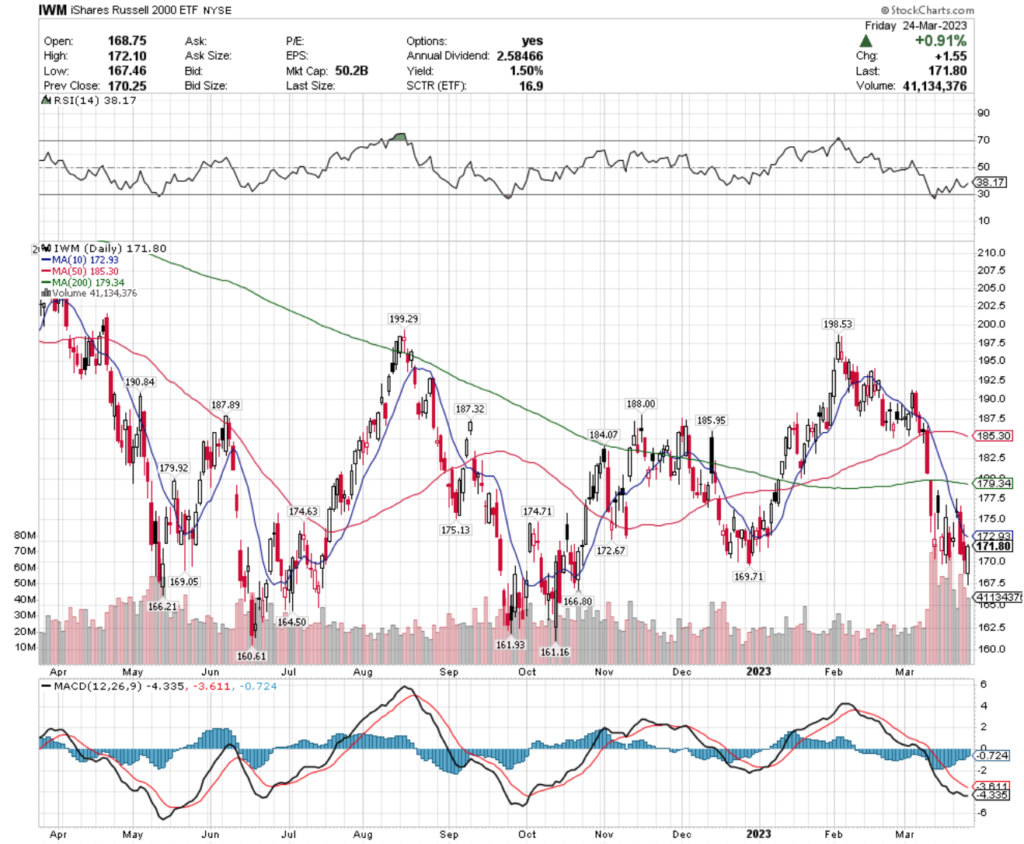
Their RSI is on the oversold end of neutral at 38, as their MACD is beginning to righten after their freefall at the beginning of March 2023.
Trading volumes for IWM have been very high this past month, which should advice market participants to be careful.
IWM has support at the $169.71, $169.05, $166.80 & $166.21/share price levels, with resistance at the $172.67, $172.93 (10 day moving average),$174.63 & $174.71/share.
Let’s dive into some of the best & worst performing sectors & geo-locations based on this week’s technical rating data results!
Semiconductors (SMH), U.S. Technology (IYW), Silver Miners (SIL) & Japan Small Cap Dividends (DFJ) Are All Bullishly Leading The Markets
SMH, the VanEck Vectors Semiconductors ETF has lost -6.73% over the past year, but has reclaimed 54.23% (ex-distributions) since their 52 week low in October of 2022.
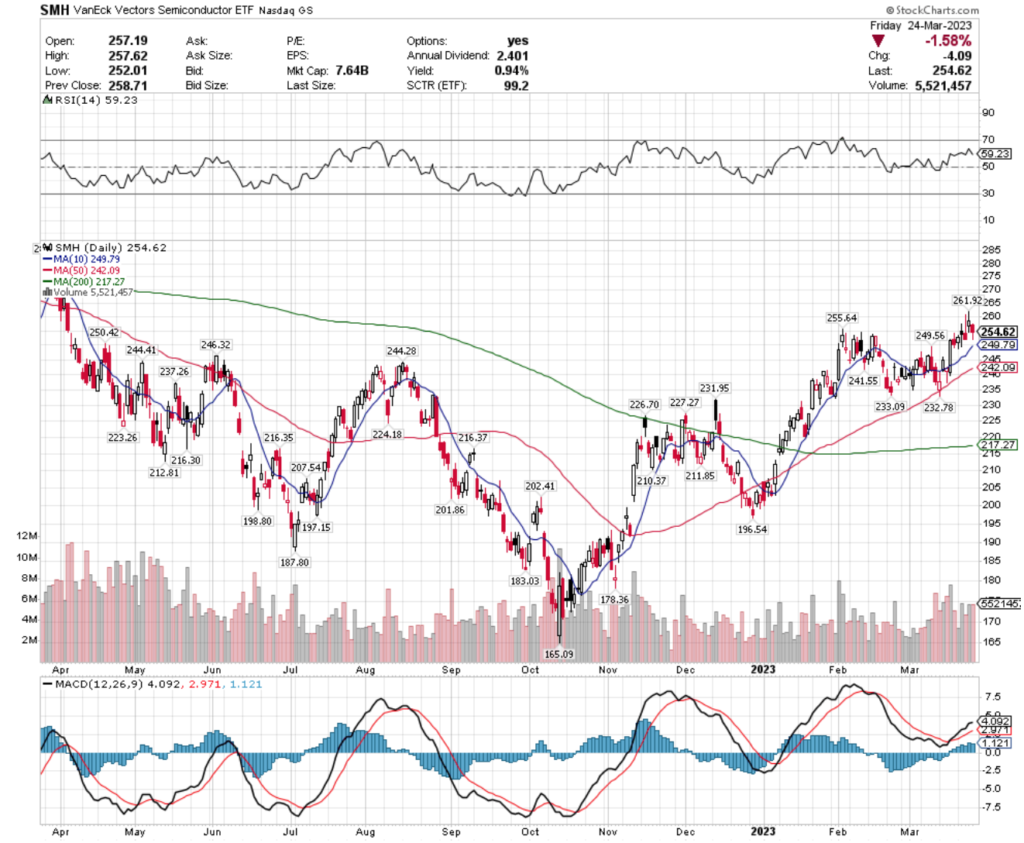
Their RSI is approaching the overbought end of neutral at 59, with recent trading volumes being slightly below average compared to the year prior.
Their MACD is beginning to signal that there may be some cooling off to come in the near-term, as it turns bearish, and their 0.94% distribution for long-term holders will not provide much cushion for investors.
The presence of both a shooting star & hanging man candlestick in last week’s chart signals that unless you’re using an options strategy for protection to wait & see how it behaves at its support levels.
SMH has support at the $250.42, $249.79 (10 day moving average), $249.56 & $246.32/share price levels, with resistance overhead at the $255.64, $261.92 & $267.30/share price levels.
IYW, the iShares U.S. Technology ETF has lost -12.5% over the past year, but has rebounded +29.98% (ex-distributions) since their 52 week low in October of 2022.
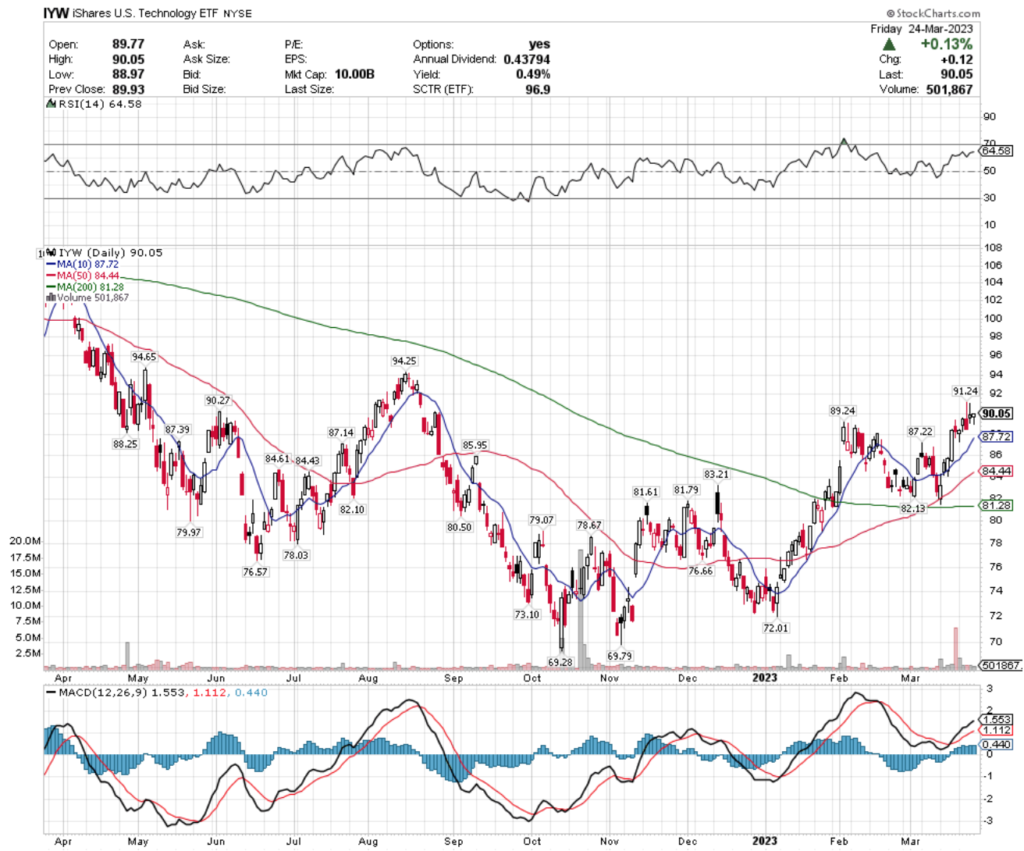
Their RSI is approaching overbought, and recent volumes have been above average compared to the year prior.
Their MACD is beginning to show signs of waning enthusiasm & their distribution only offers a modest 0.49% cushion for protection from losses for long-term holders, suggesting that in the near-term this is a better idea for an options trade than a long-term investment.
IYW has support at the $89.24, $88.25, $87.72 (10 day moving average), $87.39 & $87.22/share price level, with resistance at the $90.27, $91.24, $94.25 & $94.65/share price levels.
SIL, the Global X Silver Miners ETF has lost 20.6% over the past year, but has bounced back +38.77% (ex-distributions) from their lowest point of September 2022.
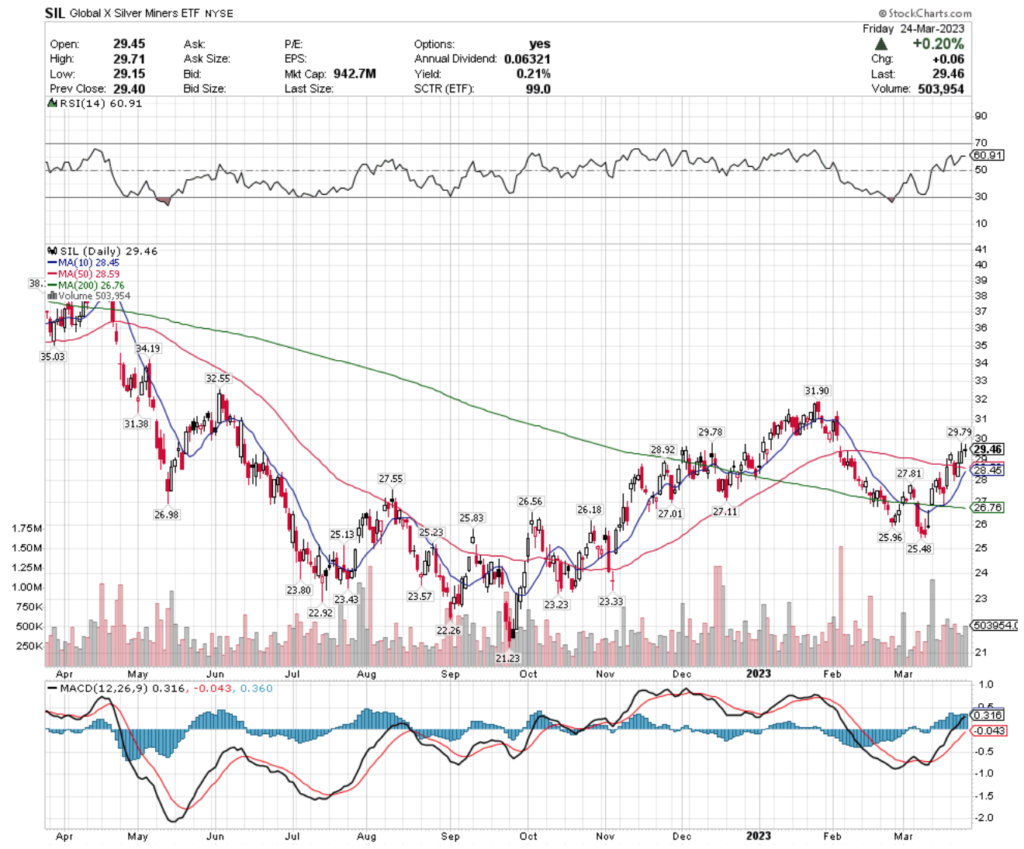
Their RSI is on the overbought end of neutral, with recent trading volumes being average compared to the year prior.
Their MACD is beginning to look exhausted, and their distribution only provides 0.21% of an annualized cushion, signaling that it is best to see how Friday’s doji candlestick plays out & whether a morning star pattern is formed or not (signaling a bearish reversal).
While waiting, trading options can generate profits that can be parlayed into buying long-shares once things become more clear.
SIL has support at the $28.92, $28.59 (50 day moving average), $28.45 (10 day moving average) & $27.81/share price level, with resistance levels at $29.78, $29.79, $31.38 & $31.90/share.
DFJ, the WisdomTree Japan SmallCap Dividend Fund has gained +0.99% over the past year, has also climbed +21.38% (ex-distributions) since its low in October 2022.
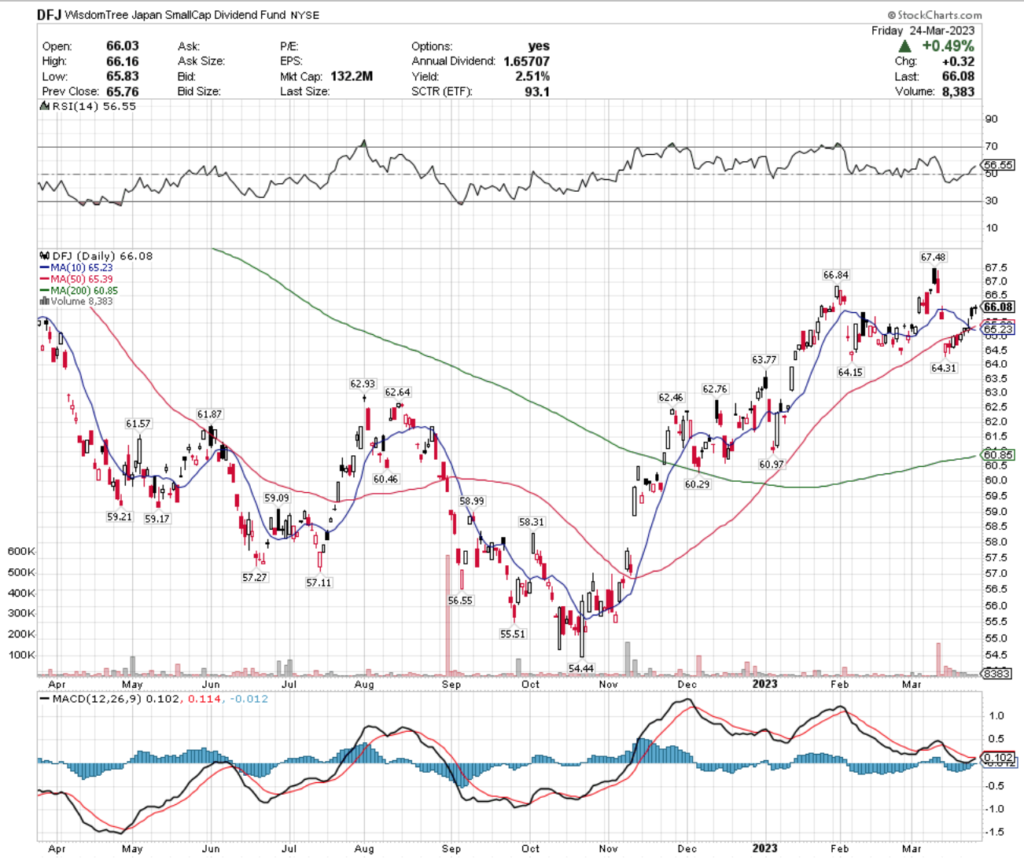
Their MACD looks poised for a bullish crossover in the near-term, although their past couple of candlesticks will need to maintain their momentum & avoid filling the gap from last Thursday.
Recent trading volumes have been above average compared to the year prior & their RSI is neutral.
DFJ pays a 2.54% annual distribution, which will shield long-term holders from some losses in volatile environments & they have options which can be used for additional downside protection.
DFJ has support at $64.61 (50 day moving average), $64.45 (10 day moving average), $63.55 & $63.39/share & overhead resistance at the $66.05 & $66.68/share price levels from the past 52 weeks.
World Equities (URTH), Risk Parity (RPAR), Pharmaceuticals (PPH) & Sweden (EWD) Are All Bearishly Lagging The Markets
URTH, the iShares MSCI World ETF has lost -10.15% over the past year, falling -12.09% (ex-distributions) from their 52 week high in April 2022.
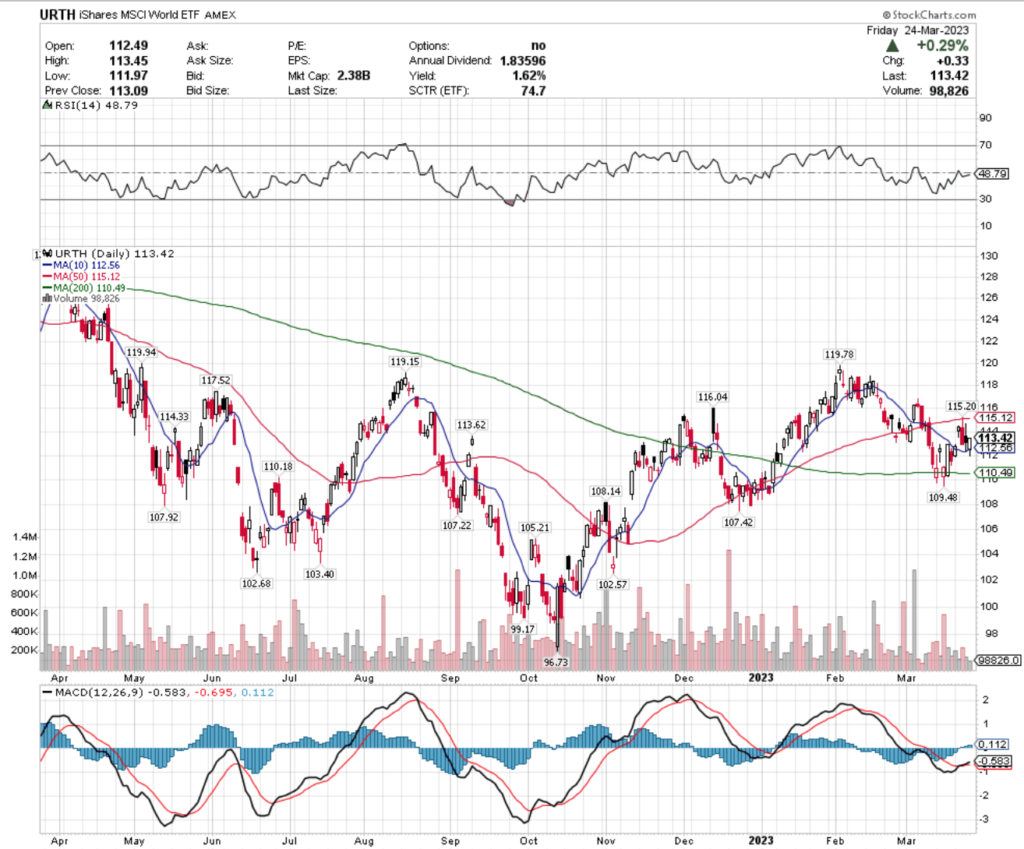
Recent trading volumes for URTH have been below average & their RSI is neutral at 51.
Their MACD is slightly bullish, but last week’s candlesticks signal that there is still a downtrend.
Long-term holders will receive 1.61% of distribution as a cushion from losses, but unless trading options, it would be wisest to wait for URTH to get on more stable footing before investing.
URTH has support at the $112.56 (10 day moving average), $110.49 (200 day moving average), $110.18 & $109.48/share price levels, with resistance at the $113.62, $114.33, $115.12 (50 day moving average) & $115.20/share price levels.
RPAR, the RPAR Risk Parity ETF has dropped -15.48% over the past year, losing -16.03% (ex-distributions) from their 52 week high achieved in March 2022.
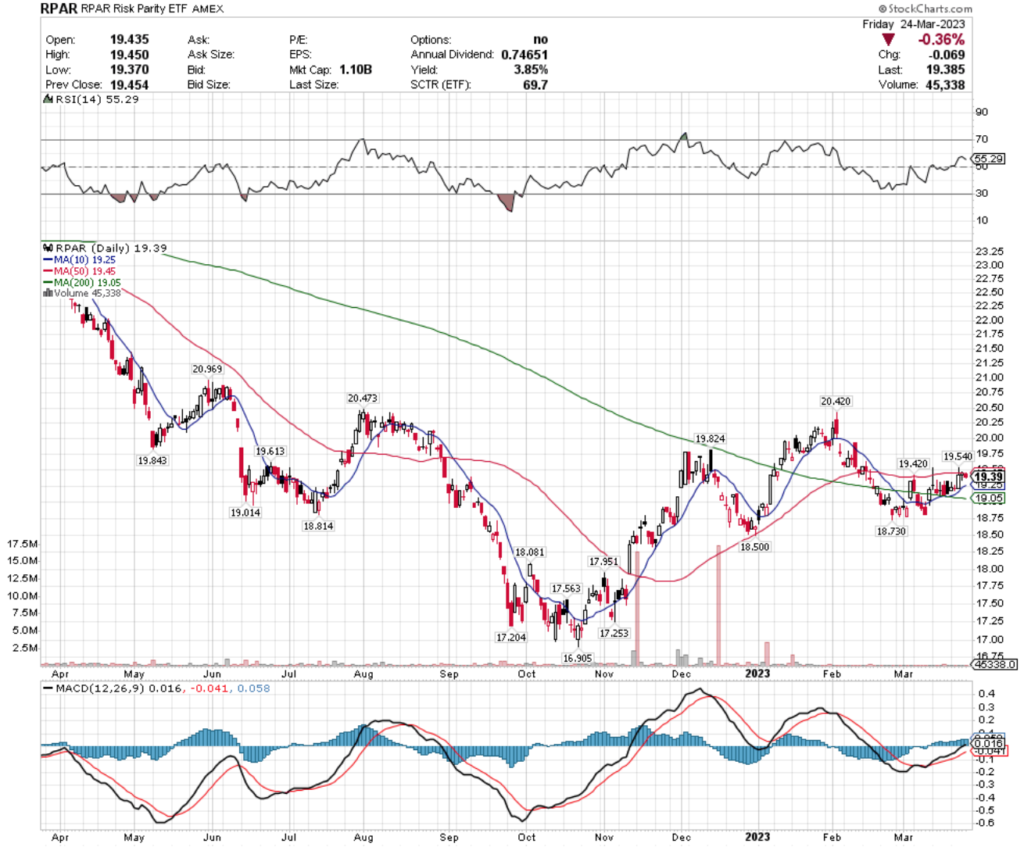
Their recent trading volumes have been below average & their RSI is neutral, signaling that investors are not certain as to where they value RPAR’s shares.
Their MACD looks to be losing speed, which may bring near-term entry points for investors who don’t mind losing beyond their 3.85% annual distribution.
For those that do mind, they are optionable, which can be used to generate profits while waiting for a more appropriate entry-point.
RPAR has support at $19.25 (10 day moving average), $19.05, $19.01 & $18.81/share, with resistance at $19.42, $19.45 (50 day moving average), $19.54 & $19.61/share.
PPH, the VanEck Vectors Pharmaceutical ETF has lost -3.15% over the past year, with a -9.41% (ex-distributions) loss since their high in April 2022.
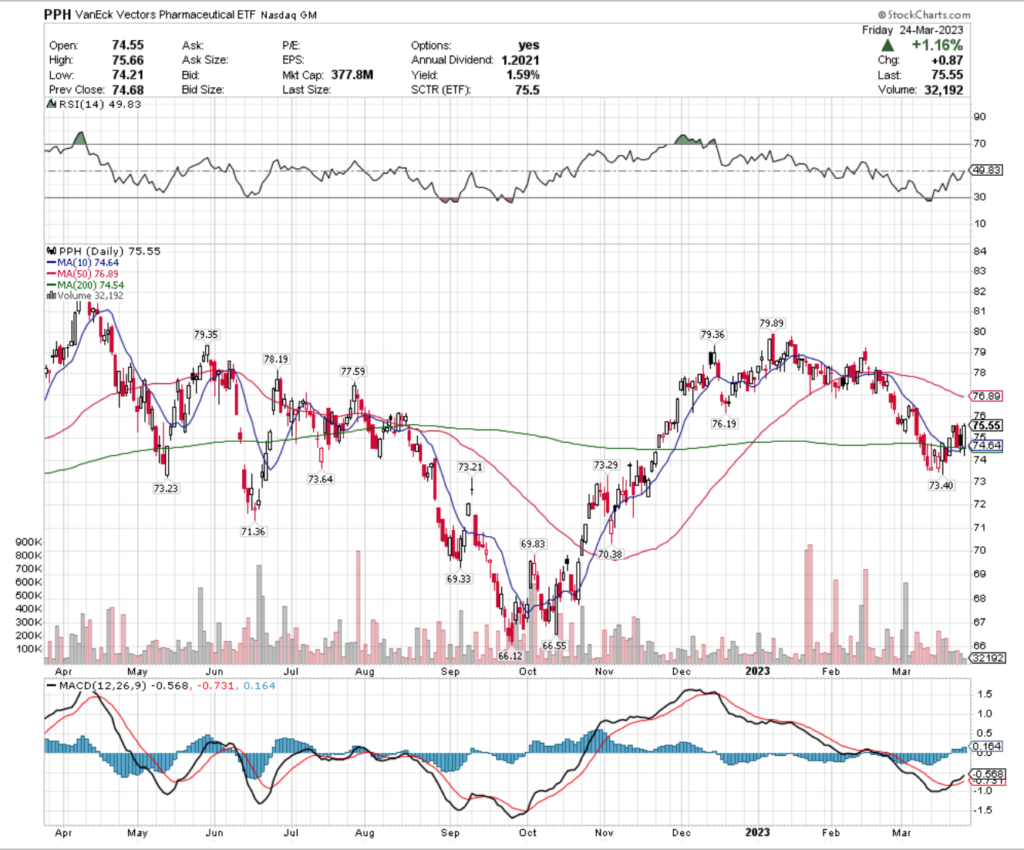
Their RSI is approaching neutral again & recent trading volumes have been far below average compared to the year prior.
PPH has a 1.59% distribution for long-term share holders, and has options that can be traded while waiting for a more secure entry point.
PPH has support at the $74.64 (10 day moving average), $74.54 (200 day moving average), $73.64 & $73.40/share price levels, with resistance at the $76.19, $76.89 (50 day moving average), $77.59 & $78.19/share price levels.
EWD, the iShares MSCI Sweden ETF has lost -11.71% of its value over the past year, shedding -14.93% since its high of March 2022.
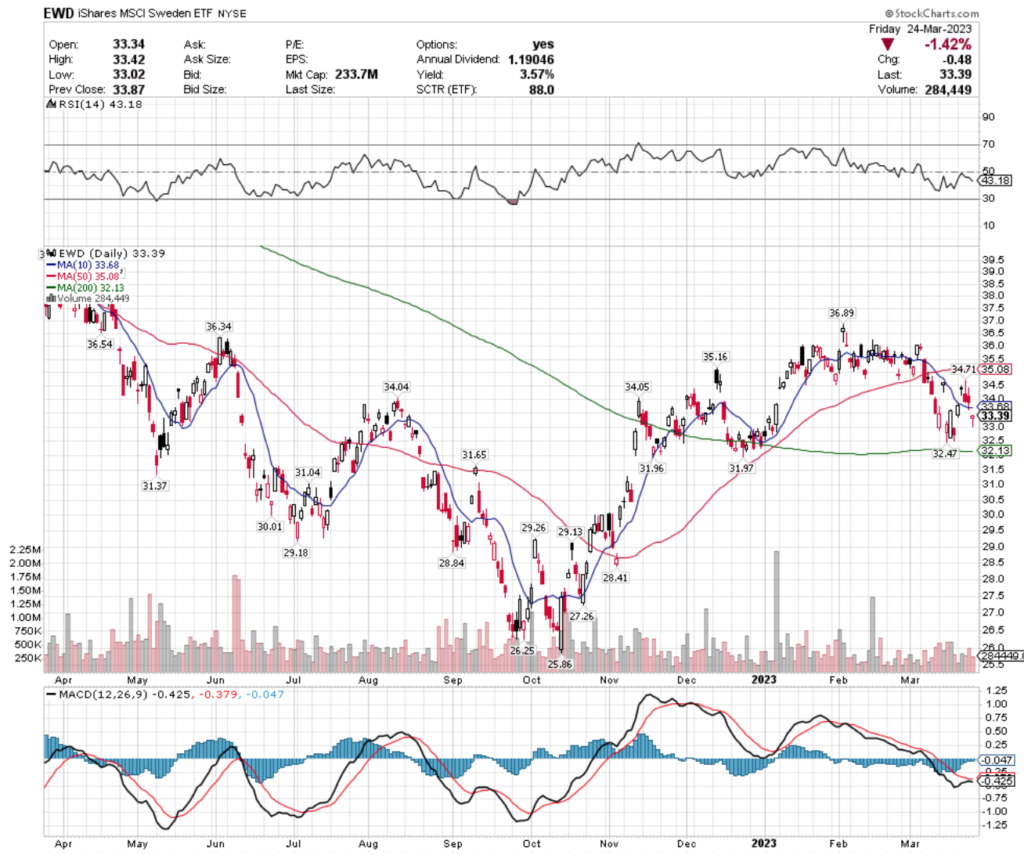
Friday’s gap down will prove interesting, as their MACD was on the verge of crossing over bullishly, but with low trading volumes it is hard to gauge investor sentiment on the move.
Their RSI is on the oversold end of neutral at 43, and there looks to be more near-term losses on the horizon, which can present entry point opportunities for long-term investors.
However, unless their 3.57% distribution is the only protection from loss that you require, it would be wisest to wait & see how they behave at their support levels.
EWD has support at the $32.47, $32.13 (200 day moving average), $31.97 & $31.96/share price levels, with resistance overhead at the $33.68 (10 day moving average), $34.04, $34.05 & $34.71/share price levels.
Tying It All Together
This week we have lots of data coming in, with the exception of Monday which will be a quiet day minus Fed. Governor Jefferson speaking at 5pm.
Tuesday will be busy, with Advanced U.S. Trade Balance In Goods, Advance Retail Inventories & Advance Wholesale inventories at 8:30 am, followed by the S&P Case-Schiller Home Price Index & FHFA Home Index Price data at 9 am & U.S. Consumer Confidence & Fed Gov. Barr testifying before the Senate about banks at 10 am.
Wednesday brings us Pending US Home Sales data at 10 am, which will also be when Barr testifies to the House on banks.
Thursday features GDP (2nd revision), Initial Jobless Claims & Continuing Jobless Claims at 8:30 am, with Boston Fed President Collins speaking at 12:45 pm.
Friday too will be busy, with 8:30 am having a line up featuring Person Income (nominal), Personal Spending (nominal), PCE Index, Core PCE Index, PCE (Y-o-Y) & Core PCE (Y-o-Y) at 8:30, followed by the Chicago Business Barometer at 9:45 am.
At 10 am Friday the UMich Consumer Sentiment (final) data will be released & at 3:05 the NY Fed President Williams speaks, as well as Fed Governors Cook & Waller speaking in the evening (5:45 & 10 pm).
See you back here next week!
*** I DO NOT OWN SHARES OR OPTIONS CONTRACT POSITIONS IN SMH, IYW, SIL, DFJ, URTH, RPAR, PPH, or EWD AT THE TIME OF PUBLISHING THIS ARTICLE ***