Oracle Corp. stock trades under the ticker ORCL and has advanced +16.87% over the past year, sitting -25.47% below their 52-week high from December 2024, while remaining +31.05% above their 52-week low from April of 2024 (all ex-dividends).
ORCL has had a rough past few months after hitting their 52-week high, and has spent the month of March consolidating after crossing bearishly below their 200 day moving average.
This makes it a great time to check in on how ORCL has traded at their various price levels of the past couple of years
Below is a brief technical analysis of ORCL, as well as a price level:volume sentiment analysis of the price levels ORCL has traded at over the past ~2 years.
Included in this data is also their recent support & resistance levels so that readers can gain insight into how strong/weak these support/resistance levels may be in the future, based on past investor behavior.
It is not intended to serve as financial advice, but rather as an additional tool to reference while performing your own due diligence on ORCL.
Technical Analysis Of Oracle Corp. ORCL Stock
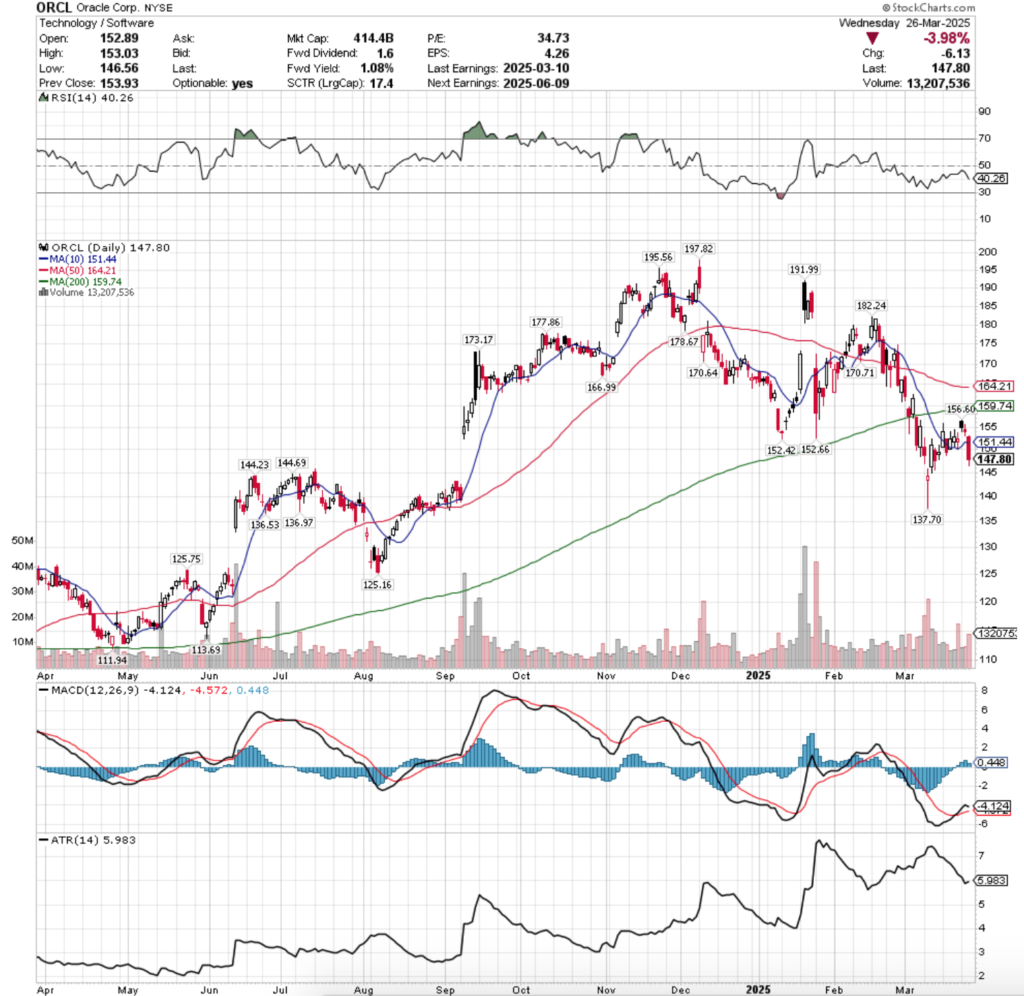
ORCL Corp. ORCL Stock’s Technical Performance Over The Past Year
Their RSI is trending towards the oversold 30 mark & currently sits at 40.26, while their MACD has dolphined but is bearishly approaching the signal line.
Volumes have been +12.64% above the prior year’s average over the past week & a half (10,056,250 vs. 8,927,888.45), which is slight cause for concern given that their highest volume sessions have been declines.
Last Monday ORCL opened on a gap up with the highest advancing volume of the past week & a half, and was able to break above the resistance of the 10 day moving average.
Tuesday opened in the middle of Monday’s range, but the support of the 10 DMA was unable to hold up & ORCL closed below it at $149.45/share.
Wednesday saw ORCL open in-line with the 10 DMA & march higher, but it was unable to test the $155/share level.
Thursday saw gains, but again was unable to test the $155/share level & the session closed with an air of uncertainty as a spinning top candle.
Thursday’s low was supported by the 10 day moving average, but volumes were very light, indicating that there was not a lot of participation among investors.
Friday the uncertainty continued, but with a hint of bearish sentiment crawling back into markets, as ORCL opened lower, tested lower & bounced off of the support of the 10 day moving average, before closing higher than it opened & forming a bearish harami pattern with Thursday’s candle.
It’s important to note that both days resulted in spinning tops as well, indicating that there was uncertainty among market participants about where to value ORCL’s shares at.
ORCL’s volume on Friday is also important to note, as the declining volume was the highest level of any session from the prior two weeks, with a mix of folks taking risk off the table heading into the weekend & others buying the dip to squeeze prices higher.
Monday set the week up bearishly, as ORCL opened on a gap higher above the $155/share level, before testing & closing lower for the day on very light volume, indicating that there was not going to be any staying power behind the move.
Sure enough, Tuesday opened lower, tested above the $155/share mark but was unable to sustain the move & closed lower, as a spinning top candle.
The uncertainty of the day’s close paired with the negative sentiment from the end of the prior week & Monday’s session led to a gap down open on Wednesday, where the second highest volume of the past week & a half managed to break down the support of the 10 day moving average & close below it.
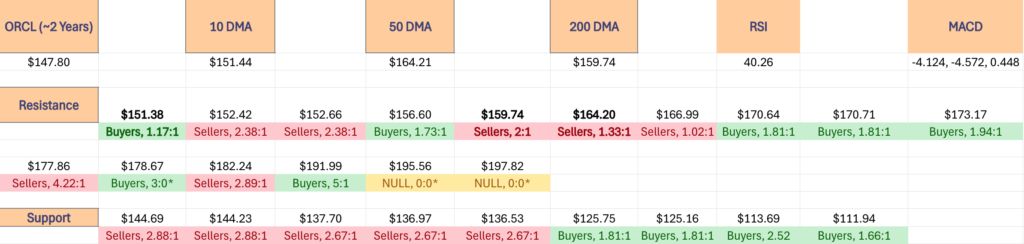
To the upside, the $151.44/share price level (10 day moving average) will be important to watch in the coming weeks, as if it can’t be broken through to the upside we’ll likely see further declines or consolidation.
Should it be broken through there will be a lot of selling pressure at the $152.42 & $152.66/share price levels which will be a tough zone of resistance to break through without a major market catalyst.
Should ORCL consolidate further it will likely oscillate around the 10 DMA in the range that it has spent most of March 2025 in.
To the downside, the next five support levels have historically been dominated by Sellers over the past ~2 years, which will make it difficult to find stable footing for ORCL in the event of further declines.
The following section lays out ORCL’s one year support/resistance levels, as well as their Buyer:Seller (Seller:Buyer) ratios at each price level that they’ve traded at over the past ~2 years, which can be used as a barometer for estimating the expected strength/weakness of each of the support/resistance levels.
Price Level:Volume Sentiment For Oracle Corp. ORCL Stock
The top table below shows the support & resistance levels of ORCL from the past year’s chart, as well as their price level:volume sentiment at each from data covering the past ~2 years, using Wednesday 3/26/2025’s closing data for their price & moving averages/other technicals.
The moving averages are denoted with bold.
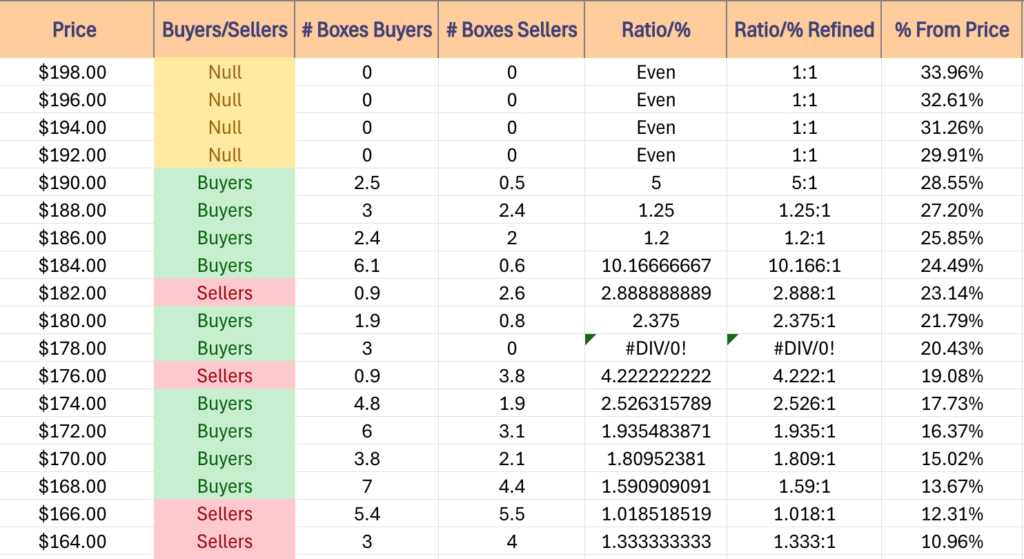
The next charts show the volume sentiment at each individual price level ORCL has traded at over the past ~2 years.
Beneath them is a copy & pasteable list of the same data, where the support/resistance levels are denoted in bold.
All ratios with “0” in the denominator are denoted with a “*”.
NULL values are price levels that had limited trading volume, whether it be due to gaps, quick advances or they are at price extremes; in the event that they are retested & there is more data they would have a distinct “Buyers”, “Sellers” or “Even” title.
This is not intended as financial advice, but rather another tool to consider when performing your own research & due diligence on ORCL.
Oracle Corp. ORCL Stock’s Price Level:Volume Sentiment Over The Past ~2 Years At One Year Support/Resistance Levels
Oracle Corp. ORCL Stock’s Price Level:Volume Sentiment Over The Past ~2 Years
Price Level:Volume Sentiment For Oracle Corp. ORCL Stock Over The Past ~2 Years
Price Level:Volume Sentiment For Oracle Corp. ORCL Stock Over The Past ~2 Years
$198 – NULL – 0:0*, +33.96% From Current Price
$196 – NULL – 0:0*, +32.61% From Current Price
$194 – NULL – 0:0*, +31.26% From Current Price
$192 – NULL – 0:0*, +29.91% From Current Price
$190 – Buyers – 5:1, +28.55% From Current Price
$188 – Buyers – 1.25:1, +27.2% From Current Price
$186 – Buyers – 1.2:1, +25.85% From Current Price
$184 – Buyers – 10.17:1, +24.49% From Current Price
$182 – Sellers – 2.89:1, +23.14% From Current Price
$180 – Buyers – 2.38:1, +21.79% From Current Price
$178 – Buyers – 3:0*. +20.43% From Current Price
$176 – Sellers – 4.22:1, +19.08% From Current Price
$174 – Buyers – 2.53:1, +17.73% From Current Price
$172 – Buyers – 1.94:1, +16.37% From Current Price
$170 – Buyers – 1.81:1, +15.02% From Current Price
$168 – Buyers – 1.59:1, +13.67% From Current Price
$166 – Sellers – 1.02:1, +12.31% From Current Price
$164 – Sellers – 1.33:1, +10.96% From Current Price – 50 Day Moving Average*
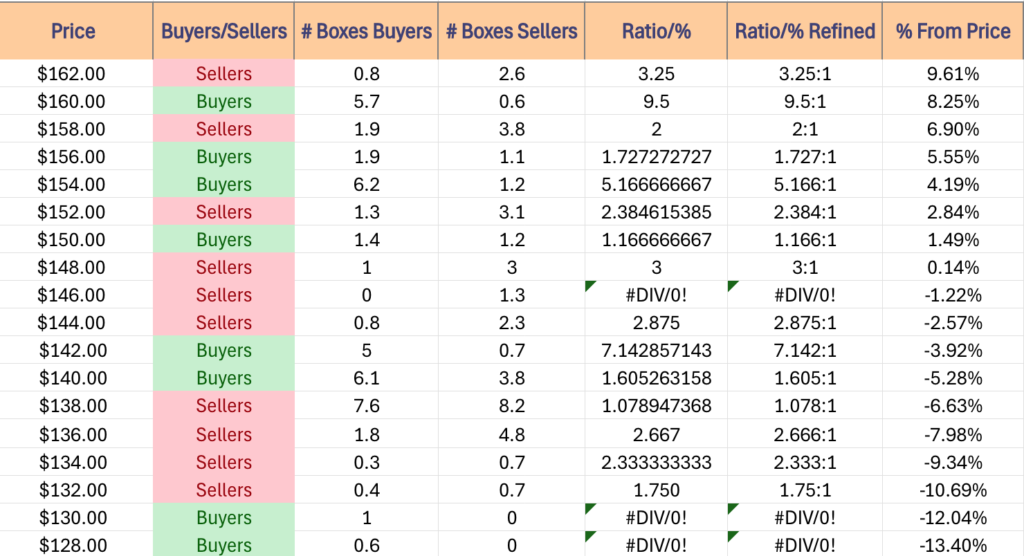
$162 – Sellers – 3.25:1, +9.61% From Current Price
$160 – Buyers – 9.5:1, +8.25% From Current Price
$158 – Sellers – 2:1, +6.9% From Current Price – 200 Day Moving Average*
$156 – Buyers – 1.73:1, +5.55% From Current Price
$154 – Buyers – 5.17:1, +4.19% From Current Price
$152 – Sellers – 2.39:1, +2.84% From Current Price
$150 – Buyers – 1.17:1, +1.49% From Current Price – 10 Day Moving Average*
$148 – Sellers – 3:1, +0.14% From Current Price
$146 – Sellers – 1.3:0*, -1.22% From Current Price – Current Price Level*
$144 – Sellers – 2.88:1, -2.57% From Current Price
$142 – Buyers – 7.14:1, -3.92% From Current Price
$140 – Buyers – 1.61:1, -5.28% From Current Price
$138 – Sellers – 1.08:1, -6.63% From Current Price
$136 – Sellers – 2.67:1, -7.98% From Current Price
$134 – Sellers – 2.33:1, -9.34% From Current Price
$132 – Sellers – 1.75:1, -10.69% From Current Price
$130 – Buyers – 1:0*, -12.04% From Current Price
$128 – Buyers – 0.6:0*, -13.4% From Current Price
$126 – Buyers – 2.53:1, -14.75% From Current Price
$124 – Buyers – 1.81:1, -16.1% From Current Price
$122 – Sellers – 1.75:1, -17.46% From Current Price
$120 – Buyers – 1.13:1, -18.81% From Current Price
$118 – Buyers – 9:1, -20.16% From Current Price
$116 – Buyers – 1.23:1, -21.52% From Current Price
$114 – Buyers – 1.16:1, -22.87% From Current Price
$112 – Buyers – 2.52:1, -24.22% From Current Price
$110 – Buyers – 1.66:1, -25.58% From Current Price
$108 – Buyers – 2.85:1, -26.93% From Current Price
$106 – Buyers – 1.04:1, -28.28% From Current Price
$104 – Buyers – 2.08:1, -29.63% From Current Price
$102 – Buyers – 1.37:1, -30.99% From Current Price
$100 – Buyers – 2.32:1, -32.34% From Current Price
$99 – Sellers – 9.83:1, -33.02% From Current Price
$98 – Sellers – 2.8:0*, -33.69% From Current Price
$97 – NULL – 0:0*, -34.37% From Current Price
*** I DO NOT OWN SHARES OR OPTIONS CONTRACT POSITIONS IN ORCL STOCK AT THE TIME OF PUBLISHING THIS ARTICLE ***
The VIX closed at 18.33, indicating an implied one day move of +/-1.16% & an implied one month move of +/-5.3% for the S&P 500.
Highest Technical Rated S&P 500 Components Per 3/26/2025’s Close:
1 – PLTR
2 – VRSN
3 – T
4 – TTWO
5 – DRI
6 – TPR
7 – HWM
8 – EQT
9 – PM
10 – FOXA
Lowest Technical Rated S&P 500 Components Per 3/26/2025’s Close:
1 – MRNA
2 – FSLR
3 – DECK
4 – TER
5 – WST
6 – CZR
7 – ON
8 – ALGN
9 – REGN
10 – ENPH
Highest Volume Rated S&P 500 Components Per 3/26/2025’s Close:
1 – DLTR
2 – JBHT
3 – PAYX
4 – CTAS
5 – TT
6 – SOLV
7 – NWS
8 – AEP
9 – TSLA
10 – F
Lowest Volume Rated S&P 500 Components Per 3/26/2025’s Close:
1 – WDAY
2 – EXR
3 – WBA
4 – WAB
5 – SBAC
6 – WY
7 – EG
8 – AKAM
9 – WSM
10 – TPR
Highest Technical Rated ETFs Per 3/26/2025’s Close:
1 – BABX
2 – YINN
3 – JNUG
4 – NUGT
5 – XPP
6 -LABD
7 – GDMN
8 – UGL
9 – SHLD
10 – AUMI
Lowest Technical Rated ETFs Per 3/26/2025’s Close:
1 – MSOX
2 – ETHU
3 – CONL
4 – YANG
5 – MRNY
6 – WEED
7 – CNBS
8 – MSOS
9 – OSOL
10 – BCHG
Highest Volume Rated ETFs Per 3/26/2025’s Close:
1 – UNIY
2 – MBND
3 – BTR
4 – UXOC
5 – PMIO
6 – XAUG
7 – XBB
8 – XJUL
9 – HWAY
10 – IOCT
Lowest Volume Rated ETFs Per 3/26/2025’s Close:
1 – TOTR
2 – CARK
3 – FDVL
4 – KWT
5 – RSSL
6 – TFJL
7 – HCRB
8 – RSMC
9 – IBIH
10 – SPD
Highest Technical Rated General Stocks Per 3/26/2025’s Close:
1 – RGC
2 – VVPR
3 – VAXX
4 – LXEH
5 – JYD
6 – RAASY
7 – CMRX
8 – GTII
9 – TOI
10 – LQMT
Lowest Technical Rated General Stocks Per 3/26/2025’s Close:
1 – MULN
2 – TCBPY
3 – HEPA
4 – BON
5 – ACON
6 – LGMK
7 – BHIL
8 – CLEU
9 – RNAZ
10 – WHLR
Highest Volume Rated General Stocks Per 3/26/2025’s Close:
1 – BLNE
2 – LPTX
3 – THTX
4 – SURG
5 – MAMA
6 – AQB
7 – ALID
8 – PTPI
9 – HOUR
10 – ACRV
Lowest Volume Rated General Stocks Per 3/26/2025’s Close:
1 – VRDR
2 – TSGZF
3 – SDCH
4 – KVLQF
5 – DSNY
6 – BUKS
7 – EDSA
8 – BQ
9 – CYTOF
10 – VHIBF
*** THE LIST ABOVE IS STRICTLY FOR INFORMATIONAL PURPOSES – I MAY OR MAY NOT HAVE OR INITIATE A LONG, SHORT, OR LONG/SHORT POSITION IN ANY NAME ABOVE AT ANY TIME ***
The VIX closed at 17.15, indicating an implied one day move of +/-1.08% & an implied one month move of +/-4.96% for the S&P 500.
Highest Technical Rated S&P 500 Components Per 3/25/2025’s Close:
1 – PLTR
2 – HWM
3 – EQT
4 – DASH
5 – TPR
6 – TTWO
7 – VRSN
8 – DRI
9 – T
10 – NFLX
Lowest Technical Rated S&P 500 Components Per 3/25/2025’s Close:
1 – MRNA
2 – FSLR
3 – DECK
4 – TER
5 – WST
6 – REGN
7 – CZR
8 – TGT
9 – ON
10 – SWKS
Highest Volume Rated S&P 500 Components Per 3/25/2025’s Close:
1 – AEP
2 – MKC
3 – IT
4 – IP
5 – WYNN
6 – UPS
7 – CCI
8 – TEL
9 – PAYX
10 – ABBV
Lowest Volume Rated S&P 500 Components Per 3/25/2025’s Close:
1 – WBA
2 – JNPR
3 – KLAC
4 – WDAY
5 – AXON
6 – MOH
7 – CSGP
8 – INTC
9 – MTB
10 – MTCH
Highest Technical Rated ETFs Per 3/25/2025’s Close:
1 – BABX
2 – YINN
3 – NUGT
4 – JNUG
5 – XPP
6 – AUMI
7 – GDMN
8 – SHLD
9 – EPOL
10 – UGL
Lowest Technical Rated ETFs Per 3/25/2025’s Close:
1 – MSOX
2 – ETHU
3 – TSLZ
4 – YANG
5 – TSDD
6 – TSLQ
7 – MSOS
8 – CONL
9 – CNBS
10 – WEED
Highest Volume Rated ETFs Per 3/25/2025’s Close:
1 – XBB
2 – KWT
3 – EEMO
4 – DJUN
5 – LAPR
6 – TOUS
7 – XAUG
8 – MCSE
9 – XJUL
10 – XAPR
Lowest Volume Rated ETFs Per 3/25/2025’s Close:
1 – MYY
2 – JEMB
3 – THIR
4 – TBFC
5 – FBUF
6 – CNEQ
7 – CPRO
8 – MYCL
9 – SECR
10 – RSSL
Highest Technical Rated General Stocks Per 3/25/2025’s Close:
1 – RGC
2 – CMRX
3 – RAASY
4 – JYD
5 – ELIQQ
6 – YOSH
7 – TOI
8 – LQMT
9 – ATGL
10 – NAK
Lowest Technical Rated General Stocks Per 3/25/2025’s Close:
1 – MULN
2 – HEPA
3 – WLGS
4 – BON
5 – AREB
6 – CLEU
7 – AGMH
8 – WHLR
9 – CMCT
10 – ADTX
Highest Volume Rated General Stocks Per 3/25/2025’s Close:
1 – ENZN
2 – ABSSF
3 – GCBC
4 – WEX
5 – IPM
6 – XWEL
7 – DGLY
8 – ZOOZ
9 – SES
10 – AUNA
Lowest Volume Rated General Stocks Per 3/25/2025’s Close:
1 – IDKFF
2 – ROYL
3 – PTUUF
4 – QTIH
5 – DSNY
6 – CDBMF
7 – GECSF
8 – ARBV
9 – LITOF
10 – VRDR
*** THE LIST ABOVE IS STRICTLY FOR INFORMATIONAL PURPOSES – I MAY OR MAY NOT HAVE OR INITIATE A LONG, SHORT, OR LONG/SHORT POSITION IN ANY NAME ABOVE AT ANY TIME ***
The VIX closed at 17.48, indicating an implied one day move of +/-1.1% & an implied one month move of +/-5.05% for the S&P 500.
Highest Technical Rated S&P 500 Components Per 3/24/2025’s Close:
1 – PLTR
2 – TPR
3 – DASH
4 – EQT
5 – HWM
6 – DRI
7 – VRSN
8 – TTWO
9 – T
10 – GL
Lowest Technical Rated S&P 500 Components Per 3/24/2025’s Close:
1 – MRNA
2 – FSLR
3 – TER
4 – DECK
5 – ON
6 – WST
7 – CZR
8 – ALGN
9 – SWKS
10 – TGT
Highest Volume Rated S&P 500 Components Per 3/24/2025’s Close:
1 – FDX
2 – DLTR
3 – LMT
4 – NKE
5 – FRT
6 – TSLA
7 – RSG
8 – CMS
9 – DRI
10 – TXT
Lowest Volume Rated S&P 500 Components Per 3/24/2025’s Close:
1 – HSIC
2 – IRM
3 – JNPR
4 – WBA
5 – ENPH
6 – FI
7 – PFG
8 – ZBH
9 – GPC
10 – CPT
Highest Technical Rated ETFs Per 3/24/2025’s Close:
1 – BABX
2 – YINN
3 – XPP
4 – JNUG
5 – NUGT
6 – SHLD
7 – GDMN
8 – CWB
9 – UGL
10 – EPI
Lowest Technical Rated ETFs Per 3/24/2025’s Close:
1 – MSOX
2 – YANG
3 – TSLZ
4 – CONI
5 – KOLD
6 – TSDD
7 – TSLQ
8 – CNAV
9 – WEED
10 – MSOS
Highest Volume Rated ETFs Per 3/24/2025’s Close:
1 – CARK
2 – JUNP
3 – CPER
4 – SPAX
5 – OVT
6 – OVLH
7 – SSXU
8 – OVL
9 – SPAQ
10 – CAAA
Lowest Volume Rated ETFs Per 3/24/2025’s Close:
1 – PLDR
2 – NNOV
3 – PSCQ
4 – GSID
5 – FDVL
6 – GSFP
7 – THY
8 – XSMO
9 – SEPW
10 – MYMH
Highest Technical Rated General Stocks Per 3/24/2025’s Close:
1 – RGC
2 – VVPR
3 – MLGO
4 – CMRX
5 – RAASY
6 – YOSH
7 – LQMT
8 – ATGL
9 – TOI
10 – LEMIF
Lowest Technical Rated General Stocks Per 3/24/2025’s Close:
1 – MULN
2 – HEPA
3 – KRBP
4 – BON
5 – AREB
6 – STBX
7 – NWTG
8 – LGMK
9 – CLEU
10 – RNAZ
Highest Volume Rated General Stocks Per 3/24/2025’s Close:
1 – TRSG
2 – OUT
3 – JHX
4 – KDLY
5 – UCAR
6 – CAPS
7 – WLGS
8 – UNIT
9 – THAR
10 – TGL
Lowest Volume Rated General Stocks Per 3/24/2025’s Close:
1 – AVCNF
2 – AHOTF
3 – DSNY
4 – KTGDF
5 – NROM
6 – RHHBF
7 – CIAFF
8 – GECSF
9 – ADMT
10 – SPRC
*** THE LIST ABOVE IS STRICTLY FOR INFORMATIONAL PURPOSES – I MAY OR MAY NOT HAVE OR INITIATE A LONG, SHORT, OR LONG/SHORT POSITION IN ANY NAME ABOVE AT ANY TIME ***
SPY, the SPDR S&P 500 ETF added +0.21% last week, while the VIX closed the week out at 19.28, indicating an implied one day move of +/-1.22% & an implied one month move of +/-5.57%.
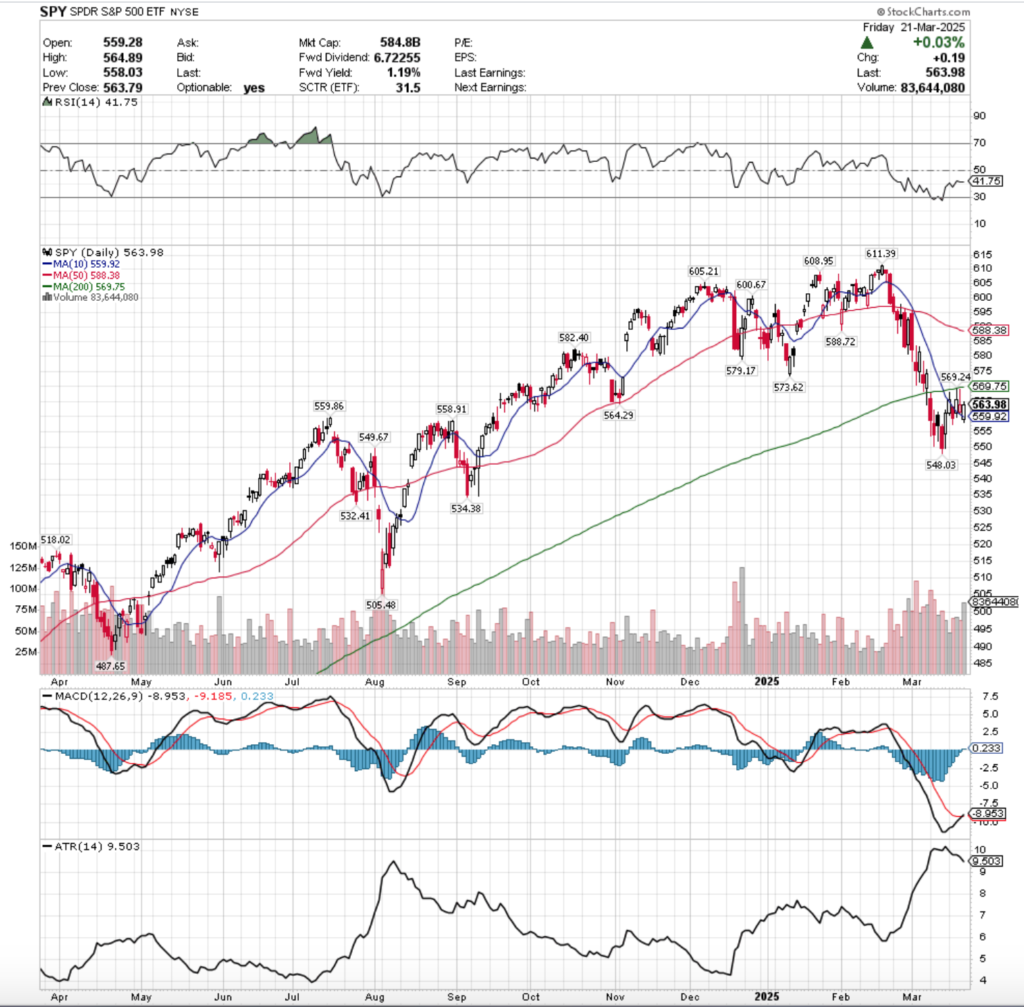
SPY ETF – SPDR S&P 500 ETF’s Technical Performance Over The Past Year
Their RSI has flattened out at the 41.75 mark, while their MACD crossed bullishly late last week, but looks primed to “dolphin” back below the signal line in the coming days.
Volumes were +23.87% above the prior year’s average level (65,666,000 vs. 53,013,052), which looks to be in part a result of a squeeze on Friday heading into the weekend when SPY had the highest volume of the week.
While the week as a whole had stronger than average volume (minus-Monday), the fact that SPY more or less tread water last week with the influx in participation should be met with a skeptical eye, particularly given how robust the 200 day moving average was in terms of limiting upper shadows with its resistance.
Monday the week opened higher, tested slightly lower before breaking through the 10 day moving average’s resistance, but was unable to break above the long-term trend line & ultimately retreated to close more in-line with the 10 DMA.
Monday’s session also had the lowest volume of the week, as investors were on the fence about hopping back into the pool & took a cautious “wait & see” approach.
Tuesday saw an open at the short-term trend line (10 DMA) & the rug was promptly pulled out from under SPY, as the rest of the session consisted of a downwards slide.
Volume was the third highest of the week on Tuesday, and the session’s lower shadow indicated that there was appetite for SPY to head towards the $555/share mark, which will be something to keep an eye on in the next week or two.
Wednesday again opened in-line with the 10 day moving average, which will be an area to continue to watch in the next week, as was highlighted in last week’s note.
The $560/share level was briefly dipped under, but shares came roaring back to attempt a run at the resistance of the 200 day moving average, which failed, but the second highest volume session of the week managed to close higher.
Thursday threw an interesting curveball to market participants, as the session formed a bearish harami pattern that opened again in-line with the 10 day moving average, ripped higher to test the long-term trend line & again failed, but managed to close above its open on the second lowest volume of the week.
That’s quite the run on sentence for limited participation.
Bearish sentiment carried over into the morning hours when on Friday SPY opened lower (and notably, below the 10 day moving average), tested slightly lower, before forming a bullish engulfing pattern with Thursday’s candle on the highest volume of the week.
It’s worth noting that Friday’s close was well beneath the 200 DMA’s resistance, indicating that there is some strong sentiment that the long-term trend has been broken.
While this morning’s session opened on a gap higher above the 200 DMA’s resistance, unless there is a substantial uptick in volume it should be viewed with a skeptic brow.
In the event of strong volume for multiple sessions above the 200 DMA’s support then the narrative will shift towards a base is being formed, however without such volume there’s not much of a story.
It will also be difficult, as per the table below SPY’s next three levels of resistance come at areas where there has been unusually high buyer volume (untested on the downside), else where sellers have historically been in control, and historic sentiments are important.
Should the gap up begin to close the window (most likely scenario), it will be interesting to see if there is a consolidation between the 10 & 200 day moving averages, or if there is a broader decline that sees SPY grind even lower than before, proving this past week to be a “breather”.
In the event of the consolidation scenario, keep an eye on whether SPY hugs the 10 or 200 DMA more tightly as it oscillates in the window & take note of where the volume is headed in terms of higher advancing or declining & the range of each day’s session; this will lend clues into the strength of the market & the next move.
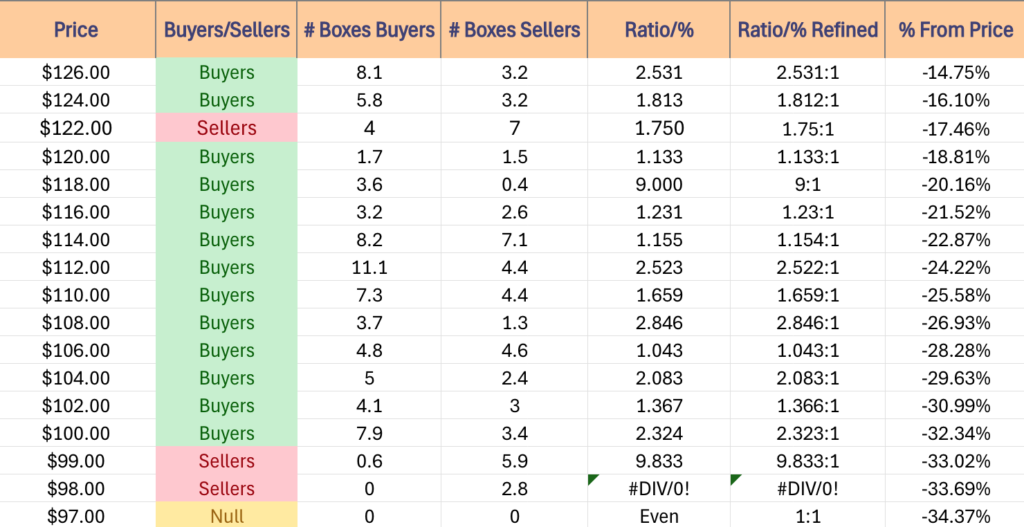
Now, for the downside the $598-599 support zone is going to be interesting for a number of reasons.
Firstly, the $555-559.99/share zone is historically a Buyer dominated zone at a rate of 3.44:1, so any move that penetrates it to the downside will likely have some staying power & strong sentiment.
Secondly, there is no support for another -1.65% once the $558.91 level is broken through, which leads into a Seller dominated zone, making it likely to see continued declines from there.
Thirdly, while price may well oscillated between the 10 & 200 DMAs, the 50 DMA is approaching the long-term trend line by next Friday bearishly.
This may add a bit of extra chaos for SPY in the coming weeks at a time where most market participants are hoping for some stability & upward movement.
The table below will be worth referencing in regards to SPY’s moves over the coming weeks & should serve as a reference point for the strength/weakness of support/resistance levels.
SPY has support at the $559.92 (10 Day Moving Average, Volume Sentiment: Buyers, 3.44:1), $559.86 (Volume Sentiment: Buyers, 3.44:1), $558.91 (Volume Sentiment: Buyers, 3.44:1) & $549.67/share (Volume Sentiment: Sellers, 1.06:1) price levels, with resistance at the $564.29 (Volume Sentiment: Buyers, 1.8:0*), $569.24 (Volume Sentiment: Sellers, 1.59:1), $569.75 (200 Day Moving Average, Volume Sentiment: Sellers, 1.59:1) & $573.62/share (Volume Sentiment: Buyers, 5.33:1) price levels.
SPY ETF’s Price Level:Volume Sentiment Over The Past ~2-3 Years
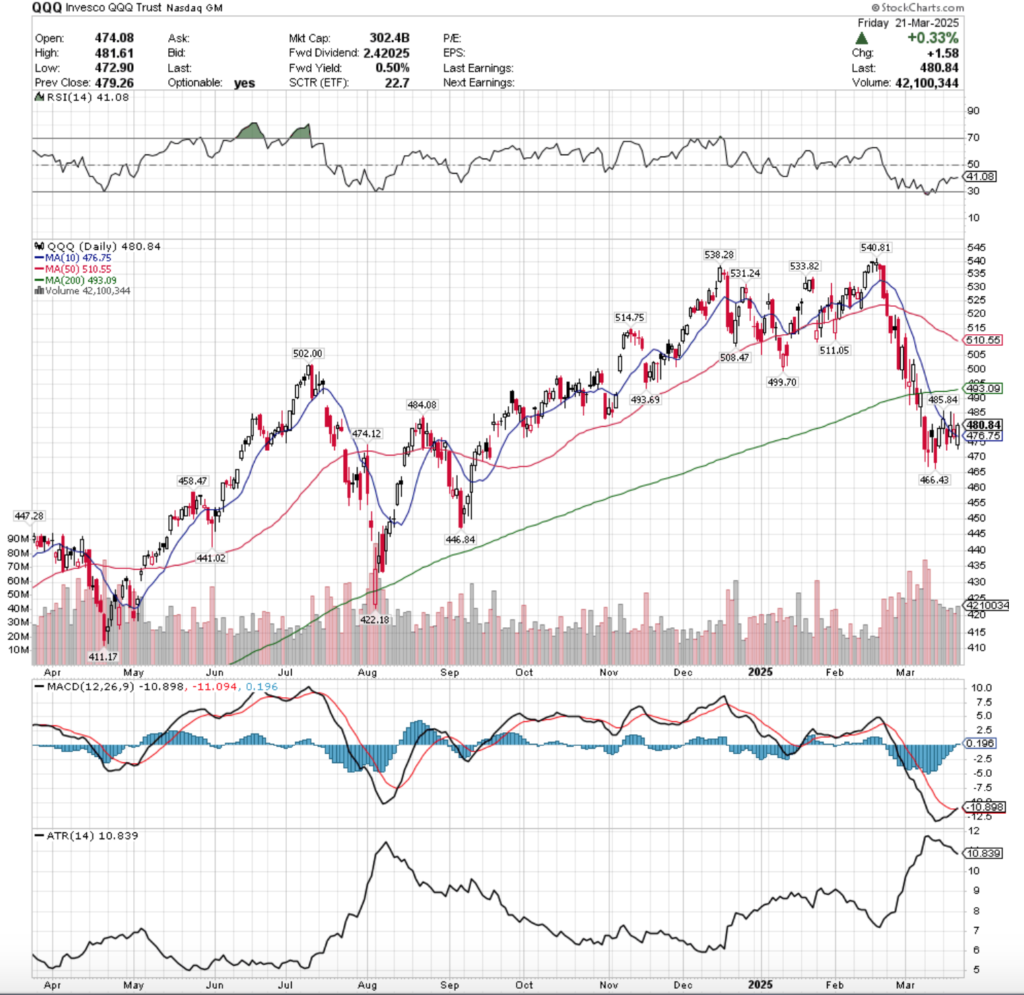
QQQ, the Invesco QQQ Trust ETF gained +0.25% last week, but despite faring better than SPY it had less volume behind the upward move.
QQQ ETF – Invesco QQQ Trust ETF’s Technical Performance Over The Past Year
Their RSI is also flat & sits at 41.08, while the MACD also just broke north above th signal line, but does not look to have much more than a brief “dolphin moment” in terms of a bullish signal as of now.
Volumes were +13.78% higher than the prior year’s average (40,050,000 vs. 35,198,835), which is interesting given that each day was relatively close to one another, for both advancing & declining volume.
Monday opened on a gap higher, retraced into Friday’s range, before power higher through the resistance of the 10 day moving average, but ultimately closed in-line with the resistance level.
Tuesday gapped lower & folks wanted out, as the session never even flirted with the idea of testing the 10 day moving average’s resistance, and the $475/share level broke down on the week’s second lowest volume.
It’s worth noting that the lowest volume sessions of the week were the declining days, but given how close they all were that is more of an afterthought to keep in mind, but not dwell upon.
Wednesday opened in the middle of Tuesday’s candle’s body, temporarily broke down through the $475 level, before breaking out above the 10 DMA & breaking above the $485/share price level & ultimately settling lower to $480.17.
Thursday opened below the 10 day moving average, but made a run north for the $485/share level before settling lower at $478.55, to advance on the day, but on the week’s weakest volume.
Friday opened on a gap lower but managed to squeeze higher to close at $480.84, but the day’s shadows indicated that the downside had more favor than the upside heading into the weekend.
QQQ has some upside potential should they get an influx in advancing volume, but otherwise the upside looks almost identical to last week’s post.
Should they consolidate here, the range that they’ll trade in is relatively already determined based on their chart above when looking at the past two weeks & will be impacted by the movements of the 200 & 50 DMA’s which are both applying downside pressure on price movement currently.
In the event of consolidation, watch for trends in volume that day to determine whether a genuine base is forming (more accumulation volume vs. declining volume at a noticeable clip), or to see if this “breather” is skating on thin ice/doomed.
To the downside there looks to be some troubling volume patterns & historic market behavior.
QQQ’s first support level is in a Seller zone, followed by one in a Buyer zone that has the same ratio, which doesn’t inspire confidence if a similar ratio’d downside zone gets broken through, regardless of what the volume levels look like.
They then potentially break down through an entire price zone at $468-471.99/share as it is a Seller zone, before hitting their next support level which resides in a relatively untested zone in terms of Sellers not showing up (Buyers, 1.6:0*).
What’s more troubling though is that should QQQ find itself in this situation, the next support level is in a Seller zone (1.89:1), which then leads into one potential buoy zone ($452-455.99), before re-entering Sellersville for an ultimate potential loss of -7.66% from Friday’s closing price.
if the $447.28/share support level gets tested it would be wise to continue looking out down below – reference the table below for more information.
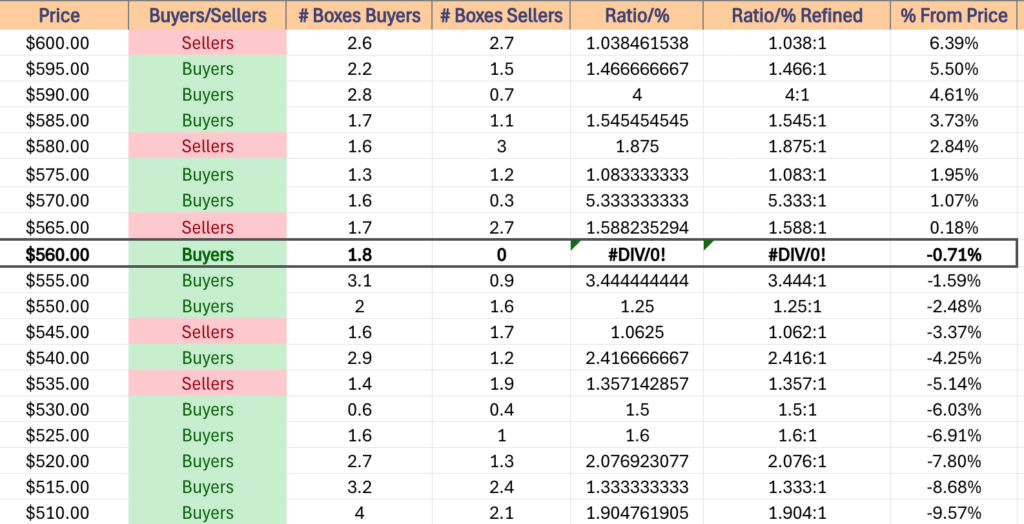
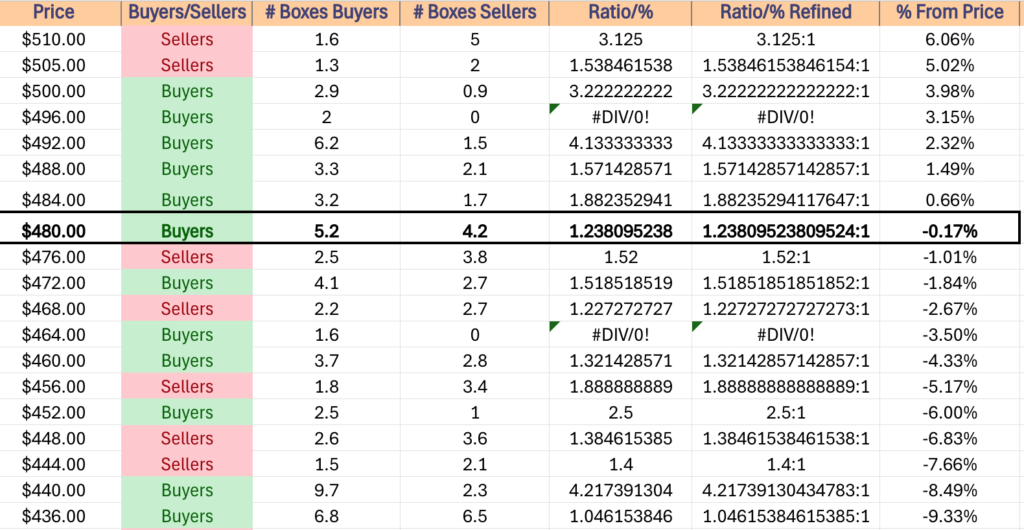
QQQ has support at the $476.75 (10 Day Moving Average, Volume Sentiment: Sellers, 1.52:1), $474.12 (Volume Sentiment: Buyers, 1.52:1), $466.43 (Volume Sentiment: Buyers, 1.6:0*) & $458.47/share (Volume Sentiment: Sellers, 1.89:1) price levels, with resistance at the $484.08 (Volume Sentiment: Buyers, 1.88:1), $485.84 (Volume Sentiment: Buyers, 1.88:1), $493.09 (200 Day Moving Average, Volume Sentiment: Buyers, 4.13:1) & $493.69/share (Volume Sentiment: Buyers, 4.13:1) price levels.
QQQ ETF’s Price Level:Volume Sentiment Over The Past ~2-3 Years
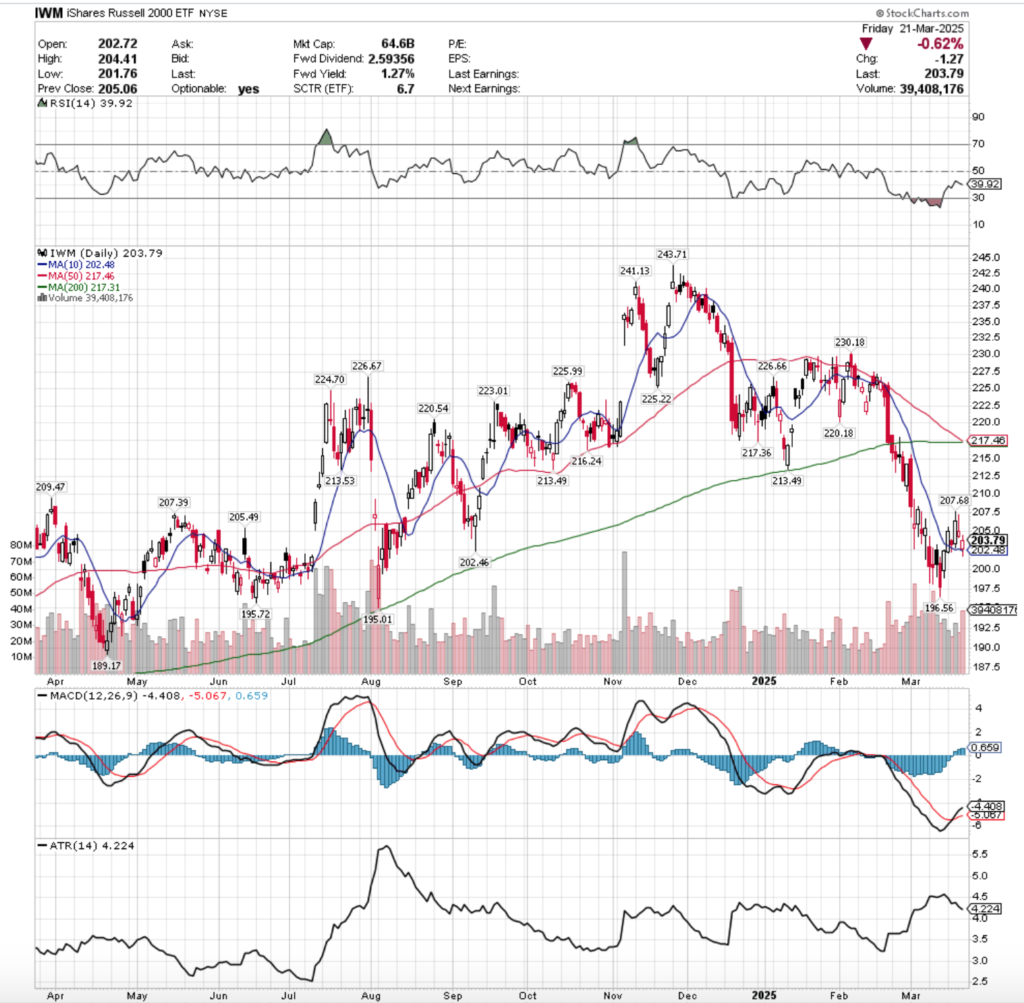
IWM ETF – iShares Russell 2000 ETF’s Technical Performance Over The Past Year
Their RSI is trending towards oversold territory, currently sitting at 39.92, while their MACD has broken above the signal line bullishly following the mini-pump of the past week & a half.
Volumes were +1.87% above the prior year’s average (29,316,000 vs. 28,776,948), which lends subtle clues into the true market sentiment we’ll see shortly.
IWM is experiencing the same Monday morning window as the aforementioned index ETFs, but without a large uptick in volume it does not seem to have staying power.
Monday IWM opened up just beneath the 10 day moving average’s resistance, but was able to find its legs & break through it to the upside & close at over $205/share.
Tuesday resulted in a bearish harami pattern that’s lower shadow showed that there was appetite for IWM to trade below the support of its 10 day moving average on the week’s weakest volume.
Wednesday opened in the middle of Tuesday’s range, tested the support of the 10 DMA but managed to rally higher & temporarily break above the $207.50/share level on the week’s second highest volume.
Thursday formed a bearish harami pattern with Wednesday’s candle, and any notion of IWM breaking & staying above the $207.50/share level was dispelled, as the session’s upper shadow didn’t even make the mark & a bearish shooting star candle formed.
While it closed above its open, Thursday offered the second lowest volume of the week, which one would not expect given the nature of the higher close than open but still down day that had such a test to the upside that the bears ultimately thwarted.
Friday added another layer of interesting to the mix, opening on a gap lower in-line with the support of the 10 DMA, testing below it, before climbing to close above its open, but still for a declining -0.62% session on the week’s highest volume.
This is important for a few reasons.
Firstly, it shows that there is going to be a continued relationship between IWM’s price & the 10 DMA in the near-term.
Second, if the notes above on SPY & QQQ are any indicator, this was a squeeze play heading into the weekend, which when paired with the window up this morning is setting the stage for more declines after oscillators have recalibrated & algorithms can pummel them again (potentially**)
And IWM’s 50 DMA will bearishly cross their 200 DMA today, which will apply downwards pressure tomorrow or later in the week, which means a consolidation is the current best chance scenario.
In the event of a consolidation range forming it will likely oscillate around the 10 DMA & move in the direction of the higher volume trend.
In the worst case scenario things get iffy, as IWM has a bit of Seller sentiment for the next 7 support levels (4/7 skew to Sellers).
If $195.72 breaks down as support all eyes should shift to the $189.17/share level, which IWM will be walked to most likely based on historic volume sentiment & only one support level between the two (which is a weaker Buyers zone).
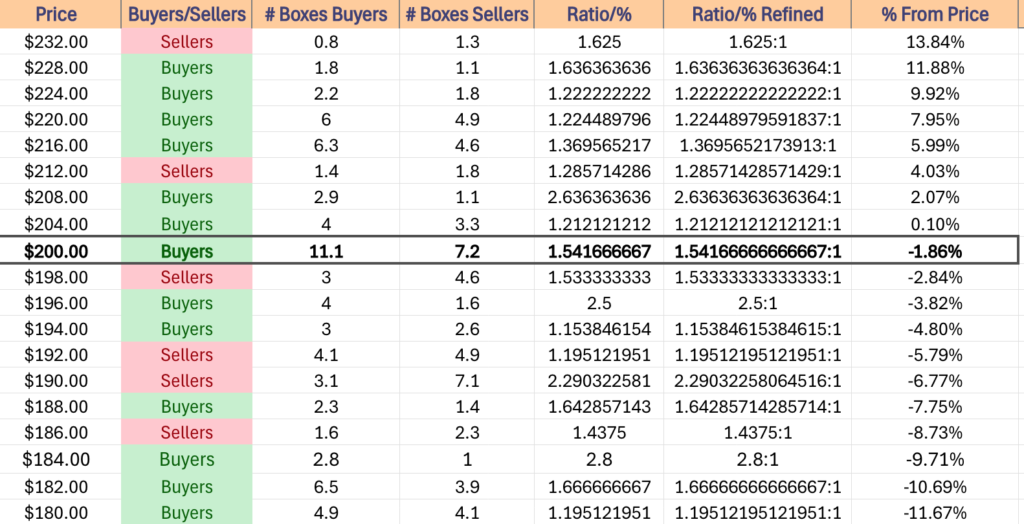
IWM has support at the $202.48 (10 Day Moving Average, Volume Sentiment: Buyers, 1.54:1), $202.46 (Volume Sentiment: Buyers, 1.54:1), $196.56 (Volume Sentiment: Buyers, 2.5:1) & $195.72/share (Volume Sentiment: Buyers, 1.15:1) price levels, with resistance at the $205.49 (Volume Sentiment: Buyers, 1.21:1), $207.39 (Volume Sentiment: Buyers, 1.21:1), $207.68 (Volume Sentiment: Buyers, 1.21:1) & $209.47/share (Volume Sentiment: Buyers, 2.64:1) price levels.
IWM ETF’s Price Level:Volume Sentiment Over The Past ~2-3 Years
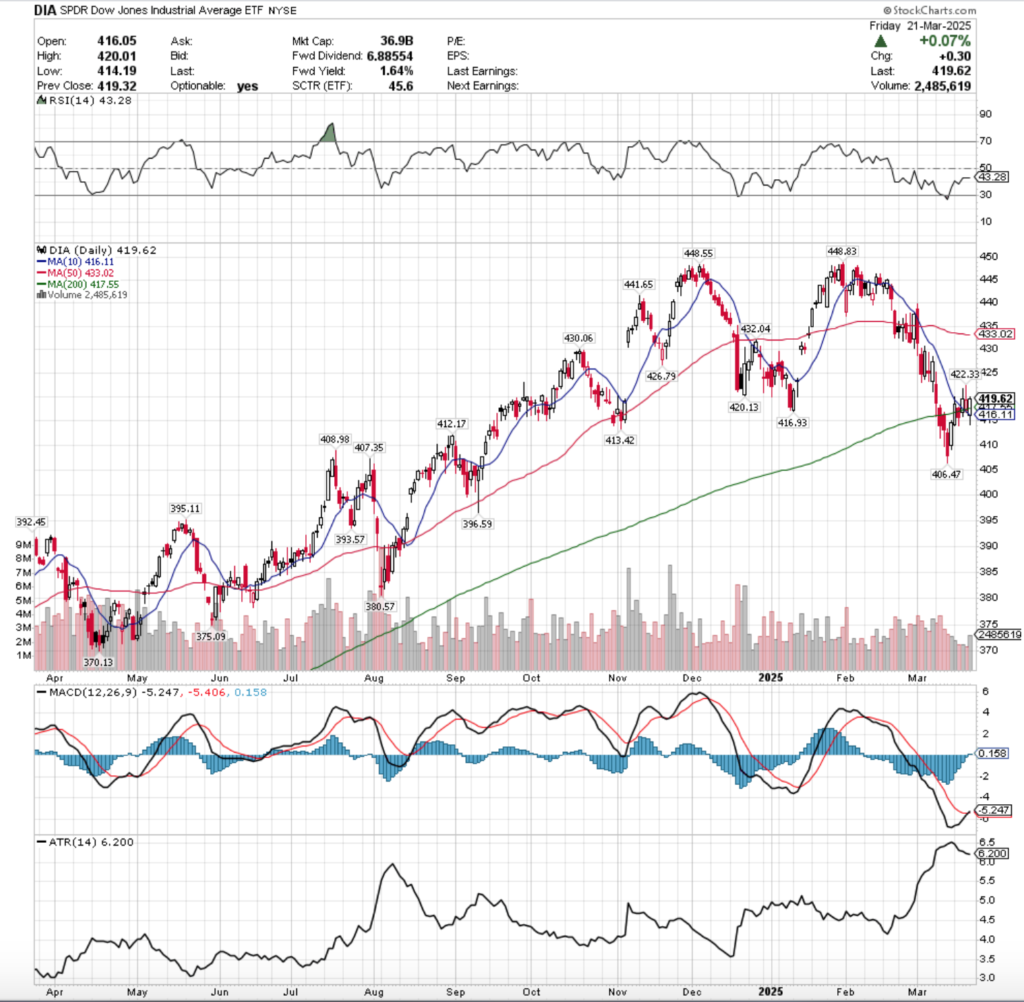
DIA ETF – SPDR Dow Jones Industrial Average ETF’s Technical Performance Over The Past Year
Their RSI is also flat at 43.28, while their MACD is also set up to “dolphin” above the signal line, but does not appear to have much conviction behind a higher move.
Volumes were -37.99% lower than the prior year’s average level (1,986,000 vs. 3,202,731), which is problematic when you consider that DIA had the strongest week of the major index ETFs.
Monday began on an interesting note, as the session managed to break above the 200 DMA’s resistance, but was thwarted by the resistance of the 10 day moving average, making the breakout above the long-term trend line highly questionable.
Tuesday opened lower, broke down through the support of the 200 day moving average & broke south of the $415/share mark, before settling above it but below both the 10 & 200 day moving averages, forming a bearish harami pattern in the process.
Wednesday saw an open below the 10 & 200 DMAs which were set to cross (bearishly), but managed to scrape up an advancing session whose upper shadow indicated that there was some appetite higher, but that bears were still content on keeping prices near the 10 & 200 DMAs.
Thursday threw more bearish signals into the mix, but with a spike of optimism as DIA managed to break north to $422.33 & establish a new resistance level, but while they closed above the day’s open it was below Wednesday’s closing price, and on the week’s weakest volume.
Friday threw a bullish engulfing candle into DIA’s near-term mix, but while it was on the week’s strongest level of volume, it was hardly anything to write home about given how low their overall volume sentiment was for the week.
While it closed above both the 10 & 200 day moving averages it will require a major uptick in advancing volume, much like the aforementioned index ETFs.
As of 2pm there is a decent amount of advancing volume of the day’s gap up, but recall that last week’s volume was participation trophy level & nothing to be taken serious, so the rest of the week’s got a long ways to go if there’ll be any true reversal (pending a major news catalyst).
DIA’s potential consolidation range is similar to the one mentioned above for SPY, as they’re beginning to trade more closely than they did over the prior year now that times have become uncertain (SPY & QQQ traded more tightly & DIA became decoupled & moved more in-line with IWM).
It seems most likely that they’ve continue oscillating around the 200 DMA in the near-t0-mid term, but will be worth watching closer once the 50 day moving average’s resistance closes in & begins to look set to cross bearishly through the long-term trend line.
To the downside/insurance view, prices are in a Seller zone per Friday’s close, with the next price box Even between buyers & sellers historically.
This sets up an interesting situation, as should the $408.98/share support level be tested it is in a Buyer dominated zone that has not been well tested over the past ~5 years.
While the $404-407.99/share level is also Buyer dominated, the sentiment is not as strong, setting sights on the $407.35 & $406.47/share levels, which should they be broken through DIA will most certainly skid into <$400/share.
In the event that this happens the $396-399.99/share zone will become an interesting point to watch, as it has one support level & a lot of untested Seller volume potential.
This is -4.69% away from Friday’s close, so it’s something to consider, but not dwell upon.
DIA has support at the $417.55 (200 Day Moving Average, Volume Sentiment: Sellers, 1.11:1), $416.93 (Volume Sentiment: Sellers, 1.11:1), $416.11 (10 Day Moving Average, Volume Sentiment: Sellers, 1.11:1) & $413.42/share (Volume Sentiment: Even, 1:1) price levels, with resistance at the $420.13 (Volume Sentiment: Buyers, 1.5:1), $422.33 (Volume Sentiment: Buyers, 1.5:1), $426.79 (Volume Sentiment: Sellers, 2.25:1) & $430.06/share (Volume Sentiment: Buyers, 4.5:1) price levels.
DIA ETF’s Price Level:Volume Sentiment Over The Past ~4-5 Years
The Week Ahead
Monday the week kicks off with S&P Flash U.S. Services PMI & S&P Flash U.S. Manufacturing PMI data at 9:45 am.
KB Homes reports earnings after Monday’s closing bell.
Philadelphia Fed Manufacturing Survey data comes out Tuesday at 8:30 am, before S&P Case-Schiller Home Price Index (20 Cities) at 9 am, and Consumer Confidence & New Home Sales data at 10 am.
Tuesday morning’s earnings calls include Canadian Solar, Core & Main, Cormedix & McKormick & Company, followed by GameStop & Worthington Enterprises after the session’s close.
Wednesday begins with Durable-Goods Orders & Durable-Goods Minus Transportation data at 8:30 am, followed by St. Louis Fed President Musalem speaking at 1:10 pm.
Dollar Tree, Chewy, Cintas, Jinko Solar, Paychex & Target Hospitality all report earnings before Wednesday’s opening bell, with Concentrix, H.B. Fuller, Jefferies, MillerKnoll, Petco Health & Wellness, Steelcase & Verint Systems reporting after the closing bell.
Initial Jobless Claims, GDP (Second Revision), Advanced U.S. Trade Balance in Goods, Advanced Retail Inventories & Advanced Wholesale Inventories data are all released at 8:30 am, before Pending Home Sales data at 10 am & Richmond Fed President Barkin speaks at 4:30 pm.
Thursday morning includes earnings from TD Synnex & Winnebego, before Lululemon Athletica, AAR Corp, Argan, Braze & Oxford Industries report earnings after the session’s close.
Friday the week winds down with Personal Income, Personal Spending, PCE Index, PCE (Year-over-Year), Core PCE Index & Core PCE (Year-over-Year) at 8:30 am, before Consumer Sentiment (Final) at 10 am & there are no noteworthy earnings reports.
See you back here next week!
*** I DO NOT OWN SHARES OR OPTIONS CONTRACT POSITIONS IN SPY, QQQ, IWM OR DIA AT THE TIME OF PUBLISHING THIS ARTICLE ***
The VIX closed at 19.28, indicating an implied one day move of +/-1.22% & an implied one month move of +/-5.57% for the S&P 500.
Highest Technical Rated S&P 500 Components Per 3/21/2025’s Close:
1 – PLTR
2 – EQT
3 – VRSN
4 – TPR
5 – TTWO
6 – T
7 – HWM
8 – LUV
9 – PM
10 – GILD
Lowest Technical Rated S&P 500 Components Per 3/21/2025’s Close:
1 – MRNA
2 – CE
3 – DECK
4 – FSLR
5 – TER
6 – ON
7 – TGT
8 – TFX
9 – CZR
10 – SWKS
Highest Volume Rated S&P 500 Components Per 3/21/2025’s Close:
1 – BWA
2 – FMC
3 – TFX
4 – ADM
5 – GIS
6 – PFE
7 – CE
8 – USB
9 – MTB
10 – COP
Lowest Volume Rated S&P 500 Components Per 3/21/2025’s Close:
1 – HSIC
2 – SMCI
3 – GEV
4 – AXON
5 – STX
6 – AMD
7 – INTC
8 – APO
9 – CEG
10 – MRNA
Highest Technical Rated ETFs Per 3/21/2025’s Close:
1 – BABX
2 – YINN
3 – XPP
4 – JNUP
5 – NUGT
6 – SETH
7 – GDMN
8 – UGL
9 – BOIL
10 – CWEB
Lowest Technical Rated ETFs Per 3/21/2025’s Close:
1 – MSOX
2 – CONL
3 – YANG
4 – TSLL
5 – TSLT
6 – TSLR
7 – BCHG
8 – KOLD
9 – MRNY
10 – HZEN
Highest Volume Rated ETFs Per 3/21/2025’s Close:
1 – ACTV
2 – GMAR
3 – DAPR
4 – XCLR
5 – SNPG
6 – GAPR
7 – DYLD
8 – SQEW
9 – QMAR
10 – FMAR
Lowest Volume Rated ETFs Per 3/21/2025’s Close:
1 – OVT
2 – GSID
3 – BDEC
4 – CTEC
5 – BRNY
6 – RTRE
7 – SHRT
8 – CCNR
9 – GGME
10 – IJUN
Highest Technical Rated General Stocks Per 3/21/2025’s Close:
1 – RGC
2 – CMRX
3 – CRVO
4 – IBO
5 – RAASY
6 – YOSH
7 – JYD
8 – CNL
9 – PWRMF
10 – LEMIF
Lowest Technical Rated General Stocks Per 3/21/2025’s Close:
1 – MULN
2 – TCBP
3 – HEPA
4 – BON
5 – STBX
6 – NWTG
7 – ACON
8 – AREB
9 – LGMK
10 – AEON
Highest Volume Rated General Stocks Per 3/21/2025’s Close:
1 – OUT
2 – UNIT
3 – NSA
4 – NLY
5 – GLTO
6 – IBO
7 – RNAZ
8 – VVPR
9 – ELBM
10 – ALUR
Lowest Volume Rated General Stocks Per 3/21/2025’s Close:
1 – CTSDF
2 – CIAFF
3 – BONXF
4 – ROKRF
5 – ARESF
6 – DSNY
7 – MTBLY
8 – CRCUF
9 – FNRN
10 – ANRGF
*** THE LIST ABOVE IS STRICTLY FOR INFORMATIONAL PURPOSES – I MAY OR MAY NOT HAVE OR INITIATE A LONG, SHORT, OR LONG/SHORT POSITION IN ANY NAME ABOVE AT ANY TIME ***
The VIX closed at 19.8, indicating an implied one day move of +/-1.25% & an implied one month move of +/-5.72% for the S&P 500.
Highest Technical Rated S&P 500 Components Per 3/20/2025’s Close:
1 – PLTR
2 – EQT
3 – VRSN
4 – CVS
5 – TPR
6 – TPL
7 – HWM
8 – PM
9 – T
10 – GL
Lowest Technical Rated S&P 500 Components Per 3/20/2025’s Close:
1 – MRNA
2 – DECK
3 – FSLR
4 – CE
5 – TER
6 – ON
7 – TFX
8 – TGT
9 – WST
10 – MCHP
Highest Volume Rated S&P 500 Components Per 3/20/2025’s Close:
1 – ACN
2 – IT
3 – DRI
4 – FDS
5 – EPAM
6 – JBL
7 – TXT
8 – SOLV
9 -FDX
10 – LKQ
Lowest Volume Rated S&P 500 Components Per 3/20/2025’s Close:
1 – ENPH
2 – WBA
3 – MKTX
4 – CNC
5 – NXPI
6 – JNPR
7 – SMCI
8 – MRNA
9 – CEG
10 – AXON
Highest Technical Rated ETFs Per 3/20/2025’s Close:
1 – BABX
2 – YINN
3 – XPP
4 – JNUG
5 – NUGT
6 – CWEB
7 – GDMN
8 – BOIL
9 – UGL
10 – SETH
Lowest Technical Rated ETFs Per 3/20/2025’s Close:
1 – MSOX
2 – CONL
3 – TSLL
4 – TSLT
5 – YANG
6 – TSLR
7 – KOLD
8 – DEFG
9 – BCHG
10 – MRNY
Highest Volume Rated ETFs Per 3/20/2025’s Close:
1 – PSMR
2 – MYCL
3 – MYCM
4 – MYCK
5 – MYCN
6 – XBJL
7 – KURE
8 – TJUL
9 – LLDR
10 – BBC
Lowest Volume Rated ETFs Per 3/20/2025’s Close:
1 – CCNR
2 – PSMD
3 – QTJA
4 – PBJA
5 – FDVL
6 – IQSM
7 – JEMB
8 – TBFC
9 – JUNM
10 – BDEC
Highest Technical Rated General Stocks Per 3/20/2025’s Close:
1 – RGC
2 – CMRX
3 – RAASY
4 – YOSH
5 – CRVO
6 – PWRMF
7 – GTII
8 – ATGL
9 – LEMIF
10 – JYD
Lowest Technical Rated General Stocks Per 3/20/2025’s Close:
1 – MULN
2 – ACON
3 – AREB
4 – CLEU
5 – RNAZ
6 – APDN
7 – AEON
8 – BHIL
9 – CYN
10 – CMCT
Highest Volume Rated General Stocks Per 3/20/2025’s Close:
1 – IBO
2 – WINT
3 – TWO
4 – OUT
5 – SAG
6 – EYEN
7 – OPTN
8 – TOMZ
9 – PRA
10 – IMG
Lowest Volume Rated General Stocks Per 3/20/2025’s Close:
1 – DBIN
2 – AILEQ
3 – ASPU
4 – GLGI
5 – DSNY
6 – CTSDF
7 – IDWM
8 – IPHA
9 – MFON
10 – ASAPF
*** THE LIST ABOVE IS STRICTLY FOR INFORMATIONAL PURPOSES – I MAY OR MAY NOT HAVE OR INITIATE A LONG, SHORT, OR LONG/SHORT POSITION IN ANY NAME ABOVE AT ANY TIME ***
The VIX closed at 19.9, indicating an implied one day move of +/-1.25% & an implied one month move of +/-5.75% for the S&P 500.
Highest Technical Rated S&P 500 Components Per 3/19/2025’s Close:
1 – PLTR
2 – EQT
3 – TPL
4 – TPR
5 – PM
6 – VRSN
7 – HWM
8 – T
9 – CVS
10 – WBD
Lowest Technical Rated S&P 500 Components Per 3/19/2025’s Close:
1 – MRNA
2 – FSLR
3 – CE
4 – DECK
5 – TER
6 – ON
7 – TFX
8 – TGT
9 – TSLA
10 – ALGN
Highest Volume Rated S&P 500 Components Per 3/19/2025’s Close:
1 – PGR
2 – IT
3 – APH
4 – FDS
5 – ETR
6 – CCI
7 – KMX
8 – GIS
9 – JBL
10 – ROST
Lowest Volume Rated S&P 500 Components Per 3/19/2025’s Close:
1 – WBA
2 – SBUX
3 – PARA
4 – WDC
5 – CE
6 – CVS
7 – ZTS
8 – K
9 – MCHP
10 – AMGN
Highest Technical Rated ETFs Per 3/19/2025’s Close:
1 – BABX
2 – YINN
3 – XPP
4 – BOIL
5 – CWEB
6 – JNUG
7 – NUGT
8 – KTEC
9 – UNG
10 – GDMN
Lowest Technical Rated ETFs Per 3/19/2025’s Close:
1 – MSOX
2 – YANG
3 – CONL
4 – TSLL
5 – TSLT
6 – TSLR
7 – KOLD
8 – DEFG
9 – BCHG
10 – HZEN
Highest Volume Rated ETFs Per 3/19/2025’s Close:
1 – GUMI
2 – LIAF
3 – LIAE
4 – JEMB
5 – PRMN
6 – SDCP
7 – DARP
8 – LYLD
9 – BLDG
10 – CCSB
Lowest Volume Rated ETFs Per 3/19/2025’s Close:
1 – CCNR
2 – KCSH
3 – PSCQ
4 – CPLB
5 – IQSM
6 – LBO
7 – PSMO
8 – SHRT
9 – BBEM
10 – CPNS
Highest Technical Rated General Stocks Per 3/19/2025’s Close:
1 – RGC
2 – CMRX
3 – GTII
4 – QBTS
5 – RAASY
6 – YOSH
7 – ATGL
8 – GV
9 – PWRMF
10 – YHC
Lowest Technical Rated General Stocks Per 3/19/2025’s Close:
1 – MULN
2 – ACON
3 – CLEU
4 – STBX
5 – AREB
6 – APDN
7 – ASBP
8 – AEON
9 – CYCU
10 – LICN
Highest Volume Rated General Stocks Per 3/19/2025’s Close:
1 – SLG
2 – ATER
3 – BDTX
4 – GNTA
5 – APDN
6 – BDRX
7 – UNIT
8 – CLVR
9 – LXEH
10 – ADTX
Lowest Volume Rated General Stocks Per 3/19/2025’s Close:
1 – CTSDF
2 – NSFDF
3 – WNLV
4 – RHHBF
5 – AVCNF
6 – IDWM
7 – VHIBF
8 – MFON
9 – NCRA
10 – YYGH
*** THE LIST ABOVE IS STRICTLY FOR INFORMATIONAL PURPOSES – I MAY OR MAY NOT HAVE OR INITIATE A LONG, SHORT, OR LONG/SHORT POSITION IN ANY NAME ABOVE AT ANY TIME ***
The VIX closed at 21.7, indicating an implied one day move of +/-1.37% & an implied one month move of +/-6.27% for the S&P 500.
Highest Technical Rated S&P 500 Components Per 3/18/2025’s Close:
1 – PLTR
2 – EQT
3 – GILD
4 – PM
5 – VRSN
6 – CVS
7 – INTC
8 – T
9 – CME
10 – TPL
Lowest Technical Rated S&P 500 Components Per 3/18/2025’s Close:
1 – MRNA
2 – DECK
3 – FSLR
4 – TER
5 – TSLA
6 – CE
7 – ON
8 – TFX
9 – TGT
10 – ALGN
Highest Volume Rated S&P 500 Components Per 3/18/2025’s Close:
1 – IT
2 – ETR
3 – GLW
4 – PNC
5 – ECL
6 – INCY
7 – DFS
8 – MDT
9 – CCI
10 – HOLX
Lowest Volume Rated S&P 500 Components Per 3/18/2025’s Close:
1 – WBA
2 – MCHP
3 – HSIC
4 – HSY
5 – WYNN
6 – MKTX
7 – DHI
8 – EL
9 – BA
10 – APO
Highest Technical Rated ETFs Per 3/18/2025’s Close:
1 – BABX
2 – YINN
3 – XPP
4 – CWEB
5 – JNUG
6 – NUGT
7 – KTEC
8 – SETH
9 – BOIL
10 – ETHD
Lowest Technical Rated ETFs Per 3/18/2025’s Close:
1 – MSOX
2 – CONL
3 – TSLL
4 – TSLT
5 – YANG
6 – TSLR
7 – BCHG
8 – KOLD
9 – LTCN
10 – FXP
Highest Volume Rated ETFs Per 3/18/2025’s Close:
1 – TOUS
2 – GGUS
3 – ACLC
4 – JSML
5 – FLAU
6 – TINT
7 – ARKA
8 – HFSP
9 – GCOR
10 – FLSW
Lowest Volume Rated ETFs Per 3/18/2025’s Close:
1 – HZEN
2 – PSCQ
3 – NVBU
4 – SEPW
5 – TBFC
6 – PSMO
7 – ZTWO
8 – FEBT
9 – IFEB
10 – HECO
Highest Technical Rated General Stocks Per 3/18/2025’s Close:
1 – RGC
2 – HSTOQ
3 – CMRX
4 – YOSH
5 – QBTS
6 – GV
7 – ATGL
8 – PWRMF
9 – TKAMY
10 – GRRR
Lowest Technical Rated General Stocks Per 3/18/2025’s Close:
1 – MULN
2 – ACON
3 – DNMR
4 – CLEU
5 – LTRPB
6 – RNAZ
7 – ASBP
8 – CYCU
9 – AREB
10 – CYN
Highest Volume Rated General Stocks Per 3/18/2025’s Close:
1 – INDP
2 – ADTX
3 – VINC
4 – STBX
5 – SCNX
6 – FEAM
7 – UNIT
8 – GNPX
9 – CANF
10 – NLY
Lowest Volume Rated General Stocks Per 3/18/2025’s Close:
1 – CTSDF
2 – OILSF
3 – PAANF
4 – SCTSF
5 – CBDBY
6 – OMZNF
7 – FDVA
8 – AHOTF
9 – GASXF
10 – PSYTF
*** THE LIST ABOVE IS STRICTLY FOR INFORMATIONAL PURPOSES – I MAY OR MAY NOT HAVE OR INITIATE A LONG, SHORT, OR LONG/SHORT POSITION IN ANY NAME ABOVE AT ANY TIME ***
XLK, the Technology Sector Select SPDR Fund ETF has had quite the volatile past year, sitting currently just +4.43% above it’s price one year ago, -11.4% below their 52-week high in February of 2025 & +12.94% above their 52-week low in August of 2024 (all figures ex-distributions).
This shouldn’t come as a surprise given how volatile the tech sector has been over the past year, but it is interesting to think that they’re basically just above par from one year ago & right in the center of their 52-week high/low range.
Some of XLK’s largest holdings include Apple Inc. (AAPL), NVIDIA Corp. (NVDA), Microsoft Corp. (MSFT), Broadcom Inc. (AVGO), Salesforce Inc. (CRM), Oracle Corp. (ORCL), Cisco Systems Inc. (CSCO), International Business Machines Corp. (IBM), Accenture PLC. A (ACN) & Palantir Technologies Inc. Class A (PLTR).
XLK has not been able to escape the difficult past month that broader markets have faced due to tariff excitement & mixed news on inflation across the globe & will likely continue to see volatility in the weeks to come.
With that in mind, it is a good time to check in on their volume sentiment at the price levels that they’ve traded at over the past few years to gauge how market participants have behaved at these levels before.
Below is a brief technical analysis of XLK, as well as a price level:volume sentiment analysis of the price levels XLK has traded at over the ~3 years.
Included in this data is also their recent support & resistance levels so that readers can gain insight into how strong/weak these support/resistance levels may be in the future, based on past investor behavior.
It is not intended to serve as financial advice, but rather as an additional tool to reference while performing your own due diligence on XLK.
Technical Analysis Of XLK, The Technology Sector Select SPDR Fund
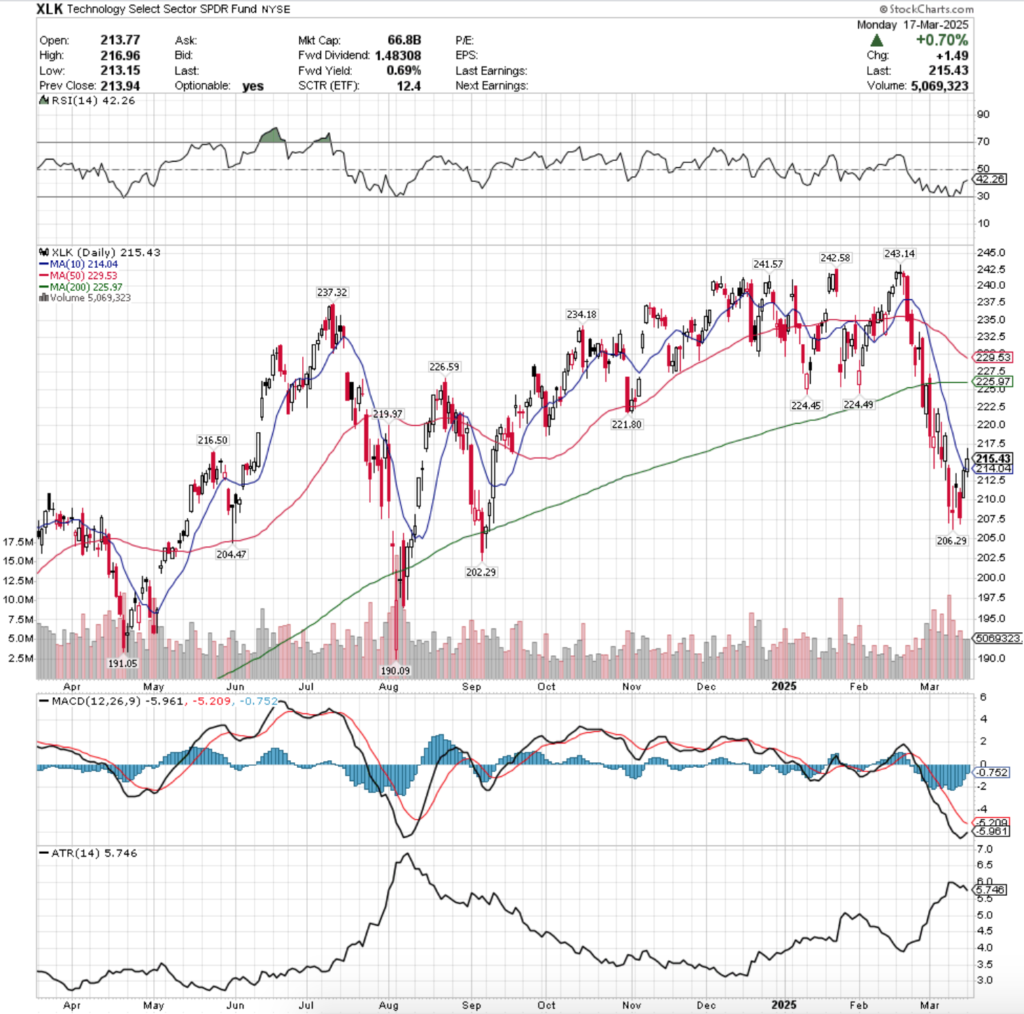
XLK ETF – Technology Select Sector SPDR Fund ETF’s Technical Performance Over The Past Year
Their RSI is trending back towards the neutral 50 mark & closed yesterday at 42.26, while their MACD is still in bearish territory, but is rapidly approaching the signal line & may cross bullishly in the coming two days.
Volumes over the past week & a day have been +32.83% above the prior year’s average level (6,661,666.67 vs. 5,015,240), which is cause for concern given that there have only really been two truly advancing days, both of which had the lowest volumes of that time period.
There has been a lot of enthusiasm to get out of the pool among market participants, and with the 50 day moving average bearing down on the 200 DMA & set to bearishly crossover within a week there appears to be more declines on the horizon.
Last Monday’s declining volume eclipses all other volumes going back until August when XLK faced serious declines & went down to reach their 52-week low, but these recent losses have been more gradual & controlled compared to the large gaps seen seven months ago.
Last Monday’s session opened as a gap down, but far closer to the previous Friday’s candle than the gaps down of the aforementioned period.
Tuesday resulted in a high wave spinning top, indicating a great deal of indecision, but the low range of the day became a local support level at $206.29, while the day’s high was $211.91 on the second highest volume of the past six sessions.
This marks extreme indecision in the market, which was reflected in the next day’s spinning top with long upper & lower shadows, except on Wednesday there was light volume and despite the gap up open, the session closed lower than the open, indicating bearish sentiment was spreading.
Thursday opened on a gap down & temporarily broke down the $207.50/share level, but managed to recover to close above it, before Friday’s squeeze into the weekend session, where on low volume prices were able to power higher to close at $213.94/share, just below the 10 day moving average’s resistance.
Yesterday was able to open higher and retraced into Friday’s range briefly before breaking out above the 10 DMA’s resistance.
Yesterday was unable to reach the $217.50/share level, and closed with a long upper shadow, indicating that the bears were still relatively in control, particularly given the low volume, which was not enough to build a sustainable reversal.
Pending some type of upside catalyst, XLK doesn’t look primed to break out to the upside in the near-term, and even then it will require a great deal of advancing volume behind the move in order to be sustainable.
Now that price has met the 10 DMA it is likely to oscillated around it in the coming week(s) while we await news to send XLK higher or lower & while the 200 & 50 day moving averages continue lower towards price.
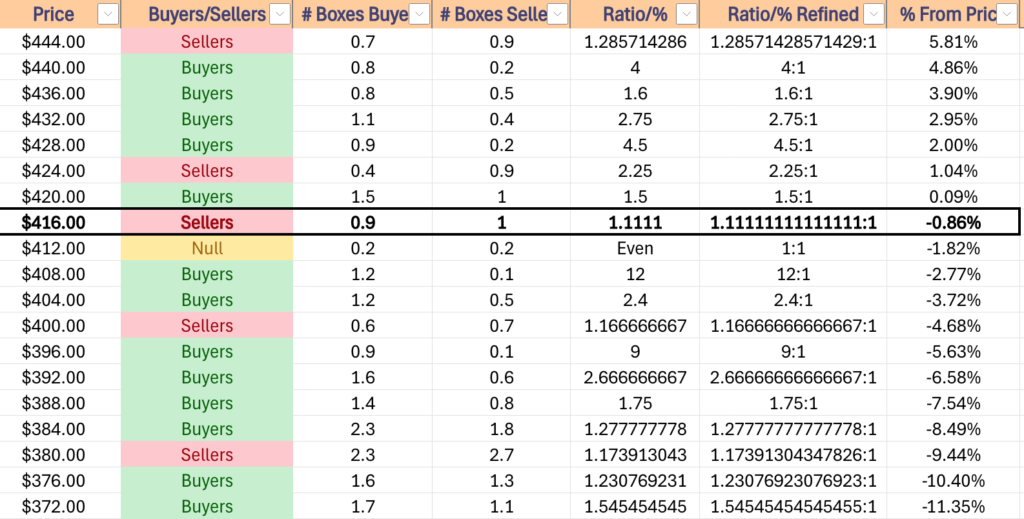
Thee $206.29/share support level will be an interesting one to watch, as should XLK get there it leads into a zone where there is a level of support for the next ~1 & 2% moves down, but then on the one year chart the floor falls out below XLK & the next support level is -5.56% lower.
Should we enter that zone, the $202.29/share support level will be critical, and it falls in a price zone that has historically been Seller dominated at a rate of 1.14:1.
From there, if the $198-199.99/share level doesn’t hold up, it is all Seller zones until the $191.99/share mark, so there will be an expected further slide down towards testing the lower one year support levels.
The following section lays out XLK’s one year support/resistance levels, as well as their Buyer:Seller (Seller:Buyer) ratios at each price level that they’ve traded at over the past ~3 years, which can be used as a barometer for estimating the expected strength/weakness of each of the support/resistance levels.
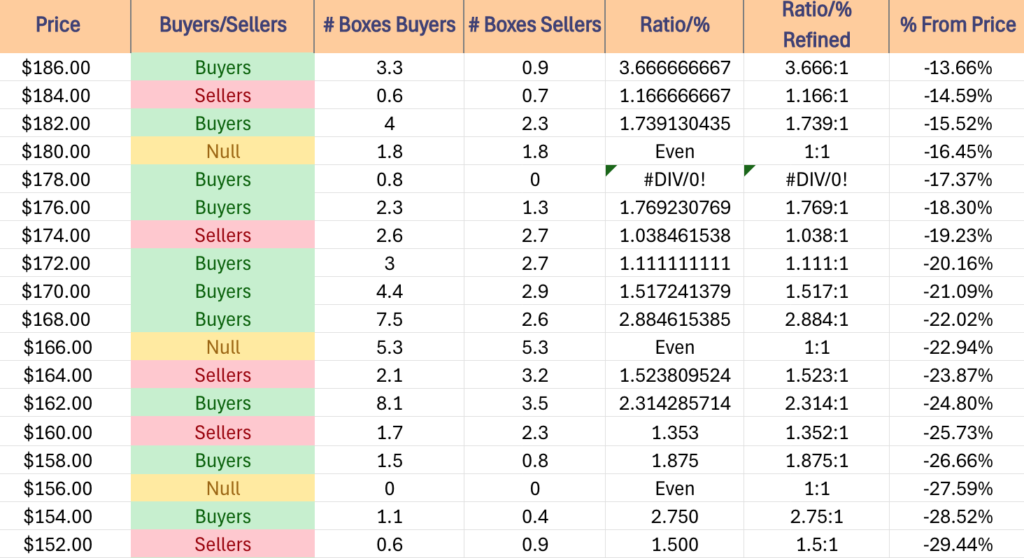
Price Level:Volume Sentiment Analysis For XLK, The Technology Select Sector SPDR Fund ETF
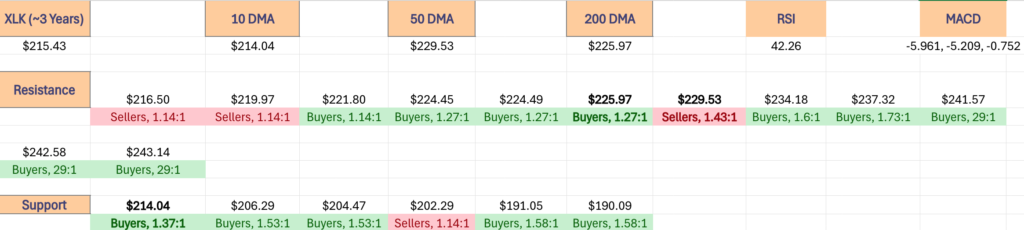
The top table below shows the support & resistance levels of XLK from the past year’s chart, as well as their price level:volume sentiment at each from data covering the past ~3 years, using Wednesday 3/17/2025’s closing data for their price & moving averages/other technicals.
The moving averages are denoted with bold.
The next charts show the volume sentiment at each individual price level XLK has traded at over the past ~3 years.
Beneath them is a copy & pasteable list of the same data, where the support/resistance levels are denoted in bold.
All ratios with “0” in the denominator are denoted with a “*”.
NULL values are price levels that had limited trading volume, whether it be due to gaps, quick advances or they are at price extremes; in the event that they are retested & there is more data they would have a distinct “Buyers”, “Sellers” or “Even” title.
This is not intended as financial advice, but rather another tool to consider when performing your own research & due diligence on XLK.
XLK ETF’s Price Level:Volume Sentiment Over The Past ~3 Years At Their One Year Support/Resistance Levels
XLK ETF’s Price Level:Volume Sentiment Over The Past ~3 Years
Price Level:Volume Sentiment For XLK ETF Over The Past ~3 Years
Price Level:Volume Sentiment For XLK ETF Over The Past ~3 Years
XLK ETF’s Price Level:Volume Sentiment Over The Past ~3 Years
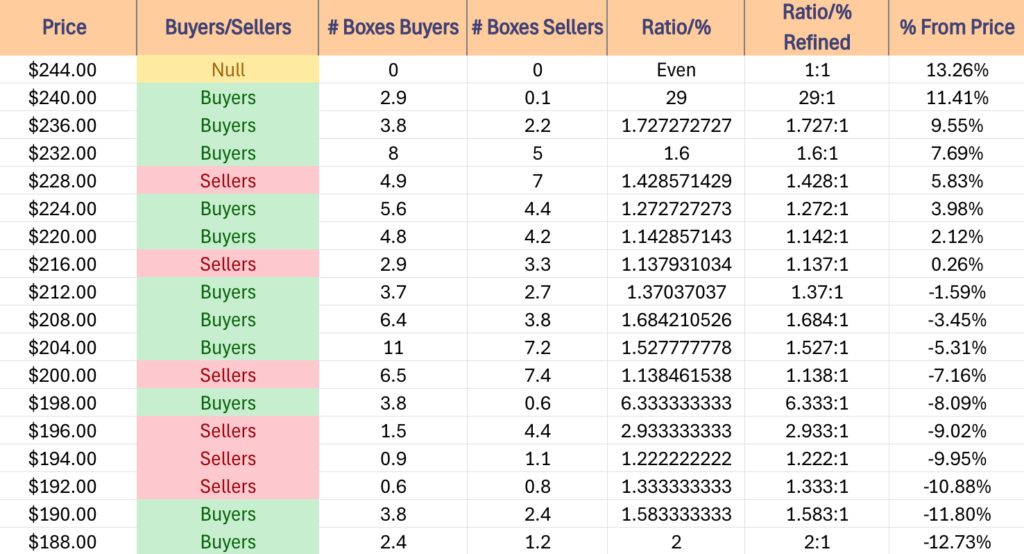
$244 – NULL – 0:0*, +13.26% From Current Price Level
$240 – Buyers – 29:1, +11.41% From Current Price Level
$236 – Buyers – 1.73:1, +9.55% From Current Price Level
$232 – Buyers – 1.6:1, +7.69% From Current Price Level
$228 – Sellers – 1.43:1, +5.83% From Current Price Level – 50 Day Moving Average*
$224 – Buyers – 1.27:1, +3.98% From Current Price Level – 200 Day Moving Average*
$220 – Buyers – 1.14:1, +2.12% From Current Price Level
$216 – Sellers – 1.14:1, +0.26% From Current Price Level
$212 – Buyers – 1.37:1, -1.59% From Current Price Level – 10 Day Moving Average & Current Price Box**
$208 – Buyers – 1.68:1, -3.45% From Current Price Level
$204 – Buyers – 1.53:1, -5.31% From Current Price Level
$200 – Sellers – 1.14:1, -7.16% From Current Price Level
$198 – Buyers – 6.33:1, -8.09% From Current Price Level
$196 – Sellers – 2.93:1, -9.02% From Current Price Level
$194 – Sellers – 1.22:1, -9.95% From Current Price Level
$192 – Sellers – 1.33:1, -10.88% From Current Price Level
$190 – Buyers – 1.58:1, -11.8% From Current Price Level
$188 – Buyers – 2:1, -12.73% From Current Price Level
$186 – Buyers – 3.67:1, -13.66% From Current Price Level
$184 – Sellers – 1.17:1, -14.59% From Current Price Level
$182 – Buyers – 1.74:1, -15.52% From Current Price Level
$180 – Even – 1:1, -16.45% From Current Price Level
$178 – Buyers – 0.8:0*, -17.37% From Current Price Level
$176 – Buyers – 1.77:1, -18.3% From Current Price Level
$174 – Sellers – 1.04:1, -19.23% From Current Price Level
$172 – Buyers – 1.11:1, -20.16% From Current Price Level
$170 – Buyers – 1.52:1, -21.09% From Current Price Level
$168 – Buyers – 2.88:1, -22.02% From Current Price Level
$166 – Even – 1:1, -22.94% From Current Price Level
$164 – Sellers – 1.52:1, -23.87% From Current Price Level
$162 – Buyers – 2.31:1, -24.8% From Current Price Level
$160 – Sellers – 1.35:1, -25.73% From Current Price Level
$158 – Buyers- 1.88:1, -26.66% From Current Price Level
$156 – NULL – 0:0*, -27.59% From Current Price Level
$154 – Buyers – 2.75:1, -28.52% From Current Price Level
$152 – Sellers – 1.5:1, -29.44% From Current Price Level
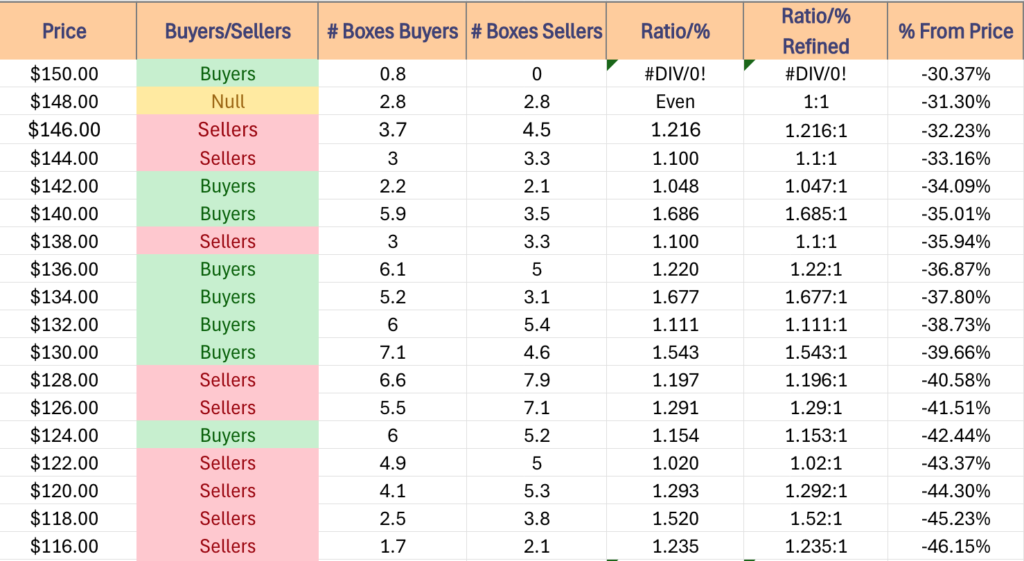
$150 – Buyers – 0.8:0*, -30.37% From Current Price Level
$148 – Even, 1:1, -31.3% From Current Price Level
$146 – Sellers – 1.22:1, -32.23% From Current Price Level
$144 – Sellers – 1.1:1, -33.16% From Current Price Level
$142 – Buyers – 1.05:1, -34.09% From Current Price Level
$140 – Buyers – 1.69:1, -35.01% From Current Price Level
$138 – Sellers – 1.1:1, -35.94% From Current Price Level
$136 – Buyers – 1.22:1, -36.87% From Current Price Level
$134 – Buyers – 1.68:1, -37.8% From Current Price Level
$132 – Buyers – 1.11:1, -38.73% From Current Price Level
$130 – Buyers – 1.54:1, -39.66% From Current Price Level
$128 – Sellers – 1.2:1, -40.58% From Current Price Level
$126 – Sellers – 1.29:1, -41.51% From Current Price Level
$124 – Buyers – 1.15:1, -42.44% From Current Price Level
$122 – Sellers – 1.02:1, -43.37% From Current Price Level
$120 – Sellers – 1.29:1, -44.3% From Current Price Level
$118 – Sellers – 1.52:1, -45.23% From Current Price Level
$116 – Sellers – 1.24:1, -46.15% From Current Price Level
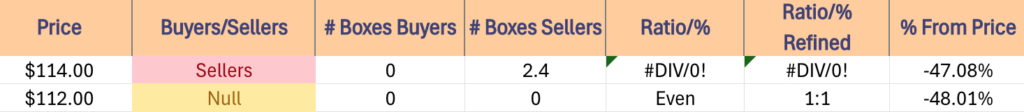
$114 – Sellers – 2.4:0*, -47.08% From Current Price Level
$112 – NULL – 0:0*, -48.01% From Current Price Level
*** I DO NOT OWN SHARES OR OPTIONS CONTRACT POSITIONS IN XLK AT THE TIME OF PUBLISHING THIS ARTICLE ***