RCM Technologies, Inc. RCMT Stock

RCM Technologies stock trades under the ticker RCMT & has shown recent bullishness that traders & investors should take a closer look into.

RCMT stock closed at $9.86/share on 3/31/2022.

RCM Technologies, Inc. RCMT Stock’s Technicals Broken Down

RCM Technologies RCMT Stock's Technical Performance Over The Last Year

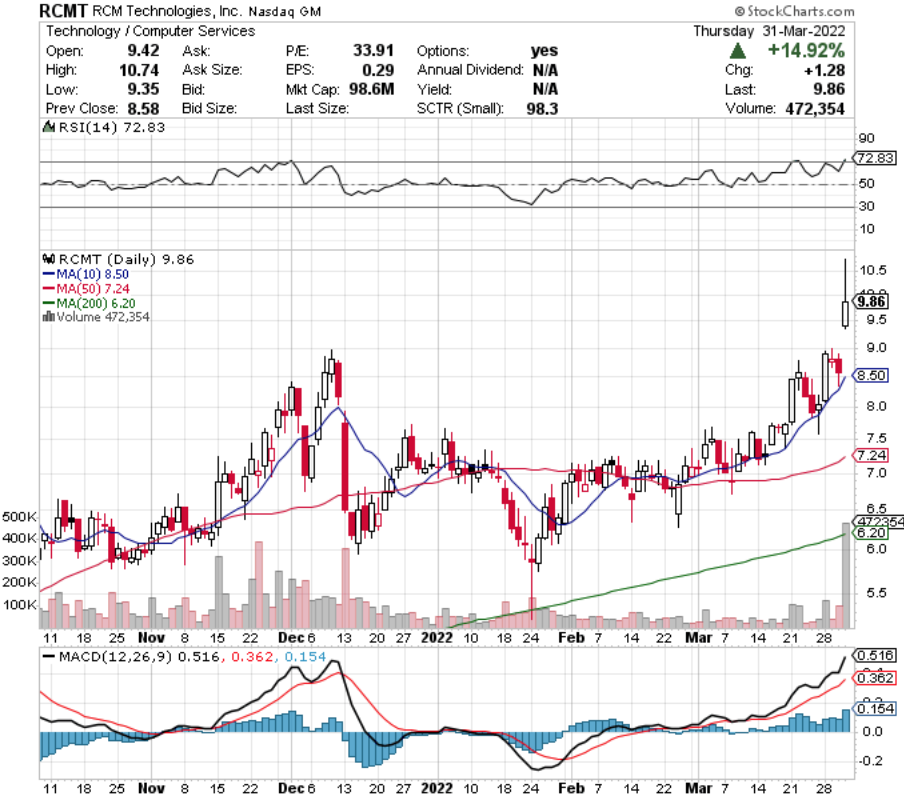
RCMT Stock Price: $9.86

10 Day Moving Average: $8.50

50 Day Moving Average: $7.24

200 Day Moving Average: $6.20

RSI: 72.83

Yesterday, RCMT stock gapped up 14.92%, breaking above its 10 day moving average.

Their trading volume was far above average compared to the year prior.

RCMT stock’s RSI is approaching overbought, and their MACD line is beginning to curl over a bit, signaling that there may be some temporary dips in price as they establish a new trading range.

RCM Technologies RCMT Stock As A Long-Term Investment

Investors focused on holding their positions for the long-term will find RCMT stock’s P/E (ttm) of 30.64 to be appealing, but may balk at their P/B (mrq) of 3.66.

RCM Technologies recently reported 44.1% Quarterly Revenue Growth Y-o-Y.

Their balance sheet may require a deeper review, as they have $2.82M in Total Cash (mrq) & $12.29M in Total Debt (mrq).

RCMT stock does not offer a dividend yield.

This is likely part of why they only have 35% of their outstanding share float held by institutional investors.

RCM Technologies RCMT Stock As A Short-Term Trade Using Options

Short-term focused traders can use options to profit from RCMT stock’s price movements, while hedging against broader market volatility.

I am looking at the contracts with the 4/14 expiration date.

The $7.50 & $10 calls look interesting, although illiquid, as they have open interest levels of <100.

The $10 puts are the only ones at a strike price that is in-the-money, but they are also very illiquid.

Tying It All Together

All-in-all, RCMT stock is worth taking a closer look into for traders & investors.

Investors will find their valuation metrics appealing, but may be disappointed by their lack of a dividend yield.

Traders will like their current momentum, but be disappointed by the lack of liquidity in their options contracts.

RCMT stock is worth conducting further research on, regardless of your trading style.

*** I DO NOT OWN SHARES OF RCMT STOCK ***

Alpine Income Property Trust Inc. PINE Stock

Alpine Income Property Trust Inc. stock trades under the ticker PINE & has shown recent bullishness that traders & investors should look closer into.

PINE stock closed at $19.06/share on 3/31/2022.

Alpine Income Property Trust Inc. PINE Stock’s Technicals Broken Down

Alpine Income Property Trust Inc. PINE Stock's Technical Performance Over The Last Year

PINE Stock Price: $19.06

10 Day Moving Average: $18.74

50 Day Moving Average: $18.88

200 Day Moving Average: $18.49

RSI: 55.89

MACD: -0.034

Yesterday, PINE stock completed a bullish MACD crossover, while also breaking out over their 50 day moving average.

They have traded on average volume this past week, compared to the year prior, and their RSI is slightly overbought at 55.89.

PINE stock needs to cross through the $19.09, $19.23 & $19.42/share resistance levels.

Alpine Income Property Trust, Inc. PINE Stock As A Long-Term Investment

Investors will find PINE stock’s valuation metrics appealing, with a P/E(ttm) of 21.11 & a P/B (mrq) of 1.12.

They recently reported 75.9% Quarterly Revenue Growth Y-o-Y, with 4,363.4% Quarterly Earnings Growth Y-o-Y.

PINE stock’s balance sheet will require a closer examination, with Total Cash (mrq) of $10.95M & Total Debt (mrq) of $267.91M.

PINE stock pays a 5.4% dividend yield, which appears fairly safe as their payout ratio is 42%.

60.4% of PINE stock’s outstanding share float is owned by institutional investors.

Alpine Income Property Trust, Inc. PINE Stock As A Short-Term Trade Using Options

Traders can use options to hedge against volatility, while profiting from price movements in any direction for PINE stock.

I am looking at the contracts with the 4/14 expiration date.

The $17.50 & $20 call options look appealing, but extremely illiquid with almost no open interest.

The $20 puts are much more liquid, but still suffer from low levels of open interest.

Tying It All Together

Overall, PINE stock has many interesting characteristics that traders & investors will find appealing.

Investors will like their valuation metrics, as well as their dividend yield, but may want to do a bit of digging in their balance sheet.

Traders will like their current momentum, but will be disappointed by their low levels of open interest on their options contracts.

PINE stock is worth taking a closer look at, regardless of your trading style.

*** I DO NOT OWN SHARES OF PINE STOCK ***

Grifols, SA GRFS Stock Analysis

Grifols, SA stock trades under the ticker GRFS & has shown recent bullishness amid market volatility that traders & investors should take a closer look into.

GRFS stock closed at $11.81/share on 3/31/2022.

Grifols, SA GRFS Stock’s Technicals Broken Down

Grifols, SA GRFS Stock's Technical Performance Over The Last Year

GRFS Stock Price: $11.81

10 Day Moving Average: $10.88

50 Day Moving Average: $11.42

200 Day Moving Average: $13.25

RSI: 58.43

MACD: -0.148

Yesterday, GRFS stock completed a bullish MACD crossover, breaking out above both its 10 & 50 day moving averages.

Their RSI is 58, and yesterday’s trading volume was much higher than average compared to the last year, signaling more short-term momentum to come.

They must now test the $12.39, $12.50 & $12.83/share resistance levels.

Grifols, SA GRFS Stock As A Long-Term Investment

Long-term oriented investors will find GRFS stock’s valuation metrics appealing, with a P/E (ttm) of 36.3 & a P/B (mrq) of 1.09.

They recently reported -8.5% Quarterly Revenue Growth Y-o-Y, which may pose an issue for some investors.

GRFS stock’s balance sheet may require a closer look, with Total Cash (mrq) of $2.69B & Total Debt (mrq) of $9.32B.

They pay a 6.12% dividend yield, which may be unsustainable due to their high payout ratio.

42.8% of GRFS stock’s outstanding share float is owned by institutional investors.

Grifols, SA GRFS Stock As A Short-Term Trade Using Options

Short-term oriented traders can use options to profit from movements in GRFS stock’s price movements, while hedging against broader market volatility.

I am looking at the contracts with the 4/14 expiration date.

The $10 & $12.50 call options look appealing, although the former is relatively illiquid.

The $12.50 puts also look interesting, but have very low levels of open interest.

Tying It All Together

Overall, GRFS stock has many interesting attributes that traders & investors may like.

Investors will like their valuation metrics, but be skeptical about the strength of their dividend moving forward.

Traders will like their current momentum, but be disappointed by the lack of liquidity in their options contracts.

GRFS stock is worth taking a closer look into, regardless of your trading style.

*** I DO NOT OWN SHARES OF GRFS STOCK ***

Integra LifeSciences Holdings Corp. IART Stock

Integra LifeSciences Holdings Corp. stock trades under the ticker IART & has shown recent bullishness that traders & investors should take a closer look at.

IART closed at $66.77/share on 3/29/2022.

Integra LifeSciences Holdoings Corp. IART Stock’s Technicals Broken Down

Integra LifeSciences Holdings Corp. IART Stock's Technical Performance Over The Last Year

IART Stock Price: $66.77

10 Day Moving Average: $64.38

50 Day Moving Average: $65.54

200 Day Moving Average: $68.17

RSI: 57.6

MACD: -0.45

Yesterday, IART stock completed a bullish MACD crossover, while breaking out above its 10 day moving average.

Their trading volume was above average compared to the year prior’s volumes & their RSI is only slightly overbought, signaling more bullish momentum to come in the near-term.

They will need to break through the $67.02, $67.55 & $67.82/share resistance levels.

Integra LifeSciences Holdings Corp. IART Stock As A Long-Term Investment

Long-term oriented investors may find IART stock’s valuation metrics to be a bit rich, with a P/E (ttm) of 31.75 & a P/B (mrq) of 3.11.

They recently reported Quarterly Revenue Growth Y-o-Y of 4.3%.

IART stock’s balance sheet will require a more thorough examination, with $513.5M in Total Cash (mrq) & Total Debt (mrq) of $1.7B.

They do not offer a dividend yield.

Despite this, 95% of their outstanding share float is held by institutional investors.

Integra LifeSciences Holdings Corp. IART Stock As A Short-Term Trade Using Options

Traders can use options to profit from short-term price movements in any direction for IART stock.

I am looking at the contracts with the 4/14 expiration date.

The $65 & $70 call options look interesting, with the latter having more open interest than the former.

There is currently no open interest for any of the in or at-the-money puts, but if there were, the $70 & $75 strike prices would be areas of interest.

Tying It All Together

All-in-all, IART stock looks to have many advantages that traders & investors will be pleased with.

Their current momentum will be interesting to traders in the near-term, although they may wish for more liquid options.

Investors may think that their valuation metrics are fair given their industry, but will be disappointed by their lack of a dividend.

IART stock is worth taking a closer look into, regardless of your trading style.

*** I DO NOT OWN SHARES OF IART STOCK ***

Tyson Foods Inc. TSN Stock Analysis

Tyson Foods Inc. stock trades under the ticker TSN & has shown recent bullishness that traders & investors should take a closer look into.

TSN stock closed at $88.82/share on 3/29/2022.

Tyson Foods Inc. TSN Stock’s Technicals Broken Down

Tyson Foods Inc. TSN Stock's Technical Performance Over The Last Year

TSN Stock Price: $88.82

10 Day Moving Average: $87.09

50 Day Moving Average: $91.07

200 Day Moving Average: $81.56

RSI: 49.23

MACD: -1.299

Yesterday, TSN stock completed a bullish MACD crossover, while also breaking out above its 10 day moving average.

Their RSI is neutral at 49, and their average volume in 2022 has been greater than their average for the year prior.

TSN stock will need to test the $89.09, $89.15 & $89.50/share resistance levels.

Tyson Foods Inc. TSN Stock As A Long-Term Investment

Long-term oriented investors will find TSN stock’s valuation metrics appealing, with a P/E (ttm) of 8.46 & a P/B (mrq) of 1.69.

TSN stock recent reported Quarterly Revenue Growth Y-o-Y of 23.6%, with 140% Quarterly Earnings Growth Y-o-Y.

Their balance sheet will require a deeper inspection, with Total Cash (mrq) of $2.96B & Total Debt (mrq) of $9.36B.

TSN stock pays a 2.1% dividend yield, which appears to be stable with a low 17.7% payout ratio.

85% of TSN stock’s outstanding share float is held by institutional investors.

Tyson Foods Inc. TSN Stock As A Short-Term Trade Using Options

Short-term focused traders can use options to profit from TSN stock’s price movement, while hedging against broader market volatility.

I am looking at the contracts with the 4/14 expiration date.

The $85, $87.50 & $90 call options all look appealing, and have sufficient levels of open interest for trading.

The $90, $92.50 & $95 puts also look interesting, with the former having the most liquidity.

Tying It All Together

Overall, there are many appealing characteristics to TSN stock.

Investors will be pleased with their dividend yield & valuation metrics, but may want to do more digging into the structure of their balance sheet.

Traders will like their momentum, as well as the liquidity of their at-the-money options contracts.

TSN stock is worth taking a closer look into, regardless of your trading style.

*** I DO NOT OWN SHARES OF TSN STOCK ***

Fox Corporation FOXA Stock Analysis

Fox Corporation stock trades under the ticker FOXA & has shown recent bullishness that traders & investors should take a closer look into.

FOXA stock opened down 2.33% to $40.26/share when I wrote this on 3/28/2022.

Fox Corporation FOXA Stock’s Technicals Broken Down

Fox Corporation FOXA Stock's Technical Performance Over The Last Year

FOXA Stock Price: $40.26

10 Day Moving Average: $40.65

50 Day Moving Average: $40.80

200 Day Moving Average: $38.55

RSI: 46.3

MACD: -0.053

On Friday, FOXA stock completed a bullish MACD crossover, while breaking out above its 50 day moving average.

FOXA stock has traded on above average volume in 2022 compared to the calendar year prior.

With an RSI that is still slightly oversold & <4% between their 10 & 50 day moving averages, there looks to be more upward momentum in the near-term.

FOXA will need to retest & break through the $41.22, $41.67 & $41.73 price levels.

Fox Corporation FOXA Stock As A Long-Term Investment

Long-term oriented investors may like FOXA stock’s valuation metrics, with a P/E (ttm) of 16.42 & a P/B (mrq) of 2.02.

They recently reported Quarterly Revenue Growth Y-o-Y of 8.7%.

FOXA stock’s balance sheet may require a closer look, as their Total Cash (mrq) is $4.26B & their Total Debt (mrq) is $8.46B.

Moody’s rating for FOXA stock’s debt is Baa2, which is considered lower medium grade.

FOXA stock pays a 1.14% dividend yield, which appears very stable as their payout ratio is 19%.

95% of FOXA stock’s share float is owned by institutional investors.

Fox Corporation FOXA Stock As A Short-Term Trade Using Options

Short-term oriented traders can use options to profit from FOXA stock’s price movements, while also hedging against broader market volatility.

I am looking at the contracts with the 4/14 expiration date.

The $39, $40 & $41 call options all look appealing, although relatively illiquid with low levels of open interest.

The $42 & $43 puts are very illiquid, but could be useful for downside protection.

Tying It All Together

All-in-all, FOXA stock looks worth taking a closer look into for both long & short-term focused market participants.

Long-term focused investors will like their valuation metrics & dividend yield, but may want to take a closer look into their balance sheet.

Short-term oriented traders will like their current momentum, but be disappointed by the lack of liquidity of their options contracts.

FOXA stock is worth doing more research on, regardless of your trading style.

*** I DO NOT OWN SHARES OF FOXA STOCK ***

Petrochina Co. PTR Stock Analysis

Petrochina Co. stock trades under the ticker PTR & has shown recent bullishness that traders & investors should take a closer look at.

PTR stock opened down 1.39% on the morning 3/28/2022 while writing this.

Petrochina Co. PTR Stock’s Technicals Broken Down

Petrochina Co. PTR Stock's Technical Performance Over The Last Year

PTR Stock Price: $51.81

10 Day Moving Average: $49.63

50 Day Moving Average: $51.48

200 Day Moving Average: $46.64

RSI:52.6

MACD: -0.309

On Friday, PTR stock completed a bullish MACD crossover, while breaking out above its 50 day moving average.

In 2022, PTR stock has been trading on higher than average volume compared to the year prior.

With ~4% between their 10 & 50 day moving averages, there looks to be additional upwards momentum for Petrochina Co. stock in the near-term.

PTR will need to break above the $52.54, $52.98 & $53.45 price levels of resistance to continue climbing higher.

Petrochina Co. PTR Stock As Long-Term Investment

Long-term oriented investors will find PTR stock’s valuation metrics appealing, as their P/E (ttm) is 7.23 & their P/B (mrq) is 0.48.

PTR stock recent reported Quarterly Revenue Growth Y-o-Y of 37.5%.

Their balance sheet may require a closer examination, as their Total Cash (mrq) is $205.01B, while their Total Debt (mrq) is $507.01B.

PTR stock’s dividend yield is 6.69%, which appears relatively stable with a 48% payout ratio.

Only 2% of PTR stock’s outstanding share float is owned by institutional investors.

Petrochina Co. PTR Stock As A Short-Term Trade Using Options

PTR stock has options that traders can use in the short-term to capitalize on their price movements in any direction.

I am looking at the contracts with the 4/14 expiration date.

The $50 & $55 calls look appealing, although somewhat illiquid with only 300-400 contracts between the two strike prices combined.

The $55 & $60 puts also look interesting, with the latter being the most liquid of the two.

Tying It All Together

Overall, PTR stock has many interesting characteristics that traders & investors may like.

Investors will find their valuation metrics & dividend yield appealing, but may want to do more research into the structure of their balance sheet & debt.

Traders will like their current momentum, but may be disappointed by the liquidity of their options contracts.

PTR stock is worth taking a closer look into, regardless of your trading style.

*** I DO NOT OWN SHARES OF PTR STOCK ***

British American Tobacco PLC BTI Stock

British American Tobacco PLC stock trades under the ticker BTI & has shown recent bullishness that traders & investors should take a closer look at.

BTI stock closed at $42.41/share on 3/22/2022.

British American Tobacco PLC BTI Stock’s Technicals Broken Down

British American Tobacco PLC BTI Stock's Technical Performance Over The Last Year

BTI Stock Price: $42.41

10 Day Moving Average: $40.98

50 Day Moving Average: $43.01

200 Day Moving Average: $37.58

RSI: 51.66

MACD: -0.533

BTI stock completed a bullish MACD crossover today, while approaching its 50 day moving average.

With a neutral RSI & ~2.5% separating BTI’s 10 & 50 day moving averages, there looks to be more positive momentum in the near-term.

They will need to test & break above the $42.85, $43.55 & $43.67 price levels in the meantime.

British American Tobacco PLC BTI Stock As A Long-Term Investment

Long-term oriented investors will find BTI stock’s valuation metrics appealing, with a P/E (ttm) of 10.23 & a P/B (mrq) of 1.03.

They recently reported Quarterly Earnings Growth Y-o-Y of 20.7%.

BTI stock’s balance sheet will require a closer review though, with Total Cash (mrq) of $3.26B & Total Debt (mrq) of $39.66B.

Moody’s most recent credit rating for BTI stock is Baa2, which is considered lower medium grade.

BTI stock pays a 5.15% dividend yield, which has a high payout ratio of 73.62%, which may indicate that it will not be sustainable in the long-run.

Only 6.52% of BTI stock’s outstanding share float is held by institutional investors.

British America Tobacco PLC BTI Stock As A Short-Term Trade Using Options

Short-term oriented traders can use options to profit from BTI stock’s price movements, while hedging against broader market volatility.

I am looking at the contracts with the 4/14 expiration date.

The $35, $40 & $45 call options all look appealing, although the $35’s are very illiquid & the $45’s only have 650 open contracts.

The $45 & $50 puts also look interesting, but are also highly illiquid, signaling that in the near-term the market sentiment for BTI stock is bullish.

Tying It All Together

Overall, BTI stock has many interesting characteristics that traders & investors will like.

Investors will like their valuation metrics & dividend, but will need to keep an eye out on how sustainable their yield is in the long-run.

Traders will like their current momentum, but may wish that there was more open interest at many of their strike prices.

BTI stock is worth taking a closer look at, regardless of your trading style.

*** I DO NOT OWN SHARES OF BTI STOCK ***

BP Amoco PLC BP Stock Analysis

BP Amoco PLC stock trades under the ticker BP & has shown recent bullishness that traders & investors should take a closer look into.

BP closed at $29.80/share on 3/21/2022.

BP Amoco PLC BP Stock’s Technicals Broken Down

BP Amoco PLC BP Stock's Technical Performance Over The Last Year

BP Stock Price: $29.80

10 Day Moving Average: $28.82

50 Day Moving Average: $30.54

200 Day Moving Average: $27.10

RSI: 51.65

MACD: -0.478

BP stock completed a bullish MACD crossover today, rising above its 10 Day Moving Average.

With 6% separating their 10 & 50 Day Moving Averages & the price in between, there looks to be more momentum in the near-term.

Their just above neutral RSI & higher than average trading volumes in 2022 vs. the year prior will also help.

They will need to break above the $29.95, $30.33 & $30.75 resistance levels.

BP Amoco PLC BP Stock As A Long-Term Investment

Long-term oriented investors will find BP stock’s valuation metrics appealing, with a P/E (ttm) of 6.16 & a P/B (mrq) of 1.22.

They recently reports Quarterly Revenue Growth Y-o-Y of 83%, with Quarterly Earnings Growth Y-o-Y of 71.3%.

Their balance sheet may require a closer review though, with $30.96B in Total Cash (mrq) & $69.79B in Total Debt (mrq).

BP stock pays a 4.55% dividend yield, which appears safe with a payout ratio of 46.3%.

Only 9.8% of BP stock’s outstanding share float is held by institutional investors.

Their most recent debt rating from Moody’s was A2, which is considered to be upper medium grade.

BP Amoco PLC BP Stock As A Short-Term Trade Using Options

BP stock has options that you can trade to profit from price movements in any direction.

I am looking at the contracts with the 4/14 expiration date.

The $29 & $30 calls look interesting, and very liquid.

The $33 & $32 puts also look interesting, and are also fairly liquid as well.

Tying It All Together

Overall, BP stock is worth taking a closer look at, regardless of your trading style.

Investors will find their fundamentals appealing, but may want to look closer into their balance sheet.

Traders will like their current momentum, as well as the liquidity of their options.

*** I DO NOT OWN SHARES OF BP STOCK ***

Popular, Inc. BPOP Stock Analysis

Popular, Inc. stock trades under the ticker BPOP & has shown recent bullishness that traders & investors should take a closer look into.

BPOP closed at $84.17/share on 3/21/22.

Popular, Inc. BPOP Stock’s Technicals Broken Down

Popular, Inc. BPOP Stock's Technical Performance Over The Last Year

BPOP Stock Price: $84.17

10 Day Moving Average: $82.19

50 Day Moving Average: $88.76

200 Day Moving Average: $79.81

RSI: 47.18

MACD: -1.638

BPOP stock completed a bullish MACD crossover today, and has been trading on above average volume in 2022, compared with the year prior.

There is ~8% difference between their 10 Day Moving Average & their 50 Day Moving Average, with their share price falling midway between.

With an RSI that is still below neutral, there looks to be more momentum to come.

They will need to test & break above $86.76, $87.86 & $89.48 price levels.

Popular, Inc. BPOP Stock As A Long-Term Investment

Long-term oriented investors will find BPOP stock’s valuation metrics appealing, with a P/E (ttm) of 7.08 & a P/B (mrq) of 1.09.

They reported Quarterly Revenue Growth Y-o-Y of 17.4%, with 16.9% Quarterly Earnings Growth Y-o-Y.

BPOP stock’s balance sheet also looks appealing, with Total Cash (mrq) of $18B & Total Debt (mrq) of $1.34B.

Their most recent credit rating from Moody’s was A3, before being withdrawn.

BPOP stock pays a 2.07% dividend, with a safe payout ratio of 15.3%.

88.2% of BPOP stock’s outstanding share float is held by institutional investors.

Popular, Inc. BPOP Stock As A Short-Term Trade Using Options

Popular, Inc. stock has options that can be traded to hedge off broader market volatility.

I am looking at the contracts with the 4/14 expiration date.

The $80 & $85 calls look appealing, but relatively illiquid, with low levels of open interest.

The $100 & $95 puts also look interesting, but are less liquid.

Tying It All Together

Overall, BPOP stock has many appealing attributes for traders & investors alike.

Investors will like their fundamentals, while traders will be pleased with their current momentum, but may be disappointed by the liquidity of their options contracts.

BPOP stock is worth taking a closer look into, regardless of your trading style.

*** I DO NOT OWN SHARES OF BPOP STOCK ***