Integra LifeSciences Holdings Corp. stock trades under the ticker IART & has shown recent bullishness that traders & investors should take a closer look at.
IART closed at $66.77/share on 3/29/2022.
Integra LifeSciences Holdoings Corp. IART Stock’s Technicals Broken Down
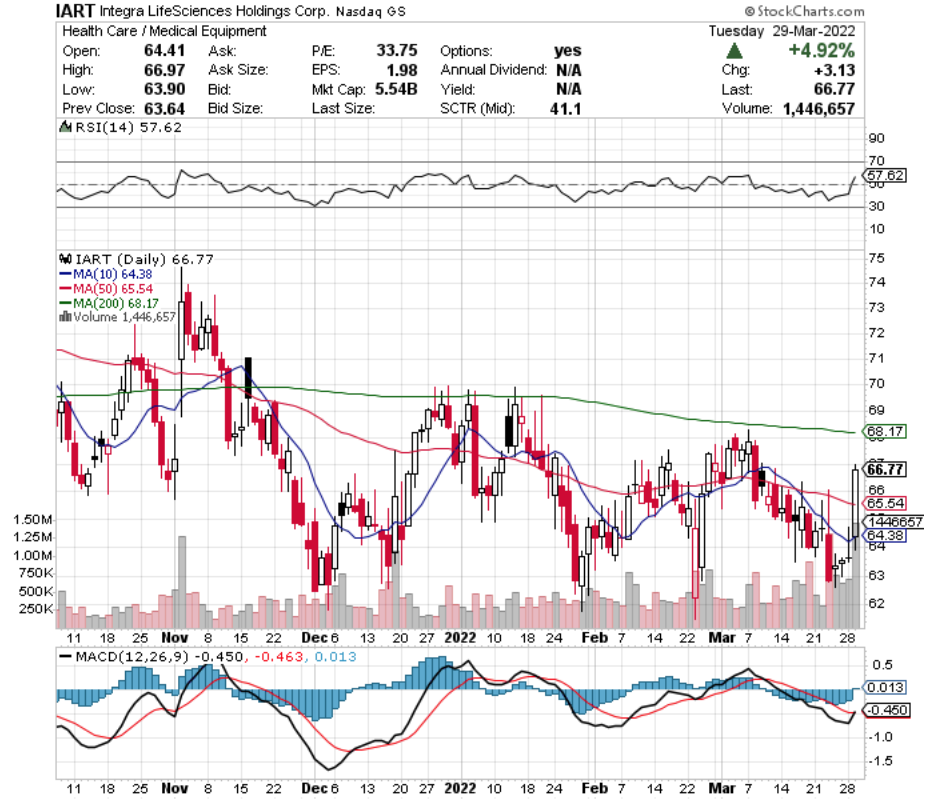
IART Stock Price: $66.77
10 Day Moving Average: $64.38
50 Day Moving Average: $65.54
200 Day Moving Average: $68.17
RSI: 57.6
MACD: -0.45
Yesterday, IART stock completed a bullish MACD crossover, while breaking out above its 10 day moving average.
Their trading volume was above average compared to the year prior’s volumes & their RSI is only slightly overbought, signaling more bullish momentum to come in the near-term.
They will need to break through the $67.02, $67.55 & $67.82/share resistance levels.
Integra LifeSciences Holdings Corp. IART Stock As A Long-Term Investment
Long-term oriented investors may find IART stock’s valuation metrics to be a bit rich, with a P/E (ttm) of 31.75 & a P/B (mrq) of 3.11.
They recently reported Quarterly Revenue Growth Y-o-Y of 4.3%.
IART stock’s balance sheet will require a more thorough examination, with $513.5M in Total Cash (mrq) & Total Debt (mrq) of $1.7B.
They do not offer a dividend yield.
Despite this, 95% of their outstanding share float is held by institutional investors.
Integra LifeSciences Holdings Corp. IART Stock As A Short-Term Trade Using Options
Traders can use options to profit from short-term price movements in any direction for IART stock.
I am looking at the contracts with the 4/14 expiration date.
The $65 & $70 call options look interesting, with the latter having more open interest than the former.
There is currently no open interest for any of the in or at-the-money puts, but if there were, the $70 & $75 strike prices would be areas of interest.
Tying It All Together
All-in-all, IART stock looks to have many advantages that traders & investors will be pleased with.
Their current momentum will be interesting to traders in the near-term, although they may wish for more liquid options.
Investors may think that their valuation metrics are fair given their industry, but will be disappointed by their lack of a dividend.
IART stock is worth taking a closer look into, regardless of your trading style.
*** I DO NOT OWN SHARES OF IART STOCK ***