Sealed Air Corp. stock trades under the ticker SEE & has shown recent bullishness that traders & investors should take a closer look into.
SEE stock closed at $66.70/share on 3/15/2022.
Sealed Air Corp. SEE Stock’s Technicals Broken Down
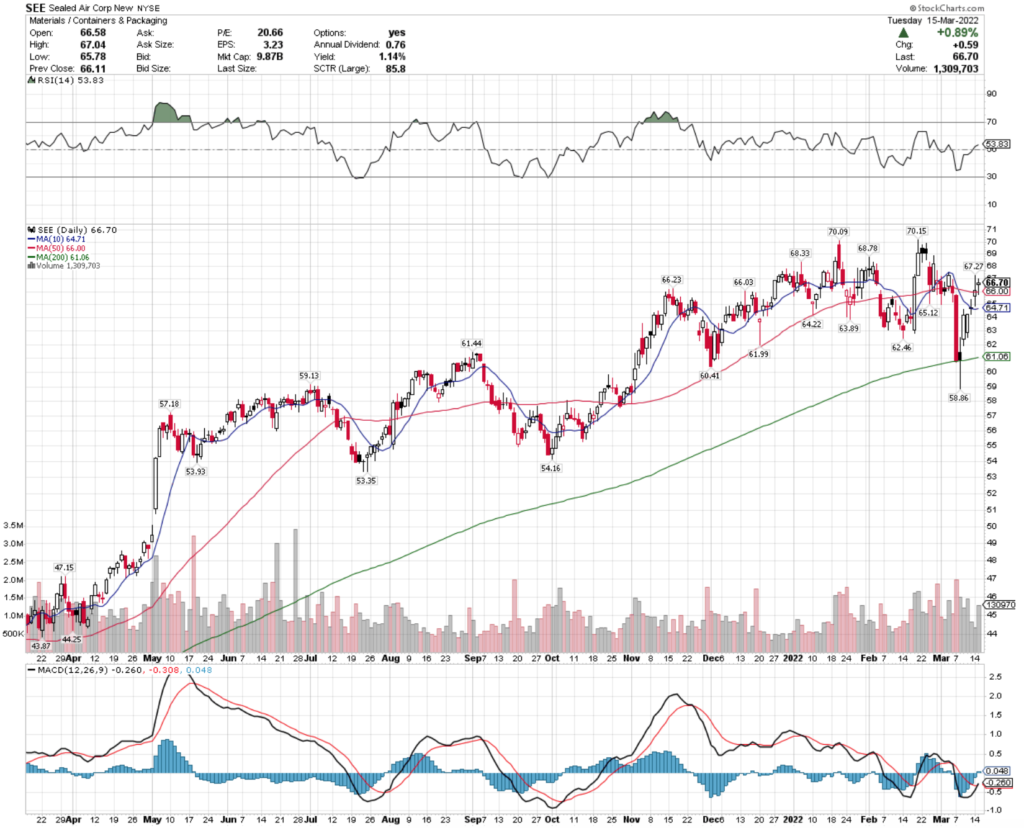
SEE Stock Price: $66.70
10 Day Moving Average: $64.71
50 Day Moving Average: $66.00
200 Day Moving Average: $61.06
RSI: 53.8
MACD: -0.26
Yesterday, SEE stock completed a bullish MACD crossover, while breaking out above its 50 day moving average, trading at about average volume compared to the year prior.
With a neutral RSI & 2% between their 10 & 50 Day Moving Averages, SEE stock looks to have more momentum to come to the upside in the near-term.
Their next tests will be at the $67.25, $67.42 & $67.72.
Sealed Air Corp. SEE Stock As A Long-Term Investment
Long-term oriented investors may like SEE stock’s P/E (ttm) of 21.26, but will likely find their P/B (mrq) of 40.78 to be very high.
SEE stock’s most recent reporting showed 14.2% Quarterly Revenue Growth Y-o-Y, with 27.2% Quarterly Earnings Growth Y-o-Y.
Their balance sheet will require a closer inspection, with $561M in Total Cash (mrq) & Total Debt (mrq) of $3.77B.
Moody’s rates SEE stock’s credit at Ba1, which is the top grade of speculative/junk ratings.
SEE stock offers a 1.15% dividend yield, which appears to be safe in the long-run, with their 24% payout ratio.
92.5% of SEE stock’s outstanding share float is held by institutional investors.
Sealed Air Corp. SEE Stock As A Short-Term Trade Using Options
Traders who are focused on the near-term can use options to profit from SEE stock’s price movements in any direction, while hedging against market volatility.
I am looking at the contracts with the 4/14 expiration date.
The $65 & $70 call options look appealing, with the former having more liquidity.
The $70 & $75 puts also look interesting, but are much less liquid, with very low levels of open interest.
More contracts should be written in the coming days, as Friday of this week is March’s expiration date.
Tying It All Together
All-in-all, SEE stock has many opportunities that investors & traders will both like.
Investors will like their dividend yield, as well as their recent growth reported in earnings.
Traders will like their current momentum, as well as the liquidity of their options once Friday’s expiration date passes.
SEE stock is worth taking a closer look into, regardless of your trading style.
*** I DO NOT OWN SHARES OF SEE STOCK ***