Weekly Stock & ETF Market Review 11/21/2021

Earnings calls continued on throughout the week, and markets continued to climb steadily.

Upcoming news about the new Fed chair should be announced in the coming days, which may bring a temporary shock to stocks in the event that Powell is not selected again.

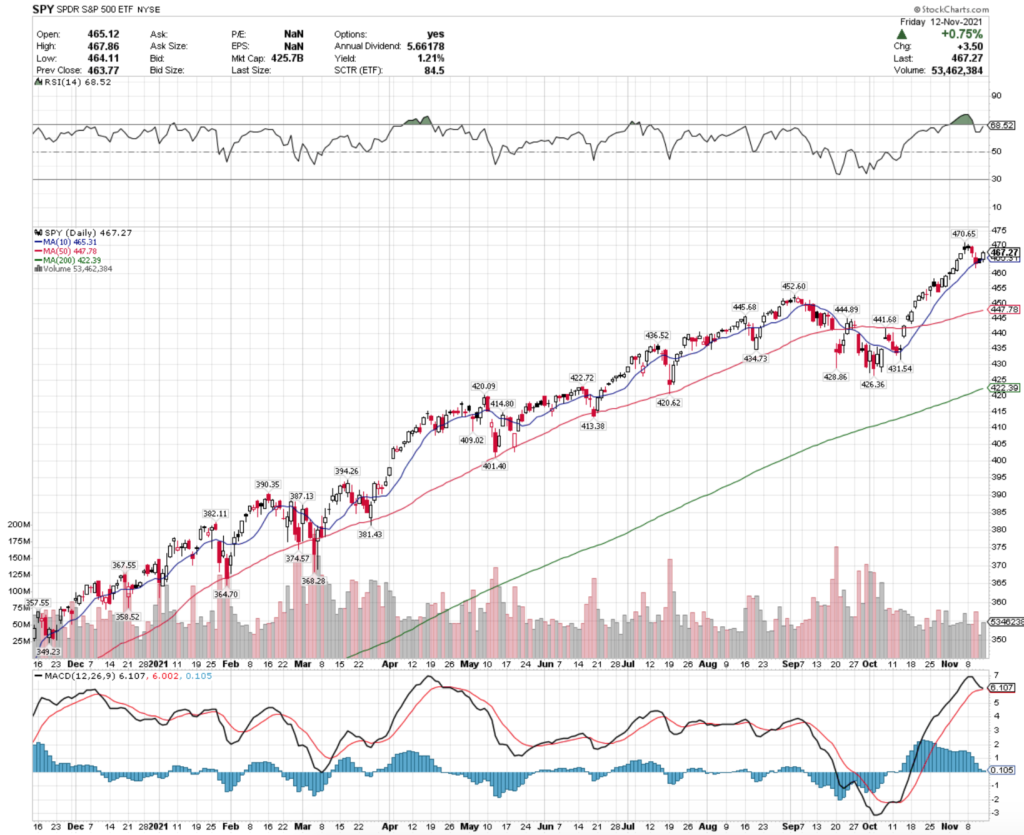
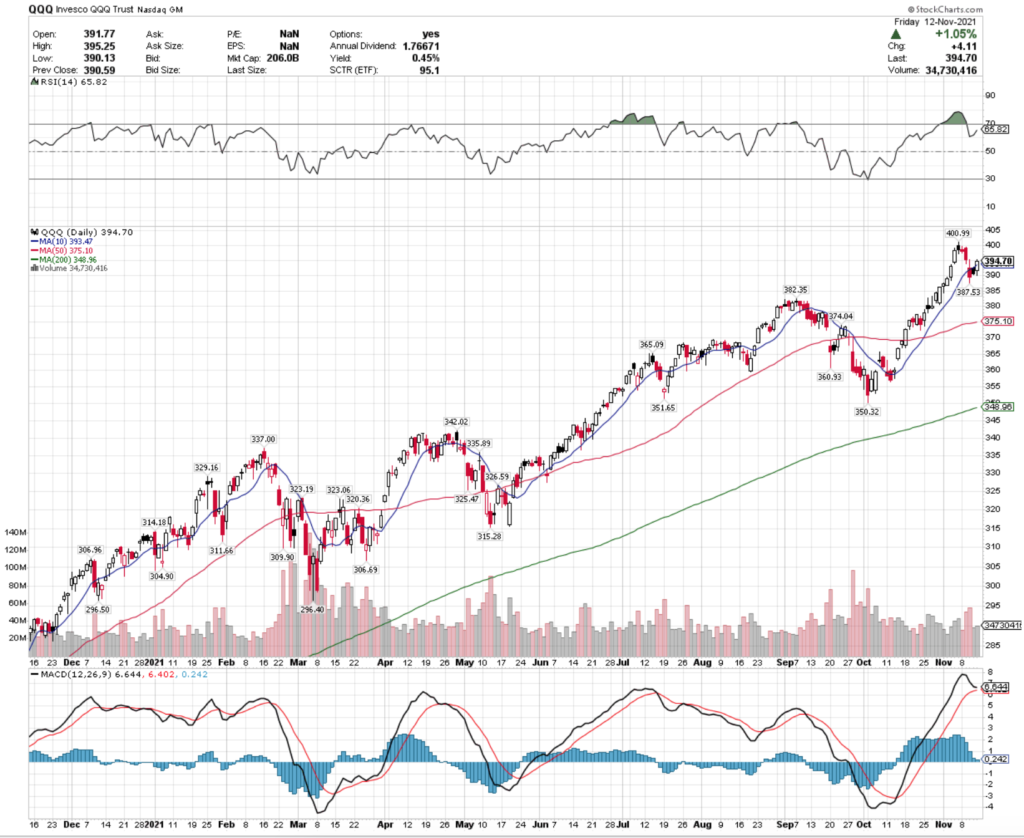
The S&P 500 & NASDAQ are both beginning to signal that there should be a bit of a shakeup in the near future when looking at their technicals

SPXL ETF - Direxion Daily S&P 500 Bull 3x Shares ETF's Technical Performance Over The Last Year
SPXL ETF – Direxion Daily S&P 500 Bull 3x Shares ETF

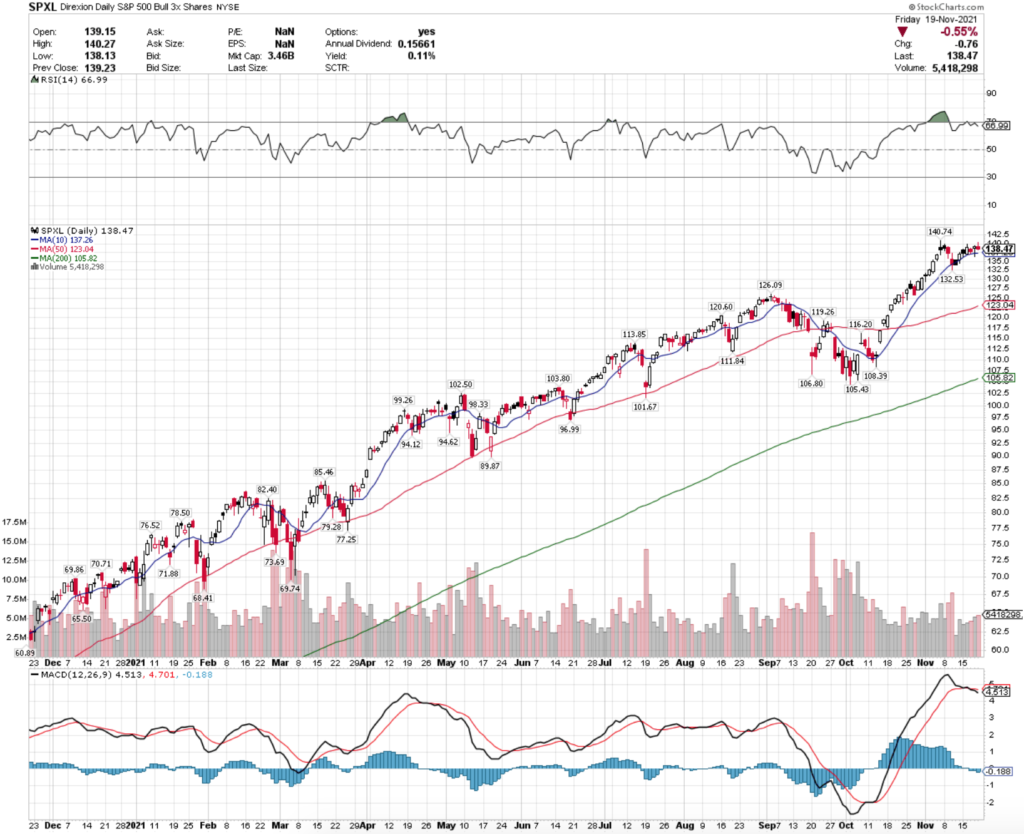
The SPXL ETF that tracks the S&P 500’s MACD had a bearish crossover, although on somewhat weaker than average volume last week, bringing their RSI back from overbought territory.

TQQQ ETF - ProShares UltraPro QQQ ETF's Technical Performance Over The Last Year
TQQQ ETF – ProShares UltraPro QQQ ETF

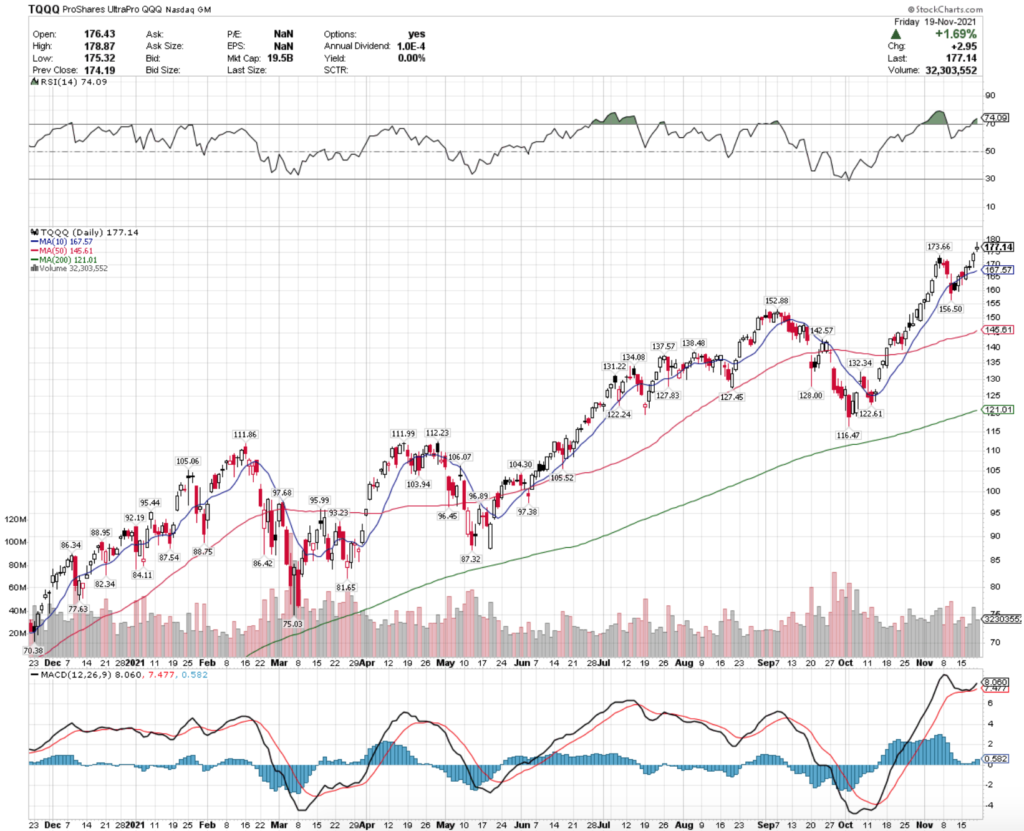
The NASDAQ tracking ETF TQQQ remains in overbought territory in their RSI, although their MACD has rebounded from what was potentially going to be a bearish crossover.

TQQQ’s volume has been a bit stronger than usual this week.

Consumer Discretionary (WANT), Carbon (KRBN), 5G Economy (WUGI) & Russell Growth Over Value (RWGV) All Lead The Pack

The WANT ETF that tracks names from the Consumer Discretionary sector has continued to see success, climbing higher this last week.

WANT ETF - Direxion Daily Consumer Discretionary Bull 3X Shares ETF Technical Performance Over The Last Year
WANT ETF – Direxion Daily Consumer Discretionary Bull 3X Shares ETF

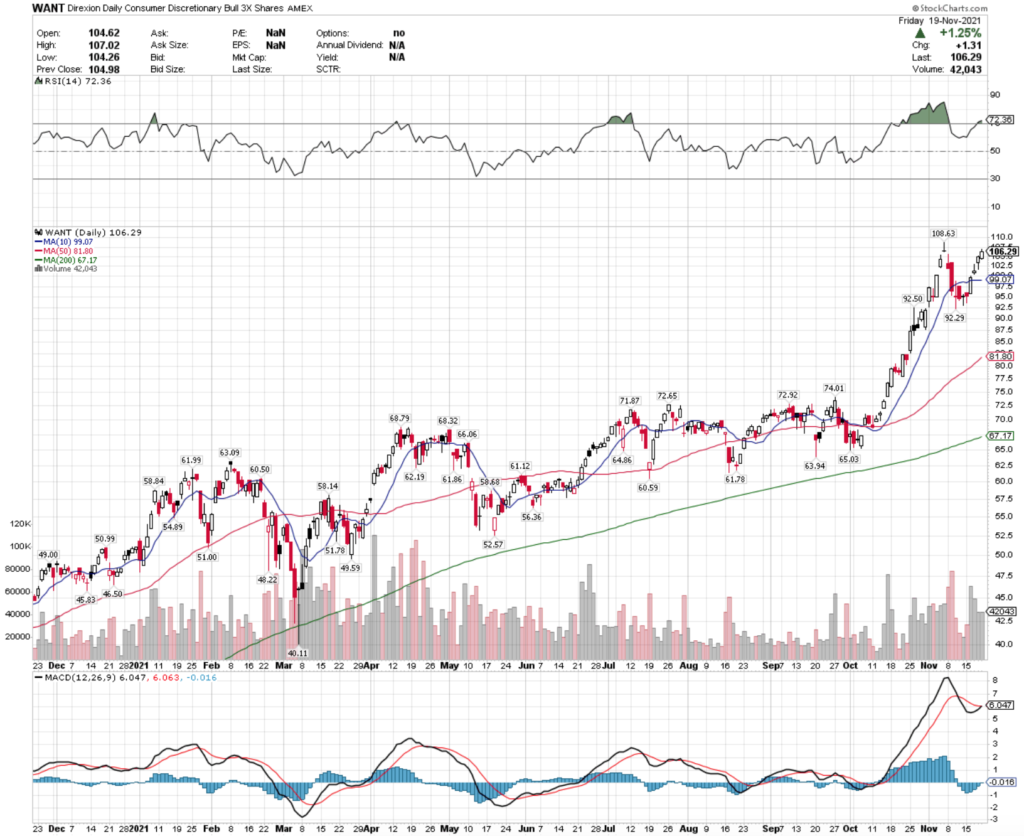
They look to have more steam to climb higher based on their MACD, however watch the currently overbought RSI as it may signal that there will be a bit of selling pressure in the near-term.

KRBN, a Global Carbon ETF has been trading on higher than average volume recently, and climbed to new highs for the year.

KRBN ETF - KFA Global Carbon ETF's Technical Performance Over The Last Year
KRBN ETF – KFA Global Carbon ETF

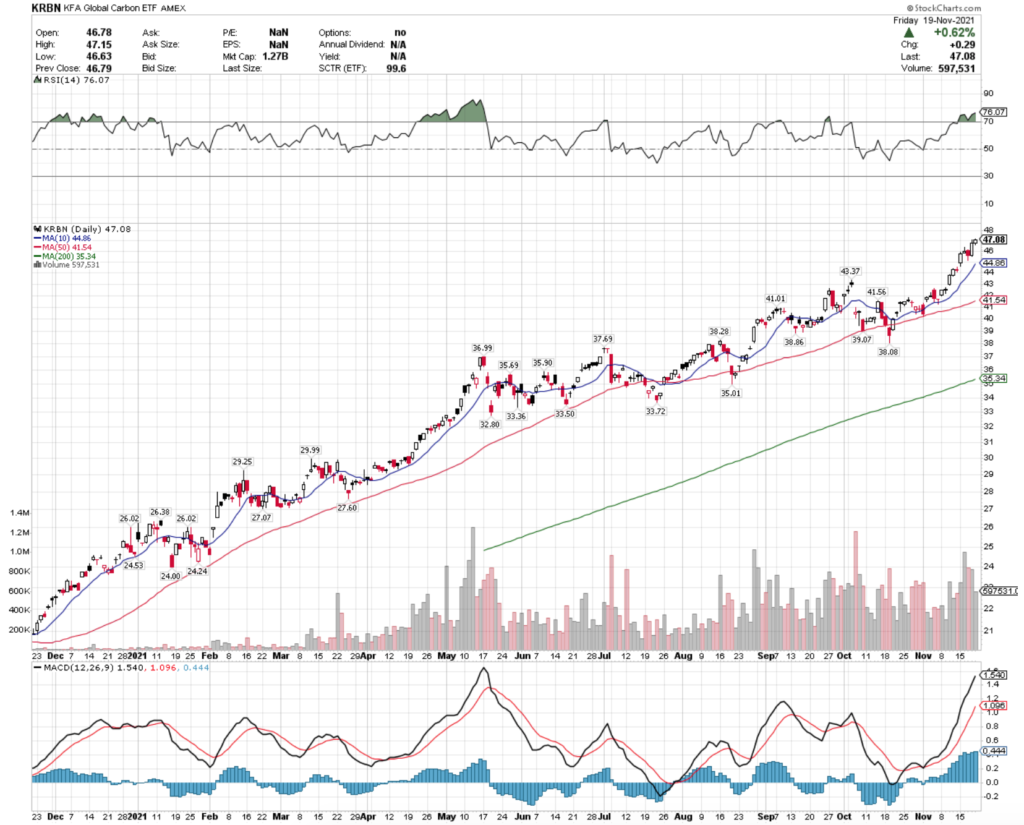
Again, while their MACD is still bullish, watch their RSI.

At 76, their RSI is still overbought & may indicate a bit of a sell off in the near-term as it begins to establish a new price range, where a better entry price may be possible.

WUGI, an ETF that contains names that are related to 5G & the future of the economy has also been climbing higher recently, although somewhat stalled out this week.

WUGI ETF - Esoterica NextG Economy ETF's Technical  Performance Over The Last Year
WUGI ETF – Esoterica NextG Economy ETF

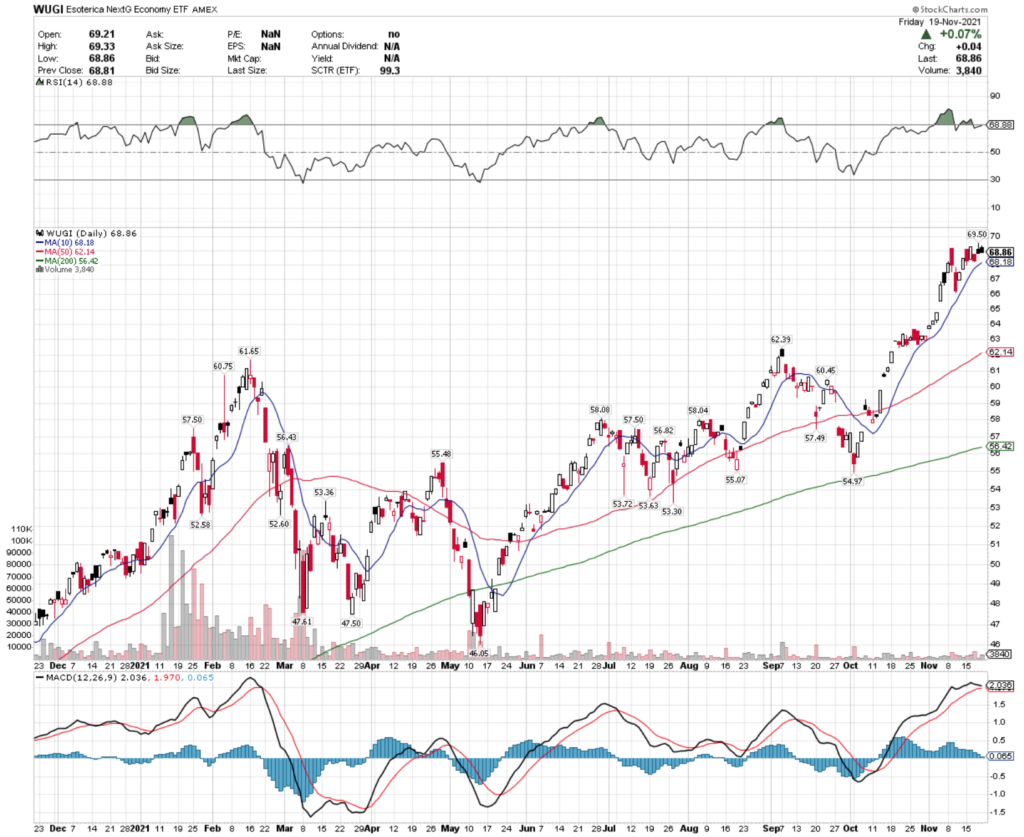
While their RSI was overbought prior & has now dropped back below the 70 level (highly overbought), there may be a bit of a drop in the near-term judging by their MACD.

Their volume has been very light compared to the rest of the year’s average.

Another area to keep an eye on is the growth names within the Russell 1000 index.

RWGV ETF - Direxion Russell 1000 Growth Over Value ETF's Technical Performance
RWGV ETF – Direxion Russell 1000 Growth Over Value ETF

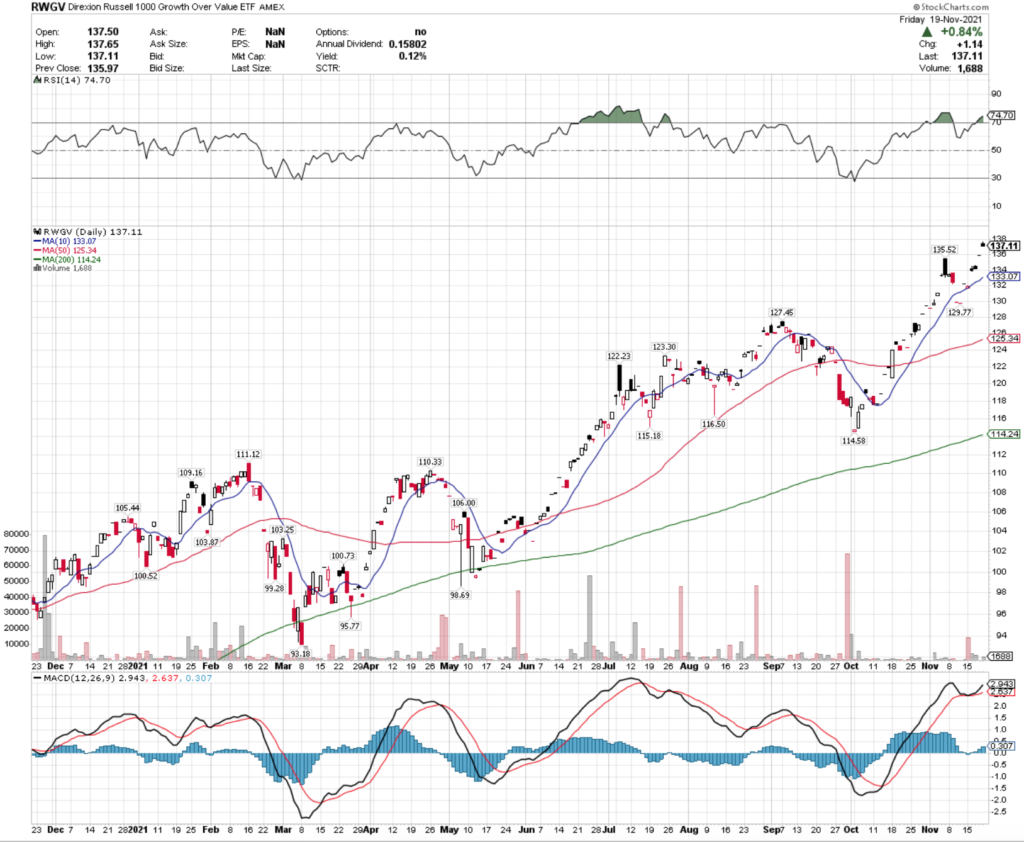
RWGV is an ETF that tracks these names, and has seen growth this year.

Their RSI is also high; at 74.7 signaling that they are currently overbought & may have some selling in the near-future.

However, their MACD is still bullish, after coming near a bearish crossover last week.

China (GXC), BioTech (LABU), Dividend Revenue (RDIV) & Global Infrastructure (GII) Stocks & ETFs Are All Lagging The Rest Of The Pack

It’s no surprise that companies in China are not being viewed favorably in the last few months.

GXC, the SPDR S&P China ETF has continued to struggle, having another bearish MACD crossover last week.

GXC ETF - SPDR S&P China ETF's Technical Performance Over The Last Year
GXC ETF – SPDR S&P China ETF

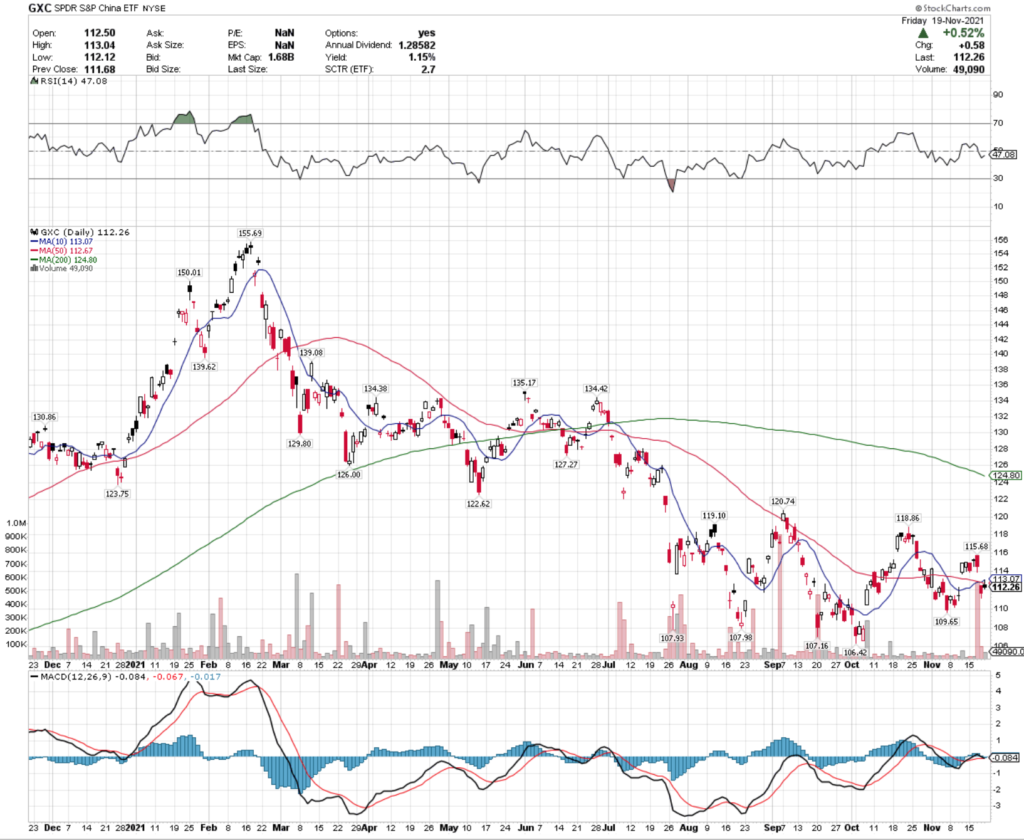
With a relatively neutral RSI, this downtrend may continue in the near-term.

LABU, an ETF that tracks biotech names has continued to fall, on higher than average volume.

LABU ETF - Direxion Daily S&P BioTech Bull 3x Shares ETF's Technical Performance Over The Last Year
LABU ETF – Direxion Daily S&P BioTech Bull 3x Shares

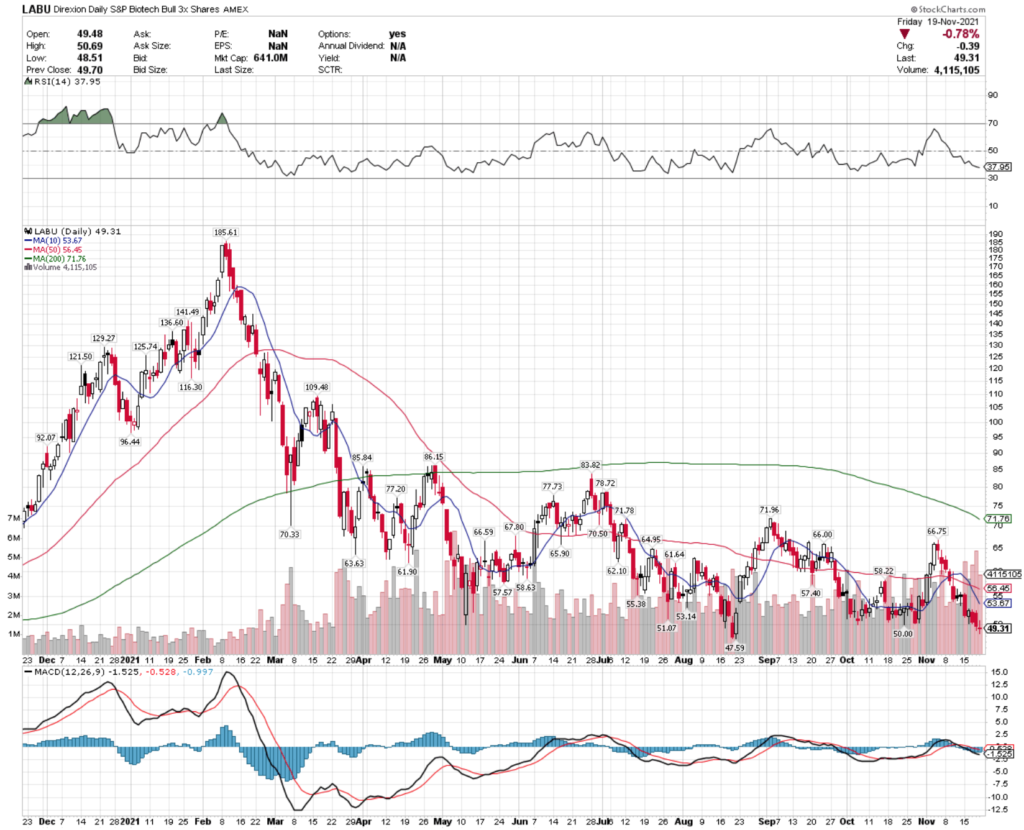
Their RSI is approaching the oversold level, but their moving averages suggest that there is more pain to come in the near-future.

RDIV is another ETF that’s moving averages seem to suggest more trouble in the near-future.

RDIV ETF - Oppenheimer Ultra Dividend Revenue ETF's Technical Performance Over The Last Year
RDIV ETF – Oppenheimer Ultra Dividend Revenue ETF

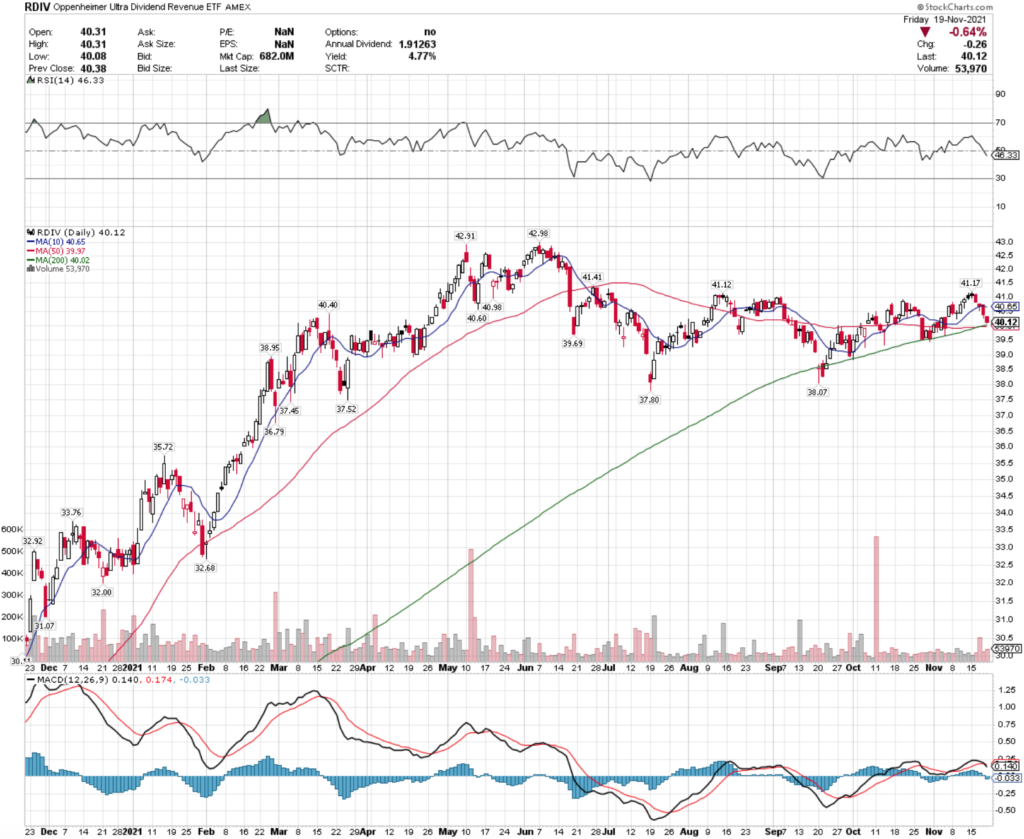
Last week they had a bearish MACD crossover, and with a neutral RSI of 46 there looks to be more losses to come in the near-term.

Note too though that their volume has been very low recently compared to the rest of the year’s average.

However, they do offer a 4.77% dividend yield, which can provide some protection & cushion against losses.

GII, an ETF that tracks global infrastructure focused stocks & securities has also seen recent troubles, with a gap down on Friday that went below their 50 day moving average.

GII ETF - SPDR S&P Global Infrastructure ETF's Technical Performance Over The Last Year
GII ETF – SPDR S&P Global Infrastructure ETF

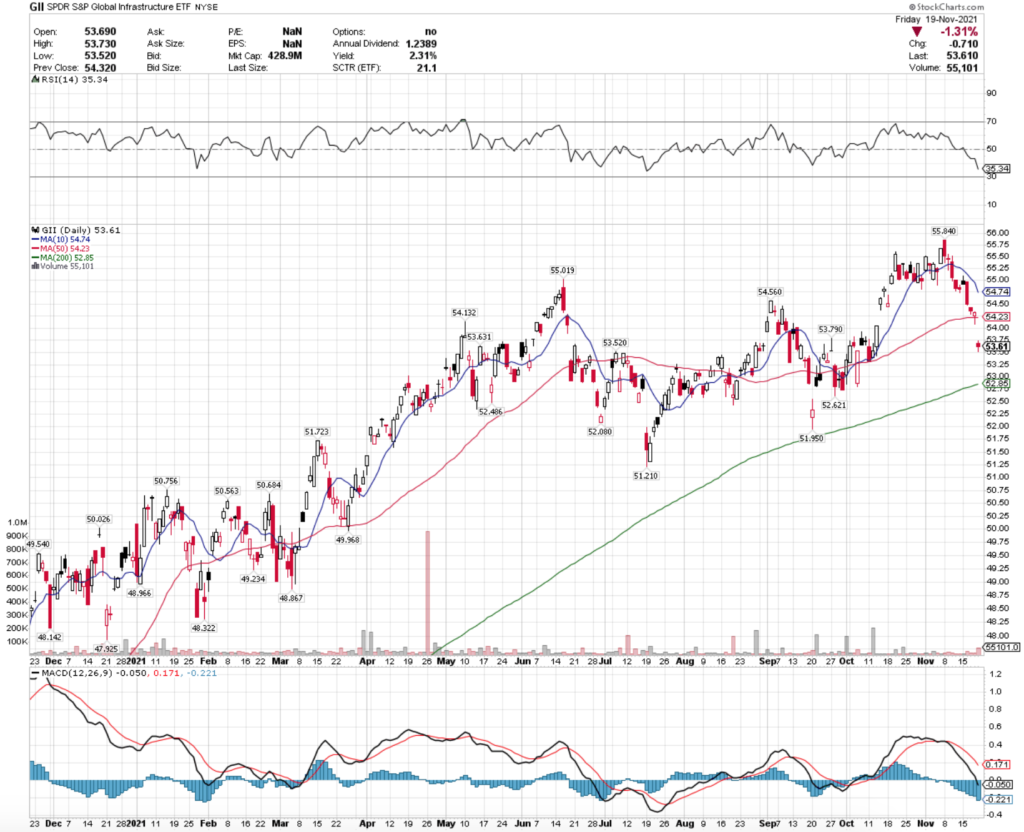
While their RSI is near the oversold level, their MACD is currently very bearish.

GII has also been trading on weaker than average volume recently.

Tying It All Together

There are still more earnings calls to come this week, there should be plenty of interesting swings in the markets.

With indexes near or at highs & showing overbought conditions, there should be some selling action in the near-term as traders take profits & reposition themselves for the new year.

However, the week will be shorter in observance of the Thanksgiving holiday in the US, which is something to take note of.

*** I DO NOT OWN SHARES OR OPTIONS FOR ANY OF THE NAMES LISTED ABOVE ***

Texas Instruments, Inc. TXN Stock

Texas Instruments, Inc. stock trades under the ticker TXN & has shown recent bullishness that traders & investors should take a closer look at.

TXN stock closed at $193.47/share on 11/18/2021 & looks set to continue it’s most recent bullish run.

Texas Instruments, Inc. TXN Stock’s Technicals Broken Down

Texas Instruments, Inc. TXN Stock's Technical Performance Over The Last Year

TXN Stock Price: $193.47

10 Day Moving Average: $190.30

50 Day Moving Average: $192.43

200 Day Moving Average: $185.18

RSI: 55.01

MACD: -0.54

TXN stock completed a bullish MACD crossover yesterday & has been trading at about average volume for the past year this month.

Their share price also broke out above their 50 Day Moving Average, with the 10 Day MA ~1% behind it.

This should provide additional bullish momentum in the near-term, especially with a neutral RSI.

Texas Instruments, Inc. TXN Stock As A Long-Term Investment

Investors will find TXN’s P/E(ttm) appealing at 24.34, although their P/B is a bit rich at 14.4.

With a Beta of 0.94, they move slightly less aggressively than the broader market indexes.

TXN stock saw Quarterly Revenue Growth Y-o-Y of 21.6%, and their balance sheet also looks appealing.

Texas Instruments Inc. stock’s Total Cash (mrq) is $9.78B, with Total Debt (mrq) of only $7.74B.

They offer a 2.15% annual dividend yield, which looks safe with a payout ratio of 52%.

These reasons contribute to why they have 85.6% of their share float owned by institutional investors.

Texas Instruments, Inc. TXN Stock As A Short-Term Trade Using Options

Traders can take advantage of TXN’s current momentum by trading options.

I am looking at the 12/17 expiration dated contracts.

The $190 & $195 strike price call options look appealing, with the latter having better liquidity, despite being <1% out of the money.

For puts, the $195 & $200 look appealing, although lacking liquidity with very low levels of open interest.

This signals that the options market thinks that there is more bullish energy to carry TXN’s share price higher in that time period.

Tying It All Together

Traders & investors will both find TXN stock appealing.

Their strong balance sheet, safe dividend yield & valuation will all appeal to long-term oriented investors.

Traders will like their current momentum & the liquidity of their options contracts.

Overall, it is worth taking a closer look at Texas Instruments Inc.’s stock.

*** I DO NOT OWN SHARES OF TXN STOCK ***

Nam Tai Properties Inc. NTP Stock

Nam Tai Properties stock trades under the ticker NTP & has shown recent bullish signals that traders & investors should take note of.

NTP stock closed at $25.63/share on 11/17/2021, after breaking out above all of its moving averages.

Nam Tai Properties Inc. NTP Stock’s Technicals Broken Down

Nam Tai Properties Inc. NTP Stock's Technical Performance Over The Last Year

NTP Stock Price: $25.63

10 Day Moving Average: $22.76

50 Day Moving Average: $24.43

200 Day Moving Average: $20.33

RSI: 57.1

MACD: -0.425

Yesterday, NTP stock completed a bullish MACD crossover, while also breaking above its 10 & 50 Day Moving Averages.

With more upward momentum to come from their 10 Day MA approaching the 50 Day, there looks to be more gains in the near-term for NTP.

Helping this is NTP’s relatively neutral RSI at 57.1, and the next level of resistance looks to be the $27-level.

Nam Tai Properties Inc. NTP Stock As A Long-Term Investment

Investors will find NTP to have many interesting characteristics that may meeting their portfolio style.

NTP’s valuation is modest, with a P/E (ttm) of 19.28, although their P/B of 3.5 is a bit rich.

They saw 442.7% Quarterly Revenue Growth Y-o-Y.

NTP stock’s balance sheet could look cleaner though, with only $70.4M in Total Cash (mrq) & Total Debt (mrq) of $207M.

Nam Tai Properties ceased paying a dividend in 2018, which when paired with their balance sheet may explain why only 17% of their share float is held by institutional investors.

Despite this, their Beta is relatively neutral at 0.95.

Nam Tai Properties Inc. NTP Stock As A Short-Term Trade Using Options

Traders can use options to harness some of NTP’s momentum in the near-term.

I am looking at the 12/17 expiration dated contracts.

The $25 & $26 calls look interesting, although very illiquid with low open interest.

This may change after Friday’s expiration date for the more recently dated contracts.

The $26 puts are currently at-the-money, with there being no open interest on $27 contracts yet.

Tying It All Together

Overall, there look to be many interesting attributes to NTP stock.

Investors will find their valuation appealing, as well as their neutral beta.

Traders will like their current momentum trajectory.

Nam Tai Properties Inc. stock is worth taking a closer look at, regardless of your trading style.

*** I DO NOT OWN SHARES OF NTP STOCK ***

West Pharmaceutical Services WST Stock

West Pharmaceutical Services stock trades under the ticker WST & has shown recent bullishness that investors & traders should take a closer look at.

WST stock closed at $422.46/share on 11/15/2021, while showing signs of additional near-term gains from bullish momentum.

West Pharmaceutical Services WST Stock’s Technicals Broken Down

West Pharmaceutical Services WST Stock's Technical Performance For The Last Year

WST Stock Price: $422.46

10 Day Moving Average: $420.76

50 Day Moving Average: $428.09

200 Day Moving Average: $362.78

RSI: 51.2

MACD: -1.484

WST stock completed a bullish MACD crossover yesterday, while also breaking out above its 10 Day Moving Average.

Recent volumes have been a bit above average compared to the rest of the last year.

WST’s next test will be at the $426/share price level, which may see additional bullish momentum upon crossing as their 50 Day MA will be around there at the same time.

With a completely neutral RSI, there looks to be little limiting WST stock’s upside at the moment.

West Pharmaceutical Services WST Stock As A Long-Term Investment

Investors may find West Pharmaceutical Service’s stock appealing as a long-term investment.

While their P/E (ttm) of 51.95 & P/B of 14.1 are high, given the nature of the space that they operate in they are understandable.

WST stock had 28.9% Quarterly Revenue Growth Y-o-Y, and enjoys a Beta of 0.98, meaning that it tends to move about in line with the broader market indexes.

Their Balance Sheet looks appealing, with Total Cash (mrq) of $688M & Total Debt (mrq) of $315.6M.

WST stock offers a 0.16% dividend yield, which looks to be very safe at an 8.43% payout ratio.

They also enjoy 94% of their share float being held by institutional investors.

West Pharmaceutical Services WST Stock As A Short-Term Trade

Short-term oriented traders can use options in order to take advantage of West Pharmaceutical Services stock’s recent momentum.

I am looking at the contracts with the 11/19 expiration date.

The $410, $420 & $430 calls look interesting, although their open interest levels are very low, making them relatively illiquid.

For puts, the $420 & $430 also look appealing.

Interestingly, the $420 puts have greater open interest than all of the calls mentioned in the previous sentence combined.

This signals that traders seem to be fairly certain that the price will be below that mark by Friday’s expiration.

Tying It All Together

All-in-all, there looks to be appealing characteristics of WST stock for both traders & investors alike.

WST stock looks to have appealing fundamentals for investors focused on the stock’s long-term performance.

In the near-term, they have bullish momentum that looks set to continue pushing them higher as they test their next level of resistance.

Whether you’re focused on the long or near term, WST stock is worth taking a closer look at.

*** I DO NOT OWN SHARES OF WST STOCK ***

Dana Inc. DAN Stock Analysis

Dana Inc. stock trades under the ticker DAN & has shown recent bullishness that investors & traders should take note of.

DAN stock closed at $24.14/share on 11/12/2021, on a 3% bullish gap up.

Dana Inc. DAN Stock’s Technicals Broken Down

Dana Inc. DAN Stock Technical Performance Over The Last Year

DAN Stock Price:$24.14

10 Day Moving Average: $23.23

50 Day Moving Average: $23.10

200 Day Moving Average: $23.99

RSI: 55

MACD: -0.024

On Friday, DAN stock completed a bullish MACD crossover, while also breaking out above both its 10 & 50 Day Moving Averages.

Their recent volume has been a bit higher than usual for the rest of the year.

The next level of resistance to break through is the $25.48/share level.

With a relatively neutral RSI, there looks to be sufficient momentum to carry it up to that point.

Dana Inc. DAN Stock As A Long-Term Investment

Investors will like DAN stock’s fundamentals, with a P/E (ttm) of 16.2 & a P/B of 1.82.

DAN stock saw a 10% Quarterly Revenue Growth Y-o-Y.

One area that may worry them is DAN’s balance sheet, where they have $238M in Total Cash (mrq) & Total Debt (mrq) of $2.66B.

They offer a 1.3% dividend yield, that appears safe with a ~20% payout ratio.

Because of this, they enjoy a 95%+ % Institutional Shareholders.

Dana Inc. DAN Stock As A Short-Term Trade Using Options

Short-term focused traders can use options to take advantage of DAN’s current momentum.

I am looking at the contracts with the 11/19 expiration date.

The $24 & $25 calls look interesting, although someone illiquid with only 800 or so contracts outstanding between both strike prices.

The $25 & $26 puts also look appealing, but face a similar issue from the open interest perspective.

With more calls than puts outstanding, the general market sentiment is still bullish for DAN stock.

Tying It All Together

Overall, DAN stock offers opportunities that both traders & investors will like.

DAN’s valuation metrics & dividend yield both look appealing for long-term investors.

In the near-term, their current momentum & technical indicators show that there is still more room for their price to run.

DAN stock is worth taking a closer look at, regardless of your trading style & time frames.

*** I DO NOT OWN SHARES OF DAN STOCK ***

Weekly Stock & ETF Market Review 11/14/2021

Earnings calls continued last week, while focuses on bonds, energy & supply chains continued to tie up the news feeds.

A bit of the built up buying pressure was released from the S&P 500 & NASDAQ, both of whose RSI’s dipped back below overbought territory.

More correcting looks apparently based on the curves of both indexes’ MACD lines, shown in the charts below for the SPY & QQQ ETFs.

SPY ETF - SPDR S&P 500 ETF Technical Performance For The Last Year
SPY ETF – SPDR S&P 500 ETF

SPY, the S&P 500 ETF’s MACD is about to bearishly crossover, and QQQ’s for the NASDAQ is also bearishly curved, with the crossover to come in the coming days.

Given their high RSI’s, it is certainly time for a little more pullback from a technical perspective.

QQQ  ETF - Invesco QQQ Trust NASDAQ ETF Technical Performance For The Last Year
QQQ ETF – Invesco QQQ Trust NASDAQ ETF

Transportation (TPOR), Blockchain & Data Transformation (BLOK), Lithium (LIT) & Financials (FAS) ETFs All Among The Bullish Recent Performers

Transportation stocks contained in the ETF TPOR all have had a good performing November to date.

While their MACD is about to bearishly cross, there looks to be a new range establishing here as their RSI evens out, possibly making space for a new position’s entry.

TPOR ETF - Direxion Daily Transportation Bull 3X Shares ETF Technical Performance Over The Last Year
TPOR ETF – Direxion Daily Transportation Bull 3X Shares ETF

Volume has certainly tapered off after their major outperforming day.

Blockchain & Data Transformation stocks have also done well in recent weeks, earning BLOK a spot amongst our top rated ETFs by technicals recently.

BLOK ETF - Amplify Transformational Data Sharing ETF Technical Performance Over The Last Year
BLOK ETF – Amplify Transformational Data Sharing ETF

Recent volumes have been above average for the year, as their share price evens back out after touching a new high for the year.

Another MACD to watch, but again, their RSI also needed to simmer a bit from being overbought for a period of days.

Lithium names have also been performing well, with more room to run in the near-term.

Watching LIT ETF’s MACD it appears that there may be another near-term bump in the making, as their RSI is still not in overbought territory.

LIT ETF - Global X Lithium ETF Technical Performance For The Last Year
LIT ETF – Global X Lithium ETF

Financial names have remained steady, although FAS has dipped a bit this week.

This may be a good point of entry into a new position for FAS.

With their MACD already bearish & an RSI approaching neutral, this looks to be a time where planning an entry will be beneficial as a trade or investment.

The recent price decline is on below average volume, implying that it is more centered around profit taking & not a major fundamental issue.

Asia Pacific High Yield Bond (KHYB), International Online Retail (XBUY), Yen (YCL) & South Korea (FLKR) ETFs Are Among The Most Bearish Names Recently

Not surprisingly, Asian High Yield bond ETF KHYB is underperforming recently amid the Evergrande scandal & news that other companies are in similar trouble.

KHYB ETF - KraneShares Asia Pacific High Yield Bond ETF Technical Performance Over The Last Year
KHYB ETF – KraneShares Asia Pacific High Yield Bond ETF

Volume continues to trade above average for KHYB, with a neutral RSI & bullish MACD, but this is not a name that looks to be out of the woods just yet.

International Online Retail ETF XBUY has also suffered recent underperformance, making a new low for the year recently.

XBUY ETF - Amplify International Online Retail ETF Technical Performance For The Last Year
XBUY ETF – Amplify International Online Retail ETF

With a neutral RSI & relatively flat MACD this will be a name to watch, as it tries to break out above its 50 Day Moving Average.

Yen ETFs have also struggled recently, with YCL being one of the recent under-performers in our technical scans.

YCL ETF – ProShares Ultra Yen ETF

While YCL trading volume recently has been light compared to the rest of the year, there may be more pain in the near-term for this name based on the curve in their MACD.

YCL has been making higher lows & higher highs of recent, but is still trading at the bottom of its price range for the year.

Their RSI is slightly oversold though, which may signal an impending bounce.

FLKR, the South Korea focused ETF has also been having tough times recently, especially after a large decline last week.

FLKR ETF - Franklin FTSE South Korea ETF Technical Performance Over The Last Year
FLKR ETF – Franklin FTSE South Korea ETF

Their MACD & RSI are both relatively neutral, and recent volumes have been below average for the year.

They still face downward pressure from their moving averages, but are showing signs of reversing course in the near-term.

Tying It All Togher

This will be another week of earnings calls, political theater & discussions about inflation & supply chains across the globe.

Based on the charts we’ve looked at, there may be more correcting of price levels in the near-term, with many technical indicators running hot at the moment.

Retail sales & housing starts numbers will be interesting to watch, with both of those industries being mentioned in our weekly lists recently.

It will also be interesting to see how seasonal employment begins to impact reported numbers, with mall Santas & Christmas-time help beginning to be hired.

Banco Macro SA BMA Stock Analysis

Banco Macro SA stock trades under the ticker BMA & has shown recent bullish signals that traders & investors should take a closer look at.

BMA stock closed at $17.20/share on 11/10/2021.

Banco Macro SA BMA Stock’s Technicals Broken Down

Banco Macro SA BMA Stock's Technical Performance Over The Last Year

BMA Stock Price: $17.20

10 Day Moving Average: $16.44

50 Day Moving Average: $17.36

200 Day Moving Average: $15.31

RSI: 53.2

MACD: -0.109

BMA stock completed a bullish MACD crossover yesterday, while also temporarily breaking out above its 50 Day Moving Average bullishly.

With 5% between the 10 Day MA & share price, there should be additional upward pressure on their share price to break out above the 50 Day MA.

The $18-level is the next major test for BMA’s share price once it does break above the 50 day.

Banco Macro SA BMA Stock As A Long-Term Investment

Investors will like BMA’s valuation metrics, with a P/E(ttm) of 7.7 & a P/B of 0.56.

BMA’s Quarterly Revenue Growth Y-o-Y was -0.3% & their Beta runs a bit hotter than the broader markets at 2.17.

Their balance sheet looks good, with $268B in Total Cash (mrq) & Total Debt (mrq) of just $43.9B.

Banco Macro SA BMA Stock As A Short-Term Trade Using Options

Traders can take advantage of BMA stock’s current momentum by trading options.

I am looking at the 11/19 expiration dated contracts.

The $17.50 calls look appealing, as they have more open interest than the $15 calls that are in-the-money.

The $20 & $17.50 puts also look interesting, with the most open interest for calls & puts both being the $17.50 strike price.

Tying It All Together

Overall, there are many appealing traits to BMA stock that traders & investors are sure to like.

Investors will like their balance sheet & valuation metrics.

Traders will like their current momentum, paired with their neutral RSI signaling that there is more room to run in the near term.

Banco Macro SA stock is worth taking a closer look at regardless of your trading style & time frame.

*** I DO NOT OWN SHARES OF BMA STOCK ***

Atlas Corp. ATCO Stock Analysis

Atlas Corp. stock trades under the ticker ATCO & has shown recent bullish strength that traders & investors should take note of.

ATCO stock closed at $15.40/share on 11/9/2021, with signs showing further gains to come in the near-term.

Atlas Corp. ATCO Stock’s Technicals Broken Down

Atlas Corp. ATCO Stock's Technical Performance Over The Past Year

ATCO Stock Price: $15.40

10 Day Moving Average: $14.16

50 Day Moving Average: $14.81

200 Day Moving Average: $13.76

RSI: 63.4

MACD: -0.075

Yesterday, ATCO stock completed a bullish MACD crossover, while also gapping up ~9%.

In doing so, their share price also broke out above both the 10 & 50 Day Moving Averages.

With their RSI only being slightly overbought, there looks to be more momentum to come in the near-term to push ATCO higher.

The next resistance area they are targeting will be to break above the $15.99/share level.

Atlas Corp. ATCO Stock As A Long-Term Investment

Long-term investors may find ATCO stock’s valuation metrics appealing, with a P/E (ttm) of 23.7 & a P/B of 0.92.

Their Beta is 0.98, meaning that they move more or less in line with the broader markets.

ATCO experienced 17% Quarterly Revenue Growth Y-o-Y.

One area that may be of concern to investors is their balance sheet, where ATCO has Total Cash (mrq) of $257.6M & Total Debt (mrq) of $6.27B.

Atlas Corp.’s stock does offer a 3.54% dividend yield, however that should be viewed with caution as their current payout ratio is high at 86%.

Despite all of this, ATCO has ~71% of all outstanding shares held by institutional investors.

Atlas Corp. ATCO Stock As A Short-Term Trade Using Options

ATCO stock has options that traders can use to take advantage of near-term momentum, while hedging off broader market volatility.

I am looking at the contracts with the 11/19 expiration dates.

The $15 calls are in-the-money & highly liquid, as are the $12.50 calls.

The $17.50 puts look appealing as well, but are not nearly as liquid, signaling that there is more bullish sentiment than bearish for ATCO in the near-term.

Tying It All Together

Overall, there look to be many interesting advantages to Atlas Corp.’s stock.

Investors will like their valuation metrics, and their dividend yield should it prove to be sustainable.

Traders will like their near-term bullish momentum that looks set to continue.

ATCO stock is worth taking a closer look at for traders & investors alike.

*** I DO NOT OWN SHARES OF ATCO STOCK ***

Cronos Group Inc. CRON Stock Analysis

Cronos Group Inc. stock trades under the ticker CRON & has shown recent bullishness that traders & investors should take note of.

CRON stock closed at $6.71/share on 11/8/2021, after gapping up 25%+ on Monday.

Cronos Group Inc. CRON Stock’s Technical Performance Broken Down

Cronos Group Inc. CRON Stock's Technical Performance For The Last Year

CRON Stock Price: $6.71

10 Day Moving Average: $5.50

50 Day Moving Average: $5.77

200 Day Moving Average: $8.02

RSI: 69.8

MACD: -0.001

Yesterday, CRON stock completed a bullish MACD crossover, while gapping up over 25% on the day.

Their share price also jumped above the 10 & 50 Day Moving Averages, while trading on daily volume that was higher than average for the first time since June.

Given the nature of the steep jump yesterday, I expect there to be a shake-off period for their RSI to even out, as it jumped from slightly oversold to being almost completely overbought within a day.

With this in mind, there should be entry-points in the coming days for traders & investors to be able to get in & profit from.

The next price level of resistance to overcome will be the $6.72/share level, which they closed one cent below yesterday.

Cronos Group Inc. CRON Stock As A Long-Term Investment

Cronos Group Inc.’s stock is a cannabis stock, which investors may be interested in as a means of gaining exposure to the space in their portfolio.

CRON’s valuation metrics look fair, with a P/E (ttm) of 65.3 & a P/B of 1.22.

One area that stands out to investors is their sturdy 58.1% Quarterly Revenue Growth Y-o-Y.

CRON’s balance sheet looks appealing as well, with $1.1B in Total Cash (mrq) & Total Debt (mrq) of $7.54M.

With a Beta of 1.45, CRON stock will tend to be a bit jumpier than the broader market indexes, which is something that investors should be aware of.

They also do not offer a dividend, which may be off-putting to some investors, and may be in part to blame for their 17.6% % Institutional Investors.

Cronos Group Inc. CRON Stock As A Short-Term Trade Using Options

Short-term focused traders can take advantage of CRON stock’s recent momentum shift by using options.

I am looking at the contracts with the 11/19 expiration date.

The $6 & $6.50 call options look appealing being in & at-the-money.

The $6 calls are very liquid with 4,400+ contracts of open interest.

The $7 puts also look appealing for that time period, as the $7.50’s lack sufficient open interest & the $6.50’s will likely be out-of-the-money before expiration.

Tying It All Together

All-in-all, there looks to be many advantages to CRON stock in both the near & long-term.

Long-term focused investors will like CRON’s exposure to the cannabis industry, as well as their valuation metrics & balance sheet.

Short-term traders will like their current momentum, as well as the liquidity of their options market, which is signaling more bullish sentiment to come when comparing the open interest of calls:puts.

CRON stock is worth taking a closer look at to investors & traders alike.

*** I DO OWN COMMON SHARES OF CRON STOCK AS OF WRITING & PUBLISHING THIS ARTICLE ***

Starbucks Corp. SBUX Stock Analysis

Starbucks Corp. stock trades under the ticker SBUX & has shown recent bullishness that traders & investors should research further.

SBUX stock closed at $116.91/share on Friday 11/5/2021.

Starbucks Corp. SBUX Stock’s Technicals Broken Down

Starbucks Corp. SBUX Stock's Technical Performance Over The Last Year

SBUX Stock Price: $116.91

10 Day Moving Average: $112.53

50 Day Moving Average: $113.75

200 Day Moving Average: $111.96

RSI: 60.11

MACD: -0.077

SBUX completed a bullish MACD crossover yesterday, after trading on above average volume for the last few days.

They also gapped up 4%+, bullishly crossing over their 10 & 50 Day Moving Averages as well.

With an RSI that is only slightly overbought, there looks to be additional momentum in the near-term to continue pushing SBUX’s share price higher.

The next area of major resistance is the $120 level.

Starbucks Corp. SBUX Stock As A Long-Term Investment

Starbucks has been a longterm hold favorite for many investors.

Their P/E (ttm) is 33.03, and they do not have a positive P/B, which is to be expected as they operate a chain of restaurants that are focused on renting their space.

SBUX stock’s Beta is 0.83, meaning that it tends to move less aggressively than the broader market, which is another perk for investors focused on the long-term.

Starbuck’s balance sheet could look better though, with Total Cash (mrq) of $6.62B & Total Cash (mrq) of $23.61B.

They offer a dividend yield of 1.64%, which looks safe with a payout ratio of just over 50%.

SBUX also enjoys 70% of their share float being held by institutional investors.

Starbucks Corp. SBUX Stock As A Short-Term Trade Using Options

Short-term oriented traders can profit off of SBUX stock’s recent momentum by using options.

I am looking at the contracts with the 11/19 expiration date.

The $116, $117 & $118 calls all look liquid enough to trade & are either in, at or near being in the money by a matter of percentage points.

The $119 & $118 puts also look appealing as a hedge, although they have less open interest, meaning that traders see more near-term upside than downside for SBUX’s share price.

Tying It All Together

Overall, SBUX stock looks to be appealing in both the near-term & long-term.

Investors will like collecting a safe dividend from a stock that is less volatile than the broader market, with a fair valuation.

Traders will like their current momentum which looks poised to continue climbing in the near-term based on their technicals.

Starbuck’s Corp. stock is worth taking a closer look at, regardless of what your trading style & time frames are.

*** I DO NOT OWN SHARES OF SBUX STOCK ***