InterDigital Inc. stock trades under the ticker IDCC & has shown recent bullish behavior amid a volatile market.
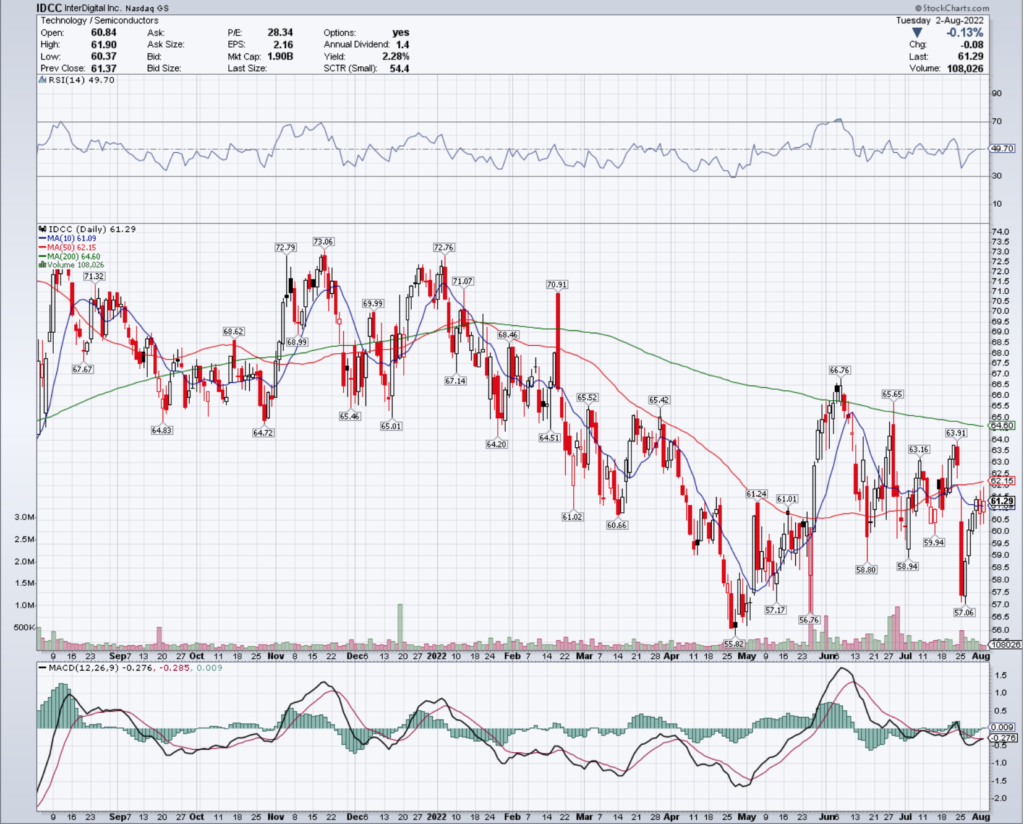
IDCC stock closed at $61.29/share on 8/3/2022.
InterDigital Inc. IDCC Stock’s Technical Performance Broken Down
IDCC Stock Price: $61.29
10 Day Moving Average: $61.09
50 Day Moving Average: $62.15
200 Day Moving Average: $64.60
RSI: 49.7
MACD: -0.276
Yesterday, IDCC completed a bullish MACD crossover, closing just above their 10 day moving average.
Recent volumes have been light & their RSI is neutral, signaling that there is uncertainty around the price of IDCC in the markets.
They have support at $61.24 & $61.02, while they try to break above the $62.15 & $63.16/share resistance levels.
InterDigital Inc. IDCC Stock As A Long-Term Investment
Long-term oriented investors will like IDCC stock’s valuation metrics, with a 28.29 P/E (ttm) & a 2.51 P/B (mrq).
They recently reported 23% Quarterly Revenue Growth Y-o-Y, with 223% Quarterly Earnings Growth Y-o-Y.
Their balance sheet also looks appealing, with $899.22M of Total Cash (mrq) & $424.1M of Total Debt (mrq).
IDCC stock pays a 2.28% dividend yield, which may be sustainable in the long-term, despite their 64.5% payout ratio.
84.6% of IDCC stock’s outstanding share float is owned by institutional investors.
InterDigital Inc. IDCC Stock As A Short-Term Trade Using Options
Short-term focused traders can use options to hedge against the volatile market environment, while profiting from movements in either direction for IDCC stock.
I am looking at the contracts with the 8/19 expiration date.
The $60, $57.50 & $55 call options are all in-the-money, listed from most to least liquid.
There are currently no puts in-the-money, but there is open interest at the $57.50, $60 & $55 strike prices should the stock fall.
Tying It All Together
IDCC stock has many interesting attributes that traders & investors are sure to like.
Investors will like their valuation metrics & balance sheet health, but may want to research further on their dividend’d sustainability in the mid-to-long term.
Traders will like their recent resilience in a volatile market period, but may be disappointed by how illiquid their options are.
Overall, it is worth researching how IDCC stock fits into your portfolio strategy.
*** I DO NOT OWN SHARES OF IDCC STOCK AT THE TIME OF PUBLISHING THIS ARTICLE ***
Hasbro, Inc. stock trades under the ticker HAS & has shown recent bullishness that traders & investors should research further into.
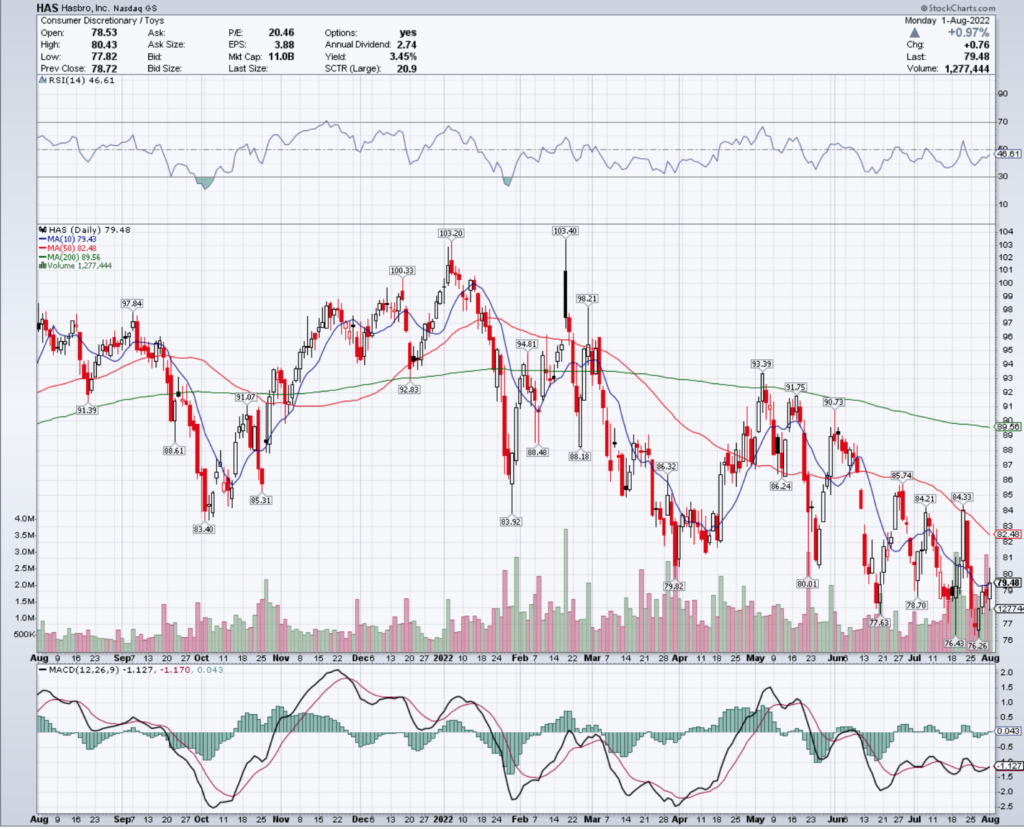
HAS stock closed at $79.48/share on 8/1/2022.
Hasbro, Inc. HAS Stock’s Technical Performance Broken Down
HAS Stock Price: $79.48
10 Day Moving Average: $79.43
50 Day Moving Average: $82.48
200 Day Moving Average: $89.56
RSI: 46.61
MACD: -1.127
Yesterday, HAS stock completed a bullish MACD crossover, break out & settling just above its 10 day moving average.
Their RSI is neutral, and recent trading volumes have been above average compared to the year prior, signaling that there may be more momentum to come in the near-term.
They have support at the $78.70/share level, while they try to break above the $79.82 & $80.01 resistance levels.
Hasbro, Inc. HAS Stock As A Long-Term Investment
Long-term oriented investors will like HAS stock’s 20.48 P/E (ttm), but they may find their 3.68 P/B (mrq) to be a bit rich.
Their balance sheet will need a more thorough review, with $586.3M of Total Cash (mrq) & $4.21B of Total Debt (mrq).
HAS stock pays a 3.51% dividend yield, which may be unsustainable in the long-run, as their payout ratio is 70.6%.
86.64% of HAS stock’s outstanding share float is owned by institutional investors.
Hasbro, Inc. HAS Stock As A Short-Term Trade Using Options
Short-term focused traders can trade options to profit from movements in HAS stock’s price in any direction, while hedging against broader market volatility.
I am looking at the contracts with the 8/19 expiration date.
The $77.50, $75 & $72.50 call options all are in-the-money, listed from highest to lowest levels of open interest.
The $80, $85 & $82.50 puts are also all in-the-money, with that former being more liquid than the latter two.
Tying It All Together
HAS stock has many interesting characteristics that traders & investors will like.
Investors will like their P/E (ttm) & dividend yield, but may want to review their balance sheet more thoroughly before investing to see how sustainable the yield will be in the long term.
Traders will like their current technical set up, but may be disappointed by how liquid their options are.
All-in-all, it is worth taking a closer look at HAS stock to see how it fits into your portfolio strategy.
*** I DO NOT OWN SHARES OF HAS STOCK AT THE TIME OF PUBLISHING THIS ARTICLE ***
Last week was a bit of relief for longs in the market, with gains on four of the five days.
Earnings reports were received with enthusiasm, although most contained issues of warning for upcoming headwinds for investors to anticipate in the coming months to years.
The Federal Reserve stayed in line with expectations, announcing a .75% increase in rates, which also helped the market as there were no surprises, however there was some future uncertainty that was discussed on that front as well.
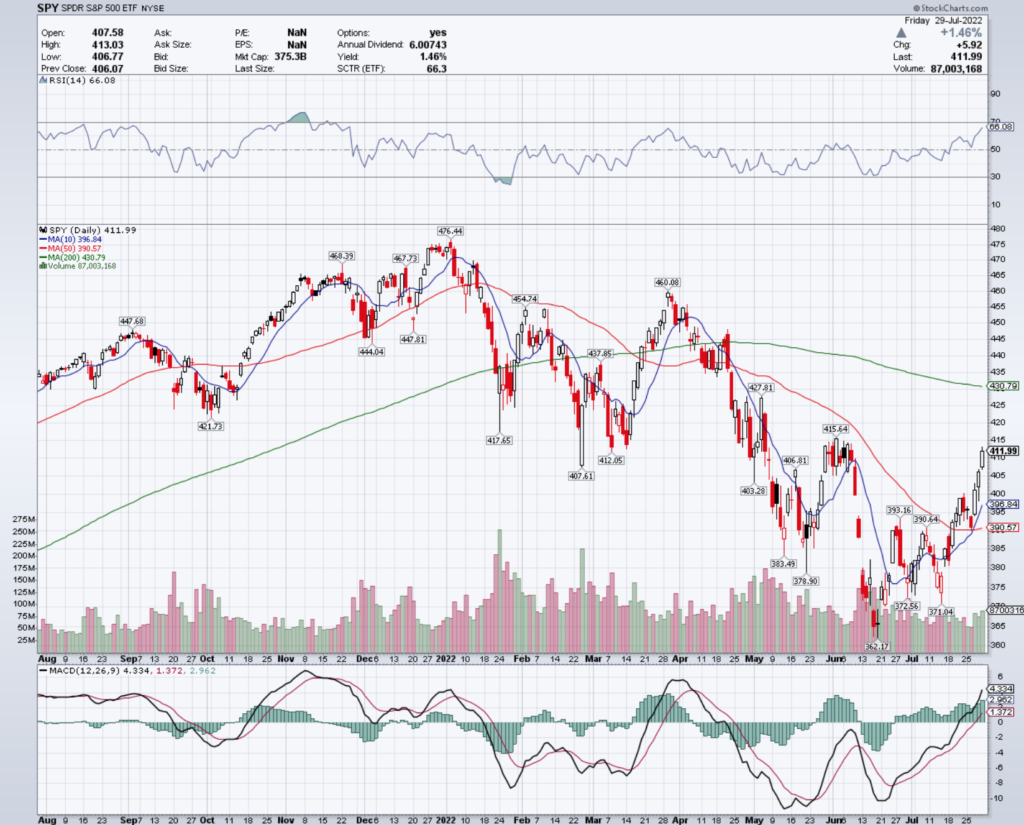
SPY, the SPDR S&P 500 ETF had one of its strongest weeks in 2022, and ending the week on a 1.46% gap up Friday.
SPY ETF – SPDR S&P 500 ETF
Expect to see some pullback & shake-out this week, as their RSI is entering overbought territory, and with that their MACD will follow bearishly.
Volume this last week was also not particularly high, showing that market participants still have some reservations.
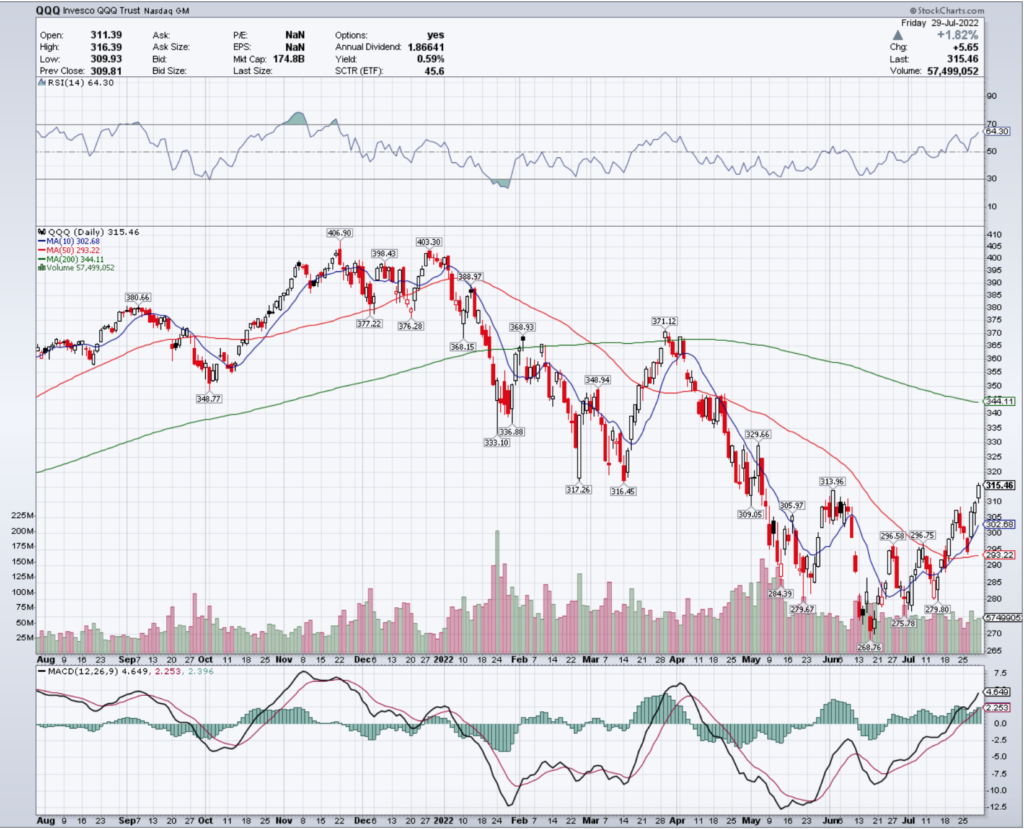
Their chart also tells the same story as SPY’s, and earnings calls this week are likely to be the straw that breaks the camel’s back.
Big banks & big companies, especially tech have all reported earnings now, but many of these companies are less likely to be negatively impacted by the current state of the economy vs. the smaller companies that will be reporting in the coming weeks.
We will get better insight not only into the true state of the consumer, but also the state of the American worker, as companies will surely be discussing layoffs & hiring freezes.
Let’s take a look at the best & worst performing sectors & geo-location ETFs from a technical perspective.
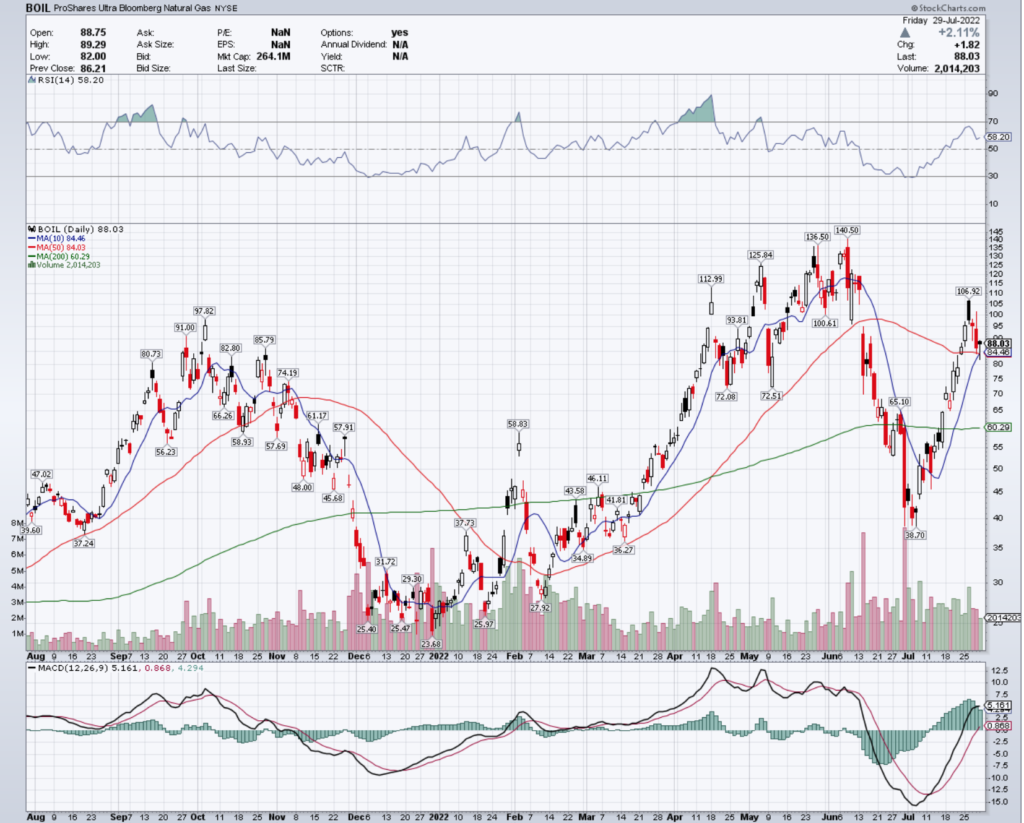
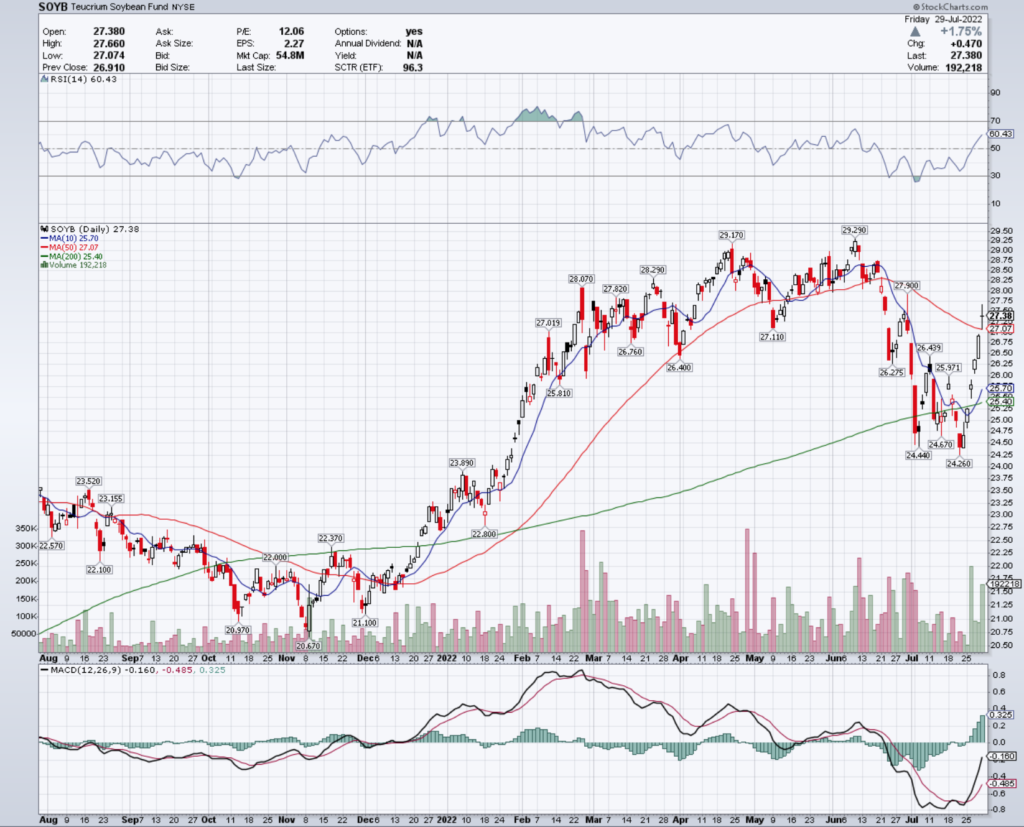
Natural Gas (BOIL), Soybeans(SOYB), Water Resources (PHO) & U.S. Infrastructure Development (PAVE) Are All Bullishly Leading The Market
Friday’s 1.75% gap up was on above average volume, signaling confidence among investors, & it looks like SOYB could begin to establish a new price range around the $27.38 range.
They will need to break above $27.90 to continue their bullish march forward, but their RSI is still on the overbought end of neutral & they may have more momentum in the near-term.
Like with anything else these days though, keep an eye on the puts as insurance in this volatile market.
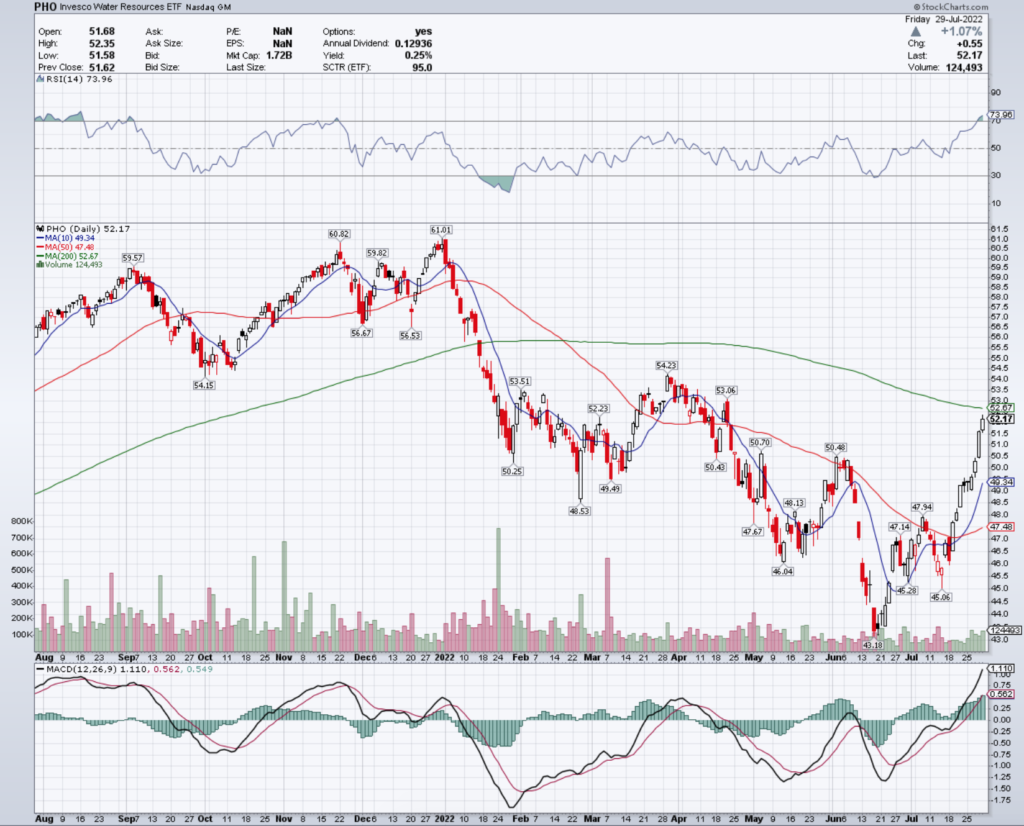
PHO, the Invesco Water Resources ETF has had an extremely strong last couple of weeks, recovering much of its losses that were incurred since March 2022.
PHO ETF – Invesco Water Resources ETF
Their volumes have been below average consistently since early March, signaling that there is not a high degree of confidence from investors.
The $52.23 price level will be their next test, although they may not break above it right away, as their RSI is overbought & there is sure to be some settling down into a price range in the near-term.
With a small dividend (0.25%) & options, there are multiple ways for investors to protect themselves while this new price range is established.
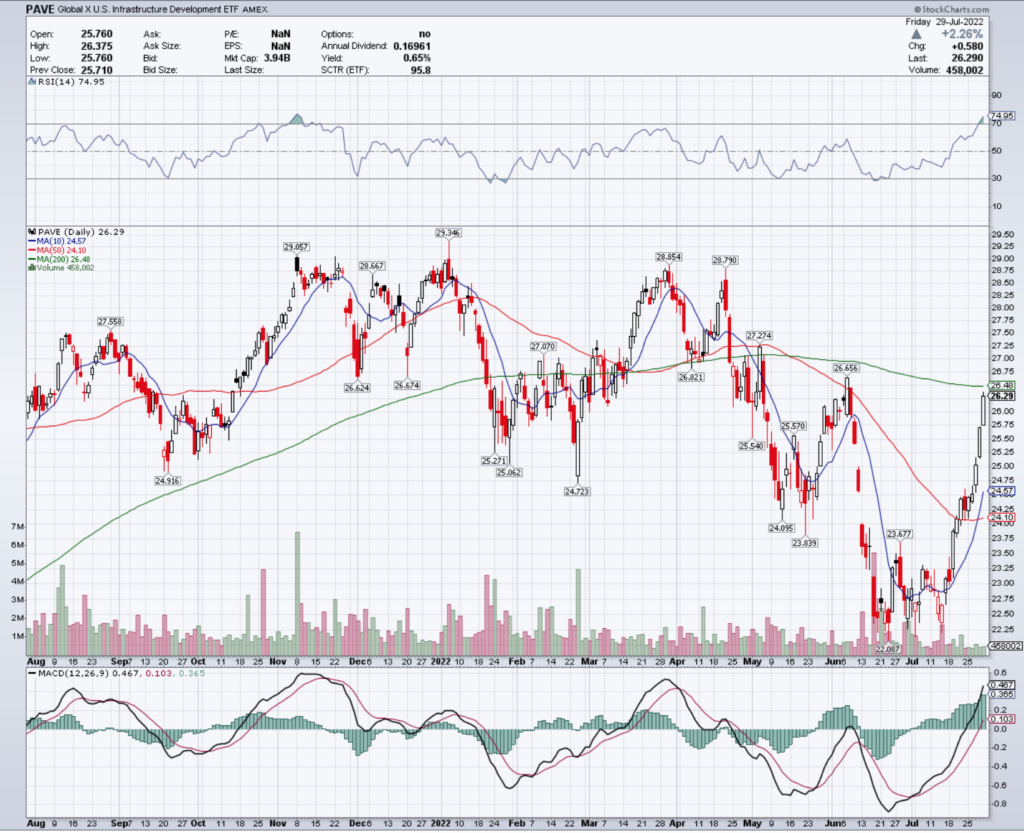
PAVE ETF – Global X U.S. Infrastructure Development ETF
They too have an overbought RSI, and if they can’t break above the $26.66/share resistance level should begin to establish a new price range between there & $25.57.
Their dividend is a bit healthier than PHO’s at 0.65%, but that is the only cushion for these shares as there are no PAVE options.
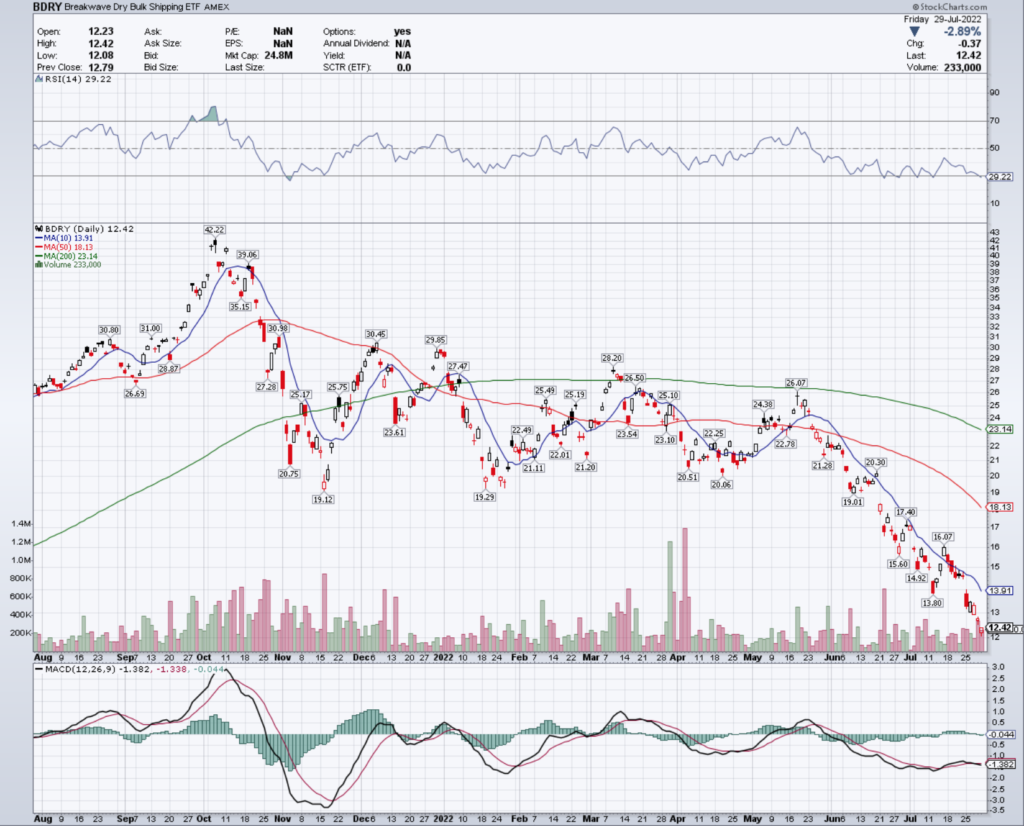
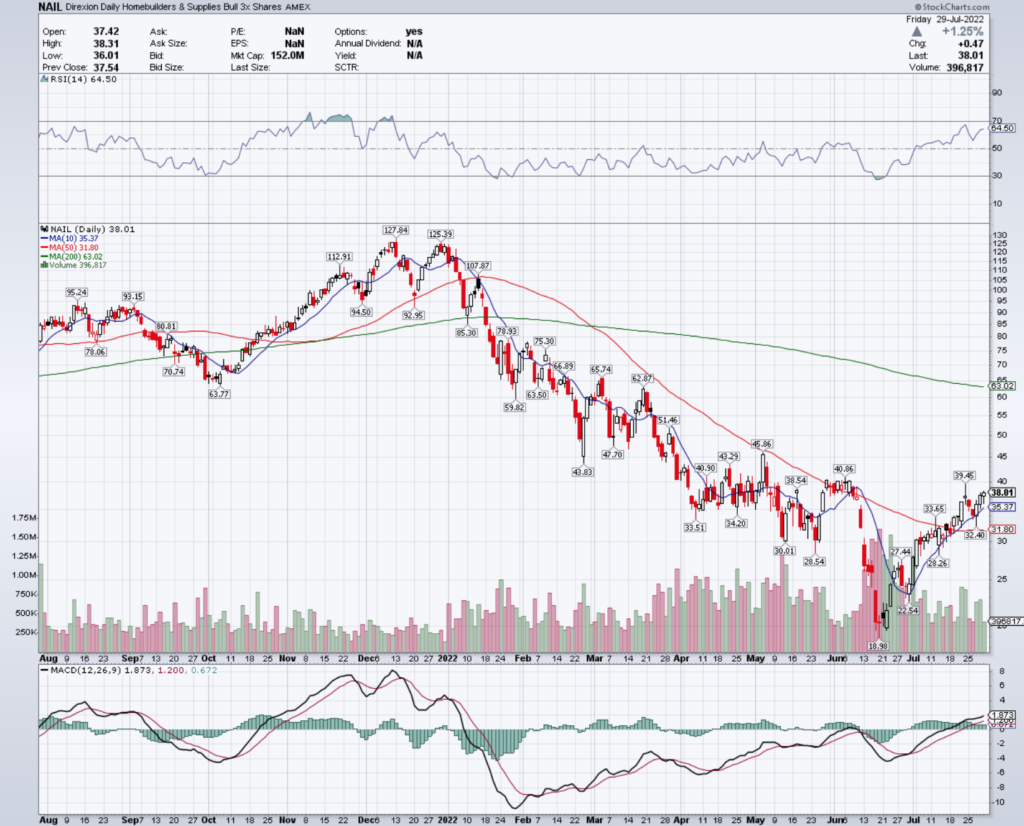
Dry Bulk Shipping (BDRY), Homebuilders & Supplies (NAIL), Germany (EWG) & The Euro (ULE)Are All Bearishly Lagging The Market
Keep an eye on their MACD, as it is beginning to curl over bearishly & looks to be signaling there is some near-term losses on the horizon.
NAIL does not offer a dividend, so all protection will need to be in the form of puts.
There is not much in terms of support until the $34.20/level, which is something to keep in mind as you do your research.
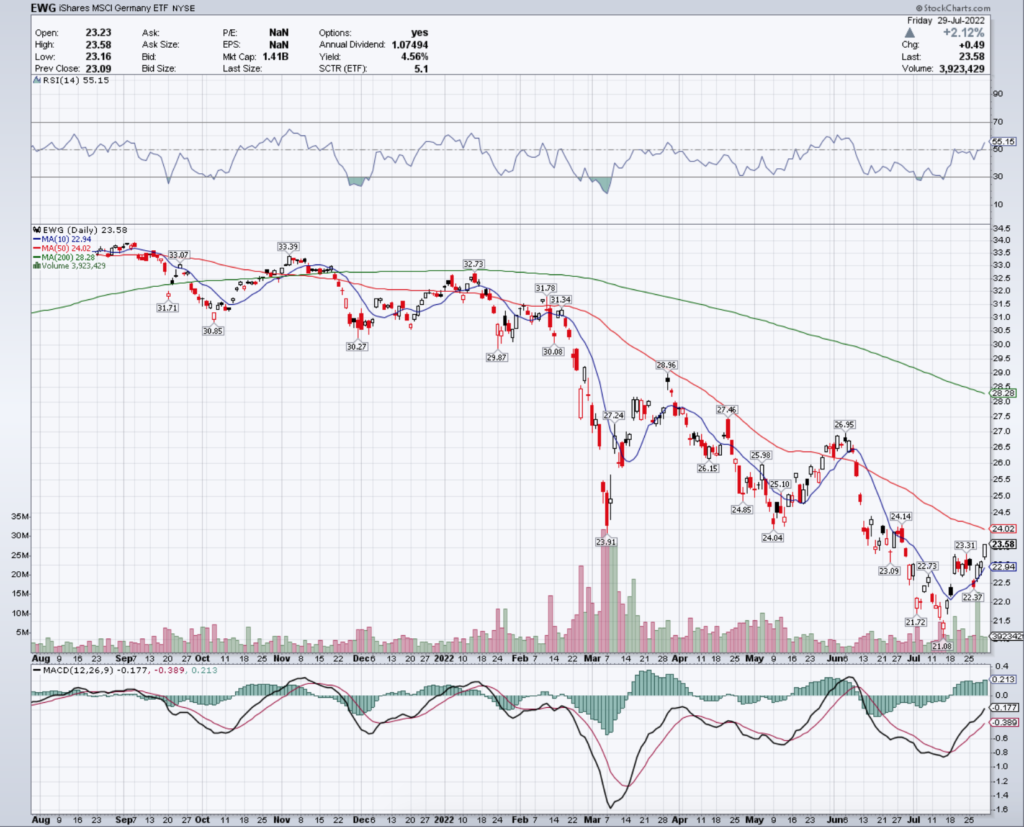
EWG, the iShares MSCI Germany ETF has rallied back from its low for the year over the last couple of weeks after a steady decline for the last year.
EWG ETF – iShares MSCI Germany ETF
They will need to test the $24.14 level, but have support at $23.31/share, which when combined with their 4.56% dividend yield looks to have an appealing possible entry-point for a position.
However, based on their MACD’s bearish leveling off, it would be wise to also have some puts as protection too.
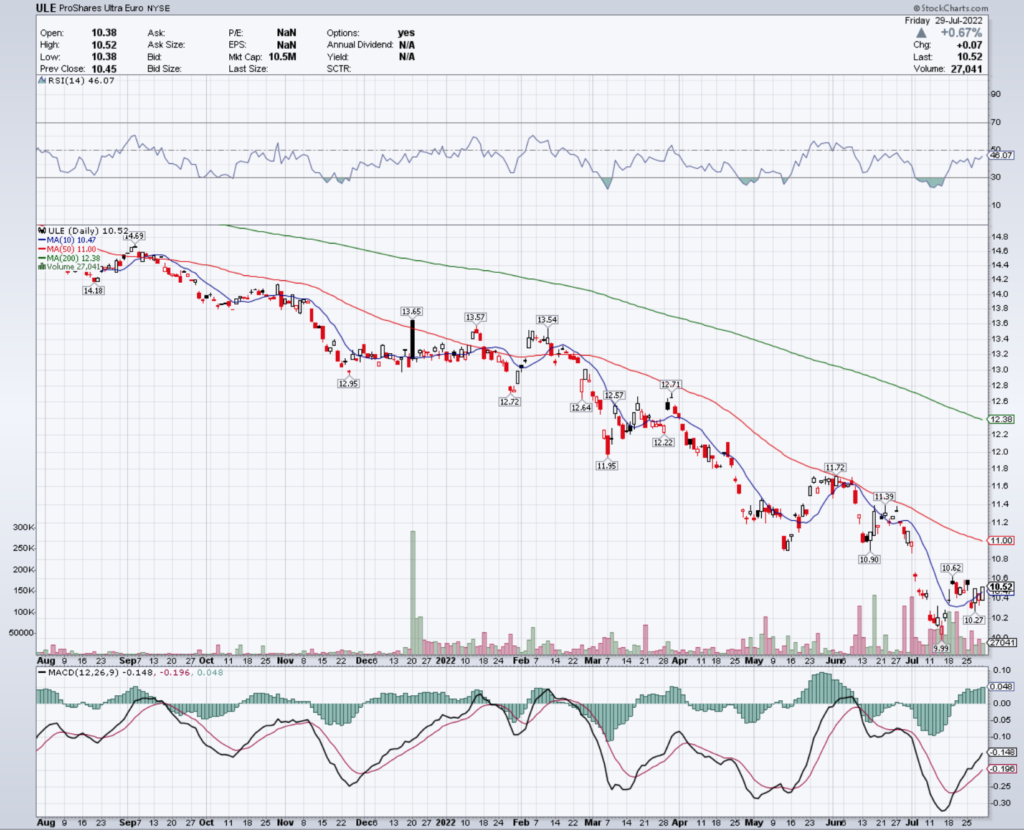
ULE, the ProShares Ultra Euro ETF also experienced a bit of a brief bounce over the month of July, after also falling steadily over the year prior.
ULE ETF – ProShares Ultra Euro ETF
I would expect them to move in similar fashion to EWG, and their technicals are all on a similar page as one another.
Look for them to try to break above the $10.62 resistance level, with $10.27 being the first stop down in terms of support.
Tying It All Together
This week will be a continuation of earnings, where stocks will look to keep up the same momentum that powered them through the last few days of last week.
Based on recent trading volumes there is still a lot of uncertainty surrounding where the indexes will go next.
Manufacturing numbers & employment opportunity numbers are expected to drop modestly in this week’s announcements, while there is a slight expected increase in PMI coming in Wednesday’s announcement.
The non-farm payrolls numbers are expected to decrease dramatically, but the unemployment rate is still projected to be 3.6%.
James Bullard & Loretta Mester are both scheduled to speak as well, with markets responding positively last month for Bullard after he spoke.
While the recent bear rally may continue into the week, don’t expect it to gather too much steam.
*** I DO NOT OWN SHARES OF SPY, QQQ, BOIL, SOYB, PHO, PAVE, BDRY, NAIL, EWG & ULE AT THE TIME OF PUBLISHING THIS ARTICLE ***
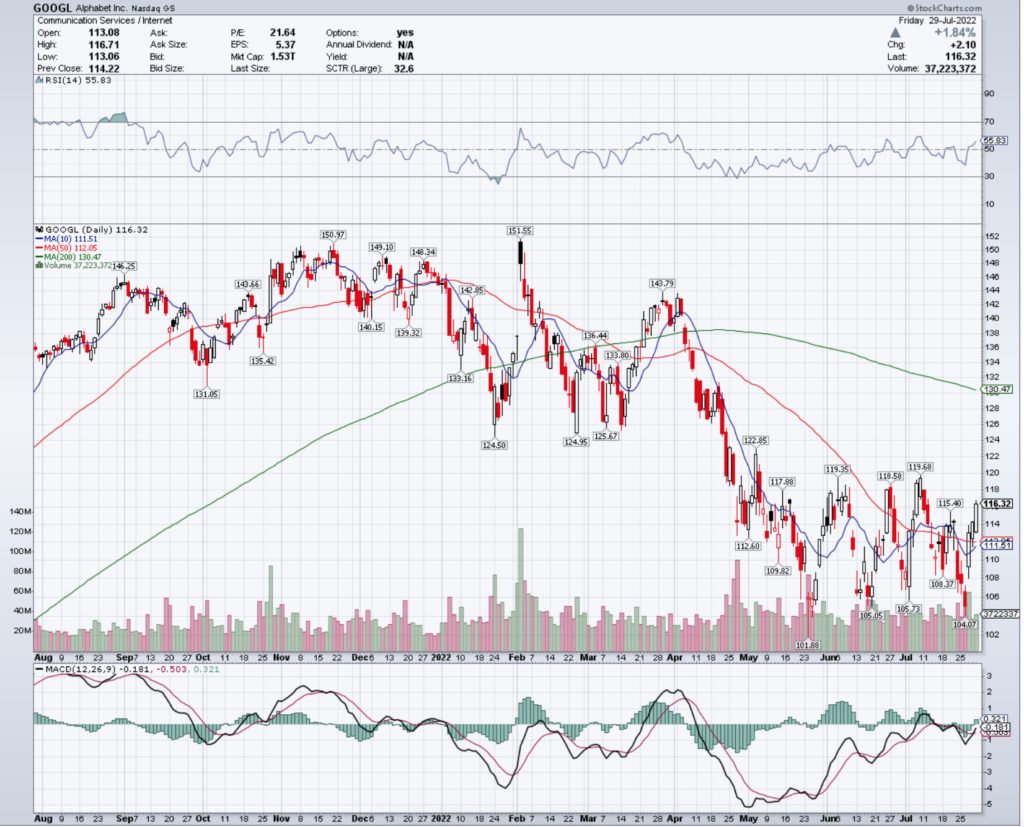
Alphabet Inc. stock trades under the ticker GOOGL & has shown recent bullish behavior amid market volatility that traders & investors should research further into.
GOOGL stock closed at $116.32/share on 7/29/2022.
Alphabet Inc. GOOGL Stock’s Technical Performance Broken Down
GOOGL Stock Price: $116.32
10 Day Moving Average: $111.51
50 Day Moving Average: $112.05
200 Day Moving Average: $130.47
RSI: 55.83
MACD: -0.181
On Friday, GOOGL stock completed a bullish MACD crossover, notching its third consecutive day of gains.
Their RSI is still neutral, and their recent trading volumes have been above average compared to the year prior, signaling that there may still be more near-term momentum.
They will need to remain above the $$115.40 support level, while they try to break above the $117.88 resistance level.
Alphabet Inc. GOOGL Stock As A Long-Term Investment
Long-term oriented investors will like GOOGL stock’s P/E (ttm) of 21.27, but may find their 5.83 P/B (mrq) to be a bit too high.
They recently reported 12.6% Quarterly Revenue Growth Y-o-Y, with -13.6% Quarterly Earnings Growth Y-o-Y.
Their balance sheet will delight investors, with $125B of Total Cash (mrq) & only $28.81B of Total Debt (mrq).
Unfortunately, GOOGL stock does not pay a dividend.
Regardless, 79.33% of GOOGL stock’s outstanding share float is owned by institutional investors.
Alphabet Inc. GOOGL Stock As A Short-Term Trade Using Options
Short-term focused traders can use options to protect themselves from market volatility, while also profiting from price movements in any direction for GOOGL stock.
I am looking at the contracts with the 8/19 expiration date.
The $115, $116 & $114 call options are all in-the-money, listed from most to least liquid strike price.
The $116.50, $117.50 & $117 puts are also all in-the-money, with the former having the highest level of open interest.
Tying It All Together
GOOGL stock offers investors many interesting opportunities for growth, while still maintaining some value characteristics.
Investors will like their valuation metrics & balance sheet, but will be disappointed by their lack of dividend.
However, should they instate a dividend that may signal that there is headwinds on the horizon or that they are not as confident in the ability to continue growing.
Traders will like their current technical set up, as well as the liquidity of their options.
All-in-all, GOOGL stock is worth taking a closer look into to see how it fits into your portfolio strategy.
*** I DO NOT OWN SHARES OF GOOGL STOCK AT THE TIME OF PUBLISHING THIS ARTICLE ***
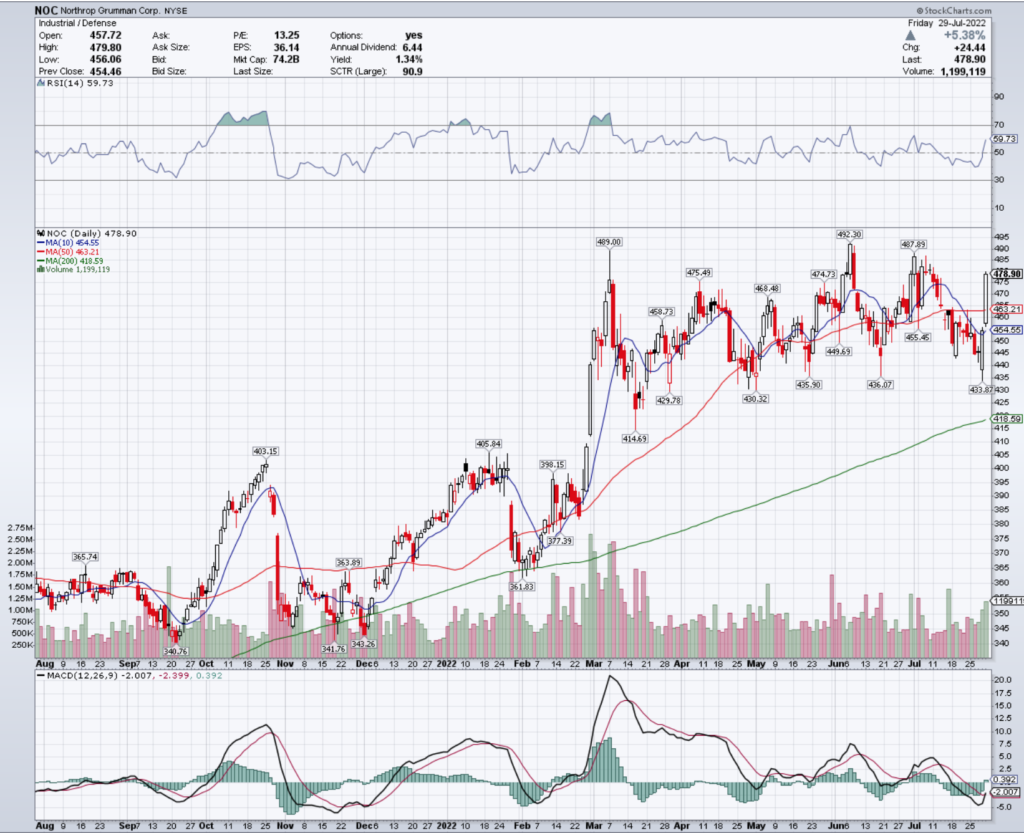
Northrop Grumman Corp. stock trades under the ticker NOC & has shown recent bullishness that traders & investors should research further into.
NOC stock closed at $478.90/share on 7/29/2022.
Northrop Grumman Corp. NOC Stock’s Technical Performance Broken Down
NOC Stock Price: $478.90
10 Day Moving Average: $454.55
50 Day Moving Average: $463.21
200 Day Moving Average: $418.59
RSI: 59.73
MACD: -2.007
On Friday, NOC stock gapped up 5.38%, closing above its 50 day moving average & completing a bullish MACD crossover.
Their RSI is on the overbought end of neutral, and recent trading volumes have been about average compared to the year prior, signaling that there may be momentum to come in th enear-term.
They will need to remain above the $475.49 support level as they try to break above the $487.89 resistance level.
Northrop Grumman Corp. NOC Stock As A Long-Term Investment
Long-term oriented investors will like NOC stock’s P/E (ttm) of 12.55, but will find their 5.32 P/B (mrq) to be a bit rich.
They recently reported -3.8% Quarterly Revenue Growth Y-o-Y, with -8.8% Quarterly Earnings Growth Y-o-Y.
Their balance sheet will require some additional research before making an investment, with $1.17B of Total Cash (mrq) & $14.49B of Total Debt (mrq).
NOC stock pays a 1.36% dividend yield, which appears to be stable in the long-term, as their payout ratio is 17.98%.
84.2% of NOC stock’s outstanding share float is owned by institutional investors.
Northrop Grumman Corp. NOC Stock As A Short-Term Trade Using Options
Short-term oriented traders can use options to hedge against market volatility, while profiting from movements in NOC stock in any direciton.
I am looking at the contracts with the 8/19 expiration date.
The $470, $475 & $472.50 call options are all in-the-money, listed from highest to lowest level of open interest.
The $480, $485 & $490 puts are also in-the-money, in order of most to least liquid.
Tying It All Together
NOC stock offers many interesting opportunities to traders & investors alike.
Investors will like NOC stock’s safe dividend yield, but may want to research their balance sheet more before making an investment.
Traders will like their recent technical performance, as well as how liquid their options are.
Overall, NOC stock is worth taking a closer look into to see how it fits into your portfolio strategy.
*** I DO NOT OWN SHARES OF NOC STOCK AT THE TIME OF PUBLISHING THIS ARTICLE ***
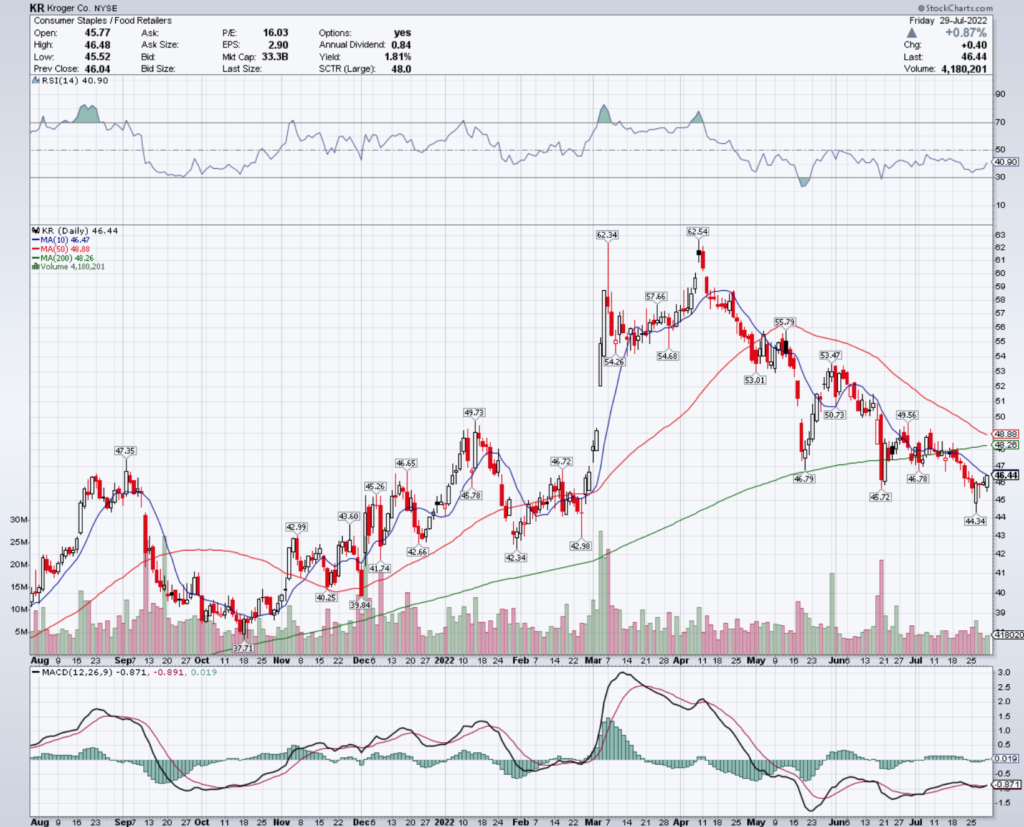
Kroger Co. stock trades under the ticker KR & has shown recent bullishness that traders & investors should look closer into.
KR stock closed at $46.44/share on 7/29/2022.
Kroger Co. KR Stock’s Technical Performance Broken Down
KR Stock Price: $46.44
10 Day Moving Average: $46.47
50 Day Moving Average: $48.88
200 Day Moving Average: $48.26
RSI: 40.9
MACD: -0.871
On Friday, KR stock completed a bullish MACD crossover, closing just beneath its 10 day moving average.
Their RSI is on the oversold side of neutral, and recent volumes have been lighter than average, signaling that investors still have an unsure sentiment about its price.
They need to remain above the $45.72 support level, while trying to break above the $46.78 resistance level.
Kroger Co. KR Stock As A Long-Term Investment
Long-term oriented investors will like KR stock’s 15.92 P/E (ttm), but may think that their 3.5 P/B (mrq) is too rich at 3.5.
They recently reported 8% Quarterly Revenue Growth Y-o-Y, with 374.3% Quarterly Earnings Growth Y-o-Y.
Their balance sheet will require a closer examination, with $1.38B of Total Cash (mrq) & $20.75B of Total Debt (mrq).
KR stock pays a 1.82% dividend yield, which appears to be stable in the long-run, as their payout ratio is 28%.
82.73% of KR stock’s outstanding share float is owned by institutional investors.
Kroger Co. KR Stock As A Short-Term Trade Using Options
Short-term focused traders can use options to profit from price movements in KR stock, while protecting themselves from broader market volatility.
I am looking at the contracts with the 8/19 expiration date.
The $46, $45 & $44 call options are all in-the-money, with the former having more open interest than the latter 2.
The $48, $47 & $46.50 puts are also all in-the-money, listed in order of most to least liquid.
Tying It All Together
KR stock offers many opportunities to investors & traders alike.
Investors will like their safe dividend, along with their P/E, but may want to look closer into their balance sheet.
Traders will like their current market performance in times of elevated volatility compared to many of their peers, as well as how liquid their options are.
All-in-all, it is worth taking a closer look into KR stock to see how it fits into your portfolio strategy.
*** I DO NOT OWN SHARES OF KR STOCK AT THE TIME OF PUBLISHING THIS ARTICLE ***
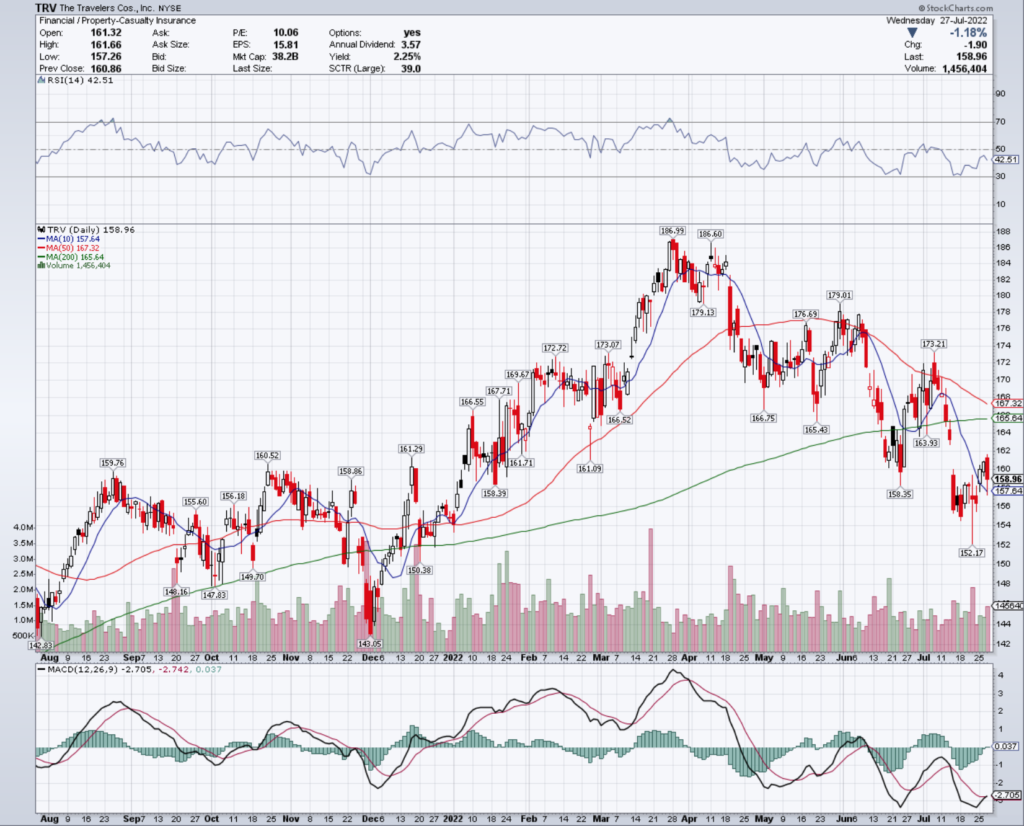
The Travelers Cos., Inc. stock trades under the ticker TRV & has shown recent bullishness that traders & investors should take a closer look into.
TRV stock closed at $158.96/share on 7/27/2022.
The Travelers Cos., Inc. TRV Stock’s Technical Performance Broken Down
TRV Stock Price: $158.96
10 Day Moving Average: $157.64
50 Day Moving Average: $167.32
200 Day Moving Average: $165.64
RSI: 42.51
MACD: -2.705
Yesterday, TRV stock completed a bullish MACD crossover, despite settling down 1.18%
Their RSI is still in oversold territory, and their recent trading volumes have been about average compared to the year prior, signaling that there may still be some momentum to come in the near-term.
They will need to break above the $159.76 & $160.52/share resistance levels as they continue to climb higher.
The Travelers Cos., Inc. TRV Stock As A Long-Term Investment
Long-term oriented investors will like TRV stock’s valuation metrics, with a 10.87 P/E (ttm) & a 1.62 P/B (mrq).
They recently reported 5.2% Quarterly Revenue Growth Y-o-Y, with -41% Quarterly Earnings Growth Y-o-Y.
Their balance sheet will warrant a closer review before making an investment though, with $4.28B of Total Cash (mrq) & $7.29B of Total Debt (mrq).
TRV stock pays a 2.22% dividend yield, which appears to be sustainable in the long-run, with a 24.8% payout ratio.
85% of TRV stock’s outstanding share float is owned by institutional investors.
The Travelers Cos., Inc. TRV Stock As A Short-Term Trade Using Options
Short-term oriented traders can use options to profit from short term movements in TRV stock’s price, while hedging against broader market volatility.
I am looking at the contracts with the 8/19 expiration date.
The $155, $150 & $140 calls are all in-the-money, listed from most to least liquid.
The $160, $165 & $170 puts are also all in-the-money, with the former being more liquid than the latter strikes.
Tying It All Together
TRV stock has many interesting characteristics that traders & investors will find appealing.
Investors will like their valuation metrics, as well as their dividend yield, but may want to review the structure of their balance sheet before making an investment.
Traders will like their current technical strength amid volatility, but may be disappointed by how liquid their options are.
All-in-all, TRV stock is worth taking a closer look into to see how it fits into your portfolio strategy.
*** I DO NOT OWN SHARES OF TRV STOCK AT THE TIME OF PUBLISHING THIS ARTICLE ***
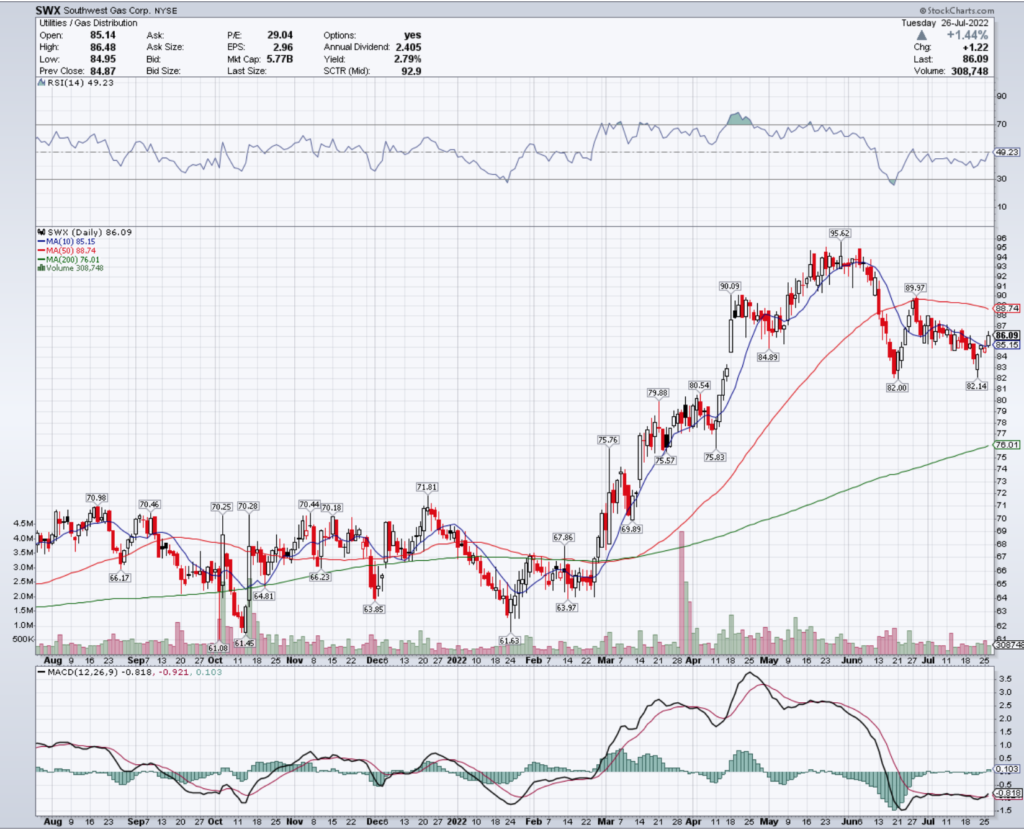
Southwest Gap Corp. stock trades under the ticker SWX & has shown recent bullishness that traders & investors should research further into.
SWX stock closed at $86.09/share on 7/26/2022.
Southwest Gas Corp. SWX Stock’s Technical Performance Broken Down
SWX Stock Price: $86.09
10 Day Moving Average: $85.15
50 Day Moving Average: $88.74
200 Day Moving Average: $76.01
RSI: 49.23
MACD: -0.818
Yesterday, SWX stock completed a bullish MACD crossover, while break out & settling above its 10 day moving average.
With a neutral RSI & low trading volumes in the recent days compared to the year prior, there seems to be a lot of uncertainty about the future direction of SWX stock in the near-term.
They will need to remain above their support levels of $85.15 & $84.89, while trying to break above their $88.74 & $89.97/share resistance levels.
Southwest Gas Corp. SWX Stock As A Long-Term Investment
Long-term oriented investors will like SWX stock’s valuation metrics, with a 29.05 P/E (ttm) & a 1.63 P/B (mrq).
They recently reported 43.1% Quarterly Revenue Growth Y-o-Y, with -18% Quarterly Earnings Growth Y-o-Y.
Their balance sheet will require an additional review, with $624.7M of Total Cash (mrq) & $6.23B of Total Debt (mrq).
SWX stock pays a 2.8% dividend, which may not be sustainable in the long-run, with an 81.23% payout ratio/
Still, 95.3% of SWX stock’s outstanding share float is owned by institutional investors.
Southwest Gas Corp. SWX Stock As A Short-Term Trade Using Options
Short-term focused traders can use options to profit from SWX stock’s price movements, while hedging against volatility in the broader markets.
I am looking at the contracts with the 8/19 expiration date.
The $70, $65, $75 & $85 call options are all in-the-money, listed from highest to lowest levels of open interest.
The $90 puts are the only strike price in-the-money at the moment, although there is liquidity at the $85 & $80 levels.
Tying It All Together
SWX stock has a lot of characteristics that traders & investors are sure to find appealing.
Investors will like their valuation metrics & dividend yield, but may want to review their balance sheet to see how sustainable that yield is in the long-term.
Traders will like the way that they have weathered recent market volatility, but will be disappointed by how illiquid their options are.
Overall, it is worth taking a closer look into SWX stock to see how it fits into your portfolio strategy.
*** I DO NOT OWN SHARES OF SWX STOCK AT THE TIME OF PUBLISHING THIS ARTICLE ***
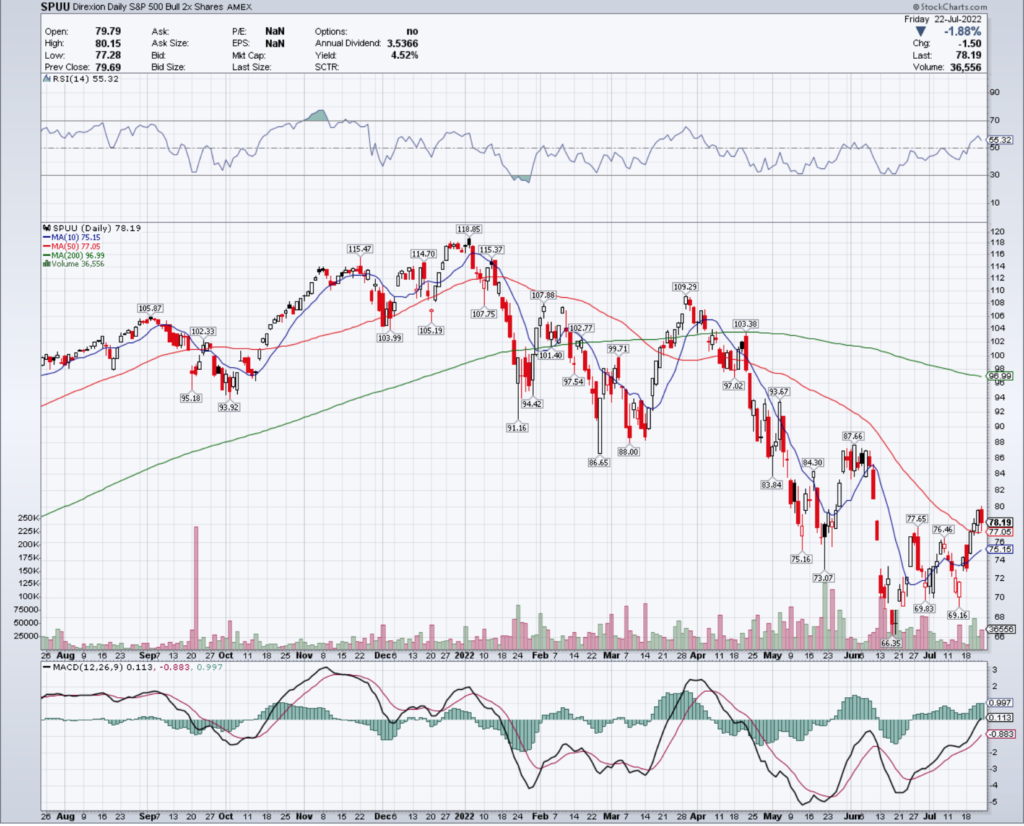
While volumes were above average compared to the rest of July, there still is a lot of uncertainty in the air, as their MACD is still charging upwards bullishly, but their RSI is breaking down.
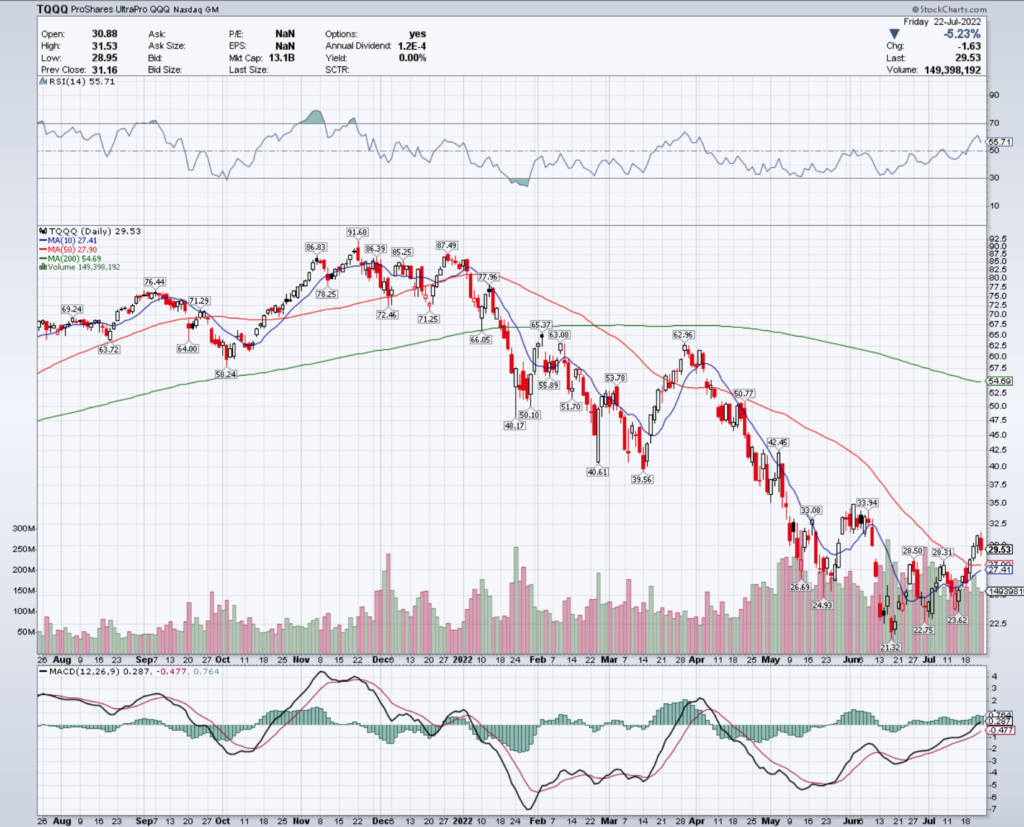
TQQQ, the ProShares UltraPro QQQ ETF that tracks the NASDAQ’s performance, has seen similar performance, although on higher volumes than SPUU compared to the recent month.
TQQQ ETF – ProShares UltraPro QQQ ETF
Based on their technical positioning, there looks to be a fallout coming for TQQQ in the near-term, given that their components tend to be more interest rate reliant than S&P 500 companies.
However, given the nature of the concerns for growth outlooks being discussed in recent earnings reports, the S&P 500 will follow close behind once the NASDAQ begins to fall again.
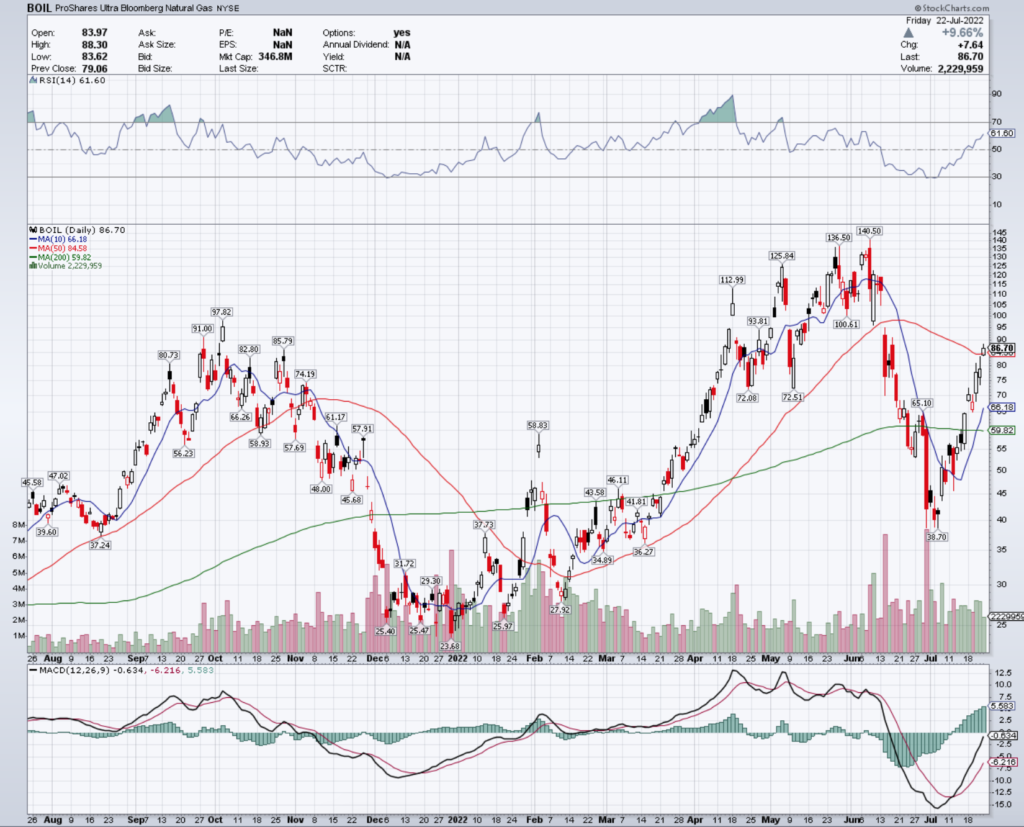
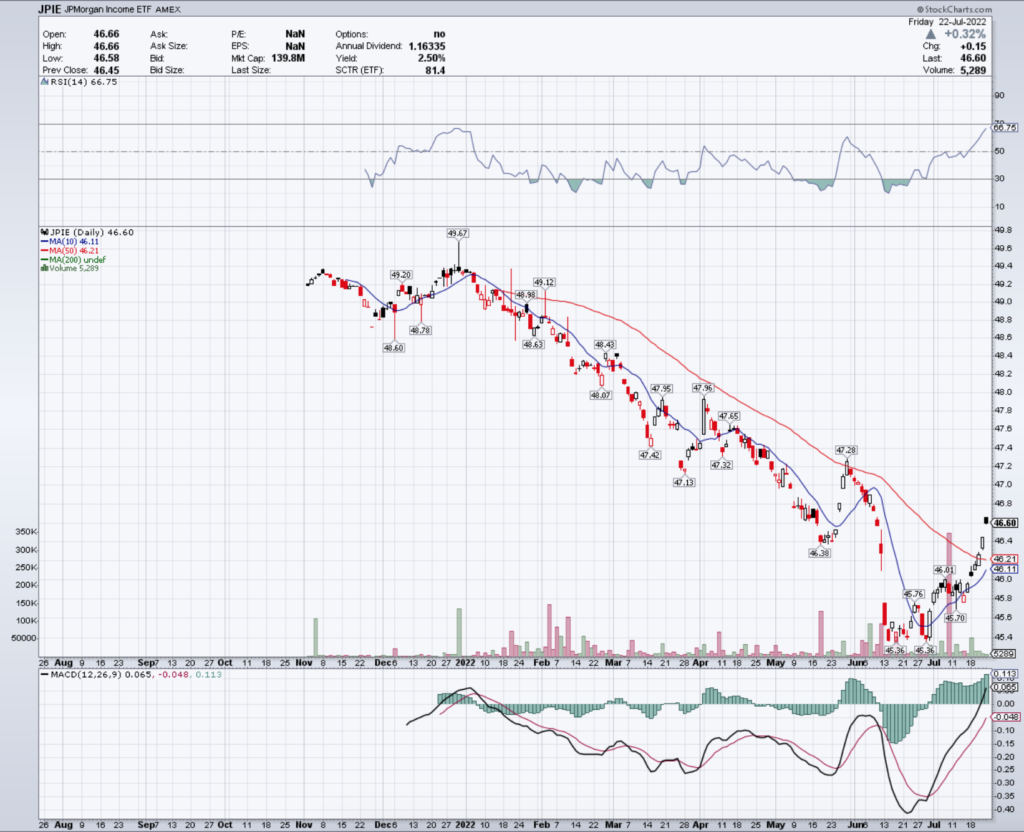
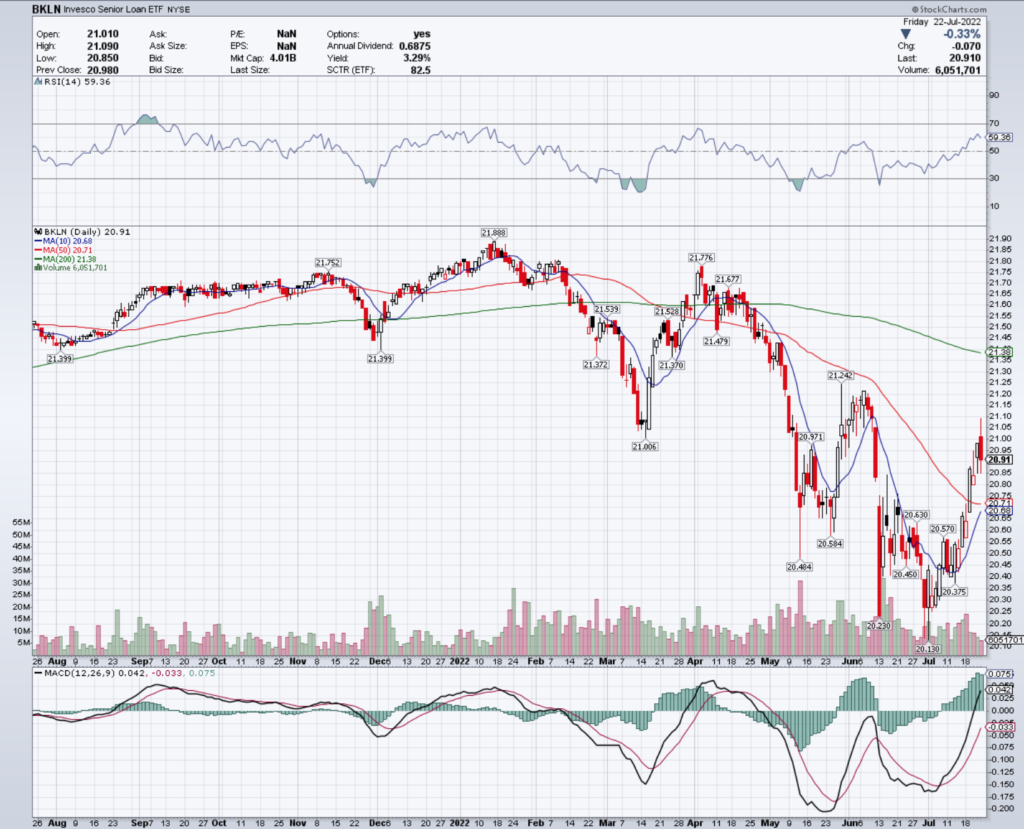
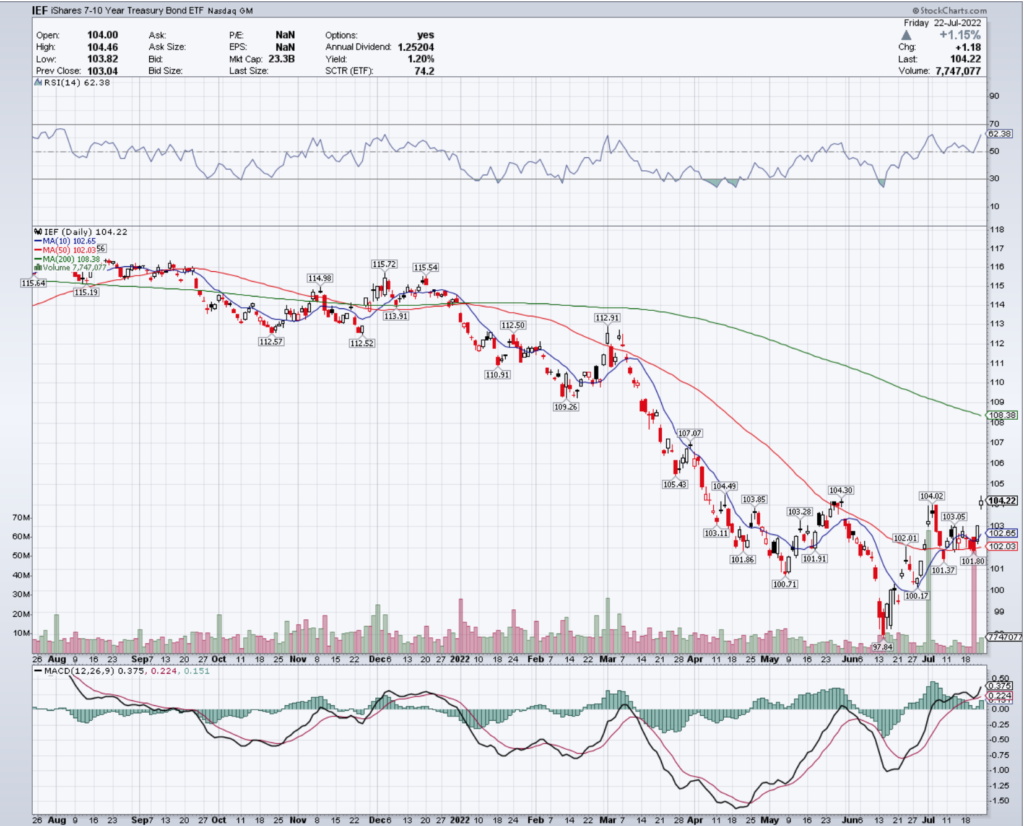
Natural Gas (BOIL), Debt Market Income (JPIE), Senior Loans (BKLN) & 7-10 Year Treasury Bonds (IEF) Are All Bullishly Leading The Markets
BOIL ETF – ProShares Ultra Bloomberg Natural Gas ETF
Their MACD points to more strength to come, and their RSI is still not in the overbought range yet, along with strong recent volume, signaling that BOIL still has momentum to run.
While they don’t have a dividend to provide downside protection, they do have options that traders & investors can use to position themselves against possible downturns as a hedge.
JPIE, the JPMorgan Income ETF is a relatively new ETF, and does not have options yet, but has been performing strongly since June’s steep downfall.
JPIE ETF – JPMorgan Income ETF
Their RSI is encroaching on overbought territory, while their MACD is still very bullish.
Traders & investors who own these shares have a 2.5% cushion against losses in their dividend yield, should they hold it for more than one year.
They need to break above the $46.80/share level as they continue climbing higher.
BKLN, the Invesco Senior Loan ETF also has recovered well from the losses incurred in June, despite showing weakness on Friday of this week.
BKLN ETF – Invesco Senior Loan ETF
Their MACD is still bullish, but beginning to turn bearish & their RSI has already begun to work its way back down towards neutral from recent high levels.
Fortunately, they pay a 3.3% dividend yield annually to investors who own them for a year, and also offer options that can be used to protect traders against any falls in price.
Their RSI is pushing towards overbought conditions, which may result in a brief cool off, but their MACD is still bullish.
IEF has options that can be used for downside protection/profits & also pays a 1.2% dividend, for those who hold their shares for the course of a year.
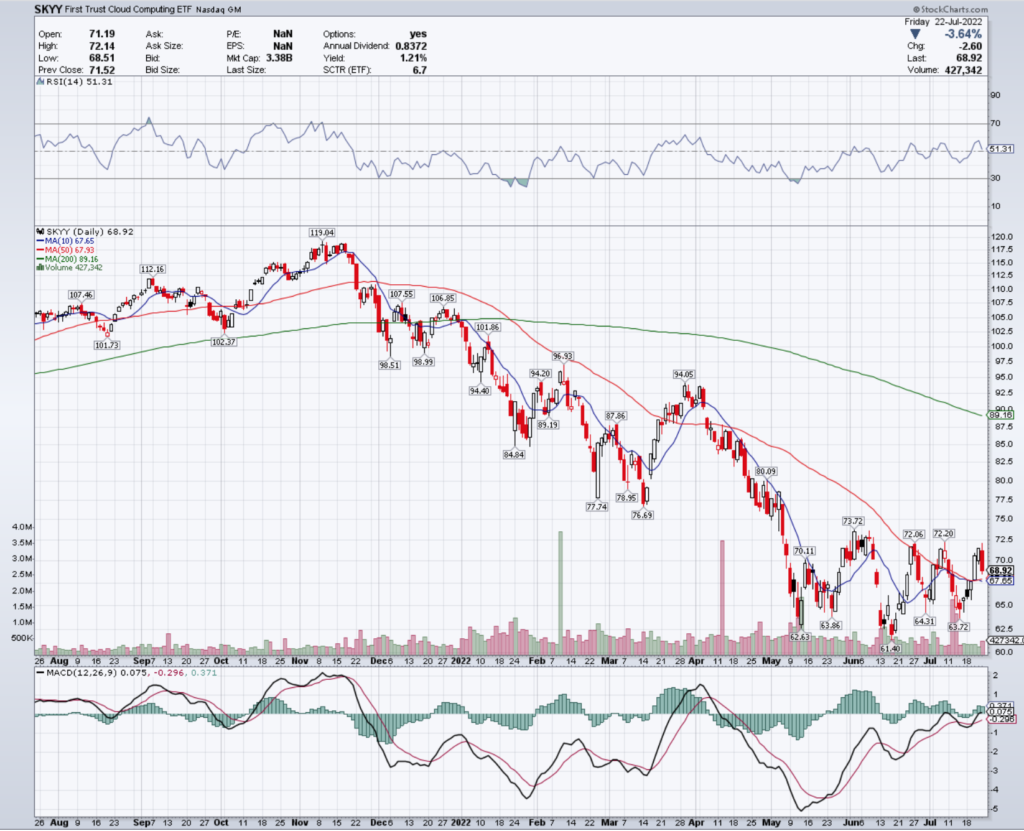
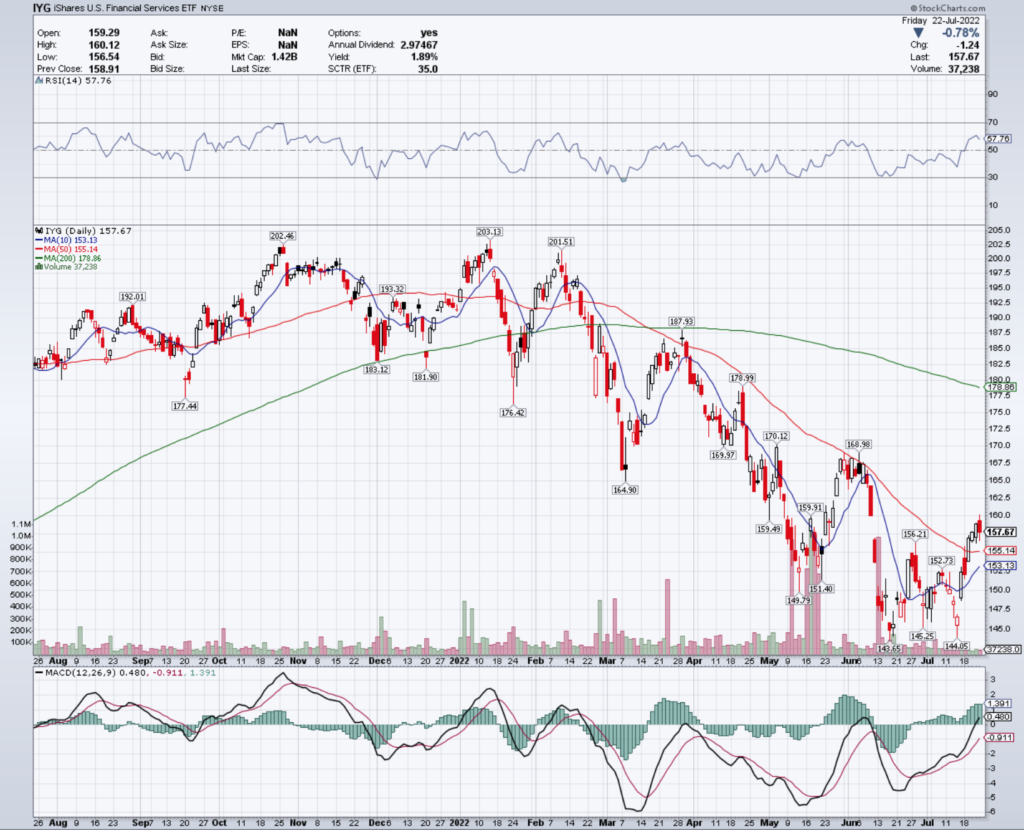
Cloud Computing (SKYY), U.S. Financial Services (IYG), Global Autos (CARZ) & Video Games & E-Sports (HERO) Are All Bearishly Lagging The Market
Traders can use their options to position themselves defensively against future losses, and shareholder get a 1.89% cushion of downside protection from their dividend.
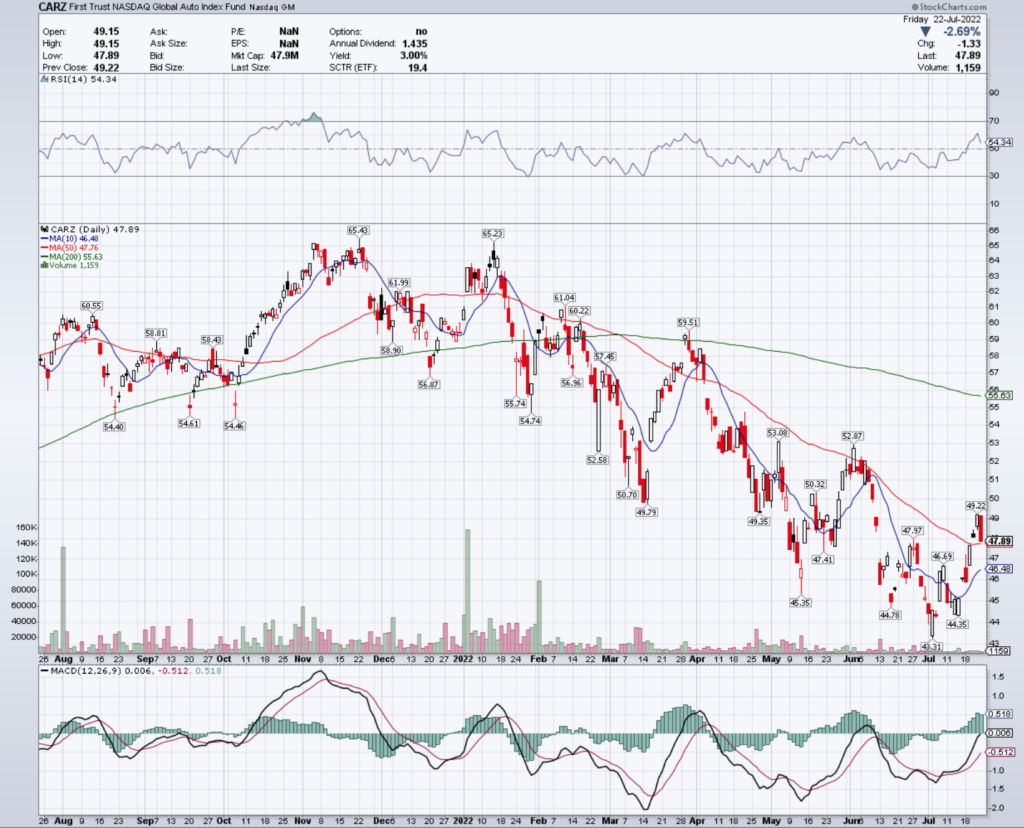
CARZ ETF – First Trust NASDAQ Global Auto Index Fund ETF
They have not traded on meaningful volume over the last few months, when compared with the year prior, showing that sentiment is still not that confident & bullish.
Despite not having options to trade, they do offer a 3% dividend yield as a cushion for investors who purchase the ETF & hold it for a year to protect against losses from volatility.
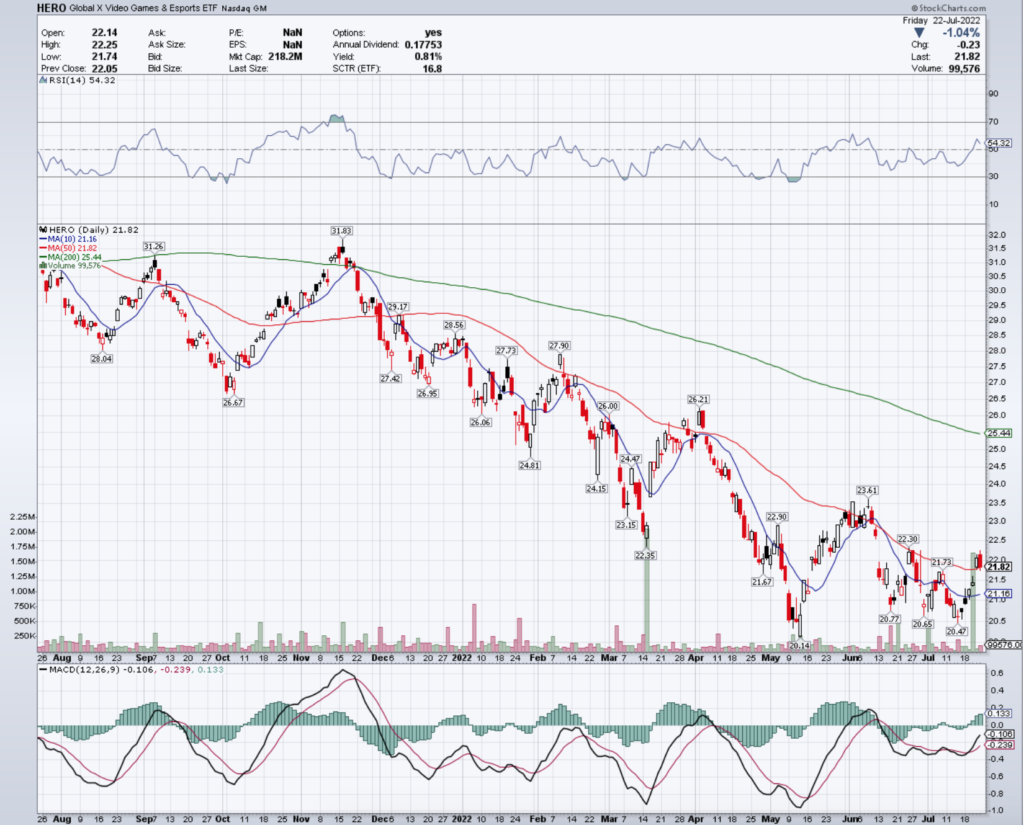
They will need to break above the $22.30 & $22.90 price levels to reverse their downward trend, but traders can trade their options as they decline further to profit in the meantime.
Tying It All Together
While the largest & most anticipated news this week will be coming out of the Federal Reserve, earnings will also be a big contributor to market sentiments.
Earnings reports are still sounding pessimistic, and data is still weaker than what investors are anticipating.
How much volatility this creates will be key to figuring out the rest of the year’s interest rate decisions from the Federal Reserve, which will give clues about how to play out the rest of the year in the markets.
*** I DO NOT OWN SHARES OF SPUU, TQQQ, BOIL, JPIE, BKLN, IEF, SKYY, IYG, CARZ & HERO AT THE TIME OF PUBLISHING THIS ARTICLE ***
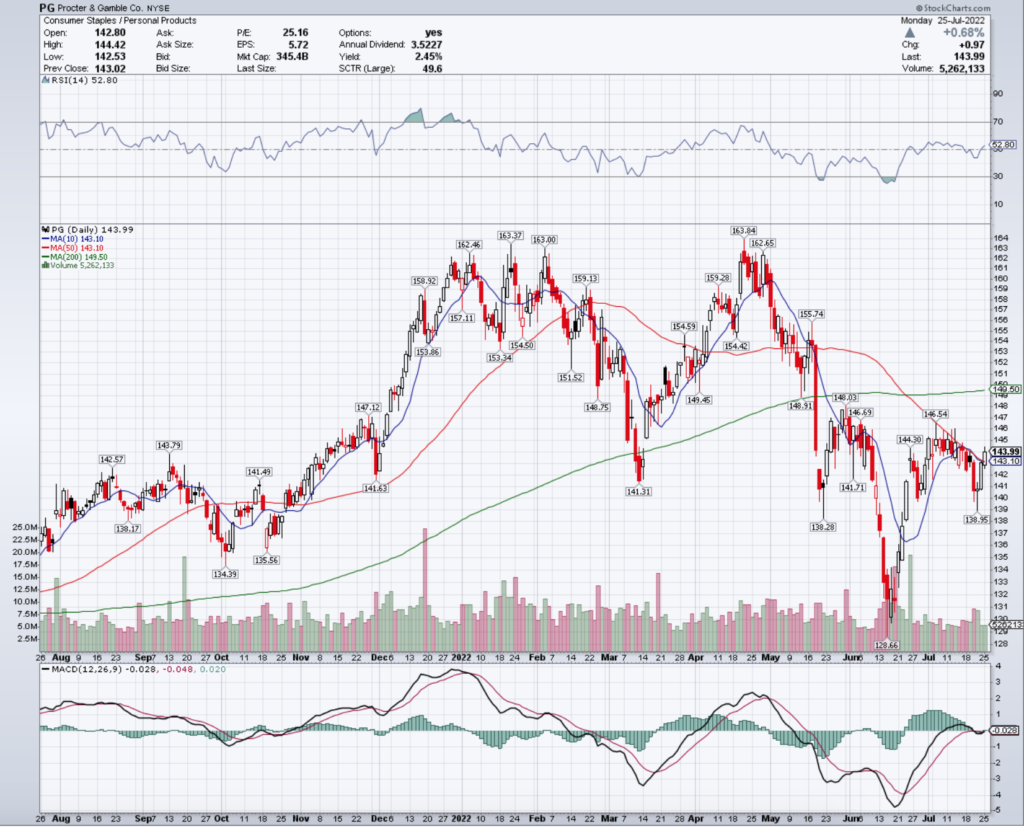
Yesterday, PG stock completed a bullish MACD crossover, breaking out & settling above both their 10 & 50 day moving averages.
Their recent momentum may be unsustainable though, with recent trading volumes being below average compared to the year prior & their RSI is neutral.
They will need to stay above the $142.57 & $143.79/share support levels, and will need to break above the $144.30/share resistance level to continue climbing higher.
Procter & Gamble Co. PG Stock As A Long-Term Investment
Long-term oriented investors will like PG stock’s 25 P/E (ttm), but will find their 7.69 P/B (mrq) to be too high.
They recently reported 7% Quarterly Revenue Growth Y-o-Y, with 2.6% Quarterly Earnings Growth Y-o-Y.
Their balance sheet will require a closer examination, with $8.53B of Total Cash (mrq) & $33.67B of Total Debt (mrq).
PG stock pays a 2.43% dividend yield, which may not be sustainable in the long-run, as their payout ratio is 60.83%.
65.9% of PG stock’s outstanding share float is owned by institutional investors.
Procter & Gamble Co. PG Stock As A Short-Term Trade Using Options
Short-term oriented traders can use options to profit from price movements in PG stock, while hedging against broader market volatility.
I am looking at the contracts with the 8/19 expiration date.
The $140, $142 & $141 call options are all in-the-money, listed from most to least liquid.
The $145, $144 & $147 puts are also in-the-money, with the former having more open interest than the latter two strikes.
Tying It All Together
Proctor & Gamble stock has many interesting characteristics that traders & investors are sure to like.
Investors will like their recent growth & their dividend yield, but may want to research their balance sheet further to find more clues about how sustainable the yield is.
Traders will like their recent market performance amid volatility, as well as the liquidity of their options.
All-in-all, PG stock is worth taking a closer look into to see how it fits into your portfolio strategy.
*** I DO NOT OWN SHARES OF PG STOCK AT THE TIME OF PUBLISHING THIS ARTICLE ***