Tractor Supply Co. stock trades under the ticker TSCO & has shown recent bullishness that traders & investors should take a closer look into.
TSCO stock closed at $194.90/share on 8/11/2022.
Tractor Supply Co. TSCO Stock’s Technical Performance Broken Down
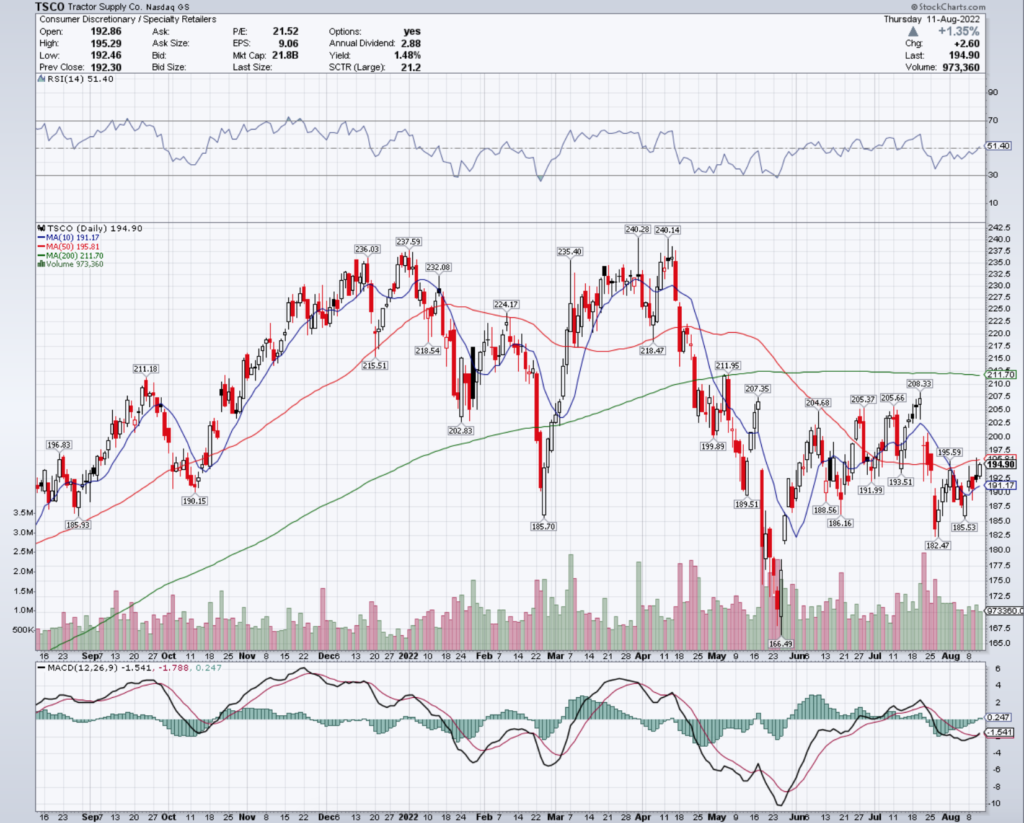
TSCO Stock Price: $194.90
10 Day Moving Average: $191.17
50 Day Moving Average: $195.81
200 Day Moving Average: $211.70
RSI: 51.4
MACD: -1.541
Yesterday, TSCO stock completed a bullish MACD crossover, closing just below its 50 day moving average.
Recent volumes have been average to above average compared to the year prior & their RSI is neutral, signaling that there may be more bullishness to come in the near-term.
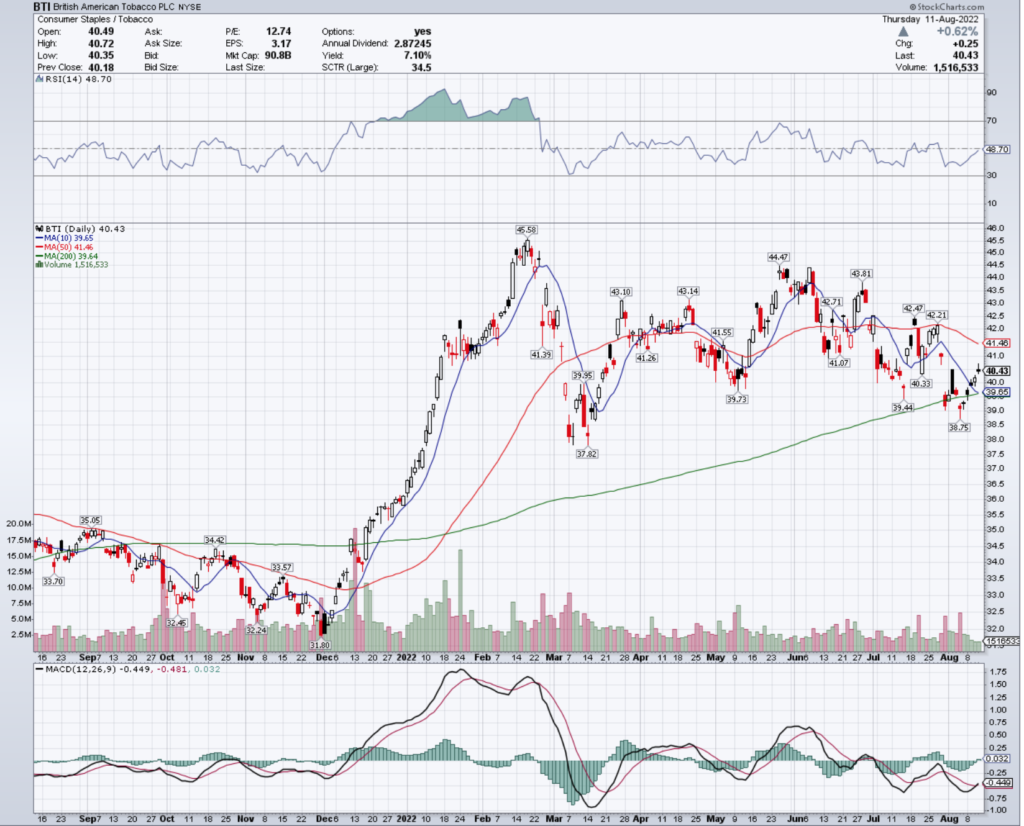
BTI stock has support at the $193.51 & $191.99/share price level, as they try to break out above the $195.59 & $199.89/share resistance levels.
Tractor Supply Co. TSCO Stock As A Long-Term Investment
Long-term oriented investors will like TSCO stock’s 21.25 P/E (ttm), but will find their 11.15 P/B (mrq) to be too rich.
They recently reported 8.4% Quarterly Revenue Growth Y-o-Y, with 7.1% Quarterly Earnings Growth Y-o-Y.
Their balance sheet will require a more thorough examination, with $530.82M of Total Cash (mrq) & $3.93B of Total Debt (mrq).
TSCO stock pays a 1.5% dividend yield, which appears to be sustainable in the long-run, as their payout ratio is 31.82%.
86.8% of TSCO stock’s outstanding share float is owned by institutional investors.
Tractor Supply Co. TSCO Stock As A Short-Term Trade Using Options
Short-term focused traders can use options to profit from price movements in TSCO stock, while protecting their portfolio from market volatility.
I am looking at the contracts with the 8/19 expiration date.
The $190, $192.50 & $185 call options are all in-the-money, listed from highest to lowest level of open interest.
The $195, $200 & $197.50 puts are also all in-the-money, listed from the most to least liquid.
Tying It All Together
TSCO stock has many interest attributes that traders & investors are sure to find appealing.
Investors will like their P/E (ttm) & dividend yield, but may want to review their balance sheet further before making an investment.
Traders will like their current technical set up, but may be disappointed by how liquid their options are.
All-in-all, it is worth taking a closer look into how TSCO stock fits into your portfolio strategy.
*** I DO NOT OWN SHARES OF TSCO STOCK AT THE TIME OF PUBLISHING THIS ARTICLE ***