The VIX closed at 20.51, indicating an implied one day move of +/-1.29% & an implied one month move of +/-5.93% for the S&P 500.
Highest Technical Rated S&P 500 Components Per 3/17/2025’s Close:
1 – PLTR
2 – GILD
3 – PM
4 – PGR
5 – T
6 – EQT
7 – ETR
8 – VRSN
9 – INTC
10 – GL
Lowest Technical Rated S&P 500 Components Per 3/17/2025’s Close:
1 – DECK
2 – MRNA
3 – FSLR
4 – CE
5 – TER
6 – ON
7 – TFX
8 – TGT
9 – TSLA
10 – HPE
Highest Volume Rated S&P 500 Components Per 3/17/2025’s Close:
1 – DFS
2 – COF
3 – INCY
4 – CCI
5 – JNPR
6 – DUK
7 – EVRG
8 – NFLX
9 – ALL
10 – NCLH
Lowest Volume Rated S&P 500 Components Per 3/17/2025’s Close:
1 – HSY
2 – PARA
3 – SMCI
4 – KEYS
5 – MRNA
6 – AME
7 – YUM
8 – TPL
9 – MTCH
10 – IP
Highest Technical Rated ETFs Per 3/17/2025’s Close:
1 – BABX
2 – YINN
3 – XPP
4 – CWEB
5 – JNUG
6 – KTEC
7 – NUGT
8 – SETH
9 – BOIL
10 – ETHD
Lowest Technical Rated ETFs Per 3/17/2025’s Close:
1 – MSOX
2 – YANG
3 – CONL
4 – TSLL
5 – TSLT
6 – TSLR
7 – KOLD
8 – BCHG
9 – FXP
10 – LTCN
Highest Volume Rated ETFs Per 3/17/2025’s Close:
1 – TOTR
2 – SNPV
3 – ABLG
4 – FUSI
5 – GDIV
6 – LFAN
7 – SYNB
8 – GMUB
9 – FVAL
10 – SHUS
Lowest Volume Rated ETFs Per 3/17/2025’s Close:
1 – RGEF
2 – AUGT
3 – USCA
4 – OVLH
5 – IJUN
6 – MYLD
7 – NVBU
8 – HECO
9 – IQSM
10 – XUSP
Highest Technical Rated General Stocks Per 3/17/2025’s Close:
1 – RGC
2 – YOSH
3 – ANTE
4 – CMRX
5 – QBTS
6 – GTII
7 – GV
8 – RAASY
9 – LEMIF
10 – GRRR
Lowest Technical Rated General Stocks Per 3/17/2025’s Close:
1 – ACON
2 – MULN
3 – STBX
4 – CLEU
5 – ARAT
6 – APDN
7 – RNAZ
8 – KBSX
9 – CMCT
10 – CYN
Highest Volume Rated General Stocks Per 3/17/2025’s Close:
1 – GLMD
2 – NVFY
3 – SLG
4 – MGRM
5 – ANTE
6 – NAOV
7 – HYPR
8 – LXEH
9 – CISO
10 – ELPC
Lowest Volume Rated General Stocks Per 3/17/2025’s Close:
1 – CTXXF
2 – ROKRF
3 – DBIN
4 – DXYN
5 – BTSGU
6 – BDCO
7 – AHOTF
8 – GECSF
9 – GASXF
10 – FRGT
*** THE LIST ABOVE IS STRICTLY FOR INFORMATIONAL PURPOSES – I MAY OR MAY NOT HAVE OR INITIATE A LONG, SHORT, OR LONG/SHORT POSITION IN ANY NAME ABOVE AT ANY TIME ***
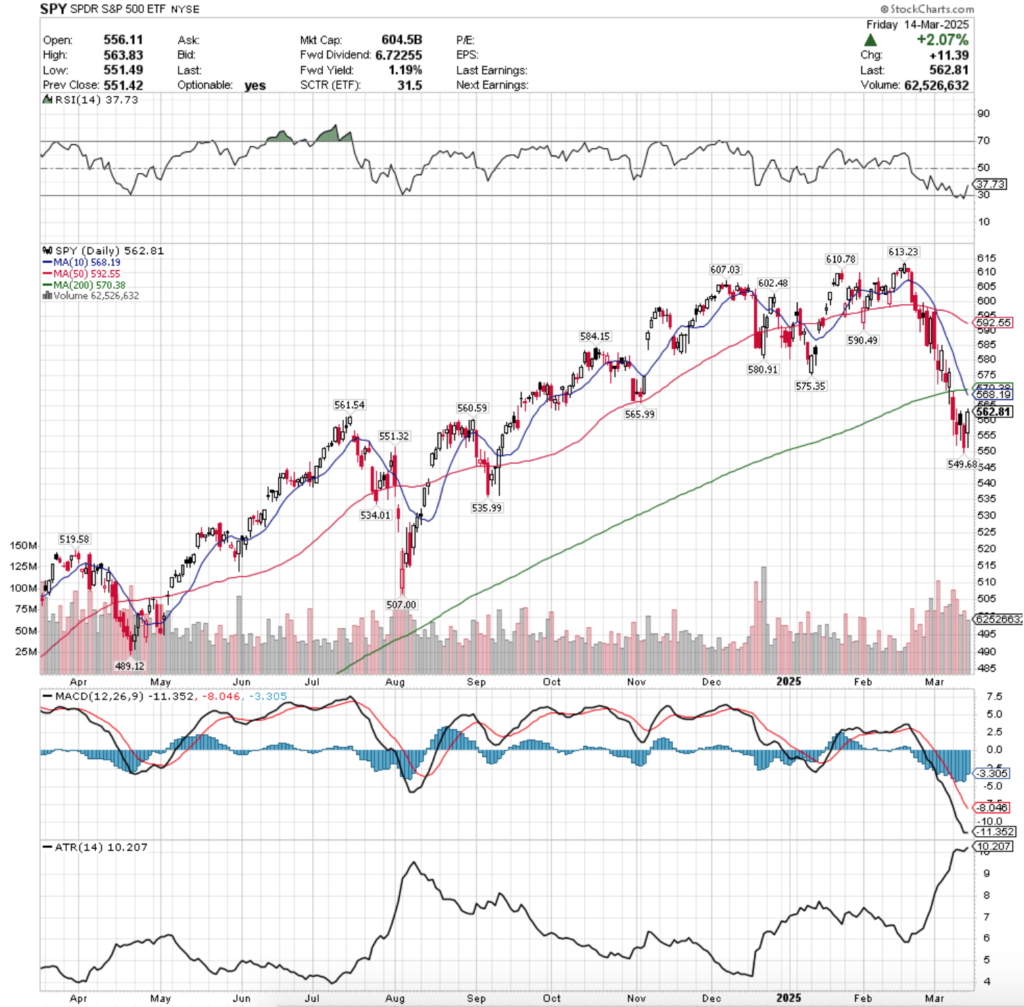
SPY, the SPDR S&P 500 ETF fell -2.28% last week, while the VIX closed at 21.77 at the end of Friday’s session, indicating an implied one day move of +/-1.37% & a one month move of +/-6.29%.
SPY ETF – SPDR S&P 500 ETF’s Technical Performance Over The Past Year
Their RSI has bounced back above the oversold 30 level after Friday’s advancing session & sits currently at 37.73, while their MACD is still bearish but has flattened out & is moving towards the signal line.
Volumes were +48.21% above the previous year’s average level (78,752,000 vs. 53,134,498), as for the second straight week sellers have snapped the weak volume of the past year.
Week-over-week volume declined -4.28%, but that isn’t reason to start celebrating just yet (last week’s note).
Monday kicked the week off on a bearish note, as a gap down open below the 200 day moving average was unable to break back above its resistance on the week’s highest volume session.
While the decline was unable to break down the $555/share mark, it showed that there was plenty of interest for prices to be pushed down to test it later in the week.
Tuesday saw the declines continue with another gap lower on the open on a high wave candle that temporarily broke down below the $555/share mark, while also attempting to test but falling short of the $565/share level.
Wednesday the sellers took a short breather & the day resulted in an advancing session, however it should be noted that the session began on a gap up, before breaking down below the $555/share price level & recovering to close below its opening price at $558.87/share.
Wednesday’s volume would be the second lowest of the week, which is important to note as the only day with less volume was Friday, the other advancing session of the week.
Thursday opened on another gap lower, before testing all the way down to below the $550/share price level, but was able to close above the session’s low of $549.68/share.
Friday the week wound down on a positive note, but under the hood there was still signs of trouble.
Firstly, the ten day moving average bearishly crossed through the 200 DMA & secondly the volume of the session in relation to the day’s wide trading range were also cause for concern.
Friday’s session managed to advance +2.07%, which brought the total declines of the week up to -2.28%, which does not inspire much confidence.
For the week ahead, any upside movement will require strong volume with it in order to prove sustainable & inspire confidence to the upside, especially given how steep the declines of the past month have been.
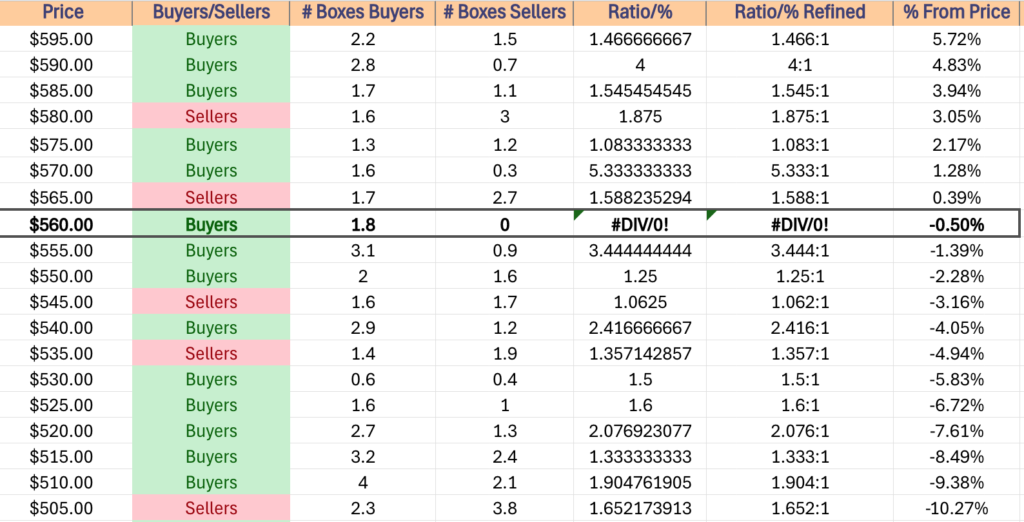
Historically SPY’s next two resistance levels occur in a Seller dominated price zone (1.59:1), which will make it even more imperative to have strong upside volume in the near-term to see any advances that are sustainable.
There’s a chance of a consolidation range within the body of Friday’s candle as we head towards Wednesday’s FOMC Interest Rate announcement, which would provide some seller volume in the price zone that currently is Buyers 1.8:0*
Should we get that consolidation & lackluster advancing volume the $549.68/share price level will be a key place to keep your eyes on, as it’s currently the support level that was most recently hit in the past week.
It also resides in a Seller zone, indicating that if it gets retested & broken through that there will be further declines on the horizon, as the next support level lives -2.49% below it & also happens to be within a Seller zone, along with the next lowest support level at $534.01.
If these break down the next support level is -2.7% lower at $519.58/share.
SPY has support at the $561.54 (Volume Sentiment: Buyers, 1.8:0*), $560.59 (Volume Sentiment: Buyers, 1.8:0*), $551.32 (Volume Sentiment: Buyers, 1.25:1) & $549.68/share (Volume Sentiment: Sellers, 1.06:1) price levels, with resistance at the $565.99 (Volume Sentiment: Sellers, 1.59:1), $568.19 (10 Day Moving Average, Volume Sentiment: Sellers, 1.59:1), $570.38 (200 Day Moving Average, Volume Sentiment: Buyers, 5.33:1) & $575.35/share (Volume Sentiment: Buyers, 1.08:1) price levels.
SPY ETF’s Price Level:Volume Sentiment Over The Past ~2-3 Years
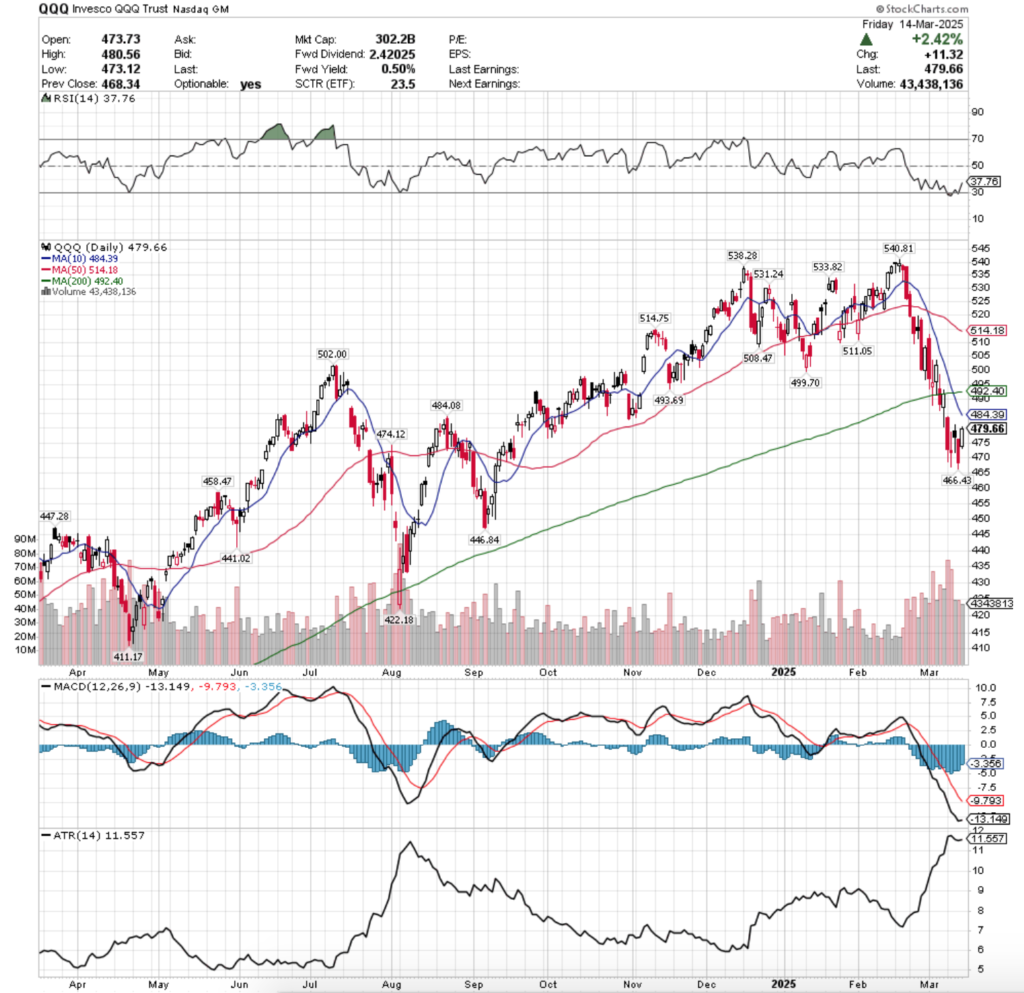
QQQ ETF – Invesco QQQ Trust ETF’s Technical Performance Over The Past Year
Their RSI has also just crossed back above the oversold 30 level & sits at 37.76, while their MACD is also bearish, but has flattened out & is moving towards the signal line.
Volumes were +60.5% above the prior year’s average level (56,504,000 vs. 35,204,137), and were +5.17% above last week’s QQQ volume, which should be approached with caution in the coming week.
QQQ’s week resembled SPY’s, as it kicked off with a gap lower on the week’s highest volume on Monday, with the $470/share level temporarily broken down through intraday.
Tuesday opened on a gap lower & resulted in a high wave candle that broke down through the $470/share level to the downside, and fell just short of the $480/share level to the upside, closing the day as a spinning top candle.
This symbol of uncertainty combined with the week’s second highest volume on a declining session is not reason to inspire confidence in the near-term.
Wednesday saw a gap up open that briefly crossed above the $480/share level, but that quickly deflated to dip beneath the $475/share price level before finally closing lower than it opened at $476.92.
While volumes were still eclipsing the rest of 2025’s levels, Wednesday & onward was very tame for QQQ compared to Monday & Tuesday.
Thursday the declines continued, as the day opened with a gap down & the declines continued to below the $470/share mark.
Friday offered a +2.42% advance, helping trim the week’s total losses to -2.47%.
Much like SPY, the only way that there will be a sustainable recovery to the upside for QQQ will require there to be a major increase in advancing volume & any up days that don’t show that should be viewed with a suspicious eye.
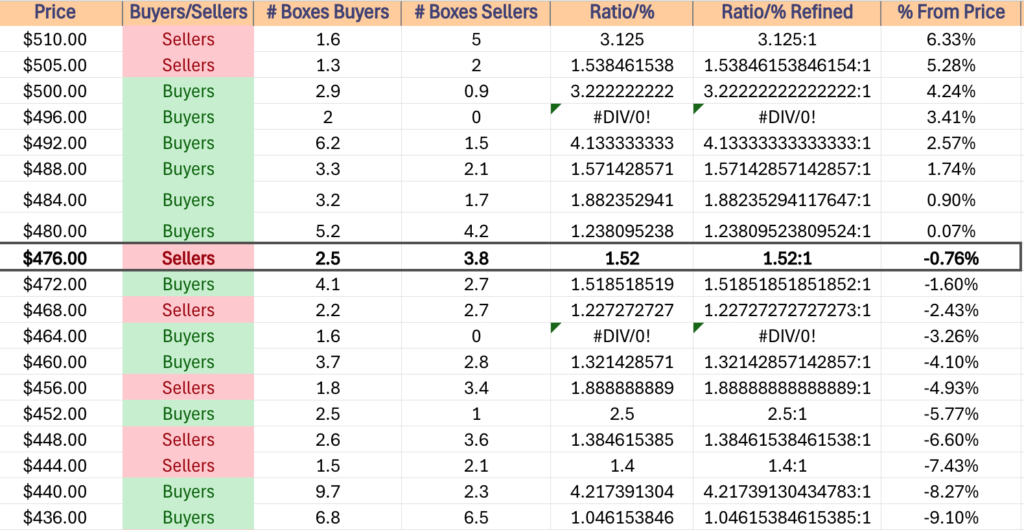
This is especially true given that Friday’s closing price falls in a Seller dominated zone at a ratio of 1.52:1, so an increase in volume will be needed to trump historic Seller senitment.
This week there will likely be a consolidation within the price range of the latter portion of last week, as the 10 day moving average catches up to QQQ’s price, which may then lead to oscillation around the short-term trend line.
The downside case for QQQ is not a particularly rosy picture, as while there has been plenty of Buyer support at their next three support levels, they’ve also been relatively untested & the fourth support level requires a -6.6%+ drop before it can be tested, where it enjoys a Seller:Buyer ratio of 1.4:1.
Should this occur, it will be time to focus on the $441.02/share support level, where Buyers have historically been victorious at a clip of 4.22:1.
QQQ has support at the $474.12 (Volume Sentiment: Buyers, 1.52:1), $466.43 (Volume Sentiment: Buyers, 1.6:0*), $458.47 (Volume Sentiment: Sellers, 1.89:1) & $447.28/share (Volume Sentiment: Sellers, 1.4:1) price levels, with resistance at the $484.08 (Volume Sentiment: Buyers, 1.88:1), $484.39 (10 Day Moving Average, Volume Sentiment: Buyers, 1.88:1), $492.40 (10 Day Moving Average, Volume Sentiment: Buyers, 4.13:1) & $493.69/share (Volume Sentiment: Buyers, 4.13:1) price levels.
QQQ ETF’s Price Level:Volume Sentiment Over The Past ~2-3 Years
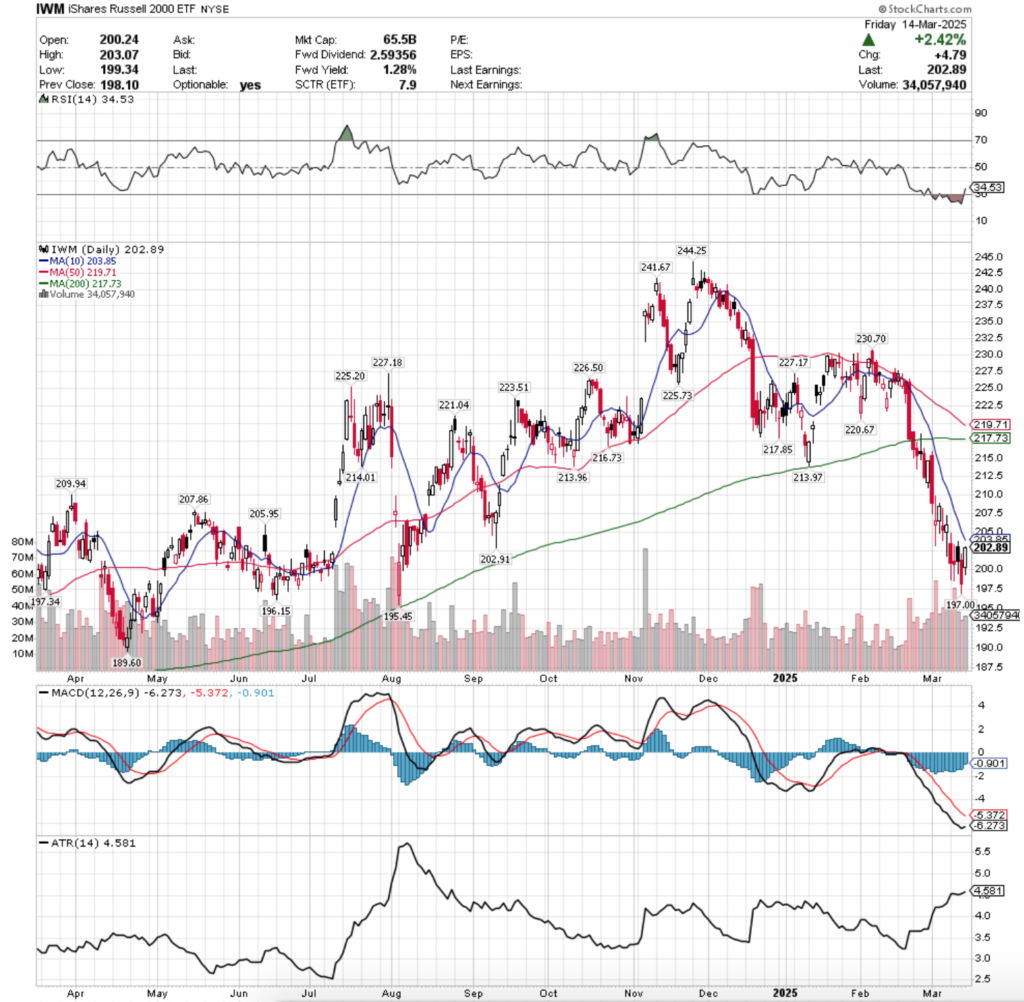
IWM, the iShares Russell 2000 ETF shed only -1.49% last week, as the small cap index outperformed the rest of the pack after three months of steady declines.
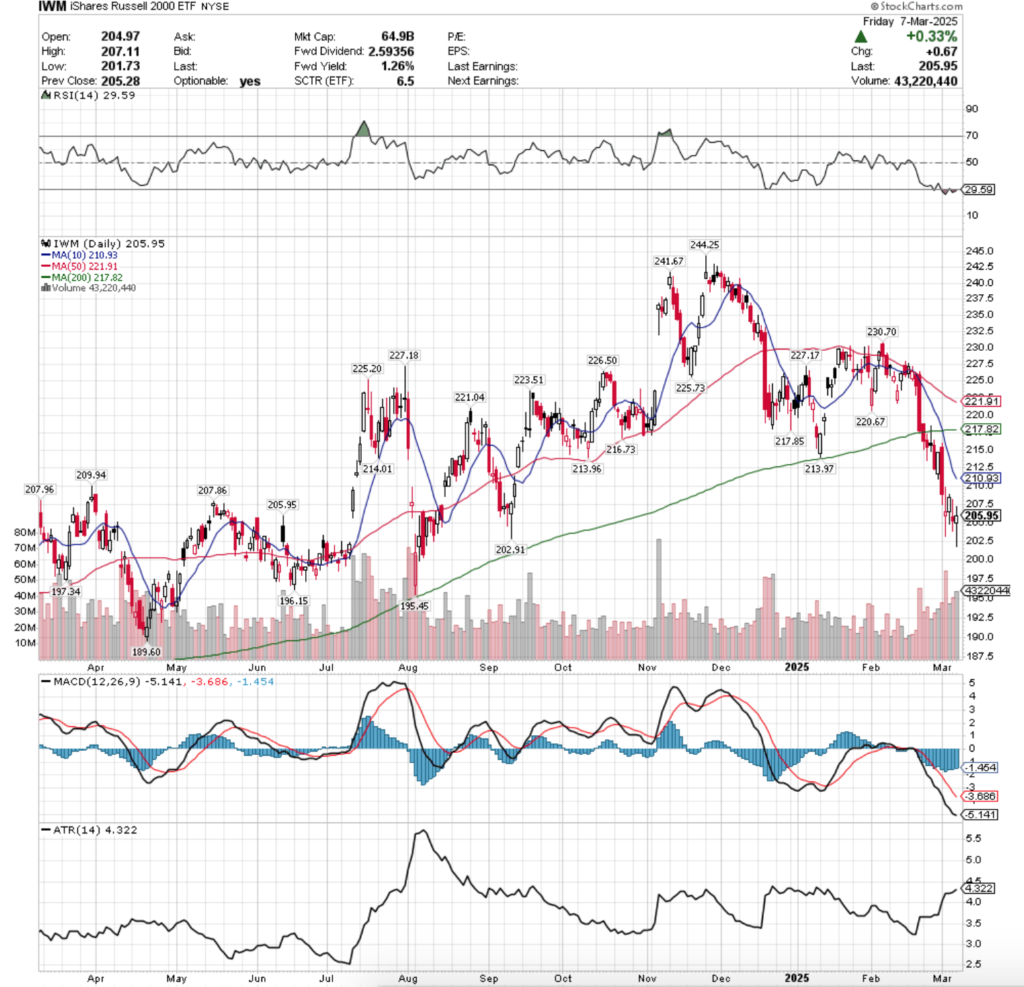
IWM ETF – iShares Russell 2000 ETF’s Technical Performance Over The Past Year
Their RSI has also just peeked its head back up above the oversold 30 mark & is currently at 34.53, while their MACD is bearish, but moving towards the signal line following the range of the past week that IWM stayed within.
Volumes were +33.63% above the previous year’s average level (38,652,000 vs. 28,924,779), which doesn’t inspire much confidence, given that Friday’s +2.42% session brought the total week’s losses to -1.49%.
Monday kicked the week off on a gap down for IWM on the week’s second highest volume of the week, where the upper shadow of the day’s candle couldn’t break above the $205/share level, while the lower range of the day indicated that there was appetite below the $200/share level.
Tuesday also did not inspire confidence for IWM, as the week’s highest volume session resulted in a high wave spinning top candle, where the day’s high did not break above Monday’s opening price & the day’s low almost matched Monday’s low, all the while the day closed as a declining day.
Wednesday opened on a gap up, before retreating to temporarily trade below $200/share & ultimately closed lower than it opened, indicating that there was still a lot of negative sentiment in the market for the small cap index.
Thursday provided the week’s weakest volume, but also provided the local downside support level at $197/share based on the day’s low, while Friday managed to close out the day for an advancing session.
The coming week will be interesting for IWM, as any type of advance will require an uptick in volume to be taken seriously & should be viewed skeptically if there is no volume improvement.
We will likely see some form of consolidation heading into mid-week, where the $197 support level gets retested & price oscillates around the 10 day moving average until we get a greater catalyst to the upside or downside.
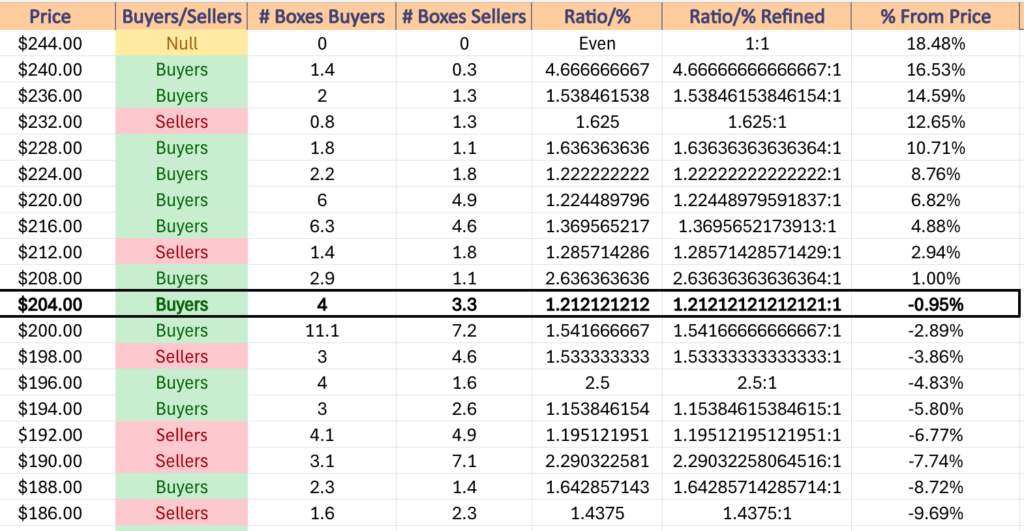
As for downside risks, IWM currently only has 5 support levels below Friday’s closing price on their one year chart, the lowest of which is $189.60/share.
What makes this significant is that the current support zone beneath IWM’s Friday close are the only 2 Buyer dominated zones that occur before historic Seller volume leads prices towards that retest.
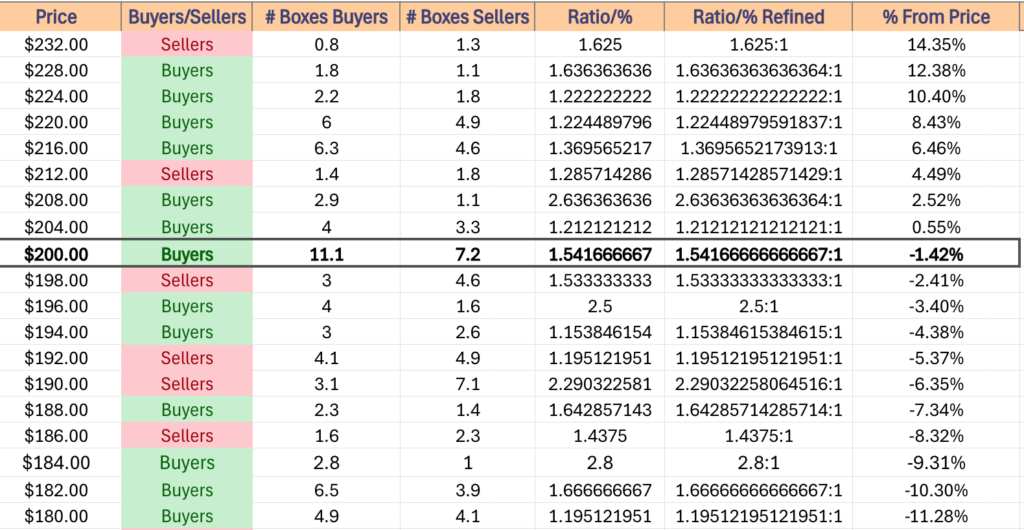
The table below will be important to review in the coming weeks with regards to IWM’s price movement.
IWM has support at the $197.34 (Volume Sentiment: Buyers, 2.5:1), $197 (Volume Sentiment: Buyers, 2.5:1), $196.15 (Volume Sentiment: Buyers, 2.5:1) & $195.45/share (Volume Sentiment: Buyers, 1.15:1) price levels, with resistance at the $202.91 (Volume Sentiment: Buyers, 1.54:1), $203.85 (10 Day Moving Average, Volume Sentiment: Buyers, 1.54:1), $205.95 (Volume Sentiment: Buyers, 1.21:1) & $207.86/share (Volume Sentiment: Buyers, 1.21:1) price levels.
IWM ETF’s Price Level:Volume Sentiment Over The Past ~2-3 Years
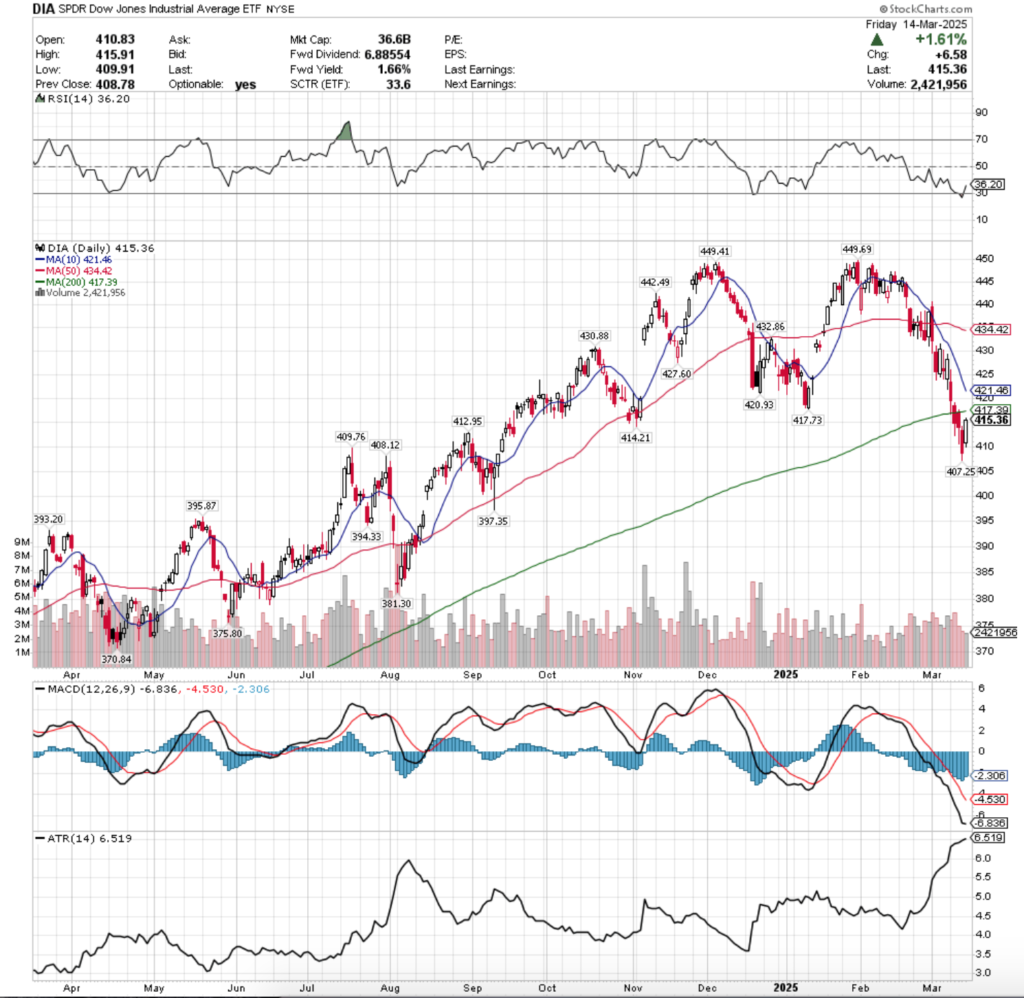
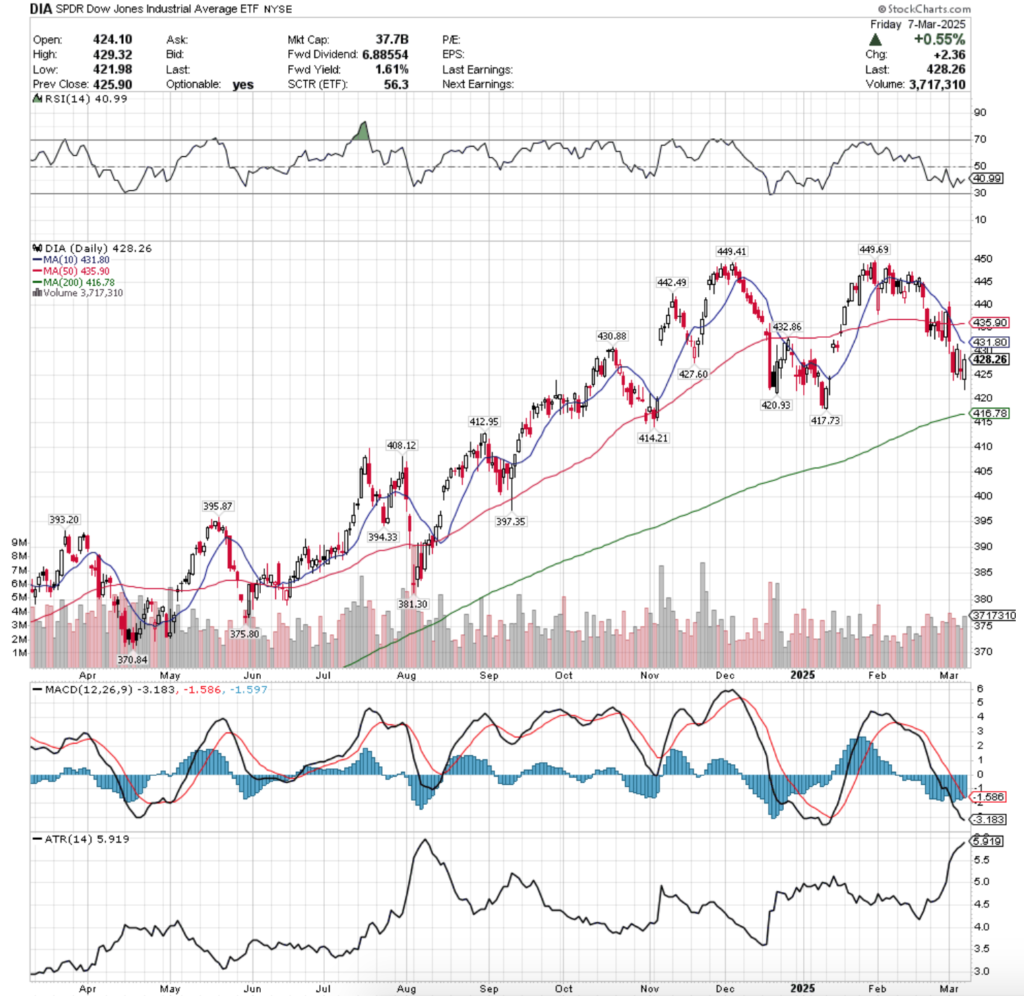
DIA ETF – SPDR Dow Jones Industrial Average ETF’s Technical Performance Over The Past Year
Their RSI has just came back from oversold territory & sits at 36.2, while their MACD is still bearish, but has flattened & may approach the signal line in the coming week.
Volumes were -5.56% lower than the previous year’s average (3,054,000 vs. 3,233,896), bucking the trend of higher volumes, despite losing the most on the week out of the major index ETFs.
While DIA has been the most resilient of the major index ETFs, the blue chip names have begun to show cracks as their long-term trend line broke down last week.
Monday DIA opened on a gap down, where the day’s high occurred above $425/share, but the day’s low went down to test the support of the 200 day moving average.
Tuesday the negative sentiment continued, as the highest volume session of the week opened on a gap lower & broke through the 200 DMA’s support & continued lower, closing below the $515/share mark.
Wednesday this trend continued, as DIA opened in-line with the 200 DMA, tried to poke its head out higher, but was rejected & broke down to approach the $410/share level & closed lower on the day.
Thursday opened on another gap down for the third of the week & declined all the way down to the new $407.25/share support level before recovering a little bit & closing at $413.95.
Friday’s +1.61% advance cut DIA’s weekly losses to -3.01%, indicating that there is still quite a bit of bearish sentiment in the markets right now.
Much like the aforementioned three indexes, DIA will require a spike in advancing volume in order to recover from the past few weeks in a sustainable manner.
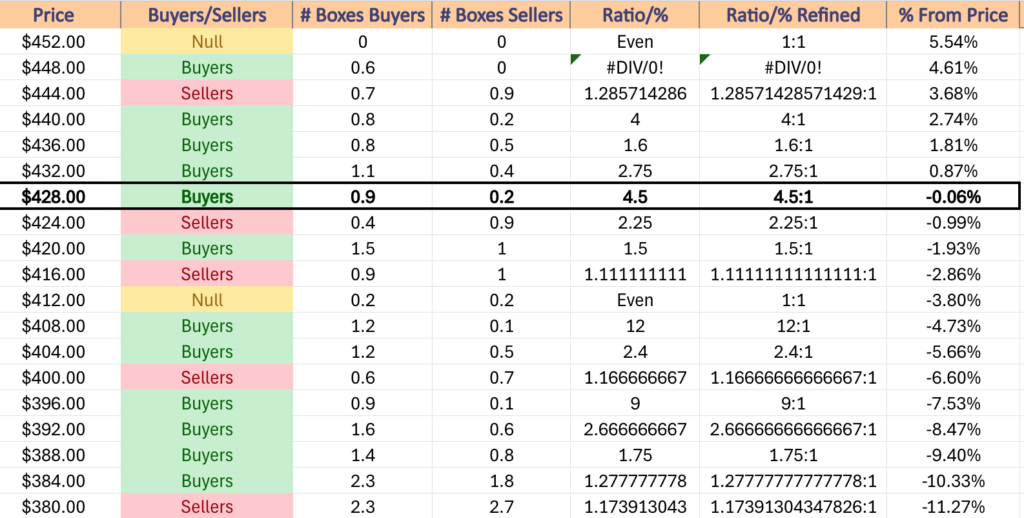
They’re also in a unique position, in that their current price level is in a price zone where buyers & sellers have met at a ratio of 1:1 in the last 4-5 years, but their next two resistance levels occur in a zone that has gone to the sellers at a rate of 1.1:1.
With the 10 day moving average fast approaching the 200 DMA there is still some downside pressure on DIA’s price, but it seems likely that there will be at least a short-term consolidation that oscillates between the $407.25/share mark & the 200 day moving average.
Another area of worry for DIA is in the event that their prices do break down, as the $408-411.99/share zone has seen limited downside volume & that ratio will likely be diluted further down from 12:1.
Should it break down & the $407.25/share support level can’t hold up, there isn’t a local support level until $397.35/share, which is -2.43% lower & enters another relatively overly bullish ratio zone.
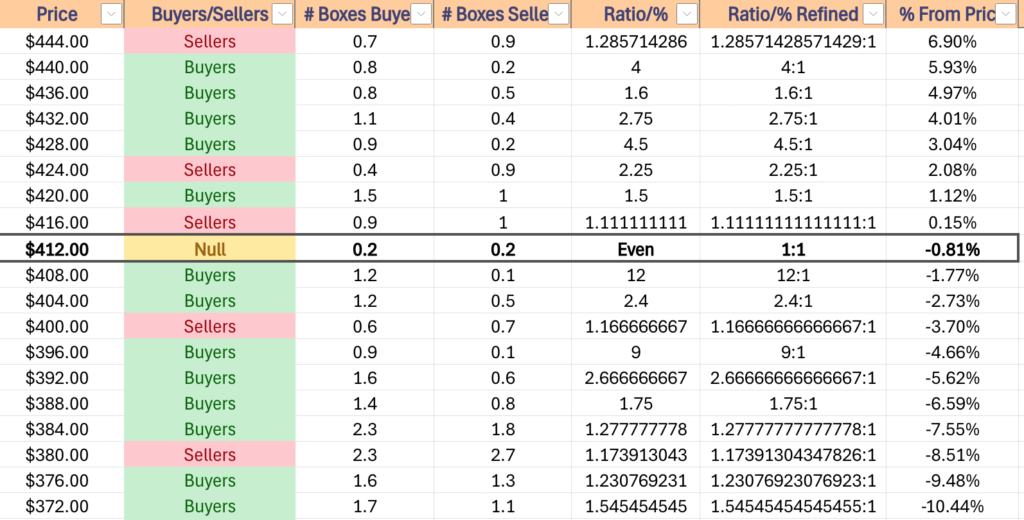
The table below will be valuable in the coming week(s) to gain insight into DIA’s potential price movements based on historic volume data.
DIA has support at the $414.21 (Volume Sentiment: Even, 1:1), $412.95 (Volume Sentiment: Even, 1:1), $409.76 (Volume Sentiment: Buyers, 12:1) & $408.12/share (Volume Sentiment: Buyers, 12:1) price levels, with resistance at the $417.39 (200 Day Moving Average, Volume Sentiment: Sellers, 1.11:1), $417.73 (Volume Sentiment: Sellers, 1.11:1), $420.93 (Volume Sentiment: Buyers, 1.5:1) & $421.46/share (10 Day Moving Average, Volume Sentiment: Buyers, 1.5:1) price levels.
DIA ETF’s Price Level:Volume Sentiment Over The Past ~4-5 Years
The Week Ahead
Monday the week kicks off with U.S. Retail Sales, Retail Sales minus Autos & Empire State Manufacturing Survey data at 8:30 am, followed by Business Inventories & Home Builder Confidence Index data at 10 am.
Science Applications & Textron report earnings before Monday’s opening bell, with Getty Images & Open Lending scheduled to report after the session’s close.
Housing Starts, Building Permits, Import Price Index & Import Price Index minus Fuel data are all released at 8:30 am, before Industrial Production & Capacity Utilization data is released at 9:15 am.
Tuesday morning’s earnings calls include HUYA, KE Holdings & Tencent Music, followed by Maravai LifeSciences & ZTO Express after the closing bell.
Wednesday afternoon features the FOMC Interest-Rate Decision at 2pm & Fed Chair Powell’s Press Conference at 2:30 pm.
General Mills, Kingsoft Cloud, Ollie’s Bargain Outlet, Signet Jewelers & Sportradar Group report Wednesday morning before the session opens, followed by Super Micro Computer, Five Below & Worthington Steel after the session’s close.
Initial Jobless Claims & Philadelphia Fed Manufacturing Survey data are released Thursday morning at 8:30 am, followed by Existing Home Sales & U.S. Leading Economic Indicators data at 10 am.
Thursday morning’s earnings calls include Academy Sports + Outdoors, Commercial Metals, Darden Restaurants, Designer Brands, FactSet, Jabil, Shoe Carnival & ZEEKR Intelligent, with FedEx, Lennar, KinderCare Learning Companies, Luminar Technologies, Micron, NIKE & Torrid reporting after the closing bell.
Friday features no major economic data announcements & NIO & Carnival will report earnings before the opening bell.
See you back here next week!
*** I DO NOT OWN SHARES OR OPTIONS CONTRACT POSITIONS IN SPY, QQQ, IWM OR DIA AT THE TIME OF PUBLISHING THIS ARTICLE ***
The VIX closed at 24.66, indicating an implied one day move of +/-1.55% & an implied one month move of +/-7.13% for the S&P 500.
Highest Technical Rated S&P 500 Components Per 3/13/2025’s Close:
1 – PLTR
2 – GILD
3 – PM
4 – TMUS
5 – CVS
6 – T
7 – VRSN
8 – CME
9 – ABBV
10 – ETR
Lowest Technical Rated S&P 500 Components Per 3/13/2025’s Close:
1 – CE
2 – TER
3 – DECK
4 – MRNA
5 – HPE
6 – ON
7 – FSLR
8 – TFX
9 – CZR
10 – ALGN
Highest Volume Rated S&P 500 Components Per 3/13/2025’s Close:
1 – ADBE
2 – ULTA
3 – HLT
4 – INTC
5 – PCAR
6 – LYV
7 – DG
8 – HD
9 – CINF
10 – ISRG
Lowest Volume Rated S&P 500 Components Per 3/13/2025’s Close:
1 – STX
2 – DELL
3 – PCG
4 – MPWR
5 – ENPH
6 – MNST
7 – DHR
8 – AEP
9 – FOX
10 – HCA
Highest Technical Rated ETFs Per 3/13/2025’s Close:
1 – BABX
2 – YINN
3 – ETHD
4 – ETQ
5 – SETH
6 – XPP
7 – HIBS
8 – TZA
9 – BOIL
10 – SRTY
Lowest Technical Rated ETFs Per 3/13/2025’s Close:
1 – MSOX
2 – CONL
3 – TSLL
4 – TSLT
5 – TSLR
6 – YANG
7 – BCHG
8 – KOLD
9 – LTCN
10 – AMDL
Highest Volume Rated ETFs Per 3/13/2025’s Close:
1 – MVAL
2 – ZSB
3 – NUAG
4 – MAGG
5 – FINE
6 – GGM
7 – AVLC
8 – KMLM
9 – LIAB
10 – AVDS
Lowest Volume Rated ETFs Per 3/13/2025’s Close:
1 – FDCE
2 – FDGR
3 – GSID
4 – RGEF
5 – FDVL
6 – TBFC
7 – CPNS
8 – EQLS
9 – SHRT
10 – JMID
Highest Technical Rated General Stocks Per 3/13/2025’s Close:
1 – CMRX
2 – YOSH
3 – RGC
4 – BLIAQ
5 – RAASY
6 – GV
7 – PWRMF
8 – OCFT
9 – GRRR
10 – CPIX
Lowest Technical Rated General Stocks Per 3/13/2025’s Close:
1 – ACON
2 – ARAT
3 – STBX
4 – MULN
5 – CLEU
6 – NOVA
7 – RNAZ
8 – ASBP
9 – CYCU
10 – WHLR
Highest Volume Rated General Stocks Per 3/13/2025’s Close:
1 – RGC
2 – TWO
3 – LFWD
4 – CCLD
5 – BON
6 – CSCI
7 – NSA
8 – TROO
9 – HPH
10 – SNES
Lowest Volume Rated General Stocks Per 3/13/2025’s Close:
1 – VASO
2 – CTSDF
3 – NSRCF
4 – NCRA
5 – PMNT
6 – DTEGF
7 – NCL
8 – MHCUF
9 – INBP
10 – ENVB
*** THE LIST ABOVE IS STRICTLY FOR INFORMATIONAL PURPOSES – I MAY OR MAY NOT HAVE OR INITIATE A LONG, SHORT, OR LONG/SHORT POSITION IN ANY NAME ABOVE AT ANY TIME ***
The VIX closed at 24.23, indicating an implied one day move of +/-1.53% & an implied one month move of +/-7% for the S&P 500.
Highest Technical Rated S&P 500 Components Per 3/12/2025’s Close:
1 – PLTR
2 – GILD
3 – PM
4 – TPL
5 – VRSN
6 – TPR
7 – HWM
8 – ABBV
9 – TTWO
10 – TMUS
Lowest Technical Rated S&P 500 Components Per 3/12/2025’s Close:
1 – CE
2 – TER
3 – MRNA
4 – DECK
5 – ON
6 – HPE
7 – TFX
8 – FSLR
9 – WST
10 – CZR
Highest Volume Rated S&P 500 Components Per 3/12/2025’s Close:
1 – IVZ
2 – TECH
3 – TER
4 – TFC
5 – LUV
6 – VZ
7 – EVRG
8 – AXP
9 – HLT
10 – CHTR
Lowest Volume Rated S&P 500 Components Per 3/12/2025’s Close:
1 – EQT
2 – MTCH
3 – MRNA
4 – APD
5 – HII
6 – IP
7 – WBA
8 – EIX
9 – PCG
10 – CE
Highest Technical Rated ETFs Per 3/12/2025’s Close:
1 – BABX
2 – YINN
3 – ETHD
4 – ETQ
5 – SETH
6 – BOIL
7 – XPP
8 – KTEC
9 – CWEB
10 – TZA
Lowest Technical Rated ETFs Per 3/12/2025’s Close:
1 – MSOX
2 – CONL
3 – YANG
4 – TSLL
5 – TSLT
6 – TSLR
7 – KOLD
8 – SOXL
9 – LTCN
10 – BCHG
Highest Volume Rated ETFs Per 3/12/2025’s Close:
1 – LFAN
2 – THYF
3 – IVVB
4 – FLGV
5 – PAB
6 – IXP
7 – TBFC
8 – HYXF
9 – LGRO
10 – ISCG
Lowest Volume Rated ETFs Per 3/12/2025’s Close:
1 – ZTWO
2 – SEPW
3 – AUGT
4 – PSCQ
5 – GGUS
6 – GSFP
7 – SHRT
8 – SIXL
9 – RGEF
10 – BCIM
Highest Technical Rated General Stocks Per 3/12/2025’s Close:
1 – CMRX
2 – GTII
3 – GV
4 – YOSH
5 – RAASY
6 – GRRR
7 – PWRMF
8 – OCFT
9 – HSAI
10 – ZNOG
Lowest Technical Rated General Stocks Per 3/12/2025’s Close:
1 – ACON
2 – STBX
3 – CLEU
4 – MULN
5 – NOVA
6 – CYN
7 – WHLR
8 – NVNI
9 – SPGC
10 – CYCU
Highest Volume Rated General Stocks Per 3/12/2025’s Close:
1 – CRVO
2 – SLG
3 – OUT
4 – AREB
5 – STI
6 – VSTE
7 – OPRX
8 – AIEV
9 – UNIT
10 – ZYXI
Lowest Volume Rated General Stocks Per 3/12/2025’s Close:
1 – KRKR
2 – SCND
3 – FMCXF
4 – CRECF
5 – NSFDF
6 – SPPL
7 – CYAN
8 – TCTM
9 – PFLC
10 – ENVB
*** THE LIST ABOVE IS STRICTLY FOR INFORMATIONAL PURPOSES – I MAY OR MAY NOT HAVE OR INITIATE A LONG, SHORT, OR LONG/SHORT POSITION IN ANY NAME ABOVE AT ANY TIME ***
SPY, the SPDR S&P 500 ETF fell -3.07% last week, while the VIX closed out at 23.37, indicating an implied one day move of +/-1.47% & an implied one month move of +/-6.75%.
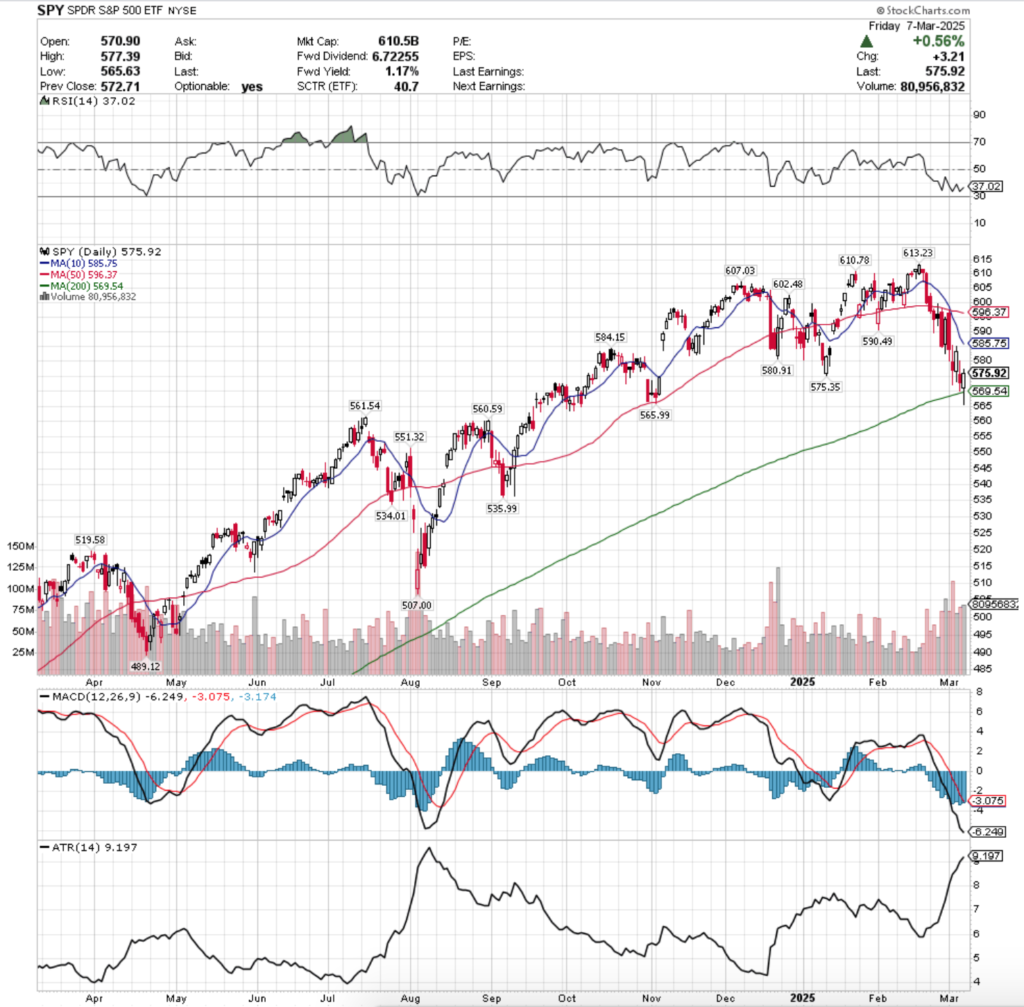
SPY ETF – SPDR S&P 500 ETF’s Technical Performance Over The Past Year
Their RSI is currently at 37.02, while their MACD is still in bearish decline, which will make for an interest week as their 200 day moving average is just -1.11% below Friday’s closing price.
Volumes were +54.34% above the previous year’s average level (82,276,000 vs. 53,307,400), indicating that there is a bit of nervous energy & bearishness as people are jumping out of the pool in droves.
It’s worth noting that on 3/17/2024 SPY’s prior year’s average volume was 78,989,814, so this week’s average volume for the prior year eclipses that by +4.16%, which is an incredibly bearish signal given how the current average prior year’s volume for this week is -32.51% lower than from 51-weeks ago (note here).
Monday the week kicked off with a rather bearish set up, as SPY opened higher, tested the 10 & 50 day moving average’s resistance, which were crossing over bearishly, before dropping to form a bearish engulfing pattern with Friday’s candle, setting the stage for further declines into the week.
Tuesday opened on a gap down, tested higher to above Monday’s close, before puking lower to close the day red & based on the high wave candle’s lower shadow exposed a good deal of downside appetite, breaking below the $575/share mark.
There was a large tug of war going on that day, as the session had the week’s & 2025’s highest volume to date, but in the end the bears won.
Wednesday opened lower & again broke the $575/share mark temporarily, but was able to claw back higher to temporarily break above the $585/share mark, which proved unsustainable, but the session ended as a bullish engulfing pattern.
It’s worth noting that this came on the week’s lowest volume, which indicated that there was limited staying power & that it was likely just a head-fake to lure folks back into the markets after all of the selling of the prior 2-3 weeks.
Thursday opened on a gap lower, tested above the $580/share mark, but proved that the ship was still sinking as it proved unsustainable & the declines continued, briefly flirting with the support of the 200 day moving average, but recovering slightly to still close on a down day on the week’s third highest volume, signaling that the bulls were nowhere to be found.
Friday the week wound down on a bullish engulfing candle with the week’s second highest volume, but it again looked to be a head-fake, as the long-term trend line was broken through to the downside & the $565/share mark was approached, but not tested.
Per last week’s note, we saw the $575.35/share support line temporarily break down, which set the stage for the aforementioned trend test & the fact that it succeeded briefly indicates that there is questionable-to-shattered confidence in the market currently.
Another area of note is that the $570-574.99/share zone has been dominated by Buyers at a rate of 5.33:1 over the past ~2-3 years & yet the bulls were unable to defend the zone & it broke down temporarily.
As I am writing this (Monday morning as I was just OOO last week) the declines have continued per the open, and the high of the first 32 minutes of trading has not been able to break above the 200 DMA’s resistance.
The $565-$569.99/share zone has been dominated by Sellers at a rate of 1.59:1 in recent history, indicating that without some strong earnings results or a miracle from Wednesday’s CPI print or Thursday’s PPI print we will likely see further declines.
This is especially true given that the $560-564.99/share zone has seen limited downside tests & has been a Buyer zone at a rate of 1.8:0* & there has been a bit of momentum to the downside building up over the past few weeks.
The bullish case rests on SPY being able to break above the 200 DMA’s resistance & the $575.35/share mark, which will require a major catalyst & a large influx in advancing volume if it is to be sustainable, as currently there is a rather pessimistic outlook from the volume sentiment of SPY.
What is more likely to happen is that we either see a consolidation range established based around today’s close that will straddle & oscillate around the 200 DMA, or we see further breakdowns until their RSI crosses into oversold territory & a brief consolidation range forms as sellers take a breather.
Should that $560/share zone break down SPY will see a bit more trouble brewing, as despite there being 3.44:1 Buyers:Sellers for the $560.59/share support level, that breakdown leads to an elevator ride down with only one stop at $551.32/share to $535.99/share (an additional -2.78% decline) based on a lack of support levels in between, paired with weak Buyer sentiment along the way down.
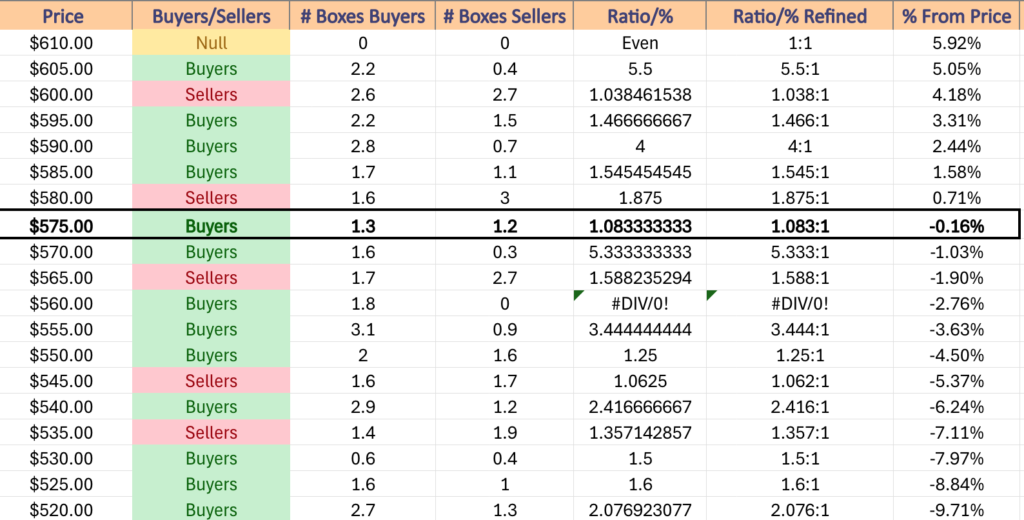
The table below highlights the volume sentiments for SPY over the past ~2-3 years & is useful for assessing the strength/weakness of support/resistance levels in the coming weeks as they’re tested.
SPY has support at the $575.35 (Volume Sentiment: Buyers 1.08:1), $569.54 (200 Day Moving Average, Volume Sentiment: Sellers, 1.59:1), $565.99 (Volume Sentiment: Sellers, 1.59:1) & $561.54/share (Volume Sentiment: Buyers, 1.8:0*) price levels, with resistance at the $580.91 (Volume Sentiment: Sellers, 1.88:1), $584.15 (Volume Sentiment: Sellers, 1.88:1), $585.75 (10 Day Moving Average, Volume Sentiment: Buyers, 1.55:1) & $590.49/share (Volume Sentiment: Buyers, 4:1) price levels.
SPY ETF’s Price Level:Volume Sentiment Over The Past ~2-3 Years
QQQ, the Invesco QQQ Trust ETF dropped -3.22% last week, as the tech-heavy index fell out of favor among investors as well.
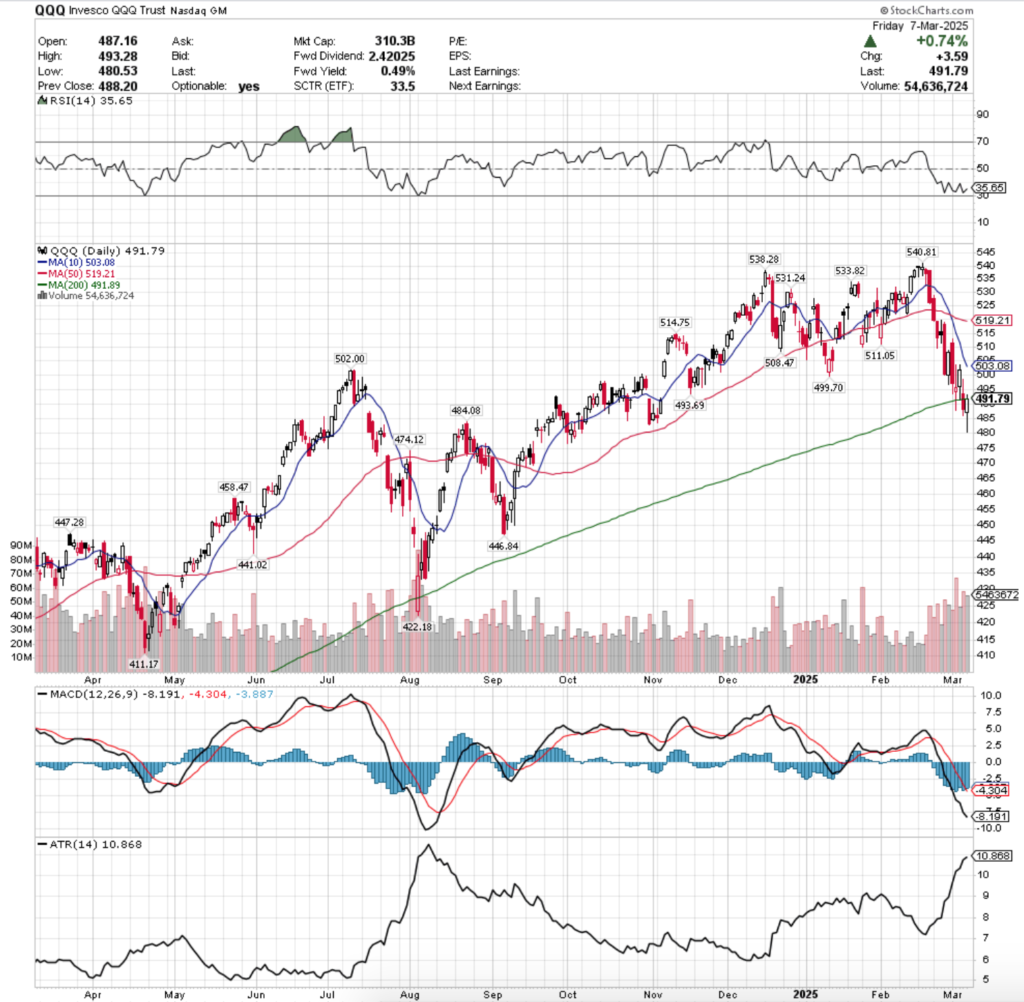
QQQ ETF – Invesco QQQ Trust ETF’s Technical Performance Over The Past Year
Their RSI is just above the oversold 30-mark & sits currently at 35.65, while their MACD is still in bearish decline with a histogram that isn’t painting a picture of it changing in the near-term.
Volumes were +52.34% above the prior year’s average level (53,728,000 vs. 35,269,360), which when compared to last year’s average level paints a similar eerie picture as SPY’s, given that this year’s average prior year’s volume is -29.86% lower than a year ago’s level of 50,281,257.
Monday opened similarly to SPY, as QQQ set a bearish engulfing pattern on Friday’s candle, with the $495/share mark being temporarily broken through to the downside.
Tuesday continued the bearish theme, as QQQ opened on a gap down, broke down through the 200 DMA’s support briefly, continued lower to break down the $490/share price level, before climbing back to close above it’s open, but still lower than Monday’s close.
The high wave candle also showed some temporary upside appetite too, but in the end the week’s highest volume session went to the bears after a long tug-of-war.
Wednesday opened on a gap up, but not without testing lower down to the 200 DMA’s support, but QQQ managed to bounce north from it to close above the $500/share mark.
It’s worth noting that this occurred on the week’s second lowest volume, so the upside move lacked strength behind it.
QQQ opened Thursday on a gap lower, briefly attempting to break higher above the $495/share mark, but did not reach the $450 level, and came crashing down below the 200 day moving average’s support to close below the $490/share level.
Thursday’s lower shadow also signaled that the $485/share level became in play & the week’s second highest volume session painted a dismal picture for the coming week.
Friday opened on a gap lower, broke down below the $485/share level & almost reached the $480/share mark, before rallying higher to briefly break above the 200 DMA’s resistance & closed the week out just below the long-term trend line.
Like SPY, there will need to be a significant shift in advancing volume in order for any upside near-term moves to be sustainable & as such all should be viewed skeptically in the coming week(s).
In the event of a consolidation range forming, it will likely oscillate around the 200 DMA once the long-term trendline & QQQ’s price meet again, but per Monday’s open there were further declines away from the slow moving average.
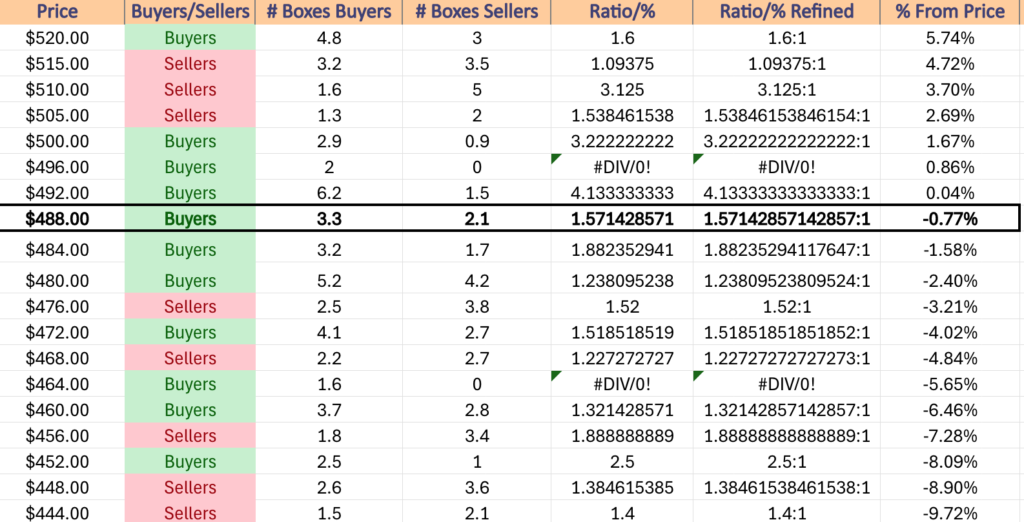
An area of concern for QQQ which can be seen in the table below is that their next four support levels from Friday’s close extend to declines of ~-9% in terms where their fourth support level to find footing on occurs & there is a lot of Seller pressure along the way there, lumped in with only one strong Buyer pressure zone ($452-455.99/share @ a rate of 2.5:1).
Any downside movements are worth referencing against the table below to see where there may be relief, but with so few local support levels QQQ looks ready for a difficult week(s) ahead in the near-term.
QQQ has support at the $484.08 (Volume Sentiment: Buyers, 1.88:1), $474.12 (Volume Sentiment: Buyers, 1.52:1), $458.47 (Volume Sentiment: Sellers, 1.89:1) & $447.28/share (Volume Sentiment: Sellers, 1.4:1) price levels, with resistance at the $491.89 (200 Day Moving Average, Volume Sentiment: Buyers, 1.57:1), $493.69 (Volume Sentiment: Buyers, 4.13:1), $499.70 (Volume Sentiment: Buyers, 2:0*) & $502/share (Volume Sentiment: Buyers, 3.22:1) price levels.
QQQ ETF’s Price Level:Volume Sentiment Over The Past ~2-3 Years
IWM, the iShares Russell 2000 ETF declined -4.05%, as the small cap index took the brunt of the week’s beatings in terms of the major index ETFs.
IWM ETF – iShares Russell 2000 ETF’s Technical Performance Over The Past Year
Their RSI is in oversold territory, sitting at 29.59, while their MACD is bearish with a steady histogram reading, which doesn’t signal that there is an immediate recovery on the horizon.
Volumes were +44.59% above the previous year’s average levels (41,838,000 vs. 28,934,640), which should sound alarm bells given that IWM’s current previous year’s average volume is -16.67% lower than that level one year ago (34,724,721).
IWM’s week opened on a bearish engulfing candle as well, after they’d already broken down through their 200 day moving average’s support the week prior & the resistance of the 10 DMA was unable to be tested despite the gap up opening price level.
Tuesday opened on a gap down, tested lower to break down through the $205/share level to the downside, but heavy volume pushed IWM higher to flirt with the $210/share mark, before closing above its opening price, but still lower on the day.
Tuesday’s high wave doji candle showed that while there was some uncertainty surrounding where IWM was to be valued, it was definitively viewed as lower given the candle’s real body & the highest volume of the week showed that despite the tug-of-war, there was conviction that it certainly belonged lower.
Wednesday opened on a gap higher, tested lower to <$205/share mark, but ultimately was able to break out & close above the $207/share level; it should be noted that this occurred on weak volume, indicating that there was limited strength behind the move higher & that it should be viewed skeptically.
Thursday confirmed this, as IWM opened on a gap lower & closed the day as a high wave doji that signaled that there was some appetite to above $207/share still, but sellers came out to force the session below $205/share briefly before it settled down for the day just above that level.
Friday resulted in the week’s second highest volume on another high wave candle, but the high was unable to reach the $207/share level & the low broke down below the $202/share mark.
While the day resulted in a bearish engulfing candle, the lower shadow speaks volumes about investor sentiment towards IWM in the near-term & it’s a bleak outlook.
The bullish case for IWM revolves around their RSI being in oversold territory & a brief bounce, but like with SPY & QQQ, without a meaningful increase in consistent advancing volume there’s little reason to believe any such move will be sustainable.
Any upward movement would also likely be thwarted by the 10 day moving average’s resistance, as it bears down on IWM’s price.
The more neutral look at IWM would be for a consolidation range to form around Friday/today’s price ranges that would likely oscillate around their 10 day moving average, but given that this is the small cap index this would only happen as a result of a temporary breather after their past few months of declines while their RSI heads back towards the neutral level, as they will continue to be punished if their larger counterpart indexes head lower.
The $196-197.99/share zone will be a place of interest in the event of further declines for IWM, as it is the strongest level of Buyer:Seller sentiment over the past ~2-3 years (2.5:1) within -9.69% of Friday’s closing price & it houses two support levels.
Should these break down the next support level has less historic Buyer sentiment (1.15:1) before we re-enter Seller dominated zones without support levels, which will make it difficult to find stable footing on.
The following support level is $189.60, which occurs in a Buyers zone (1.64:1), which if that breaks down is the last one-year support level & prices enter a Seller dominated zone at a rate of 1.44:1, which would prove poor for IWM.
The $188/share mark is -8.72% from Friday’s close, so if prices break down through it & then slide through the next zone, the $186/share level is -9.69% from Friday’s closing level.
As with the indexes above, it is worth reviewing IWM’s price action against the table below in the coming weeks.
IWM is at a support/resistance point of $205.95 & has support at the $202.91 (Volume Sentiment: Buyers, 1.54:1), $197.34 (Volume Sentiment: Buyers, 2.5:1), $196.15 (Volume Sentiment: Buyers, 2.5:1) & $195.45/share (Volume Sentiment: Buyers, 1.15:1) price levels, with resistance at the $207.86 (Volume Sentiment: Buyers, 2.64:1), $207.96 (Volume Sentiment: Buyers, 2.64:1), $209.94 (Volume Sentiment: Buyers, 2.64:1) & $210.93/share (10 Day Moving Average, Volume Sentiment: Buyers, 2.64:1) price levels.
IWM ETF’s Price Level:Volume Sentiment Over The Past ~2-3 Years
DIA ETF – SPDR Dow Jones Industrial Average ETF’s Technical Performance Over The Past Year
Their RSI is currently at 40.99, while their MACD is bearish & its histogram is not indicating that the slide is over in the near-term.
Volumes were +4.14% above the prior year’s average (3,384,000 vs. 3,249,250), which is less troubling than the aforementioned indexes, but given that DIA is home to the blue chips this should be expected.
Their current prior year’s average volume level is -5.53% lower than DIA’s average volume level one year ago (3,439,304), so even some of the investors who value the safety of the blue chip names are beginning to head towards the exit.
Monday opened the week up on a gap higher above the 10 day moving average’s resistance, broke above the $440/share mark, before sliding below the support of both the 10 & 50 DMAs to cross below the $430/share level temporarily to close forming a bearish engulfing candle with Friday’s session.
One thing of note here was that while Monday had DIA’s widest range of the week, it also contained the highest volume, setting the stage for further declines & likely signaling a larger trend shift for the blue chip names.
Tuesday followed suit & opened on a gap lower, attempted to break above the $430/share level but was unable to remain above it for long & ultimately closed lower, with the day’s low price touching below $425/share, signaling that there was more downside interest on the horizon.
Wednesday opened on a gap lower & again the $425/share level was broken through bearishly temporarily, before DIA rallied to close above the $430/share level; however this occurred on the second lowest volume of the week, signaling that there was not much conviction behind the bullish engulfing candle, particularly given the day’s wide range of prices covered.
Thursday resulted in an interesting day for DIA, as the week’s lowest volume session resulted in a high wave doji candle for a decline, causing a bearish harami pattern, where the upper shadow tested & was rejected by the $430/share level, while the day’s low crossed below the $425/share level.
The low volume on a high wave candle does not indicate that there was much tug-of-war & as a result the taller upper shadow comes with less meaning given the result of the day’s close.
Friday threw an interesting head-fake to the upside, as the day opened on a gap lower below the $425/share level, tested & bounced off of the $421.98/share level, before advancing for the day to close+0.55% & form a bullish engulfing pattern.
While it was on the week’s second highest volume, it indicates that at best DIA will consolidate in a range between the real body of Friday’s candle.
DIA will need significant increases in advancing volume for any near-term gains to be sustainable like the other three indexes & has the resistance of the 10 day moving average bearing down on it.
In the event of a downside move the 200 DMA’s support will be a key area to watch, as it resides in a zone that Sellers have bested Buyers 1.11:1 over the past ~4-5 years & should it break down the next zone ($412-415.99/share) has been Even (1:1) between the bulls & bears in terms of volume, which will likely become advantage Sellers unless the price oscillates around the 200 DMA favoring the downside.
The $408.12/share support level will become a key area to watch should those events unfold, as the $408-411.99/share has historically been won by Buyers at a rate of 12:1, which means it has been relatively untested by Sellers.
If that level breaks down there isn’t another support level to gain footing on for another -2.64% & a Seller:Buyer 1.17:1 zone sits atop it, which will likely lead prices lower to test it.
The table below will be beneficial to reference in the coming weeks in relation to DIA’s price movements.
DIA has support at the $427.60 (Volume Sentiment: Sellers, 2.25:1), $420.93 (Volume Sentiment: Buyers, 1.5:1), $417.73 (Volume Sentiment: Sellers, 1.11:1) & $416.78/share (200 Day Moving Average, Volume Sentiment: Sellers, 1.11:1) price levels, with resistance at the $430.88 (Volume Sentiment: Buyers, 4.5:1), $431.80 (10 Day Moving Average, Volume Sentiment: Buyers, 4.5:1), $432.86 (Volume Sentiment: Buyers, 2.75:1) & $435.90/share (50 Day Moving Average, Volume Sentiment: Buyers, 2.5:1) price levels.
DIA ETF’s Price Level:Volume Sentiment Over The Past ~4-5 Years
The Week Ahead
There is no major economic data due for release on Monday.
BioNTech & Franco-Nevada report earnings Monday morning before the opening bell, followed by Asana, HighPeak Energy, Limbach Holdings, Mission Produce, Oracle, Paymentus, StandardAero & Vail Resorts after the closing bell.
Tuesday opens with NFIB Optimism Index data at 6:45 am, before Job Openings Data is released at 10 am.
Ciena, Dick’s Sporting Goods, Ferguson Enterprises, First Watch Restaurant Group, Holley, Kohl’s, Korn Ferry, Legend Biotech, United Natural Foods & Viking Holdings all report earnings before Tuesday’s opening bell, with Cadre Holdings, Casey’s General, Stitch Fix & Westrock Coffee reporting after the session’s close.
Wednesday begins with Consumer Price Index, CPI Year-over-Year, Core CPI & Core CPI Year-over-Year data at 8:30 am, followed by Monthly U.S. Federal Budget data at 2 pm.
ABM Industries, Arcos Dorados & iRobot all report earnings Wednesday before the session’s open, with Adobe, American Eagle Outfitters, Calavo Growers, Crown Castle, Phreesia, SentinelOne, Sprinklr & UiPath reporting after the closing bell.
Initial Jobless Claims come out at 8:30 am on Thursday, as well as Producer Price Index, Core PPI, PPI Year-over-Year & Core PPI Year-over-Year data.
Thursday’s earnings kick off with Dollar General, G-III Apparel & Weibo in the morning, before Ulta Beauty, Berry Petroleum, Blink Charging, DocuSign, EverCommerce, PagerDuty, Rubrik, Semtech, ServiceTitan, Wheaton Precious Metals, Xponential Fitness & Zumiez report after the session’s close.
Consumer Sentiment (prelim) March data is due for release on Friday at 10 am.
Friday’s morning’s earnings reports include Buckle, Gogo & Li Auto.
See you back here next week!
*** I DO NOT OWN SHARES OR OPTIONS CONTRACT POSITIONS IN SPY, QQQ, IWM OR DIA AT THE TIME OF PUBLISHING THIS ARTICLE ***
The VIX closed at 24.87, indicating an implied one day move of +/-1.57% & an implied one month move of +/-7.19% for the S&P 500.
Highest Technical Rated S&P 500 Components Per 3/6/2025’s Close:
1 – GILD
2 – PLTR
3 – TPR
4 – PM
5 – VRSN
6 – T
7 – FOXA
8 – TMUS
9 – FOX
10 – YUM
Lowest Technical Rated S&P 500 Components Per 3/6/2025’s Close:
1 – CE
2 – MRNA
3 – FSLR
4 – TFX
5 – ON
6 – NTAP
7 – ENPH
8 – DECK
9 – AMD
10 – APA
Highest Volume Rated S&P 500 Components Per 3/6/2025’s Close:
1 – STE
2 – KR
3 – MKTX
4 – KIM
5 – POOL
6 – NFLX
7 – KKR
8 – GEV
9 – EVRG
10 – COO
Lowest Volume Rated S&P 500 Components Per 3/6/2025’s Close:
1 – WAB
2 – V
3 – WST
4 – VST
5 – VLO
6 – YUM
7 – VTR
8 – ZBH
9 – VMC
10 – WFC
Highest Technical Rated ETFs Per 3/6/2025’s Close:
1 – BABX
2 – YINN
3 – BOIL
4 – XPP
5 – CWEB
6 – UNG
7 – KTEC
8 – AMDS
9 – DRIP
10 – CQQQ
Lowest Technical Rated ETFs Per 3/6/2025’s Close:
1 – MSOX
2 – KOLD
3 – YANG
4 – AMDL
5 – MRNY
6 – NVDX
7 – TSLL
8 – TSLT
9 – SOXL
10 – TSLR
Highest Volume Rated ETFs Per 3/6/2025’s Close:
1 – LIAM
2 – EV
3 – BTR
4 – HEJD
5 – LSEQ
6 – FGM
7 – HAPS
8 – FEBT
9 – PBNV
10 – QINT
Lowest Volume Rated ETFs Per 3/6/2025’s Close:
1 – BBEM
2 – USCL
3 – IDEC
4 – PBJA
5 – SIXZ
6 – FFIU
7 – CNBS
8 – PBDE
9 – NAUG
10 – XTWY
Highest Technical Rated General Stocks Per 3/6/2025’s Close:
1 – CMRX
2 – GRRR
3 – CPIX
4 – GV
5 – RAASY
6 – ALBT
7 – PWRMF
8 – OCFT
9 – ETCMY
10 – CTM
Lowest Technical Rated General Stocks Per 3/6/2025’s Close:
1 – AEON
2 – SUNE
3 – CLEU
4 – MULN
5 – RGFC
6 – ASBP
7 – NOVA
8 – LICN
9 – CYCU
10 – LICYF
Highest Volume Rated General Stocks Per 3/6/2025’s Close:
1 – SCNX
2 – PSTV
3 – AGMH
4 – OUT
5 – AEON
6 – CUTR
7 – NSA
8 – NWGL
9 – UNIT
10 – ILAG
Lowest Volume Rated General Stocks Per 3/6/2025’s Close:
1 – WIT
2 – WOR
3 – VSCO
4 – VTS
5 – X
6 – WAB
7 – WTTR
8 – YPF
9 – VTLE
10 – WRBY
*** THE LIST ABOVE IS STRICTLY FOR INFORMATIONAL PURPOSES – I MAY OR MAY NOT HAVE OR INITIATE A LONG, SHORT, OR LONG/SHORT POSITION IN ANY NAME ABOVE AT ANY TIME ***
Well, things have become interesting… the week ended relatively in-line with last week’s expectations.
SPY, the SPDR S&P 500 ETF dipped -0.96% this past week, while the VIX closed at 19.63, indicating an implied one day move of +/-1.24% & an implied one month move of +/-5.67%.
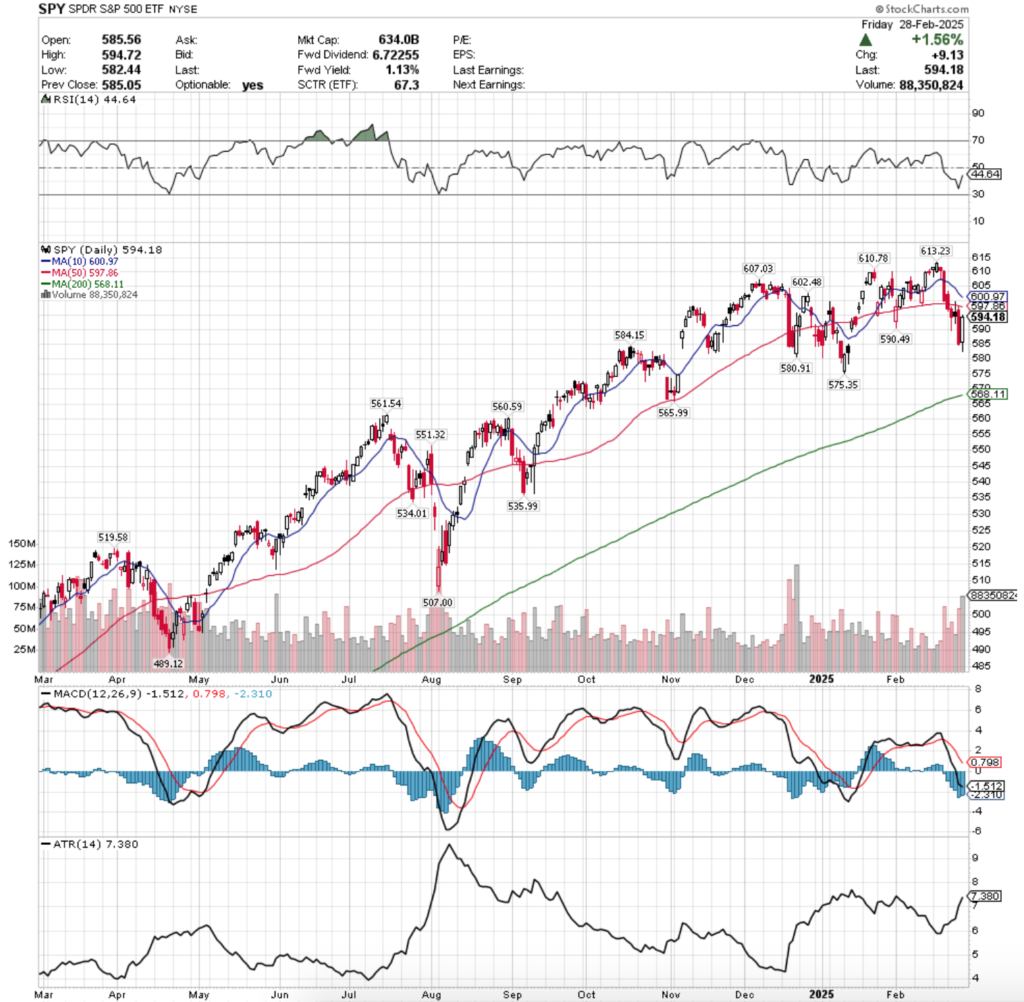
SPY ETF – SPDR S&P 500 ETF’s Technical Performance Over The Past Year
Their RSI is advancing towards the neutral 50 mark & sits currently at 44.54, while their MACD is bearish, but their histogram has begun to taper off following Friday’s session.
Volumes were +18.77% above the previous year’s average level (63,054,000 vs. 53,091,315), which should be viewed as problematic given the declines of the last week that were saved by Friday’s squeeze heading into the weekend.
Monday the week kicked off on a sour note, as while SPY opened above Friday’s close it was unable to stay above the support of the 50 day moving average, closing below it to not return above the medium-term trend line for the remainder of the week.
Tuesday the declines continued, on slightly higher volume than Monday, indicating that market participants had become antsy, particularly as the $590/share price level was temporarily broken during the session.
Wednesday the declines took a breather, but there was no indication that things were going to turn around, as the day flashed many bearish signals.
The session opened in the middle of Tuesday’s range, tested higher to break above the 50 day moving average’s resistance, before cratering & settling below the open, with the sessions’s lower shadow indicating that there was still downside appetite as well.
It should be noted that the session closed as a spinning top as well, on the week’s lowest volume while forming a bearish harami pattern with Tuesday’s candle, signaling that there was a bit of anxiety in the market.
Thursday opened on a gap up just beneath the 50 day moving average’s resistance, tested higher but was unable to break above the 50 DMA & ultimately dropped to below the $585/share price level on the second highest volume of the week.
It should also be noted that this was the third highest volume of the year, trailing the previous Friday’s volume & the volume that was produced in the following day’s session.
There was clearly a bit of fear in the air.
Friday had the highest volume of 2025 on a +1.56% advancing session which saved SPY’s week in terms of final performance.
It closed with signs of uncertainty, as there was high volume & the candle formed a bullish harami pattern, which could indicate a reversal is in the making, especially given that the volume was the highest of 2025.
It may be worth taking a look to back on December 20,2025 when a similar pattern emerged in terms of both the pattern & the volume spike while SPY was below their 50 DMA.
While the next three sessions advanced, the next few weeks saw increased declines, creating the $575.35/share support level that we will be keeping an eye on over the coming weeks.
One point of difference is that there is more distance between the 10 & 50 DMAs, follow the volume trends over the coming week(s) to see if there is an increase in advancing volume levels, which will be imperative to sustain the reversal.
It currently looks like the 50 DMA will be straddled/oscillated around moving into the next week, particularly as it is -0.52% below the 10 DMA, which is ready to cross over bearishly in the next few sessions.
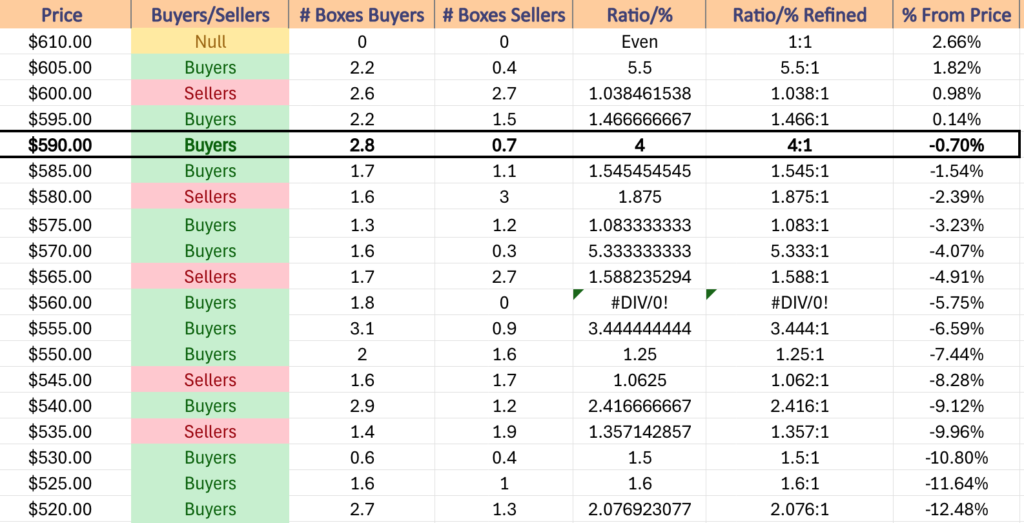
Should the $590.49/share support level break down, the following two support levels have been dominated by Sellers at the rate of 1.88:1 over the past ~3-4 years.
That $575.35 support level happens to be in a Buyer dominated zone, but the ratio has been only 1.08:1, which means that the long-term trend line is now in play, as the 200 DMA’s support is only -4.39% below Friday’s closing price & is the next support level.
Should there be any advances, the $600/share mark will be difficult to cross bullishly & sustain further advances based on the volume data in the table below.
SPY has support at the $590.49 (Volume Sentiment: Buyers, 4:1), $584.15 (Volume Sentiment: Sellers, 1.88:1), $580.19 (Volume Sentiment: Sellers, 1.88:1) & $575.35/share (Volume Sentiment: Buyers, 1.08:1) price levels, with resistance at the $597.86 (50 Day Moving Average, Volume Sentiment: Buyers, 1.47:1), $600.97 (10 Day Moving Average, Volume Sentiment: Sellers, 1.04:1), $602.48 (Volume Sentiment: Sellers, 1.04:1) & $607.03/share (Volume Sentiment: Buyers, 5.5:1) price levels.
SPY ETF’s Price Level:Volume Sentiment Over The Past ~2-3 Years
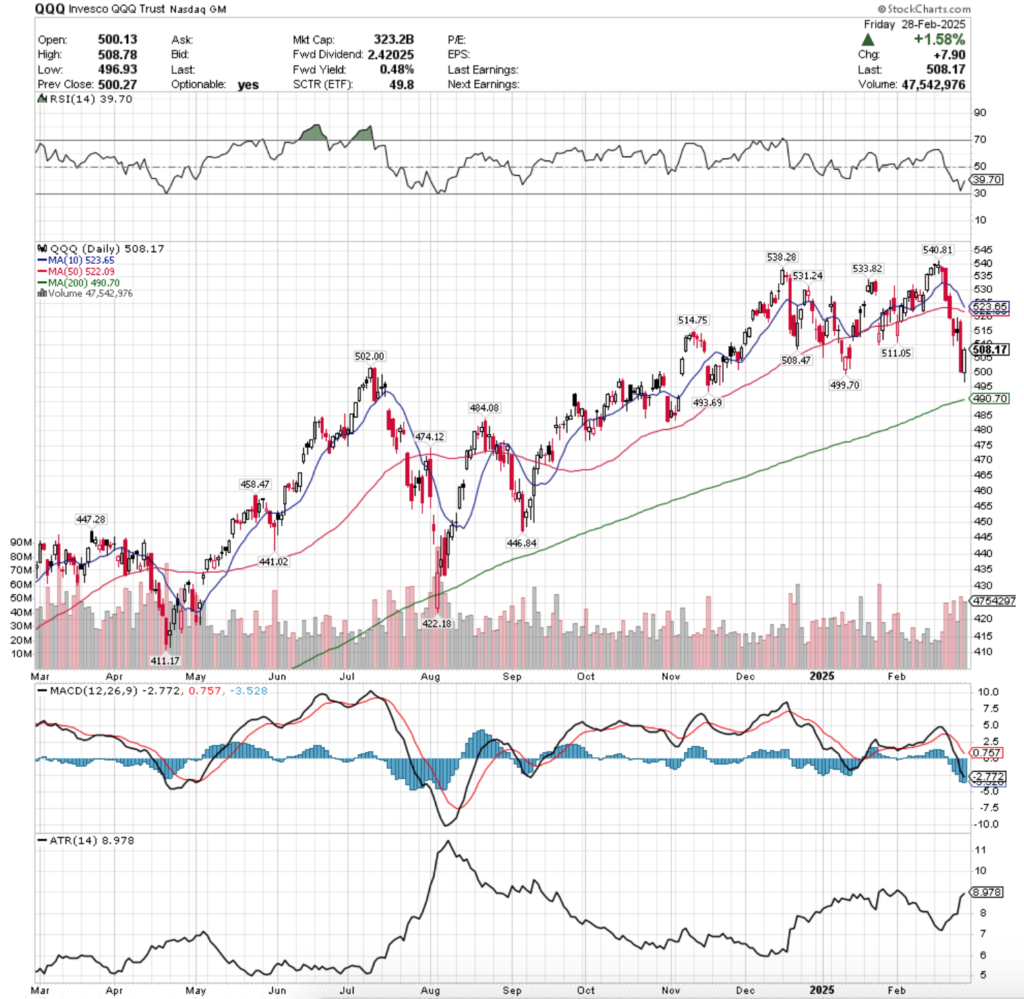
QQQ ETF – Invesco QQQ Trust ETF’s Technical Performance Over The Past Year
Their RSI is advancing towards the neutral 50 level, but currently sits at 39.7, while their MACD is bearish & looks set to continue lower.
Volumes were +26.82% above the previous year’s average (44,554,000 vs. 35,131,713), which paints an even bleaker picture than was just described regarding SPY.
Much like SPY, Monday opened the week off on a sour note for QQQ, as the session broke down through the 50 day moving average’s support to close beneath it, setting the stage for a week of declines.
Volume was light, but it was the kindling that lit the fire for the rest of the week.
Tuesday opened on a gap lower, but more sellers entered the arena than Monday & forced a temporary breakdown of the $510/share price level, but prices were able to recover enough to close down, but above $510/share.
Wednesday saw a temporary breather, but much like SPY’s chart, it did not paint a picture of recovery.
The day formed a bearish harami pattern with Tuesday on a high wave spinning top, indicating a great deal of indecision, particularly as the day had the weakest volume of the week.
Thursday opened on a gap up, formed a bearish engulfing pattern on Wednesday’s candle & had the second highest volume of the year, indicating that there was a large abandoning of ship after the NVDA earnings calls which was after Wednesday’s close.
Friday did QQQ no favors either, as despite the +1.58% advance the $500/share level was blatantly broken down before the rally that pushed QQQ to close higher, and volumes were lower than Thursday’s, making it appear like a bait & switch squeeze in the wake of the major declining day.
Heading into the new week QQQ has a slightly different set up than SPY, given that their 10 DMA is set to crossover bearishly through the 50 DMA by Wednesday & the proximity of their close to their long-term trend line.
QQQ closed the week with their 200 DMA’s support just -3.44% below their closing price, which indicates that prices may venture back north to near where the 10 & 50 DMA’s are temporarily, else consolidate within the range established by Friday’s candle for the week.
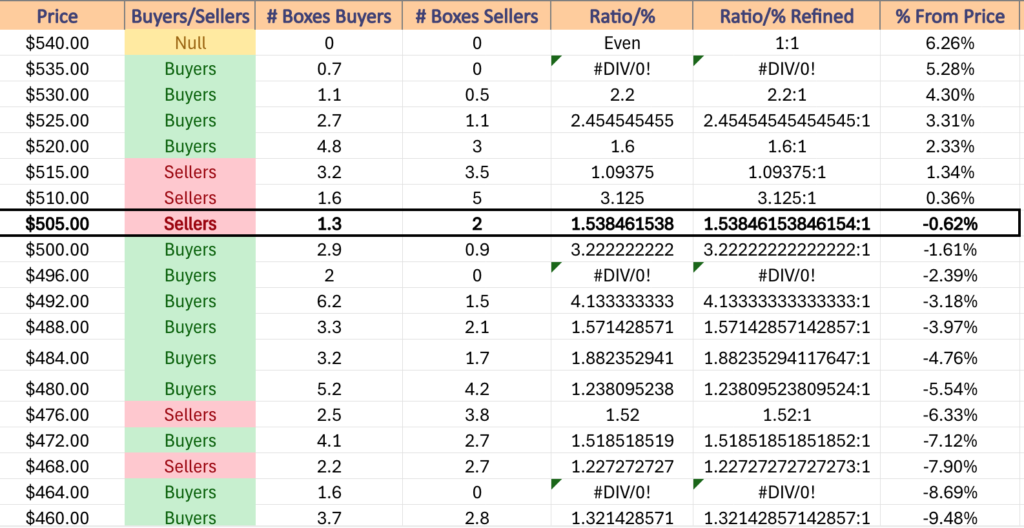
The good news for bulls is that QQQ is currently in the last of three major Seller dominated price levels that were outline below (also on the table below), but the bad news is that given how fast they fell last week & at such high participation rates, that even consolidating temporarily seems tricky without some increase in volume vs. the prior year’s average.
Should prices advance & retest the 10 & 50 DMAs’ resistance levels, the December 20th mark listed above is worth revisiting to get an idea of where things may go, as well as the chart below for the volume sentiment reading.
Should the 200 DMA’s support break down, $487.99-484.00 will be the last stalwart of support, with Buyers besting Sellers at a ratio of 4.133:1 over the past ~2-3 years, else there’ll likely be a further breakdown from the $484.08/share support level.
QQQ has support at the $502.00 (Volume Sentiment: Buyers, 3.22:1), $499.70 (Volume Sentiment: Buyers, 2:0*), $493.69 (Volume Sentiment: Buyers, 4.13:1) & $490.70/share (200 Day Moving Average, Volume Sentiment: Buyers, 1.57:1) price levels, with resistance at the $508.47 (Volume Sentiment: Sellers, 1.54:1), $511.05 (Volume Sentiment: Sellers, 3.13:1), $514.75 (Volume Sentiment: Sellers, 3.13:1) & $522.09/share (50 Day Moving Average, Volume Sentiment: Buyers, 1.6:1) price levels.
QQQ ETF’s Price Level:Volume Sentiment Over The Past ~2-3 Years
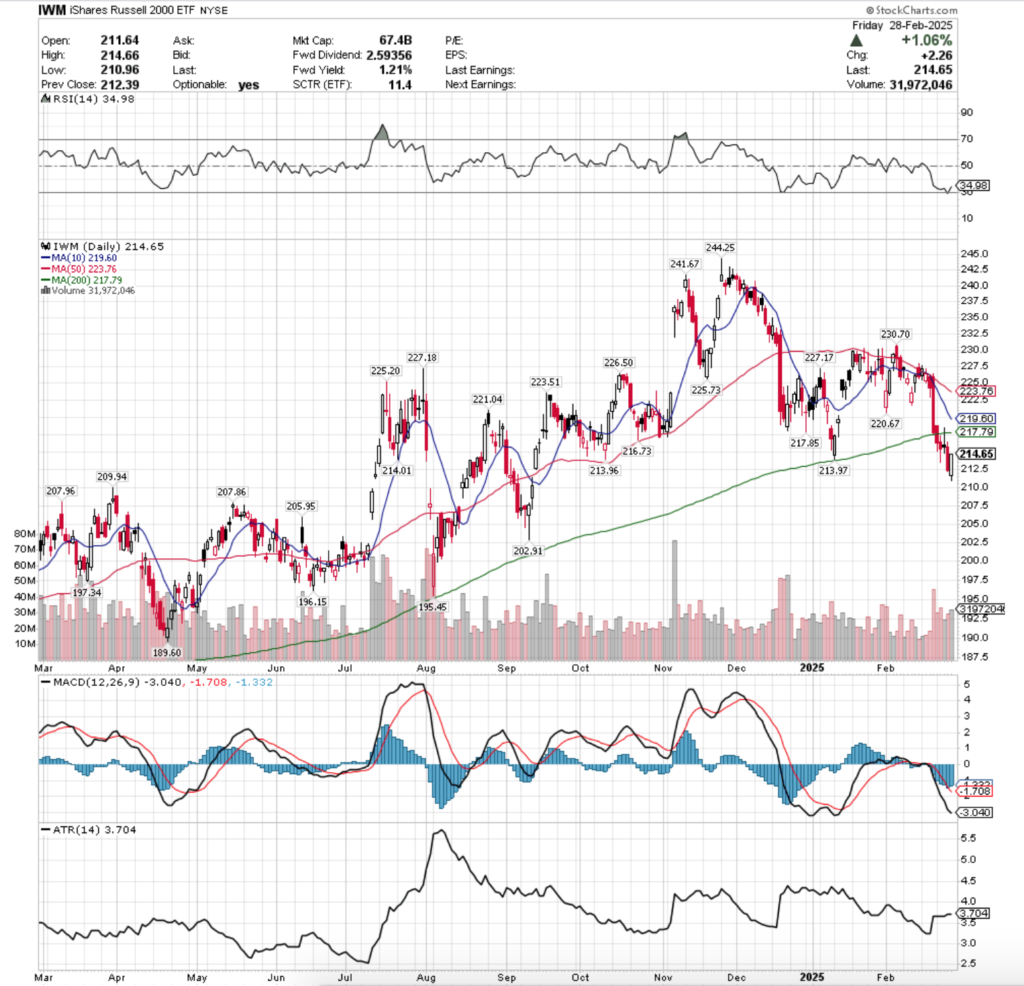
IWM ETF – iShares Russell 2000 ETF’s Technical Performance Over The Past Year
Their RSI is advancing after bouncing off of the oversold 30 level & sits currently at 34.98, while their MACD is still bearish, but the histogram is waning after Friday’s advancing session.
Volumes were +4.82% above the previous year’s average (30,156,000 vs. 28,769,163), which while it appears irrelevant compared to SPY & QQQ does indicated that there is trouble brewing for small caps as well.
Monday set the week up for failure quickly, as the session immediately broke down the long-term trend line of support & tested the downside of $215/share, indicating that folks were hopping out of the pool.
Tuesday this continued, when the session opened & tried to test the resistance of the 200 DMA, failed & went south to close on a decline on the highest volume of the week.
Wednesday attempted a “Hail Mary” & wound up just forming a bearish harami pattern on the week’s weakest volume, but the upper shadow shows that at least for a moment, there were some buyers in the room.
IWM closed as a spinning top candle that closed lower than it opened, indicating indecision-to-negative sentiment, with the lower shadow of the day’s range breaking below $215/share, setting the stage for further losses.
This was also the week’s weakest session by volume, indicating that there was not much validity to the upwards moves of the day & that profits were taken.
Thursday produced further declines that lead to IWM being under $212.50/share, with the upper shadow of the day’s candle not signaling much upside appetite.
Friday opened on a gap lower, tested lower, before closing out as an advance of +1.06%, but the volumes tell the same story of short-term squeeze, which the 200 DMA’s resistance at 1.46% above Friday’s close will likely prove true.
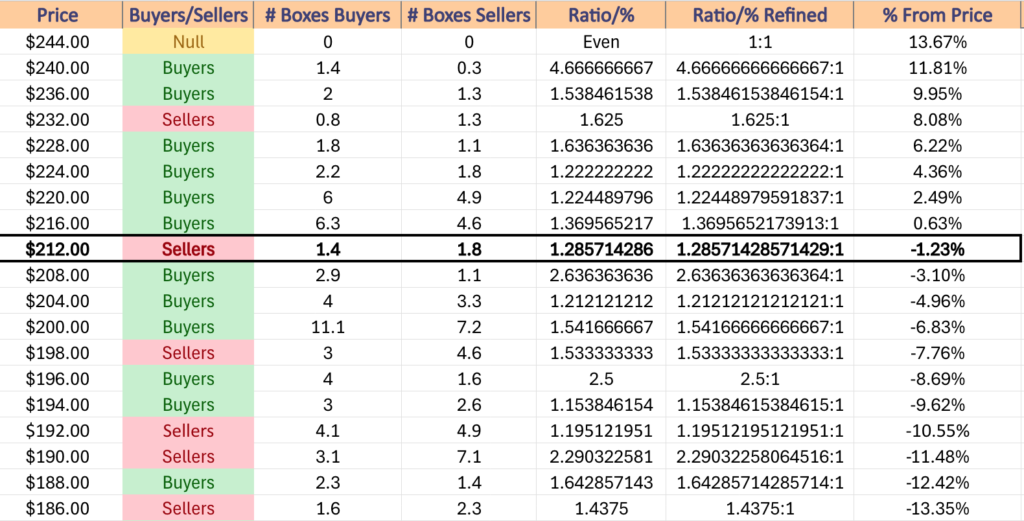
IWM is currently in the $212-213.99/share price zone, which over the past ~2-3 years has been primarily dominated by the Sellers at a ratio of 1.29:1, signaling that the added resistance of the long-term trend line may add trouble for the index.
Look for the 10 & 50 Day Moving Averages to cross bearishly through the 200 DMA over the next 6 sessions, and unless we get some bullish catalyst, it looks like we’ll see some consolidation with further declines in the near-term.
Any catalyst will need sufficient levels of volume behind it to become sustainable, so this week’s levels are nothing of note, unless we see more days with higher levels of advancing volume.
The $209.94/share support level has typically been won by the Buyers at a rate of 2.64:1, which will be a key area to watch should we see any declines through the three closer support levels that are all in a Seller zone.
Reference the table below for more information on IWM’s volume sentiment by price level.
IWM has support at the $214.01 (Volume Sentiment: Sellers, 1.29:1), $213.97 (Volume Sentiment: Sellers, 1.29:1), $213.96 (Volume Sentiment: Sellers, 1.29:1) & $209.94/share (Volume Sentiment: Buyers, 2.64:1) price levels, with resistance at the $216.73 (Volume Sentiment: Buyers, Buyers, 1.37:1), $217.79 (200 Day Moving Average, Volume Sentiment: Buyers, 1.37:1), $217.85 (Volume Sentiment: Buyers, 1.37:1) & $219.60/share (10 Day Moving Average, Volume Sentiment: Buyers, 1.37:1) price levels.
IWM ETF’s Price Level:Volume Sentiment Over The Past ~2-3 Years
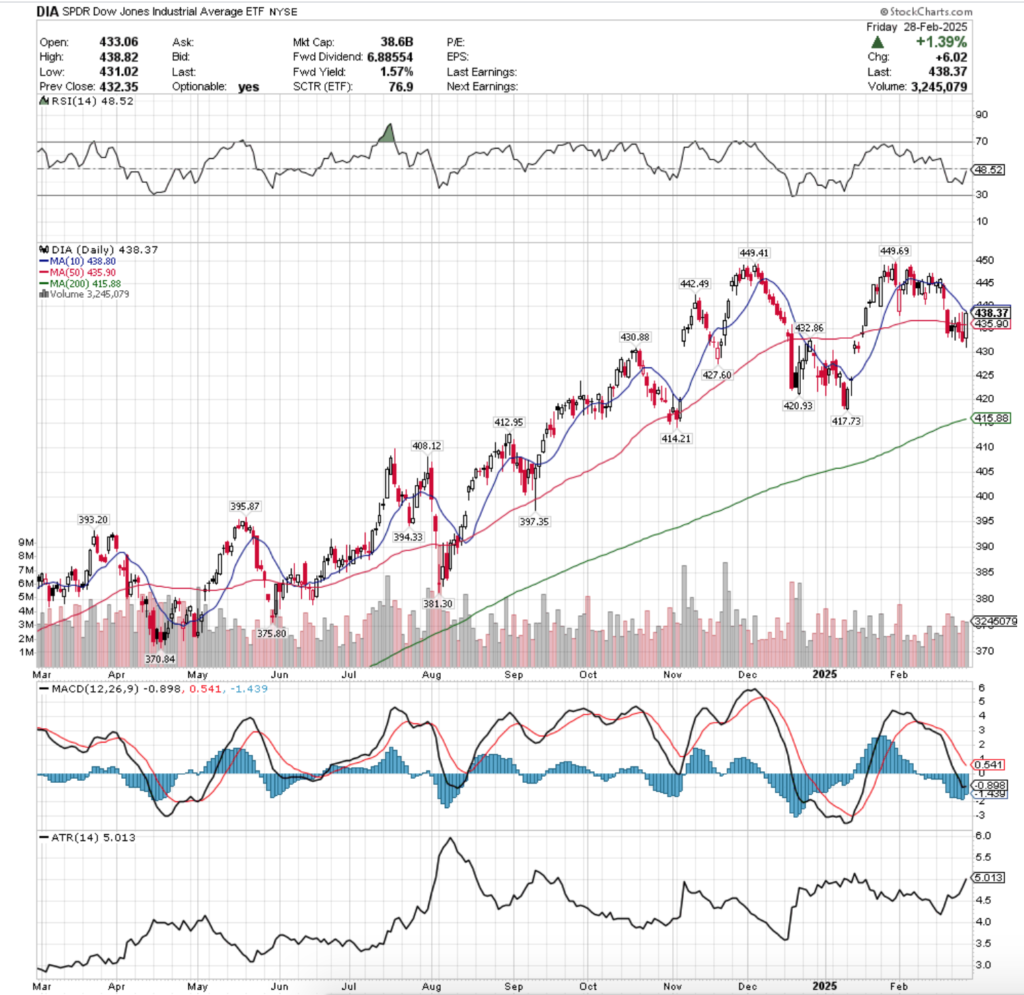
DIA ETF – SPDR Dow Jones Industrial Average ETF’s Technical Performance Over The Past Year
Their RSI is approaching the neutral 50-mark at 48.52, while their MACD is bearish, but has flattened out in the wake of Friday’s session.
Volumes were -4.22% lower than their prior year’s average level (3,112,000 vs. 3,249,163), bucking the trend on volume & advance/decline, but not showing much sign of life.
Monday kicked the week off in spooky-spirit, with a spinning top bearish harami pattern that had the week’s highest volume & a close that was lower than the open, but the lower shadow indicated that there was more appetite lower vs. higher.
Tuesday also gave off a lack of confidence, as DIA tested even lower, before temporarily breaking through the 50 day moving average’s resistance & closing as a spinning top, in-line with the 50 DMA.
Wednesday showed the worst volume of the week, on a session that featured a gap up, a test slightly higher than Tuesday & then a decline that was slightly above Tuesday’s low, inspiring a slight bit of optimism.
Thursday gave an indication that we may see the 10 DMA be straddled as it bearishly approaches the 50 day moving average based on its upper shadow, which also broke the day prior’s high, but that bearish day was the second highest volume day of the week.
Partially due to the wide range & likely some intra-day profit taking, but it showed that folks were willing to see the 10 DMA for a brief vacation.
Friday had the third highest volume of the week, which is troubling as it shows that the 10 DMA’s resistance is proving temporarily resilient, as it sits <1% above the 50 DMA’s support, indicating price will likely straddle the 10 & consolidate, else decline unless we see a substantial uptick in volume on some advances.
It’s also worth looking at the unfilled gaps of early 2025; DIA is the blue chip index, everyone buys into them at the end of the day for the most part for safety, this is in part why they’ve weathered the storm so well.
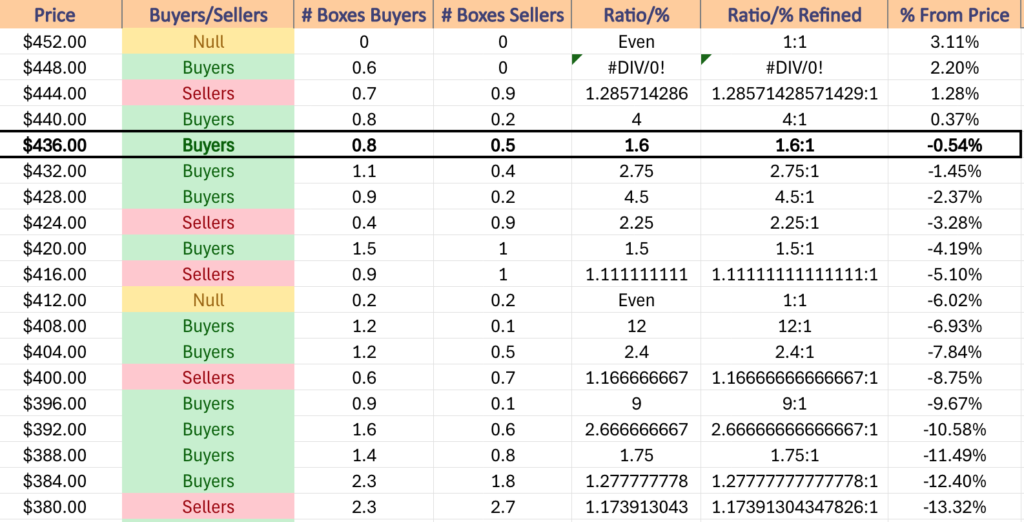
After a -2.37% decline, per the table below, there is a bit of room for declines based on previous volume trends, which will be key areas to keep an eye on in the coming week(s).
DIA has support at the $435.90 (50 Day Moving Average, Volume Sentiment: Buyers, 2.75:1), $432.86 (Volume Sentiment: Buyers, 2.75:1), $430.88 (Volume Sentiment: Buyers, 4.5:1) & $427.60/share (Volume Sentiment: Sellers, 2.25:1) price levels, with resistance at the $438.80 (10 Day Moving Average, Volume Sentiment: Buyers, 1.6:1), $442.49 (Volume Sentiment: Buyers, 4:1), $449.41 (Volume Sentiment: Buyers, 0.6:0*) & $449.69/share (All-Time High, Volume Sentiment: Buyers, 0.6:0*) price levels.
DIA ETF’s Price Level:Volume Sentiment Over The Past ~4-5 Years
The Week Ahead
Monday the week kicks off with S&P Final U.S. Manufacturing PMI data at 9:45 am, followed by Construction Spending & ISM Manufacturing data at 10 am, Fed President Musalem speaking at 12:35 pm & Auto Sales data.
Avadel Pharmaceuticals, California Resources Corp., Fortrea, N-able, Nomad Foods, Plug Power, Sunnova Energy & Surgery Partners are all due to report earnings on Monday morning, followed by ADMA Biologies, Concentra Group Holdings, GigaCloud Technology, GitLab, NuScale Power, Okta, Repay Holdings & W&T Offshore after the closing bell.
Fed President Williams speaks at 2:20 pm Tuesday, with Fed President Barkin speaking at a time yet to be determined.
Tuesday morning begins with earnings from Target, AutoZone, Best Buy, EV Go, Genius Sports, Olaplex, ON Semiconductor, Paysafe & Sea Ltd., with AeroVironment, Box, ChargePoint Holdings, Credo Technology Group, Credo Technology Group, Evolus, Flutter Entertainment, Nordstrom, Ross Stores & Sociedad Quimica y Minera due to report after the closing bell.
Wednesday begins with ADP Employment data at 8:15 am, before S&P Final U.S. Services PMI at 9:45 am, Factory Orders & ISM Services data at 10 am & the Fed Beige Book at 2 pm.
Abercrombie & Fitch, Brown-Forman, CG Oncology, Dine Brands, Foot Locker, REV Group, Riskified, SmartRent, South Bow, Stratasys & Thor Industries are all reporting earnings Wednesday morning before the session opens, with Descartes, Kodiak Gas Services, LandBridge, Marvell Technology, MongoDB, Sleep Number, Veeva Systems, Victoria’s Secret, Yext, Zscaler & Zymeworks all scheduled to report after the close.
Initial Jobless Claims, U.S. Productivity (Final) & U.S. Trade Deficit data are all due Thursday at 8:30 am, followed by Wholesale Inventories data at 10 am, Fed Governor Waller speaking at 3:30 pm & Fed President Bostic speaking at 7 pm.
Thursday morning’s earnings include America’s Car-Mart, BJ’s Wholesale, BrightSpring Health Services, Burlington Stores, Canadian Natural Resources, Cracker Barrel Old Country Store, GMS, Macy’s, Marex Group, Stevanato Group, The Toro Company & Turning Point Brands, before Broadcom, Costco Wholesale, Asure Software, BigBear.ai, Cooper, Domo, El Pollo Loco, Funko, Gap, Guidewire Software, Hewlett Packard Enterprise, MeridianLink, Samsara & Smith & Wesson Brands after the session’s close.
Friday the week winds down with U.S. Jobs Report, U.S. Unemployment Rate, U.S. Hourly Wages & Hourly Wages Year-over-Year data at 8:30 am, before Fed Governor Bowman speaks at 10:15 am, Fed President Williams speaks at 10:45 am, Fed Governor Kugler speaks at 12:20 pm, Fed Chairman Powell speaking at 12:30 pm & Consumer Credit data at 3pm.
Algonquin Power & Utilities & Genesco are both due to report earnings after the session’s close.
See you back here next week!
*** I DO NOT OWN SHARES OR OPTIONS CONTRACT POSITIONS IN SPY, QQQ, IWM OR DIA AT THE TIME OF PUBLISHING THIS ARTICLE ***
The VIX closed at 21.13, indicating an implied one day move of +/-1.33% & an implied one month move of +/-6.11% for the S&P 500.
Highest Technical Rated S&P 500 Components Per 2/27/2025’s Close:
1 – TPR
2 – PLTR
3 – GILD
4 – SOLV
5 – FOXA
6 – PM
7 – FOX
8 – RL
9 – HWM
10 – FTNT
Lowest Technical Rated S&P 500 Components Per 2/27/2025’s Close:
1 – CE
2 – MRNA
3 – TFX
4 – WST
5 – FSLR
6 – SWKS
7 – FMC
8 – EIX
9 – AMD
10 – ON
Highest Volume Rated S&P 500 Components Per 2/27/2025’s Close:
1 – FE
2 – TFX
3 – KDP
4 – VTRS
5 – EBAY
6 – WBD
7 – UHS
8 – APA
9 – CRM
10 – SRE
Lowest Volume Rated S&P 500 Components Per 2/27/2025’s Close:
1 – RMD
2 – EL
3 – NWS
4 – AVY
5 – BA
6 – DTE
7 – DOC
8 – LVS
9 – NUE
10 – STE
Highest Technical Rated ETFs Per 2/27/2025’s Close:
1 – BABX
2 – YINN
3 – XPP
4 – BOIL
5 – ETHD
6 – MSTZ
7 – SMST
8 – ETQ
9 – AMDS
10 – KTEC
Lowest Technical Rated ETFs Per 2/27/2025’s Close:
1 – MSOX
2 – YANG
3 – MRNY
4 – CONL
5 – BCHG
6 – KOLD
7 – AMDL
8 – AIYY
9 – CNBS
10 – SOXL
Highest Volume Rated ETFs Per 2/27/2025’s Close:
1 – THRO
2 – MYMG
3 – GENM
4 – MYMF
5 – AUGU
6 – XTEN
7 – JPXN
8 – MYMH
9 – IFRA
10 – EFG
Lowest Volume Rated ETFs Per 2/27/2025’s Close:
1 – JUNM
2 – TBFC
3 – PSQA
4 – TFJL
5 – QMAG
6 – CNBS
7 – JMID
8 – PABU
9 – AHLT
10 – SEPT
Highest Technical Rated General Stocks Per 2/27/2025’s Close:
1 – PWRMF
2 – LEMIF
3 – ATGL
4 – DOMH
5 – TRIRF
6 – ZNOG
7 – GRRR
8 – RPID
9 – VNET
10 – ORGS
Lowest Technical Rated General Stocks Per 2/27/2025’s Close:
1 – AEON
2 – CYCU
3 – MULN
4 – CYN
5 – CLEU
6 – SPIEF
7 – ACON
8 – LGMK
9 – FTEL
10 – WINT
Highest Volume Rated General Stocks Per 2/27/2025’s Close:
1 – ULY
2 – BCG
3 – AMST
4 – XNET
5 – CPOP
6 – ARBB
7 – NIXX
8 – QNRX
9 – TRNR
10 – FNRN
Lowest Volume Rated General Stocks Per 2/27/2025’s Close:
1 – DTEGF
2 – PSYTF
3 – LTRPA
4 – EUBG
5 – CTSDF
6 – GGGOF
7 – INBP
8 – ALPIB
9 – PRFX
10 – BLMH
*** THE LIST ABOVE IS STRICTLY FOR INFORMATIONAL PURPOSES – I MAY OR MAY NOT HAVE OR INITIATE A LONG, SHORT, OR LONG/SHORT POSITION IN ANY NAME ABOVE AT ANY TIME ***
The VIX closed at 19.1, indicating an implied one day move of +/-1.2% & an implied one month move of +/-5.52% for the S&P 500.
Highest Technical Rated S&P 500 Components Per 2/26/2025’s Close:
1 – PLTR
2 – TPR
3 – GILD
4 – SOLV
5 – RL
6 – FOXA
7 – FOX
8 – FTNT
9 – PM
10 – NRG
Lowest Technical Rated S&P 500 Components Per 2/26/2025’s Close:
1 – CE
2 – MRNA
3 – WST
4 – FMC
5 – SWKS
6 – EIX
7 – LW
8 – AMD
9 – ENPH
10 – AES
Highest Volume Rated S&P 500 Components Per 2/26/2025’s Close:
1 – SRE
2 – AXON
3 – FSLR
4 – KEYS
5 – INTU
6 – WDAY
7 – VRSK
8 – HSIC
9 – CPAY
10 – AMCR
Lowest Volume Rated S&P 500 Components Per 2/26/2025’s Close:
1 – UBER
2 – PANW
3 – JNPR
4 – NWS
5 – CVS
6 – EW
7 – HOLX
8 – SPGI
9 – SWK
10 – RVTY
Highest Technical Rated ETFs Per 2/26/2025’s Close:
1 – BABX
2 – YINN
3 – BOIL
4 – XPP
5 – KTEC
6 – UNG
7 – ETHD
8 – CWEB
9 – ETQ
10 – SMCX
Lowest Technical Rated ETFs Per 2/26/2025’s Close:
1 – MSOX
2 – YANG
3 – BCHG
4 – KOLD
5 – CONL
6 – AMDL
7 – MRNY
8 – CNBS
9 – FXP
10 – CONY
Highest Volume Rated ETFs Per 2/26/2025’s Close:
1 – LCTD
2 – LITP
3 – UTWY
4 – RULE
5 – CNAV
6 – MFUL
7 – HAPS
8 – SHRT
9 – PJBF
10 – IPAV
Lowest Volume Rated ETFs Per 2/26/2025’s Close:
1 – THIR
2 – CVRD
3 – PSCQ
4 – TSEC
5 – TBFC
6 – PBJA
7 – TRTY
8 – IQSM
9 – MINN
10 – APOC
Highest Technical Rated General Stocks Per 2/26/2025’s Close:
1 – PWRMF
2 – DOMH
3 – ATGL
4 – VNET
5 – TRIRF
6 – KC
7 – RAASY
8 – ZNOG
9 – STIM
10 – RGFC
Lowest Technical Rated General Stocks Per 2/26/2025’s Close:
1 – MULN
2 – CYN
3 – LGMK
4 – CHSN
5 – FTEL
6 – ACON
7 – WINT
8 – CDT
9 – WHLR
10 – TCBP
Highest Volume Rated General Stocks Per 2/26/2025’s Close:
1 – ENVB
2 – BTOG
3 – ONVO
4 – MULN
5 – MAMA
6 – SYTA
7 – QVCGB
8 – TRNR
9 – RENB
10 – FMTO
Lowest Volume Rated General Stocks Per 2/26/2025’s Close:
1 – WHTCF
2 – LANV
3 – QMCI
4 – LODFF
5 – GRAF
6 – KDLY
7 – NROM
8 – STLRF
9 – PRFX
10 – SANG
*** THE LIST ABOVE IS STRICTLY FOR INFORMATIONAL PURPOSES – I MAY OR MAY NOT HAVE OR INITIATE A LONG, SHORT, OR LONG/SHORT POSITION IN ANY NAME ABOVE AT ANY TIME ***
The VIX closed at 19.43, indicating an implied one day move of +/-1.22% & an implied one month move of +/-5.62% for the S&P 500.
Highest Technical Rated S&P 500 Components Per 2/25/2025’s Close:
1 – PLTR
2 – TPR
3 – GILD
4 – PM
5 – SOLV
6 – FOXA
7 – FOX
8 – TMUS
9 – FTNT
10 – RL
Lowest Technical Rated S&P 500 Components Per 2/25/2025’s Close:
1 – CE
2 – MRNA
3 – WST
4 – FMC
5 – SWKS
6 – EIX
7 – FSLR
8 – LW
9 – AMD
10 – AKAM
Highest Volume Rated S&P 500 Components Per 2/25/2025’s Close:
1 – SRE
2 – SOLV
3 – BSX
4 – PODD
5 – TT
6 – OTIS
7 – PWR
8 – SBAC
9 – AMT
10 – PSA
Lowest Volume Rated S&P 500 Components Per 2/25/2025’s Close:
1 – ALL
2 – CTVA
3 – RVTY
4 – BA
5 – GNRC
6 – ROK
7 – JNPR
8 – FRT
9 – HOLX
10 – TEL
Highest Technical Rated ETFs Per 2/25/2025’s Close:
1 – BABX
2 – BOIL
3 – YINN
4 – UNG
5 – XPP
6 – MSTZ
7 – SMST
8 – KTEC
9 – AMDS
10 – KSTR
Lowest Technical Rated ETFs Per 2/25/2025’s Close:
1 – MSOX
2 – KOLD
3 – BCHG
4 – YANG
5 – CONL
6 – AMDL
7 – MRNY
8 – CNBS
9 – CONY
10 – ZCSH
Highest Volume Rated ETFs Per 2/25/2025’s Close:
1 – LIAG
2 – UNIY
3 – BMVP
4 – IMAY
5 – ISEP
6 – EMEQ
7 – IPAV
8 – OVT
9 – SHRT
10 – ZIG
Lowest Volume Rated ETFs Per 2/25/2025’s Close:
1 – CCNR
2 – QMAG
3 – TBFC
4 – TSEC
5 – QCAP
6 – TOAK
7 – FCA
8 – ARP
9 – IIGD
10 – CARK
Highest Technical Rated General Stocks Per 2/25/2025’s Close:
1 – SXTC
2 – DOMH
3 – ONVO
4 – PWRMF
5 – VNET
6 – ZNOG
7 – STEC
8 – KC
9 – RAASY
10 – ATGL
Lowest Technical Rated General Stocks Per 2/25/2025’s Close:
1 – MULN
2 – CYCU
3 – CYN
4 – NKLA
5 – CHSN
6 – FTEL
7 – GCTK
8 – LGMK
9 – ACON
10 – LTRPB
Highest Volume Rated General Stocks Per 2/25/2025’s Close:
1 – ONVO
2 – WAFU
3 – FMTO
4 – BREA
5 – LVTX
6 – GTBP
7 – ADIL
8 – MFI
9 – RDHL
10 – VERO
Lowest Volume Rated General Stocks Per 2/25/2025’s Close:
1 – DBIN
2 – CYTOF
3 – PSYTF
4 – EDSA
5 – BRYFF
6 – PLSDF
7 – PLLTL
8 – NHYKF
9 – AHOTF
10 – OPWEF
*** THE LIST ABOVE IS STRICTLY FOR INFORMATIONAL PURPOSES – I MAY OR MAY NOT HAVE OR INITIATE A LONG, SHORT, OR LONG/SHORT POSITION IN ANY NAME ABOVE AT ANY TIME ***