After a week that was centered around earnings, the Fed announcements & climate discussions, stocks generally continued to climb higher.
With more earnings calls to come this week, it seems that we are positioned for more of the same market action.
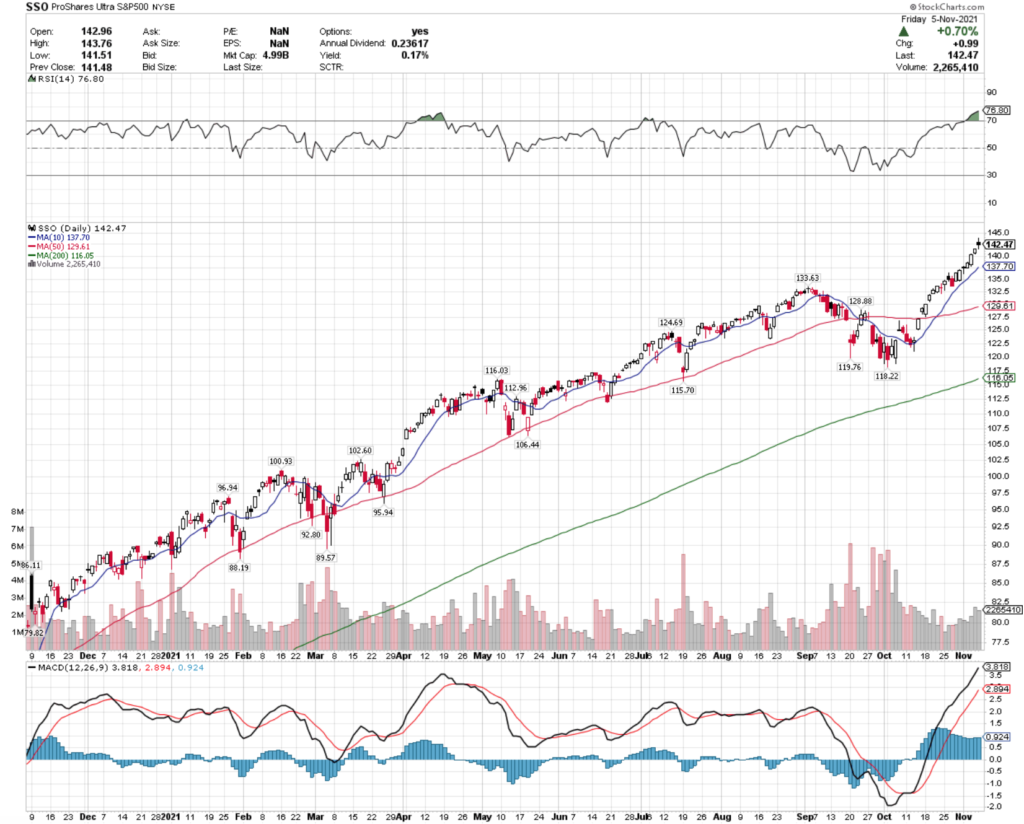
Interestingly enough, both major indexes closed lower than they opened by the end of the day Friday, but still accomplished day over day gains (SSO & QLD pictured).
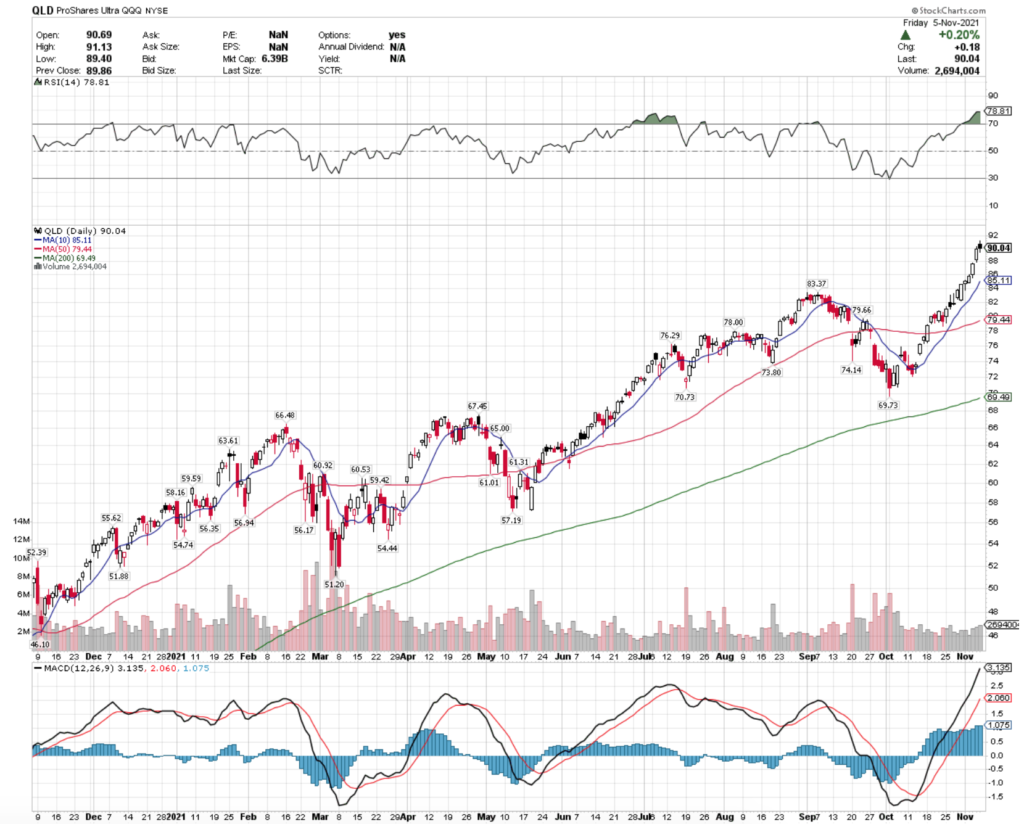
It will be interesting to see if that risk-off sentiment continues into next week & if investors will be interested in taking their gains & going home safely by the end of another earnings week.
Homebuilders & Supplies (NAIL), RoboCar Disruptors (VCAR), Pharmaceutical & Medical (PILL) & Basic Materials (UYM) Stocks & ETFs Leading The Charge
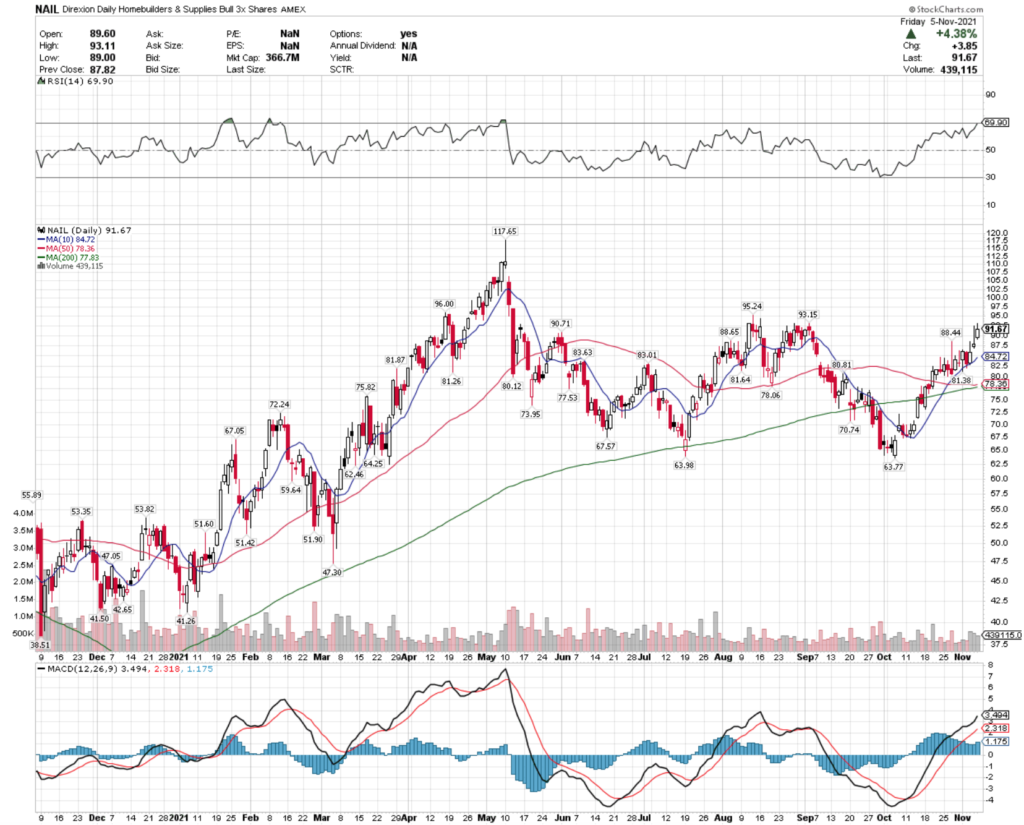
ETFs focused on homebuilders & their suppliers have been experiencing a bit of good fortune in the recent times, with NAIL, the Direxion Daily Homebuilders & Supplies Bull 3X Shares ETF continuing to climb higher.
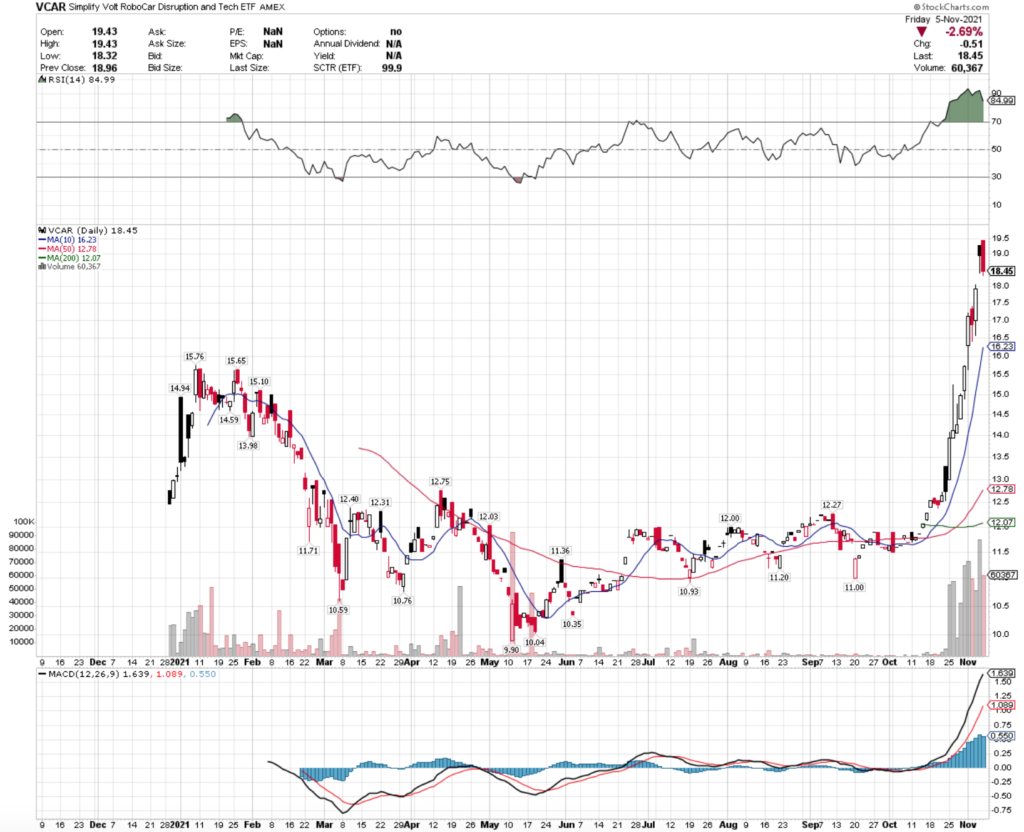
Robotic Cars also continued to climb higher sharply this week, despite negative/uncertain news circulating about Workhorse WKHS stock, amongst other names in the space.
VCAR, the Simplify Volt RoboCar Disruption & Tech ETF saw much stronger volume than average, although their RSI is overbought, so there may be some near-term drops as a new price range is established.
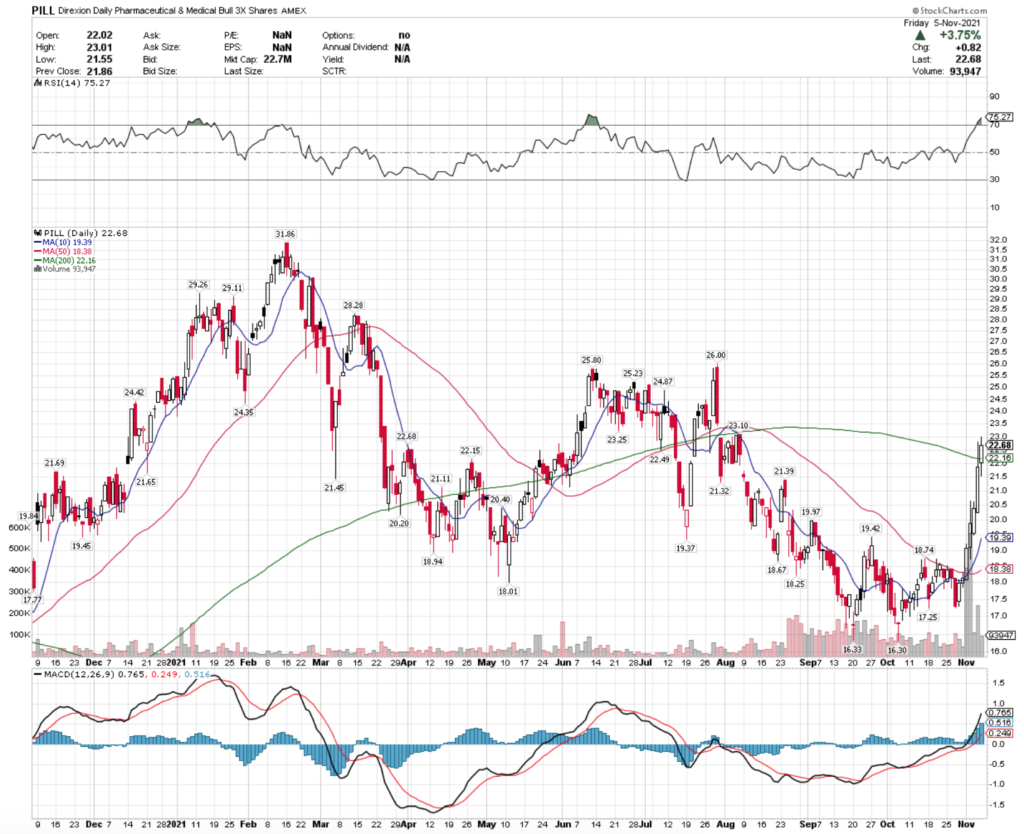
It comes as no surprise that Pharmaceutical & Medical names have been having strength recently.
PILL, the Direxion Daily Pharmaceutical & Medical Bull 3X Shares ETF climbed higher this week on above average trading volume.
This is another one that is in overbought territory based on their RSI though, so investors may think to time an entry after they settle into a new range, instead of chasing the tail end of recent momentum.
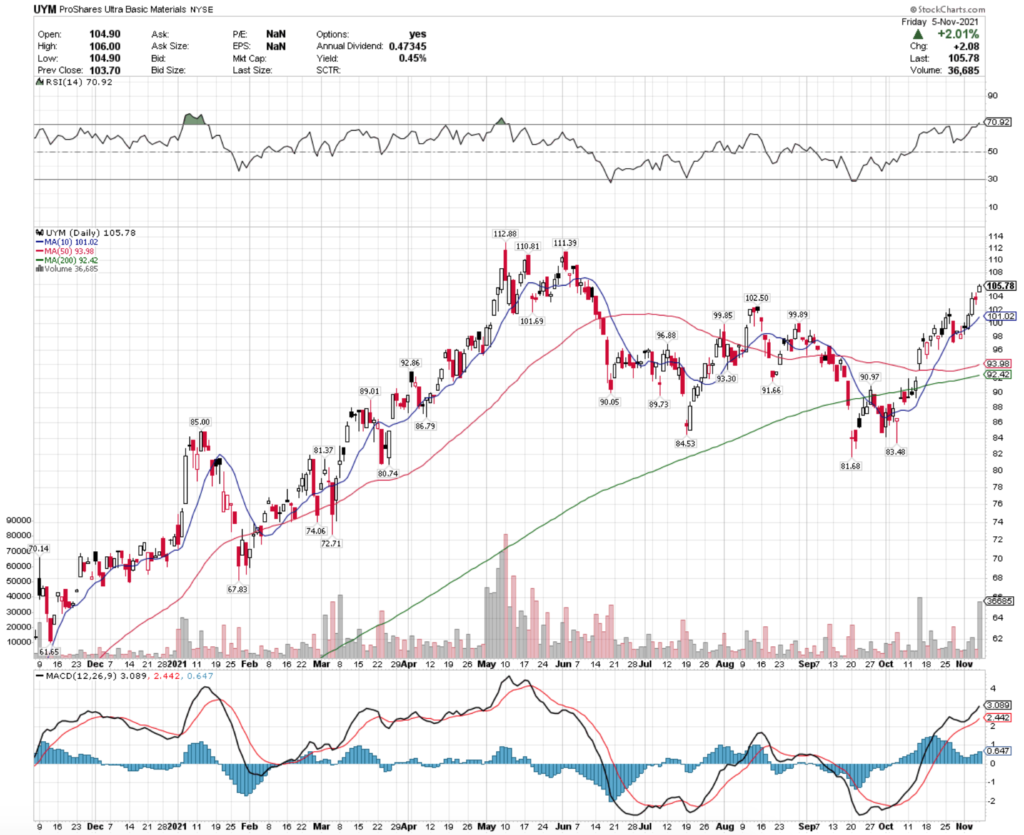
Basic Materials stocks also have been experiencing strength in the last month.
UYM ETF, the ProShares Ultra Basic Materials ETF continued to climb higher, with above average volume on Friday’s gains.
However, I would be keeping an eye on their MACD that is beginning to turn over a bit, and also their 50 & 200 Day Moving Averages which are just over 1% apart from one another.
The MA’s should separate further in the coming days, but with a slightly overbought RSI this one may warrant buying some puts as well to be safe.
Of course, there are other ETFs out there that cover the same niches of the market, some of which may be better suited to your portfolio’s risk profile.
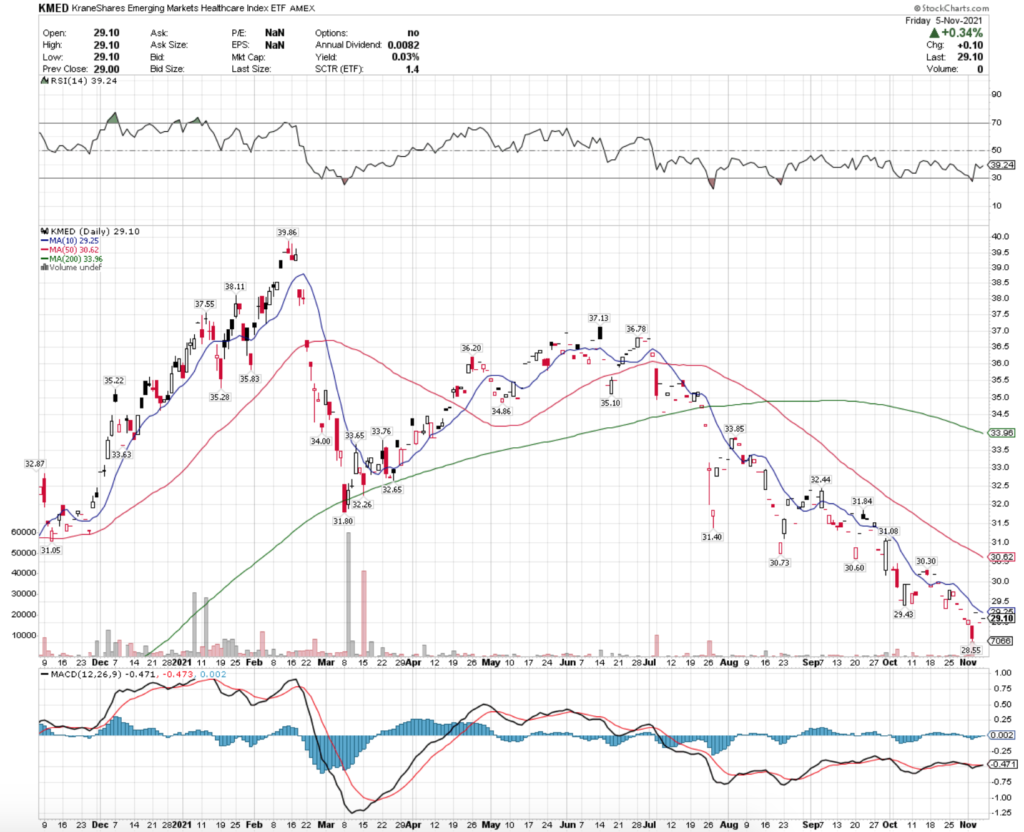
Emerging Markets Healthcare (KMED), Social Media (SOCL), Steel (SLX) & Short-SPAC (SOGU) ETFs Are All Lagging The Market Trends
Interestingly enough, while PILL has climbed, the KMED ETF has been lagging.
This is in-line with general sentiment around emerging markets at the moment, but does not align with the broader bullishness in the healthcare & pharmaceutical space.
Social Media companies have come under more fire & scrutiny than usual recently, leading to a dip in SOCL since mid-October.
Their volume has been lighter than average recently, with prices seeing stability in the $61-62 range, needing to be able to break out above $62 to reverse course.
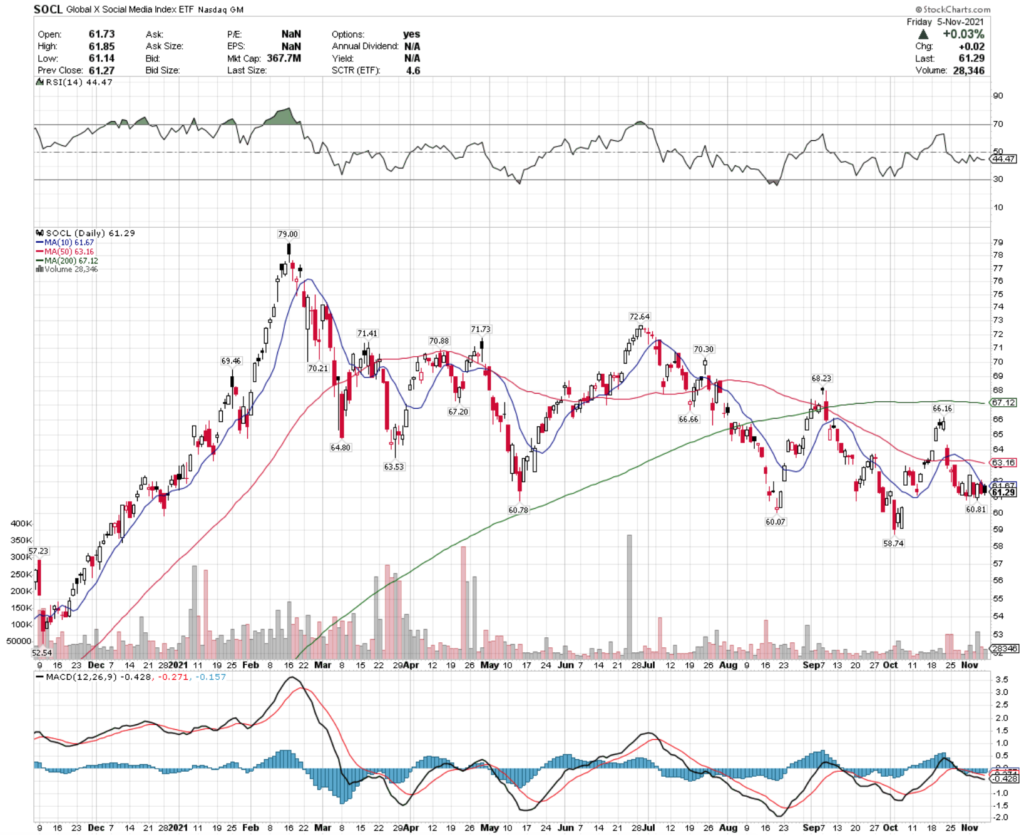
With a relatively neutral RSI, SOCL could begin to climb again in the near-term, although I would be focusing on the relationship between the 10 & 50 Day Moving Averages before deciding an entry-point & consider also having some puts for protection from potential further price declines.
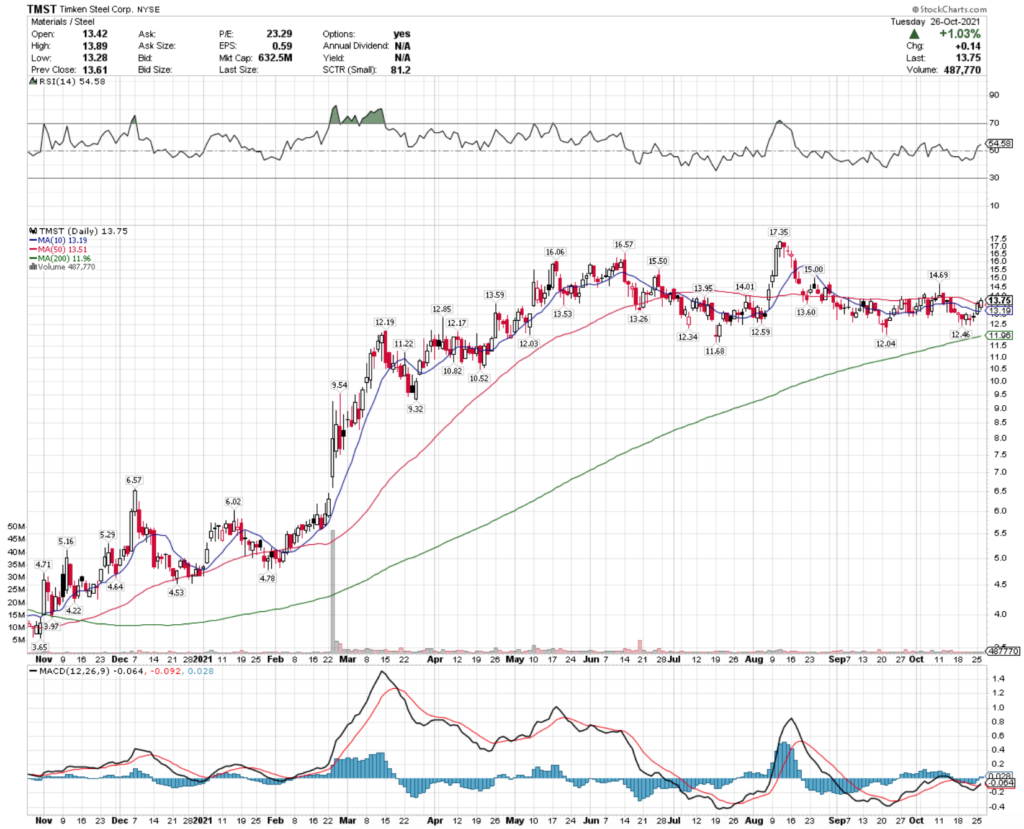
Another interesting lagger is SLX, the VanEck Vectors Steel ETF.
Despite builders, suppliers & basic materials names climbing, steel here is underperforming.
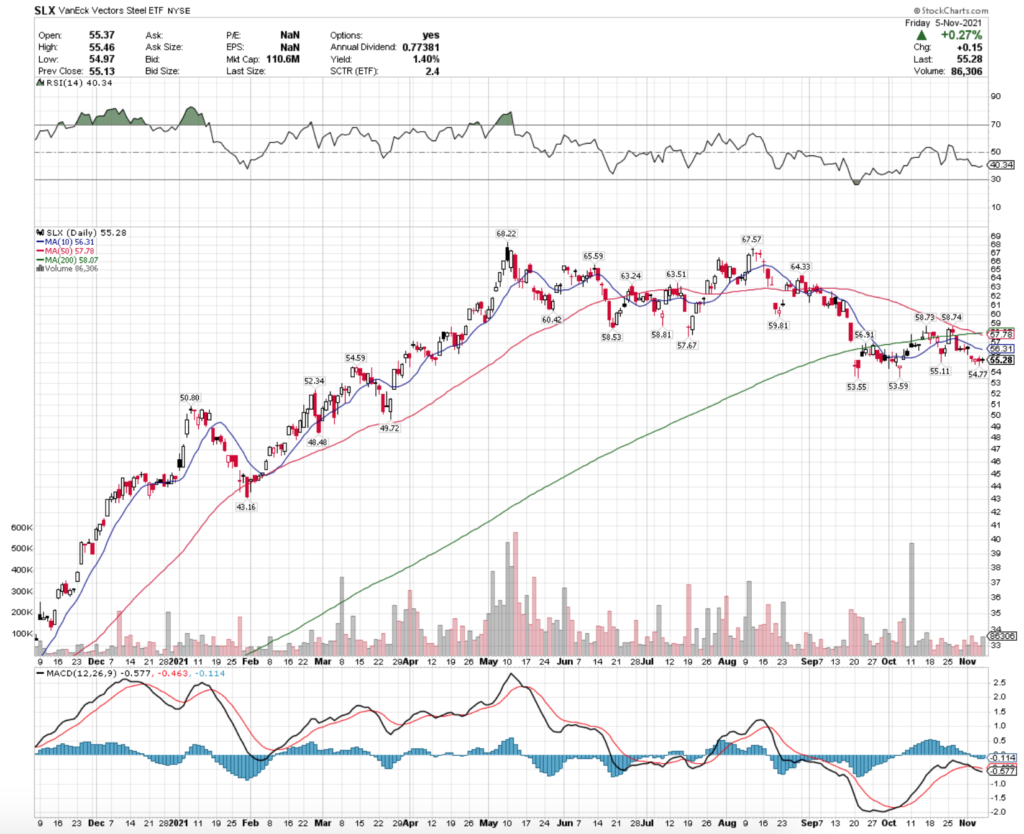
SLX is also trading on below average volume, with a slightly oversold RSI.
Lastly, the short-SPAC ETF SOGU has also been lagging, meaning that the 25 SPAC-names they track are outperforming or there is good sentiment behind them.
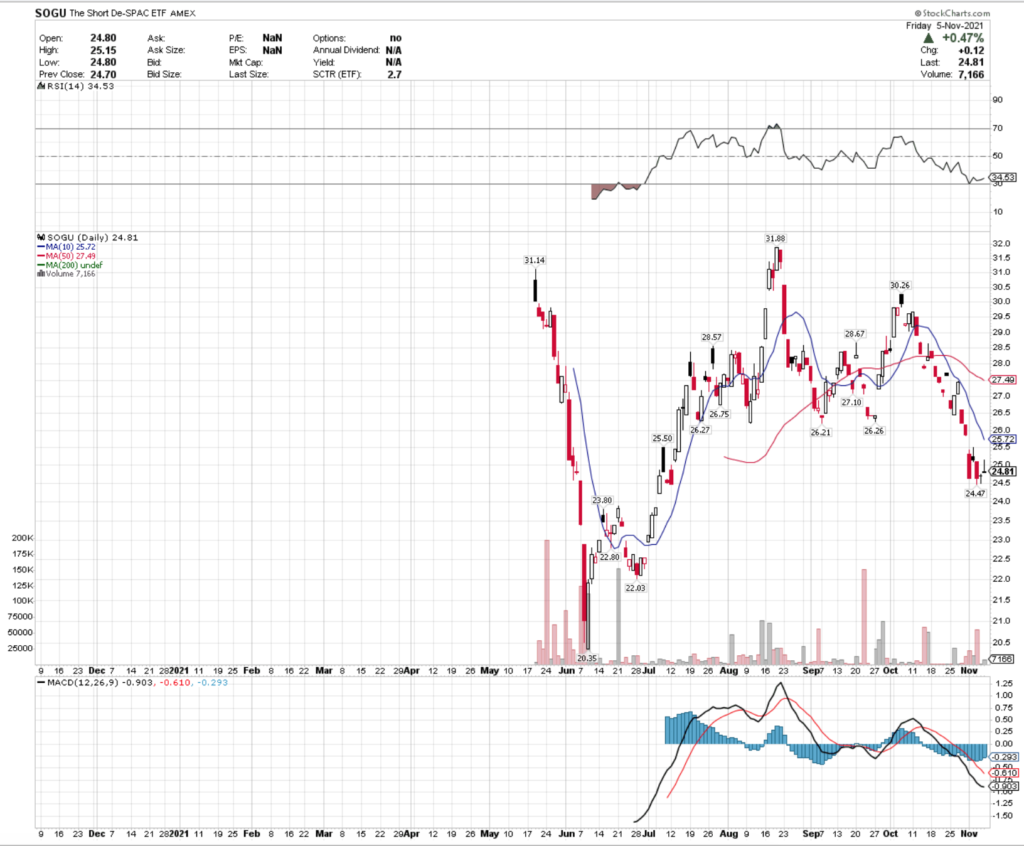
SOGU’s RSI is about to enter very-oversold territory, but there is limited data available on them as they began trading in May.
Tying It All Together
As mentioned prior, I try not to repeat names & sectors/industries week over week in order to cover the broadest amount of relevant information.
While ETFs are not perfect trackers of market sentiment, a lot can be inferred about specific areas of the broader markets by tracking their performance.
Given that we are still in earnings season, it is important to watch the technicals of these ETFs & how they move in relation to news about specific companies that are held in their basket.
It is also important to then check how much the % change is compared to the % of the basket that is held in each individual stock, as this may present opportunities to get in at better prices than the ETFs true, current value.