Sun Communities, Inc. stock trades under the ticker SUI & has shown recent bullish behavior that traders & investors should research further into.
SUI stock closed at $160.52/share on 7/23/2022.
Sun Communities, Inc. SUI Stock’s Technical Performance Broken Down
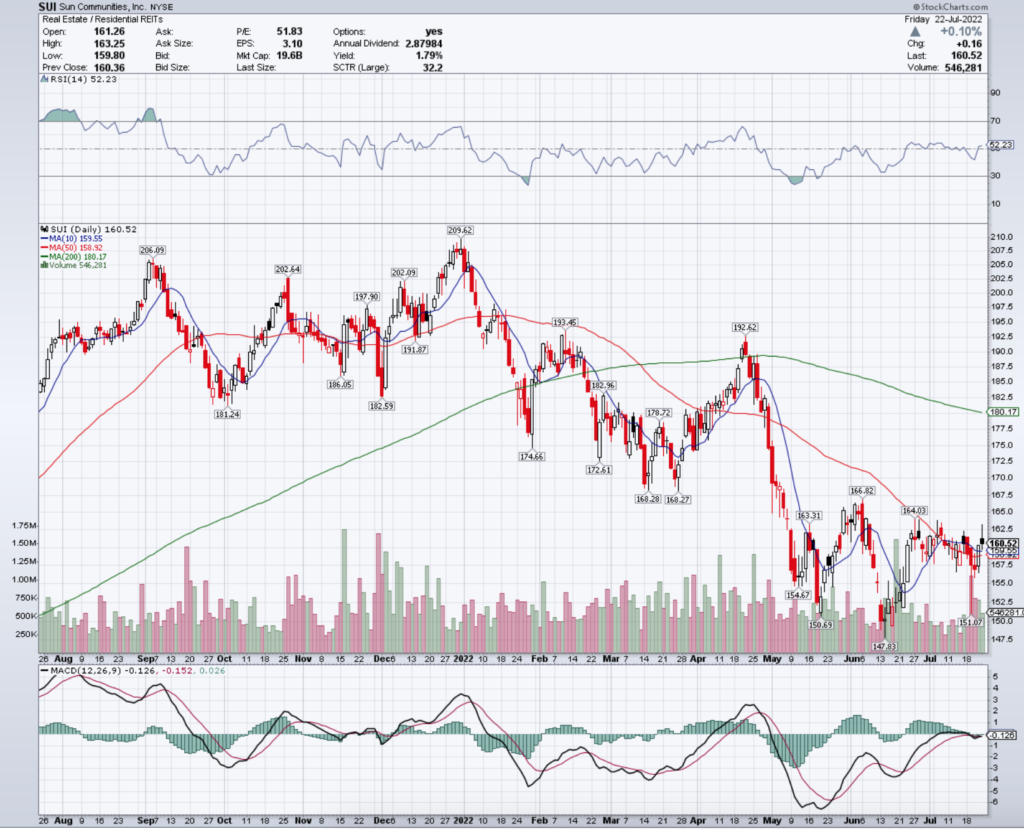
SUI Stock Price: $160.52
10 Day Moving Average: $159.55
50 Day Moving Average: $158.92
200 Day Moving Average: $180.17
RSI: 52.23
MACD: -0.126
On Friday, SUI stock completed a bullish MACD crossover, settling above its 10 day moving average.
Their recent trading volumes have been about average for the last year, which paired with a neutral RSI signals there may be more near-term strength to come.
They need to break above the $163.31 & $164.03/share resistance levels to continue climbing higher.
Sun Communities, Inc. SUI Stock As A Long-Term Investment
Long-term oriented investors may find SUI stock’s valuation metrics to be a bit rich, with a 51.12 P/E (ttm) & a 2.98 P/B (mrq).
They recently reported 23.8% Quarterly Revenue Growth Y-o-Y, although their -97.2% Quarterly Earnings Growth Y-o-Y should be researched further before making an investment.
Their balance sheet will also require an additional review, with $116M of Total Cash (mrq) & $6.21B of Total Debt (mrq).
SUI stock pays a 2.10% dividend, which may not be sustainable in the long-run, with a 107% payout ratio.
Still, 98.5% of SUI stock’s outstanding share float is owned by institutional investors.
Sun Communities, Inc. SUI Stock As A Short-Term Trade Using Options
Short-term oriented traders can trade options to profit from price movements in SUI stock, while hedging against broader market volatility.
I am looking at the contracts with the 8/19 expiration date.
The $160 call options are in-the-money, while the out-of-the-money $165 & $170 strike prices also have open interest.
The $165 puts are also in-the-money, with liquidity in the out-of-the-money $160 & $155 strikes as well.
Tying It All Together
SUI stock has many interesting characteristics that traders & investors are sure to like.
Investors will like their dividend yield (should it remain sustainable) & strong institutional support, but may want to dig deeper into their balance sheet.
Traders will like their recent technical strength amid volatility, but will be disappointed by the liquidity of their options.
Overall, SUI stock is worth taking a closer look at to see how it fits into your portfolio strategy.
*** I DO NOT OWN SHARES OF SUI STOCK AT THE TIME OF PUBLISHING THIS ARTICLE ***