Sysco Corp. SYY Stock Analysis

Sysco Corp. stock trades under the ticker SYY & has shown recent bullishness that traders & investors should research further.

SYY stock closed at $85.57/share on 6/24/2022.

Sysco Corp. SYY Stock’s Technical Performance Broken Down

Sysco Corp. SYY Stock's Technical Performance Over The Last Year

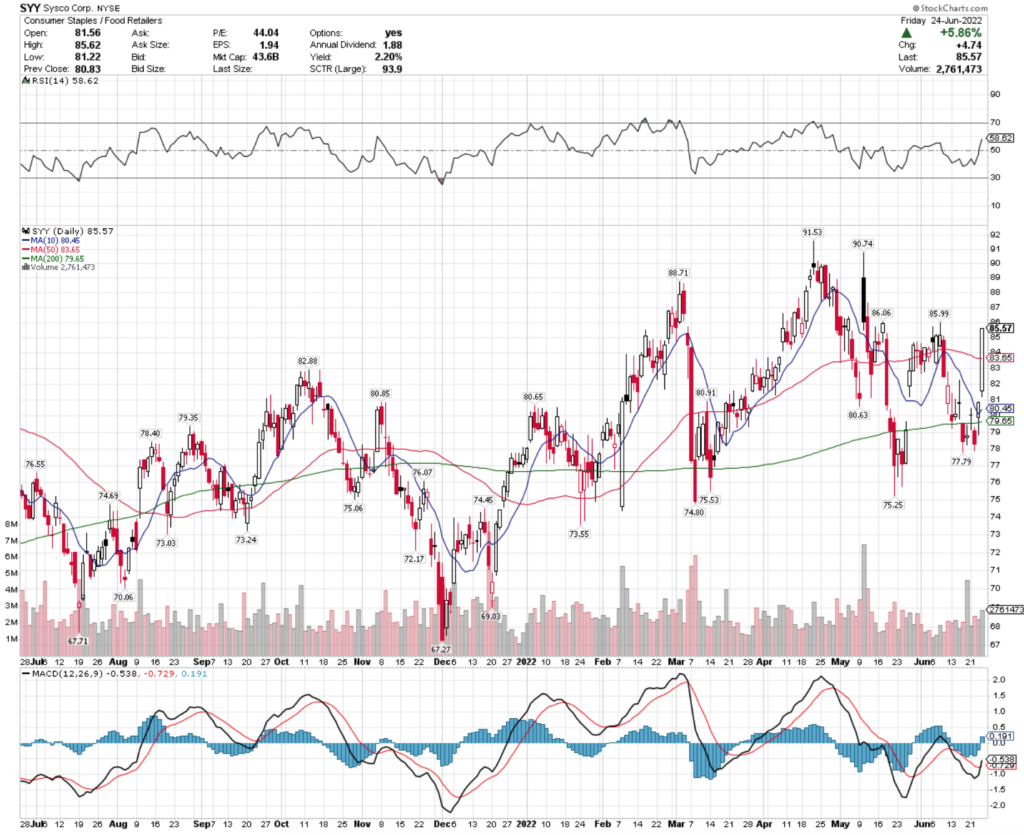
SYY Stock Prive: $85.57

10 Day Moving Average: $80.45

50 Day Moving Average: $83.65

200 Day Moving Average: $79.65

RSI: 58.62

MACD: -0.538

On Friday, SYY stock completed a bullish MACD crossover, gapping up 5.86% to break out above its 50 day moving average.

Their recent trading volume has been below average & their RSI is on the higher end of neutral, signaling that there may still be some near-term momentum.

SYY needs to break out above the $85.99 & $86.06 resistance levels as it continues to climb.

Sysco Corp. SYY Stock As A Long-Term Investment

Long-term oriented investors may find SYY stock’s valuation metrics to be a bit higher than they’d like, with a 41.27 P/E (ttm) & a P/B (mrq) of 30.87.

They recently reported 42.9% Quarterly Revenue Growth Y-o-Y, with 241.1% Quarterly Earnings Growth Y-o-Y.

Their balance sheet also will require a closer examination, with $876.14M of Total Cash (mrq) & $11.93B of Total Debt (mrq).

SYY stock pays a 2.33% dividend yield, which may not be sustainable in the long-run, as their payout ratio is 96.91%.

85.94% of SYY stock’s outstanding share float is owned by institutional investors.

Sysco Corp. SYY Stock As A Short-Term Trade Using Options

Short-term oriented traders can use options to profit from SYY stock’s price movements, while protecting themselves from external market volatility.

I am looking at the contracts with the 7/15 expiration date.

The $85, $83 & $84 call options are all in-the-money, listed in order of highest to lowest open interest.

The $90 & $86 puts are also in the money, with the most liquid strike being the $85 contracts, which are not in the money.

As they have weekly expirations, there should be more liquidity in their options contracts as weekly expirations pass & new contracts are written.

Tying It All Together

Sysco Corp. stock has many interesting characteristics that traders & investors may find appealing.

Investors will like their growth, but may be disappointed by their valuation metrics & balance sheet structure.

Traders will like their current momentum, but may be disappointed with the liquidity of their mid-range dated options.

Overall, it is worth taking a closer look at SYY stock to see how it fits into your portfolio strategy.

*** I DO NOT OWN SHARES OF SYY STOCK AT THE TIME OF PUBLISHING THIS ARTICLE ***

Mondelez International, Inc. MDLZ Stock Analysis

Mondelez International, Inc. stock trades under the ticker MDLZ & has shown recent bullishness that traders & investors should research further.

MDLZ stock closed at $61.04/share on 6/23/2022.

Mondelez International, Inc. MDLZ Stock’s Technical Performance Broken Down

Mondelez International, Inc. MDLZ Stock's Technical Performance Over The Last Year

Stock Price: $61.04

10 Day Moving Average: $59.73

50 Day Moving Average: $63.26

200 Day Moving Average: $62.66

RSI: 47.51

MACD: -1.022

Yesterday, MDLZ stock completed a bullish MACD crossover, notching a fourth straight day of gains.

Their RSI is still just below neutral, and their recent trading volumes have been above average compared to the year prior, signaling that there may be more short-term momentum to come.

They will need to break above the $62.43 resistance level as they continue to climb higher.

Mondelez International, Inc. MDLZ Stock As A Long-Term Investment

Long-term oriented investors should find MDLZ stock’s valuation metrics to be fair, with a 20.14 P/E (ttm), although some may think their P/B (mrq) is a bit rich at 2.94.

They recently reported 7.3% Quarterly Revenue Growth Y-o-Y, with -11% Quarterly Earnings Growth (Y-o-Y), which investors may want to dig deeper into.

Their balance sheet will require a closer review, with $1.97B of Total Cash (mrq) & $20.21B of Total Debt (mrq).

MDLZ stock pays a 2.26% dividend yield, which appears stable in the long-term, as their payout ratio is 45.96%.

79.73% of MDLZ stock’s outstanding share float is owned by institutional investors.

Mondelez International, Inc. MDLZ Stock As A Short-Term Trade Using Options

Short-term oriented traders can use options to profit from price movements in MDLZ stock, while hedging against broader market volatility.

I am looking at the contracts with the 7/15 expiration date.

The $60, $61 & $57.50 call options are all in-the-money, listed from highest to lowest levels of open interest.

The $62.50, $65 & $62 puts are also in-the-money, also listed by order of each strike’s liquidity.

Given that MDLZ stock has weekly contracts expirations, there will likely be more contracts written in the coming weeks as well.

Tying It All Together

MDLZ stock has many unique attributes that traders & investors should research further.

Investors will like their dividend yield, but may want to look closer into their balance sheet & valuation metrics.

Traders will like their current momentum, as well as how liquid their options are.

Overall, it is worth taking a closer look at MDLZ stock to see how it fits into your portfolio strategy.

*** I DO NOT OWN SHARES OF MDLZ STOCK AT THE TIME OF PUBLISHING THIS ARTICLE ***

Molson Coors Brewing Co. TAP Stock Analysis

Molson Coors Brewing Co. stock trades under the ticker TAP & has shown recent bullishness that traders & investors should investigate further.

TAP closed at $53.80/share on 6/23/2022.

Molson Coors Brewing Co. TAP Stock’s Technical Performance Broken Down

Molson Coors Brewing Co. TAP Stock's Technical Performance Over The Last Year

TAP Stock Price: $53.80

10 Day Moving Average:$51.81

50 Day Moving Average: $53.56

200 Day Moving Average: $48.88

RSI: 54.48

MACD: -0.376

Yesterday, TAP stock completed a bullish MACD crossover, breaking above its 50 day moving average, after a third straight day of gains.

Their recent trading volumes have been roughly average compared to the year prior, & their RSI is still neutral, signaling that there may be more near-term room to continue climbing higher.

They will need to break above the $54.28 & $54.50 resistance levels as they continue to climb higher.

Molson Coors Brewing Co. TAP Stock As A Long-Term Investment

Long-term focused investors will like TAP stock’s valuation metrics, with a 10.59 P/E (ttm) & a 0.84 P/B (mrq).

They recently reported 16.7% Quarterly Revenue Growth Y-o-Y, with 80.1% Quarterly Earnings Growth Y-o-Y.

Investors would be wise to review their balance sheet more thoroughly before investing though, with a reported $358.7M of Total Cash (mrq) & $7.49B of Total Debt (mrq).

TAP stock pays a 2.01% dividend yield, which appears stable in the long-run, as their payout ratio is 21.5%.

89.14% of TAP stock’s outstanding share float is owned by institutional investors.

Molson Coors Brewing Co. TAP Stock As A Short-Term Trade Using Options

Short-term oriented traders can use options to profit from price movements in TAP stock, while hedging against market volatility.

I am looking at the contracts with the 7/15 expiration date.

The $52.50, $50 & $47.50 call options are all in-the-money, listed in order of most to least liquid.

The $55, $65 & $60 puts are also all in-the-money, with the latter being much more liquid than the former.

The most liquid strike for TAP 7/15 options is slightly out-of-the-money, at $52.50, making it worth looking at if the price continues to drop.

Tying It All Together

TAP stock has many interesting characteristics that traders & investors should be sure to like.

Investors will like their valuation metrics & dividend yield, but may want to take a closer look into the makeup of their balance sheet.

Traders will like their current momentum, but may be disappointed in how illiquid some of their option’s contracts strike prices are.

Overall, it is worth taking a closer look at TAP stock to see how it fits into your portfolio strategy.

*** I DO NOT OWN SHARES OF TAP STOCK AT THE TIME OF PUBLISHING THIS ARTICLE ***

Seacoast Banking Corp. of Florida SBCF Stock Analysis

Seacoast Banking Corp. of Florida stock trades under the ticker SBCF & has shown recent bullishness that traders & investors should take a closer look into.

SBCF stock closed at $33.50/share on 6/22/2022.

Seacoast Banking Corp. of Florida SBCF Stock’s Technical Performance Broken Down

Seacoast Banking Corp. of Florida SBCF Stock's Technical Performance Over The Last Year

SBCF Stock Price: $33.50

10 Day Moving Average: $32.45

50 Day Moving Average: $33.20

200 Day Moving Average: $34.62

RSI: 53.6

MACD: -0.192

Yesterday, SBCF stock completed a bullish MACD crossover, notching a third straight day of gains.

Their recent trading volume has been above average compared to the year prior, and their RSI is still neutral, signaling that there may be more near-term bullish momentum.

They will need to test & break above the $34.09 & $34.25/share resistance levels as they continue to climb higher.

Seacoast Banking Corp. of Florida SBCF Stock As A Long-Term Investment

Long-term oriented investors will like SBCF stock’s valuation metrics, as their P/E (ttm) is 17.43, with a 1.51 P/B(mrq).

They recently reported -5.2% Quarterly Revenue Growth Y-o-Y, with -38.9% Quarterly Earnings Growth Y-o-Y, which may be cause for concern.

Their balance sheet is also very strong, with a reported $1.23B of Total Cash (mrq) & $192.64M of Total Debt (mrq).

SBCF stock pays a 1.56% dividend yield, which appears to be sustainable in the long-term, as their payout ratio is 27.23%.

85.83% of SBCF stock’s outstanding share float is owned by institutional investors.

Seacoast Banking Corp. of Florida SBCF Stock As A Short-Term Trade Using Options

Short-term oriented traders can use options to take advantage of SBCF stock’s price movement, while protecting themselves from broader market volatility.

SBCF stock’s options are all very illiquid, with the highest levels of open interest being for the 9/16/2022 contracts.

Currently, none of the strikes are in the money, but the $40 & $45 strikes have the most open interest.

Similar to the puts, where only the $25 & $30 strike prices have any open interest levels.

Given that this is 3 months away, I expect there to become more liquidity in the coming months.

Tying It All Together

SBCF stock has many unique characteristics that traders & investors are sure to find appealing.

Investors will like their valuation, balance sheet & dividend yield, but may want to look into their growth prospects before investing.

Traders will like their current technical resilience during a volatile market period, but will be disappointed by how illiquid their options are.

Overall, it is worth taking a closer look at SBCF stock to see how it fits into your portfolio strategy.

*** I DO NOT OWN SHARES OF SBCF STOCK AT THE TIME OF PUBLISHING THIS ARTICLE ***

Franklin Street Properties Corp. FSP Stock Analysis

Franklin Street Properties Corp. stock trades under the ticker FSP & has shown recent bullish behavior that traders & investors should research further.

FSP stock closed at $4.34/share on 6/17/2022.

Franklin Street Properties Corp. FSP Stock’s Technical Performance Broken Down

Franklin Street Properties Corp. FSP Stock's Technical Performance Over The Last Year

FSP Stock Price: $4.34

10 Day Moving Average: $4.21

50 Day Moving Average: $4.79

200 Day Moving Average: $5.13

RSI: 47.1

MACD: -0.188

On Friday, FSP stock completed a bullish MACD crossover, while breaking out above its 10 day moving average.

Their recent trading volume has been above average, and their RSI is still neutral, signaling that there may be more near-term bullish momentum to come.

FSP stock needs to test & break above the $4.58 & $4.73 resistance levels as it continues to climb higher.

Franklin Street Properties Corp. FSP Stock As A Long-Term Investment

Long-term investors will like FSP stock’s valuation metrics, with a 4.56 P/E (ttm) & 0.54 P/B (mrq).

They recently reported -28.4% Quarterly Revenue Growth Y-o-Y, which should raise investor’s eyebrows & cause them to research the reason further.

Their balance sheet will also require a closer examination, with $10.98M of Total Cash (mrq) & $515.04M of Total Debt (mrq).

FSP stock pays a 9.02% dividend yield, which appears sustainable in the long-run, as their payout ratio is 40.5%.

86.9% of FSP stock’s outstanding share float is owned by institutional investors.

Franklin Street Properties Corp. FSP Stock As A Short-Term Trade Using Options

Short-term oriented traders can trade options to profit from FSP stock’s price movements, while also protecting their portfolios from broader market volatility.

I am looking at the contracts with the 9/16 expiration date, as the nearer-dated contracts are too illiquid.

The $2.50 calls are in-the-money, but the largest open interest level is the $7.50, followed by the $5 strikes, which are both currently out-of-the-money.

The $5 puts are in-the-money & currently the only liquid strike price, although that should change as other expiration dates pass by.

Tying It All Together

FSP stock has many unique traits that investors & traders are sure to find appealing.

Investors will like their dividend yield, as well as their valuation metrics, but may want to review their balance sheet a bit closer before investing.

Traders will like their current momentum & technical setup, but be disappointed by how illiquid their options are.

All-in-all, FSP stock is worth taking a closer look into to see how it fits into your portfolio structure.

*** I DO NOT OWN SHARES OF FSP STOCK AT THE TIME OF PUBLISHING THIS ARTICLE ***

Costco Wholesale Corp. COST Stock Analysis

Costco Wholesale Corp. stock trades under the ticker COST & is worth taking a closer look into to see how it fits into your portfolio strategy.

COST stock closed at $446.69/share on 6/17/2022.

Costco Wholesale Corp. COST Stock’s Technical Performance Broken Down

Costco Wholesale Corp. COST Stock's Technical Performance Over The Last Year

COST Stock Price: $446.69

10 Day Moving Average: $461.19

50 Day Moving Average: $506.92

200 Day Moving Average: $509.53

RSI: 38.64

MACD: -11.696

COST stock’s MACD looks set to bearishly crossover in the coming days, and their recent trading volume has been above average compared to the prior year.

Their RSI is inching towards oversold territory, signaling that the losses may continue on into the coming days-to-weeks.

They will need to stay above the $440/share support level, else further downside movement is indicated.

Costco Wholesale Corp. COST Stock As A Long-Term Investment

Long-term oriented investors will find COST stock’s P/E (ttm) of 36.13 to be fair, but may find their 10.18 P/B (mrq) to be a bit too rich.

They recently reported 16.2% Quarterly Revenue Growth Y-o-Y, with 10.9% Quarterly Earnings Growth Y-o-Y.

Investors will like COST stock’s balance sheet, with $11.83B of Total Cash (mrq) & $9.04B of Total Debt (mrq).

COST stock pays a 0.72% dividend yield, which appears stable in the long-run, as their payout ratio is 25.8%.

69.1% of COST stock’s outstanding share float is owned by institutional investors.

Costco Wholesale Corp. COST Stock As A Short-Term Trade Using Options

Short-term oriented traders can use options to profit from COST stock’s price movements, while also hedging against broader market volatility.

I am looking at the contracts with the 7/15 expiration date.

The $435, $430 & $440 calls are all in-the-money, listed in order of largest to smallest open interest.

The $460, $465 & $450 puts are also all in-the-money, and are much more liquid than the calls, signaling bearish sentiment from the broader markets in the coming month.

Tying It All Together

COST stock has many interesting characteristics that traders & investors will find attractive.

Investors will like their balance sheet & dividend yield, but may find their valuation metrics to be higher than they’d like them to be.

Traders will like the liquidity of their options contracts, especially in these volatile market times.

All-in-all, COST stock is worth taking a closer look at to see how it can fit into your portfolio strategy.

*** I DO NOT OWN SHARES OF COST STOCK AT THE TIME OF PUBLISHING THIS ARTICLE ***

Intl Flavors & Fragrances IFF Stock Analysis

Intl Flavors & Fragrances stock trades under the ticker IFF & is worth taking a look at to see if it fits into your portfolio strategy.

IFF stock closed at $108.31/share on 6/17/22.

Intl Flavors & Fragrances IFF Stock’s Technical Performance Broken Down

Intl Flavors & Fragrances IFF Stock's Technical Performance Over The Last Year

IFF Stock Price: $108.31

10 Day Moving Average: $122.68

50 Day Moving Average: $125.76

200 Day Moving Average: $134.91

RSI: 23.2

MACD: -3.75

IFF stock has recently been in decline, trading on above average volume compared to the year prior.

Their RSI is currently oversold, but their MACD is still signaling bearishness, giving an opportunity to profit from put options, or to begin building or adding to an existing long position.

They need to break above the $112.69/share resistance level, before the $115.47/share level.

Intl Flavors & Fragrances IFF Stock As A Long-Term Investment

Long-term oriented investors may find IFF stock’s valuation metrics to be fair, with a 51.29 P/E (ttm) & a P/B (mrq) of 1.42.

They recently reported 30.9% Quarterly Revenue Growth Y-o-Y.

Their balance sheet will require a more thorough examination before investing, with $657M of Total Cash (mrq) & $12.44B of Total Debt (mrq).

IFF stock pays a 2.92% dividend yield, which may not be sustainable in the long-term, as their payout ratio is 82.4%.

95% of IFF stock’s outstanding share float is owned by institutional investors.

Intl Flavors & Fragrances IFF Stock As A Short-Term Trade Using Options

Short-term oriented traders can use options to hedge against market volatility, while profiting from movements in IFF stock’s price.

I am looking at the contracts with the 8/19 expiration date, as the July expiration contracts with open interest are out-of-the-money.

The $105 & $100 calls are in-the-money, although the $110 strike price is more liquid than both of the former strikes.

The $120, $115 & $125 put options are also in-the-money, with the former strike price being the most liquid & the latter being the least.

Tying It All Together

IFF stock has many interesting characteristics that traders & investors should find appealing.

Investors will like their valuation metrics & recently reported growth, but may want to look deeper into the structure of their balance sheet & sustainability of their dividend yield.

Traders will be disappointed with the liquidity of their options, but will find the rest of their technicals to be satisfactory, given the current state of broader markets.

Overall, IFF stock is worth taking a closer look into to see how it may fit into your portfolio strategy.

*** I DO NOT OWN SHARES OF IFF AT THE TIME OF PUBLISHING THIS ARTICLE ***

Petrochina Co. PTR Stock Analysis

Petrochina Co. stock trades under the ticker PTR & has remained stable during the last couple of months of market volatility.

PTR stock closed at $50.31/share on 6/16/2022.

Petrochina Co. PTR Stock’s Technical Performance Broken Down

PTR Stock Price: $50.31

10 Day Moving Average: $52.56

50 Day Moving Average: $49.45

200 Day Moving Average: $47.80

RSI: 46.9

MACD: 0.922

Yesterday, PTR stock completed a bearish MACD crossover, trading on about average volume compared to the year prior & gapping down 3.36%.

Their RSI is neutral, signaling that momentum can turn in either direction now, largely dependent on the broader markets.

PTR needs to stay above $50.12, as well as their 50 day moving average at $49.45 support level, else there looks to be more downward price movement to come.

Petrochina Co. PTR Stock As A Long-Term Investment

Long-term oriented investors will like PTR stock’s valuation metrics, with a 6.47 P/E (ttm) & a 0.51 P/B (mrq).

They recently reported 41.2% quarterly revenue growth Y-o-Y, with 40.9% quarterly earnings growth.

Their balance sheet will require a more thorough review before investment, with a reported $194.82B in Total Cash (mrq), and $471.92B of Total Debt (mrq).

PTR stock pays a 6.58% dividend yield, which appears stable in the long-term as their payout ratio is 39%.

2.73% of PTR stock is held by institutional investors.

Petrochina Co. PTR Stock As A Short-Term Trade Using Options

Short-term focused traders can use options to profit from PTR stock’s price movements in any direction, while also hedging against market volatility.

I am looking at the contracts with the 7/15 expiration date.

The $50, $45 & $40 cal options are all in-the-money, with the latter being the most liquid & the former having the lowest levels of open interest.

The $55 puts are the only strike that is currently in-the-money, but as today is an expiration day, there should be more contracts written in the coming days-weeks.

Tying It All Together

PTR stock has many characteristics that traders & investors will find interesting.

Investors will like their valuation metrics & dividend yield, but may want to do further research on their balance sheet before making an investment.

Traders will like their current technical set up, but may be disappointed by their low open interest levels on next month’s options contracts.

Overall, PTR stock is worth taking a closer look into to see how it fits into your portfolio strategy.

*** I DO NOT OWN SHARES OF PTR STOCK AT THE TIME OF PUBLISHING THIS ARTICLE ***

Weis Markets, Inc. WMK Stock Analysis

Weis Markets, Inc. stock trades under the ticker WMK & has shown recent bullishness that traders & investors should take a closer look into.

WMK stock closed at $76.82/share on 6/15/2022.

Weis Markets, Inc. WMK Stock’s Technical Performance Broken Down

Weis Markets, Inc. WMK Stock's Technical Performance Over The Last Year

WMK Stock Price: $76.82

10 Day Moving Average: $74.90

50 Day Moving Average: $78.10

200 Day Moving Average: $65.80

RSI: 53.15

MACD: -0.928

Yesterday, WMK stock completed a bullish MACD crossover, while breaking out above its 10 day moving average.

Their RSI is neutral & recent trading volume is about average compared to the year prior.

They will need to break above the $77.32 & $77.92 resistance levels as they continue to climb higher.

Weis Markets, Inc. WMK Stock As A Long-Term Investment

Long-term oriented investors will like WMK stock’s valuation metrics, with a 16.96 P/E (ttm) & a P/B (mrq) of 1.59.

They recently reported 9.7% quarterly revenue growth Y-0-Y, with 29.4% quarterly earnings growth Y-o-Y.

Their balance sheet looks strong, with $291.85M of Total Cash (mrq) & $203.72M of Total Debt (mrq).

WMK stock pays a 1.7% dividend yield, which appears stable in the long-run with a 29.2% payout ratio.

39.9% of WMK stock’s outstanding share float is owned by institutional investors.

Weis Markets, Inc. WMK Stock As A Short-Term Trade Using Options

Short-term focused traders can use options to profit from WMK stock’s price movements, while also protecting their portfolio from volatility.

I am looking at the contracts with the 7/15 expiration date.

The $75, $70 & $65 call options are all in-the-money, with the former being the most liquid & the latter the least.

The $80 puts are the only strike price in-the-money currently, but as tomorrow is an expiration date, there may be more contracts written in the coming week.

Tying It All Together

WMK stock has many interesting characteristics that traders & investors are both sure to find appealing.

Investors will like their valuation metrics, strong balance sheet & stable dividend yield.

Traders will like their current performance amid market volatility, but may be disappointed with how liquid their options are.

Overall, WMK stock is worth taking a closer look into to see how it fits into your portfolio strategy.

*** I DO NOT OWN SHARES OF WMK STOCK AT THE TIME OF PUBLISHING THIS ARTICLE ***

CatchMark Timber Trust, Inc. CTT Stock

CatchMark Timber Trust, Inc. stock trades under the ticker CTT & has shown recent bullish behavior amid broader market volatility.

CTT stock closed at $10.39/share on 6/14/2022.

CatchMark Timber Trust, Inc. CTT Stock’s Technical Performance Broken Down

CatchMark Timber Trust, Inc. CTT Stock's Technical Performance Over The Last Year

CTT Stock: $10.39

10 Day Moving Average: $11.43

50 Day Moving Average: $8.88

200 Day Moving Average: $8.85

RSI: 55.53

MACD: 0.755

Yesterday, CTT stock completed a bearish MACD crossover, just 2 weeks after a bullish gap up brought them up ~42%.

Their last 5 days’ downward performance was heavily influenced by the broader market’s performance.

CTT stock’s RSI has returned from being overbought to neutral & they continue to trade on above average volume compared to the year prior.

They will need to retest & break above the $10.70, $10.80 & $10.93/share resistance levels as they try to climb back above $11/share in the near-term.

CatchMark Timber Trust, Inc. CTT Stock As A Long-Term Investment

Long-term oriented investors will like CTT stock’s valuation metrics, with a 6.16 P/E (ttm) & a 1.95 P/B (mrq).

They recently reported -3.1% Quarterly Revenue Growth Y-o-Y.

Their balance sheet reflects that they are a small cap stock, but should be further reviewed before investing, as they report having $30.35M of Total Cash (mrq) & $301M of Total Debt (mrq).

CTT stock pays a 2.91% dividend yield, which appears stable in the long-run, with a 32.81% payout ratio.

78.9% of CTT stock’s outstanding share float is owned by institutional investors.

CatchMark Timber Trust, Inc. CTT Stock As A Short-Term Trade Using Options

Short-term focused traders can use options to profit from CTT stock’s price movements in any direction, while also protecting themselves from broader market volatility.

I am looking at the contracts with the 6/17 expiration date.

The $10, $7.50 & $5 calls are all in-the-money, with the latter 2 being much less liquid than the former strike price.

The $12.50 puts are the only strike that are currently in-the-money, and the $10 strike is ~4% lower, which it would need to fall within 2 days to become in-the-money.

Tying It All Together

CTT stock offers many interesting characteristics that traders & investors will find appealing.

Investors will like their valuation metrics, as well as their dividend yield, but will want to review their balance sheet closer before investing.

Traders will like their recent technical performance amid a volatile market, but may be disappointed by the low levels of open interest on their options contracts.

All-in-all, it is worth taking a closer look at CTT stock to see how it can fit into your portfolio strategy.

*** I DO NOT OWN SHARES OF CTT STOCK AT THE TIME OF PUBLISHING THIS ARTICLE ***