Stepan Co. stock trades under the ticker SCL & has shown recent bullishness that traders & investors should look closer into.
SCL stock closed at $99.26/share on 7/14/2022.
Stepan Co. SCL Stock’s Technical Performance Broken Down
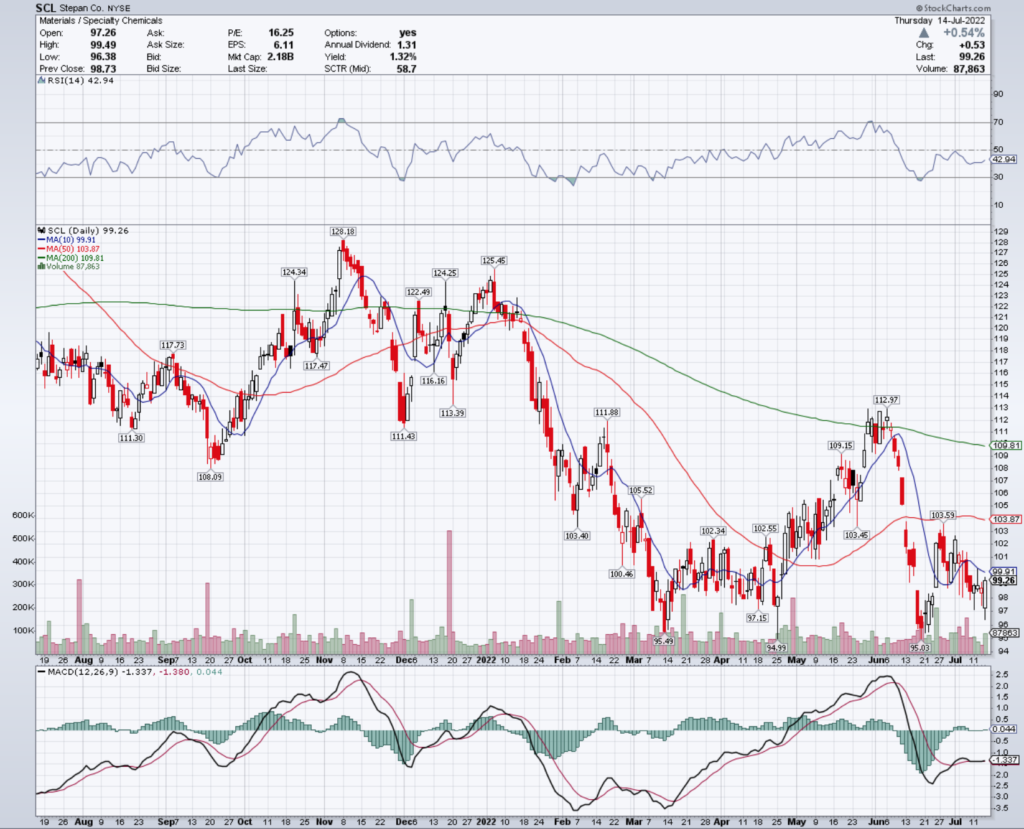
SCL Stock Price: $99.26
10 Day Moving Average: $99.91
50 Day Moving Average: $103.87
200 Day Moving Average: 109.81
RSI: 42.94
MACD: -1.337
Yesterday, SCL stock completed a bullish MACD crossover, trading at about average volume compared to the year prior.
Their RSI is still on the oversold side of neutral, signaling that there may be more bullish momentum to come in the near-term.
SCL will need to break above the $100.46 & $102.34/share resistance levels to continue climbing higher.
Stepan Co. SCL Stock As A Long-Term Investment
Long-term oriented investors will like SCL stock’s valuation metrics, with a P/E (ttm) of 16.11 & a P/B (mrq) of 1.97.
They recently reported 25.6% Quarterly Revenue Growth Y-o-Y, with 10.3% Quarterly Earnings Growth Y-o-Y.
Their balance sheet will require a closer review, reporting $236.04M of Total Cash (mrq), with $605.5M of Total Debt (mrq).
SCL stock pays a 1.3% dividend yield, which appears stable in the long-run, as their payout ratio is 20.95%.
80.3% of SCL stock’s outstanding share float is owned by institutional investors.
Stepan Co. SCL Stock As A Short-Term Trade Using Options
Short-term oriented traders can use options to profit from SCL stock’s price movements, while hedging against broader market volatility.
I am looking at the contracts with the 9/16 expiration date.
The $75, $85 & $80 call options are all in-the-money, listed from highest to lowest levels of open interest.
The $100 & $115 puts are also in-the-money, with the former being more liquid than the latter.
As there are 2 other expiration dates between now & 9/16, there should be more contracts being written in the coming months.
Tying It All Together
Stepan Co. stock has many interesting characteristics that traders & investors are sure to like.
Investors will like their dividend yield & valuation metrics, but may want to review their balance sheet further before making an investment.
Traders will like their technical set up, but may want to wait to see if their contracts become more liquid in the coming weeks as other expiration dates pass.
Overall, it is worth seeing how SCL stock fits into your portfolio strategy.
*** I DO NOT OWN SHARES OF SCL STOCK AT THE TIME OF PUBLISHING THIS ARTICLE ***