Everi Holdings, Inc. stock produces technology for the casino, gaming & interactive industries & trades under the ticker EVRI.
EVRI stock closed at $23.60/share on 8/12/21, showing signals of both short & long-term bullishness.
Everi Holdings, Inc EVRI Stock Technical Performance
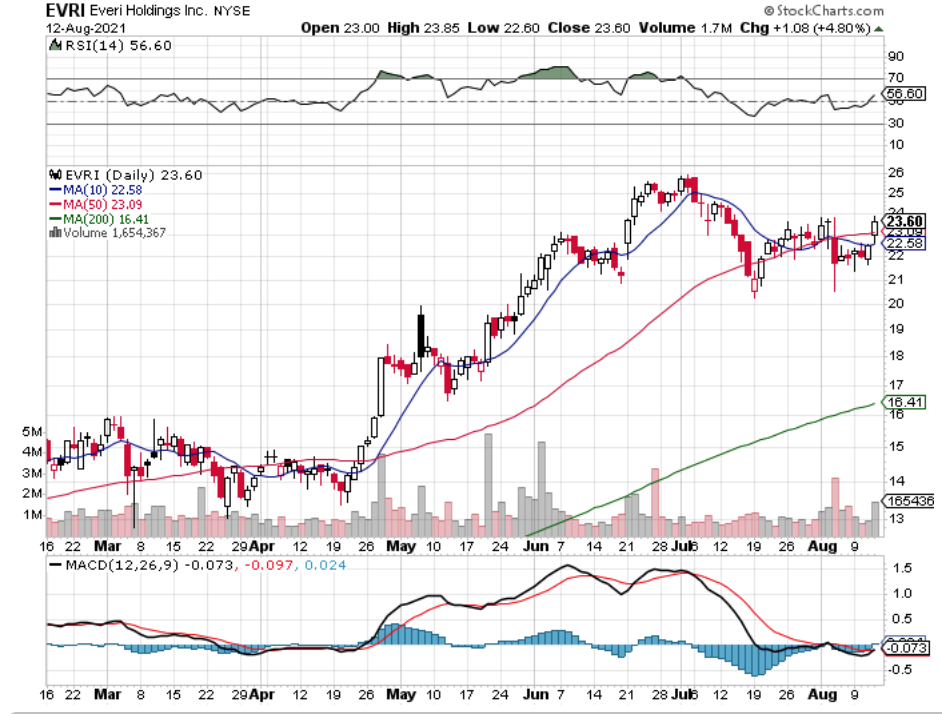
EVRI Stock Price: $23.60
10 Day Moving-Average: $22.58
50 Day Moving-Average: $23.09
200 Day Moving-Average: $16.41
RSI: 56.6
MACD: -0.073
EVRI stock’s price just broke out over their 50 Day Moving-Average, with the 10 Day MA 2% away from making the same bullish cross.
In August they have traded at higher volume than average for the rest of the past year as well, adding to this sentiment.
Yesterday they completed a bullish MACD crossover, making them look even more appealing as they continue to ride out positive momentum.
Once they break beyond the $23.77 level, I’ll be watching them test the $24.60 level next.
Everi Holdings, Inc. EVRI As A Long-Term Investment
Everi Holdings, Inc. has a P/E (ttm) of 40.69 & a P/B of 36.98.
For a firm that builds technology these are not too high for comfort, as their P/E is reasonable & their costs of equipment etc… are fairly low compared to other niches & industries.
However, investors should be weary of their Debt/Equity (mrq) which is awfully high, as is seen with their Total Debt (mrq) vs. Total Cash levels.
They do have solid underlying trend support from their 200 Day Moving-Average though.
Trading Everi Holdings, Inc. Options
I am looking at the $22.50 calls with the 8/20 expiration, as well as the $25 strike price as well.
These levels have solid Open Interest & Volume levels, making it easier to buy & sell them than other options.
For puts, I may think to look out to the following month’s expiration date, as I’m not certain that this momentum will let up before next Friday’s expiration.
Even the September puts are still very low in open interest, although more contracts will likely be written between now & mid-next week.
Tying It All Together
All-in-all, Everi Holdings, Inc. stock looks to be a great trade idea for both short-term traders & long-term investors alike.
EVRI stock looks set to continue a healthy climb, although there may be some bumps along the way next month.
Regardless, EVRI is definitely worth taking a closer look at by any market participant.
*** I DO NOT OWN SHARES OF EVRI STOCK ***