Wynn Resorts Ltd. stock trades under the ticker WYNN & has recently shown signs of short-term technical strength.
WYNN stock closed at $96.14/share on 8/9/2021, completing a bullish MACD crossover, with an oversold RSI.
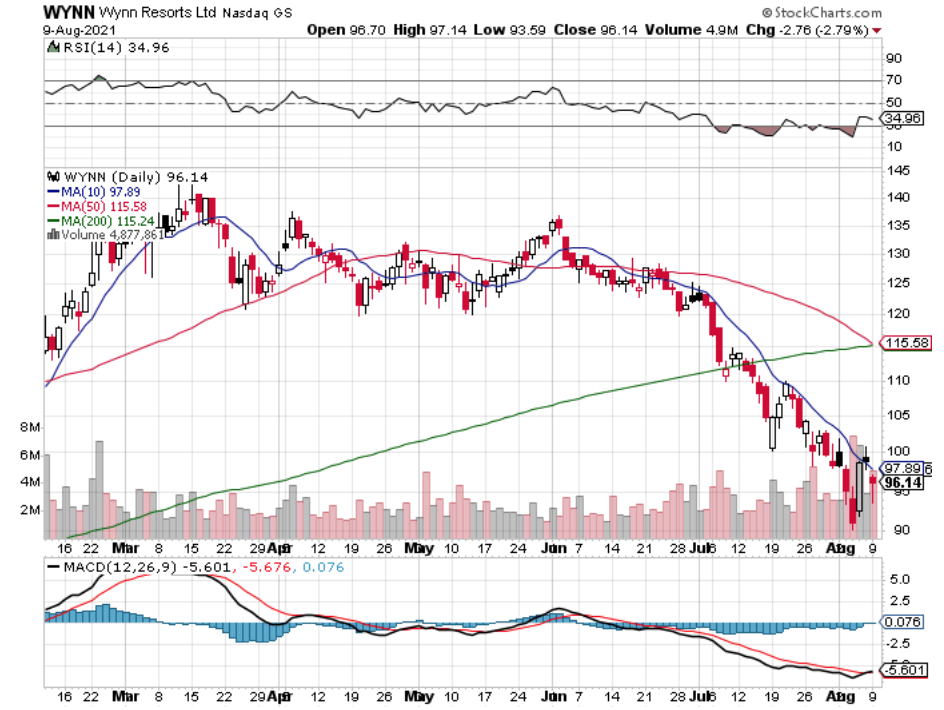
WYNN Stock Price: $96.14
10 Day Moving-Average: $97.89
50 Day Moving-Average: $115.58
200 Day Moving-Average: $115.24
RSI: 34.96
MACD: -5.6
While their chart is not the prettiest, WYNN looks poised to bounce & regain some lost ground while establishing a new range.
Their 50 Day Moving-Average will break the 200 Day MA bearishly, which will cause some more pain as the new range is established.
However, given that they are now oversold at the RSI, WYNN should begin to trend back up.
Long-Term investors can use this price level as a means to establish a solid position or add to an existing one.
Short-term traders & options traders can take advantage of the bounce to gain some quick profits.
I am looking at the $97.50 9/18 Exp. call options, although their Theta is going to be a consideration for my timing, as it is -0.0719.
This means that the contracts will decay at a rate of ~7 cents/day.
There seems to be a slightly more bearish sentiment in existing options contracts, as the Open Interest on the same puts is a bit higher.
However, from the short-term perspective there seems to be a good chance that these will become in-the-money before then.
All-in-all, WYNN stock is worth taking a closer look at for both short-term & long-term traders.
*** I DO NOT OWN SHARES OF WYNN STOCK ***