Hooker Furniture Corp. stock trades under the ticker HOFT & has shown some bullish signals recently despite its drop over the last year that traders & investors may want to take a closer look at.
HOFT stock closed at $17.23/share on 5/10/2022.
Hooker Furniture Corp HOFT Stock’s Technicals Broken Down
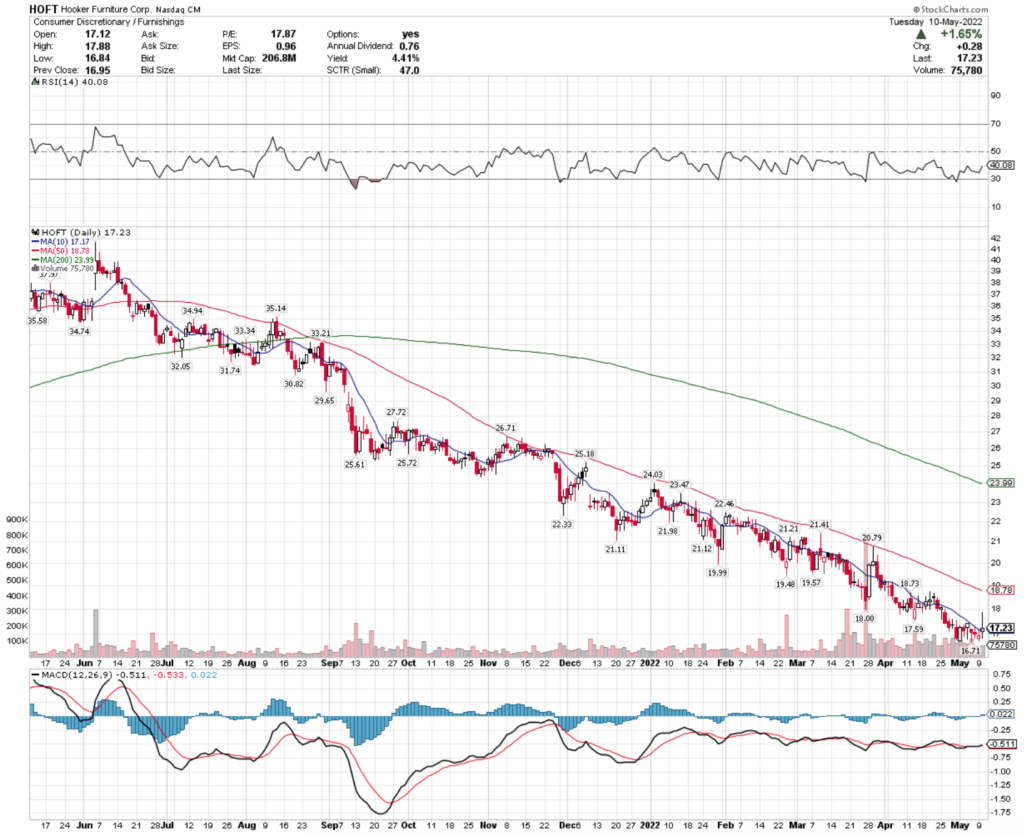
HOFT Stock Price: $17.23
10 Day Moving Average: $17.17
50 Day Moving Average: $18.78
200 Day Moving Average: $23.99
RSI: 40.08
MACD: -0.511
Yesterday, HOFT stock completed a bullish MACD crossover, while also breaking out above its 10 day moving average bullishly.
While HOFT has been in a steady decline over the last year, they have traded at above average volume in the most recent two months.
With their RSI still in oversold territory, there looks to be some possible near-term strength for HOFT stock, pending the broader markets’ movement direction after today’s CPI print.
They will need to break through the $17.45, $17.61 & $17.88/share resistance levels as they continue to climb higher.
Hooker Furniture Corp HOFT Stock As A Long-Term Investment
Long-term oriented investors will like HOFT stock’s valuation metrics, with a P/E (ttm) of 17.54 & a 0.78 P/B (mrq).
They recently reported -13.2% Quarterly Revenue Growth Y-o-Y, which investors may want to take a closer look into.
HOFT stock’s balance sheet is also appealing, with $69.37M of Total Cash (mrq) & only $54.04M of Total Debt (mrq).
HOFT pays a 4.37% annual dividend, which may be unsustainable in the long-run as their payout ratio is 76.3%.
Hooker Furniture Corp HOFT Stock As A Short-Term Trade Using Options
Short-term oriented traders can use options to profit from HOFT stock’s price movements, while hedging against broader market volatility.
I am looking at the contracts with the 5/20 expiration date.
The $17.50 calls are low on open interest, but at-the-money, while the next nearest calls are at the $20 & $22.50 strike prices.
The $22.50, $20 & $17.50 puts also look appealing, and are all currently in-the-money.
Tying It All Together
HOFT stock has many attributes that traders & investors will like, despite having gone through a difficult year.
Investors will like their balance sheet & valuation metrics, but may want to look into how sustainable their dividend will be in the long-run.
Traders will like their current change in momentum, assuming that it can hold up & not be dragged down by broader market performance in the coming days.
Overall, HOFT stock is worth taking a closer look into, regardless of your trading style.
*** I DO NOT OWN SHARES OF HOFT STOCK AT THE TIME OF WRITING THIS ARTICLE ***
Whiting Petroleum Corp. stock trades under the ticker WLL & has shown recent bullish behavior that investors & traders should take a closer review at, amid a volatile market.
WLL stock closed at $80.94/share on 5/6/2022.
Whiting Petroleum Corp. WLL Stock’s Technicals Broken Down
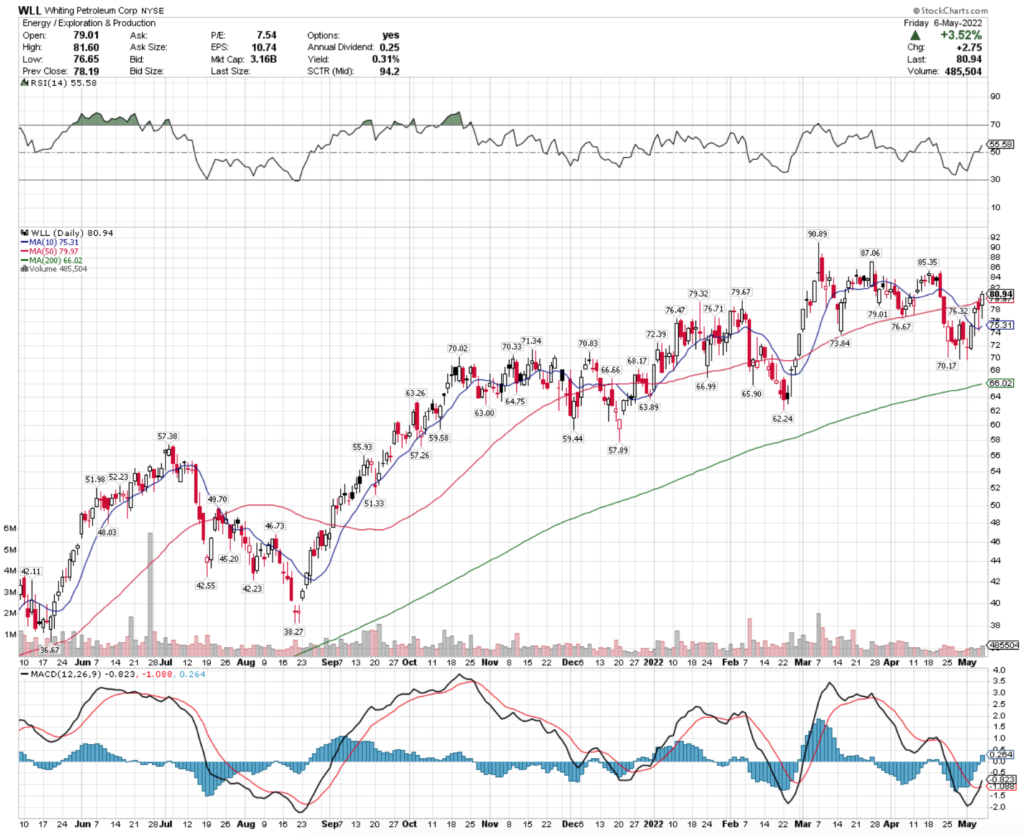
WLL Stock Price: $80.94
10 Day Moving Average: $75.31
50 Day Moving Average: $79.97
200 Day Moving Average: $66.02
RSI: 55.58
MACD: -0.823
On Friday, WLL stock completed a bullish MACD crossover, while also breaking out above its 50 day moving average.
Their recent trading volume has been average/below average compared to the year prior, but with their RSI still neutral there appears to be more short-term momentum to come for WLL stock.
They will need to break out above the $81, $81.46 & $82.48 resistance levels as they continue to climb higher.
Whiting Petroleum Corp. WLL Stock As A Long-Term Investment
Investors who are focused on the long-term will like WLL stock’s valuation metrics, with a 7.25 P/E (ttm) & 1.84 P/B(mrq).
They recently reported 123% Quarterly Revenue Growth Y-o-Y.
WLL stock’s balance sheet looks very appealing, with $41.24M in Total Cash (mrq) & $19.84M in Total Debt (mrq).
WLL stock pays a 1.27% dividend yield, which looks sustainable in the long-term with a 2.5% payout ratio.
96.4% of WLL stock is owned by institutional investors.
Whiting Petroleum Corp. WLL Stock As A Short-Term Trade Using Options
Short-term oriented traders can use options to hedge against broader market risks, while profiting from movements in WLL stock’s price.
I am looking at the contracts with the 5/20 expiration date.
The $70, $75 & $80 calls all look appealing & in-the-money, although there is more open interest in the $85 contracts than the three strike prices above combined.
This signals that there are a lot of traders who believe that there is at least 5% more upside to WLL stock in the coming weeks.
The $95, $90 & $85 puts are all in-the-money, but are very illiquid.
The open interest levels on the $80 & $75 puts are much greater, but a turn in near-term momentum will be required to get them at-the-money.
Tying It All Together
WLL stock has a lot of interesting characteristics that traders & investors are both sure to like.
Investors will like their balance sheet, as well as their valuation & dividend.
Traders will like their current momentum, but may be disappointed with the liquidity of their options contracts that are in-the-money at the moment.
All-in-all, WLL stock is worth taking a closer look at to see how it fits into your trading strategy.
*** I DO NOT OWN SHARES OF WLL STOCK AT THE TIME OF PUBLISHING THIS PIECE ***
Capital Product Partners L.P. stock trades under the ticker CPLP & has shown recent bullishness that traders & investors should take a closer look into.
CPLP stock closed at $15.70/share on 5/6/2022.
Capital Product Partners L.P. CPLP Stock’s Technicals Broken Down
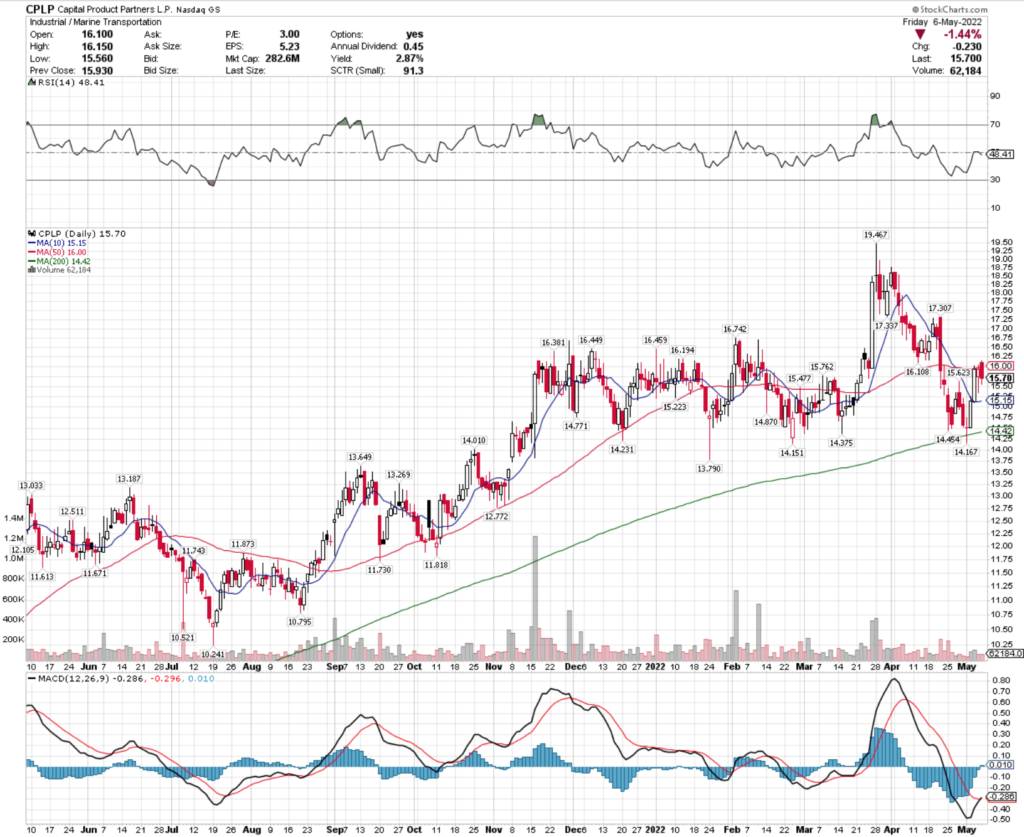
CPLP Stock Price: $15.70
10 Day Moving Average: $15.15
50 Day Moving Average: $16.00
200 Day Moving Average: $14.42
RSI: 48.41
MACD: -0.286
On Friday, CPLP stock completed a bullish MACD crossover, ending a week of gains that closed just beneath their 50 day moving average.
Despite having lighter than average volume recently, their RSI is on the <50 side of neutral, and with a <2% increase in price they will break through the 50 day MA, adding near-term momentum.
They will need to break above the $16.17, $16.35 & $16.64/share resistance levels.
Capital Product Partners L.P. CPLP Stock As A Long-Term Investment
Long-term oriented investors will like CPLP stock’s valuation metrics, with a 3.1 P/E (ttm) & a P/B (mrq) of 0.58.
They recently reported 81.2% Quarterly Revenue Growth Y-o-Y, with 450.9% Quarterly Earnings Growth Y-o-Y.
CPLP stock’s balance sheet may warrant a closer review, with $20.37M in Total Cash (mrq) & Total Debt (mrq) of $1.31B.
The most recent Moody’s debt rating for CPLP was B1 (highly speculative), but it was withdrawn in 2019.
CPLP stock pays a 2.82% dividend yield, that appears very stable in the long-run, as their payout ratio is only 7.78%.
20.83% of CPLP stock’s outstanding share float is owned by institutional investors.
Capital Product Partners L.P. CPLP Stock As A Short-Term Trade Using Options
Short-term focused traders can use options to profit from CPLP stock’s price movements, while protecting their portfolio from market volatility.
I am looking at the contracts with the 5/20 expiration date.
The $10, $12.50 & $15 calls are all in-the-money, but are also less liquid than the next batch of out-of-the-money calls, signaling that there is strong sentiment that they will continue climbing over the next 2 weeks.
The $20 & $17.50 puts look appealing & are in-the-money, but are far less liquid than the $15 puts, which become in-the-money with a 4% price drop.
Tying It All Together
CPLP stock has a lot of potential that traders & investors may find fitting into their portfolio.
Investors will like their valuation metrics & dividend yield, but may want to look closer into their ability to service their debts down the line.
Traders will like their current momentum path, but may be disappointed by the open interest levels of their options contracts.
All-in-all, CPLP stock is worth taking a closer look into, regardless of your trading strategy.
*** I DO NOT OWN SHARES OF CPLP STOCK AT THE TIME OF PUBLISHING THIS ARTICLE ***
Continental Resources Inc. stock trades under the ticker CLR & has shown recent bullishness amid broader market volatility that traders & investors should research further.
CLR stock closed at $62.17/share on 5/6/2022.
Continental Resources Inc. CLR Stock’s Technicals Broken Down
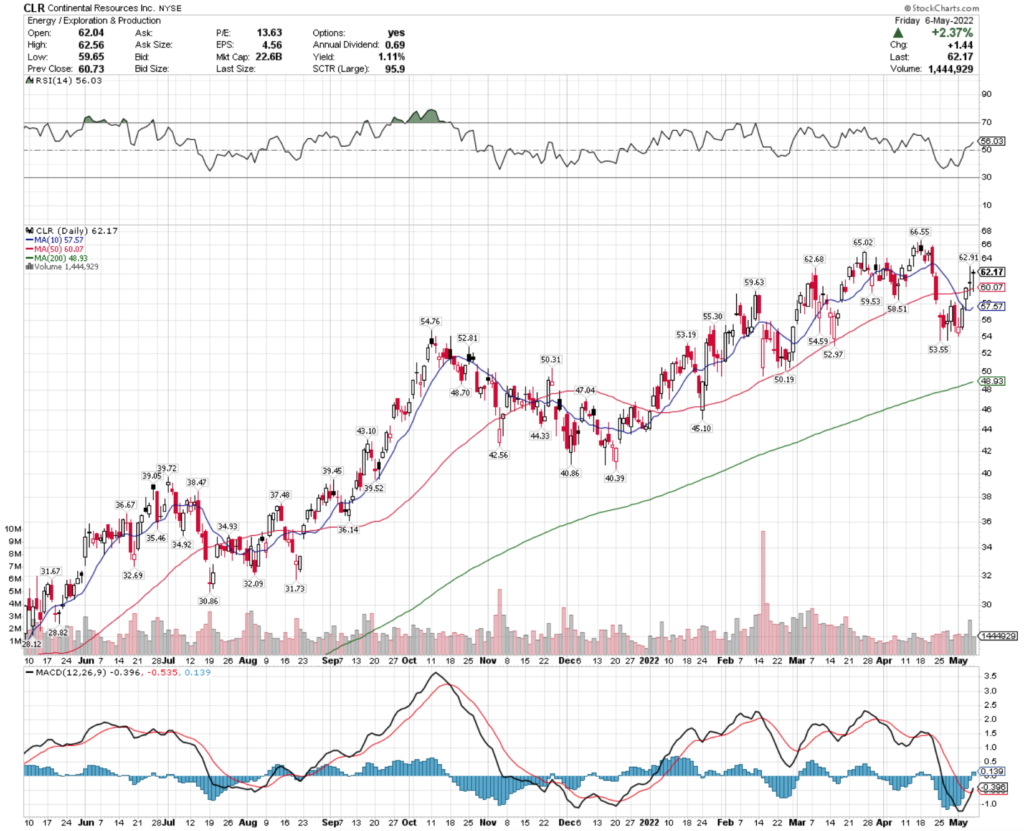
CLR Stock Price: $62.17
10 Day Moving Average: $57.57
50 Day Moving Average: $60.07
200 Day Moving Average: $48.93
RSI: 56.03
MACD: -0.396
CLR stock completed a bullish MACD crossover on Friday, while notching a fourth consecutive day of gains.
With their RSI still in neutral range at 56 & 4.3% between their 10 & 50 day moving averages, there looks to be more momentum in the near-term, despite only trading at about average volume compared to the year prior.
CLR will need to break through the $62.47, $62.56 & $63.20 resistance levels as they continue climbing higher.
Continental Resources Inc. CLR Stock As A Long-Term Investment
Long-term oriented investors will find CLR stock’s valuation metrics appealing, with a P/E (ttm) of 11.11 & a P/B (mrq) of 2.81.
They recently reported 121.7% Quarterly Revenue GrRowth Y-o-Y.
Investors may want to take a closer look into the structure of their balance sheet, with $20.87M in Total Cash (mrq) & $6.84B in Total Debt (mrq).
Moody’s rates CLR’s debt rating Baa3, which is considered lower-medium grade.
CLR stock pays a 0.76% dividend yield, which appears stable in the long-term as their payout ratio is 12.57%.
13.55% of CLR stock’s outstanding share float is held by institutional investors.
Continental Resources Inc. CLR Stock As A Short-Term Trade Using Options
Short-term oriented traders can use options to profit from CLR stock’s price movement, while hedging against volatility in the broader markets.
I am looking at the contracts with the 5/20 expiration date.
The $60, $61 & $62 call options all look appealing & in-the-money, although the latter 2 have much less open interest compared to the former.
The $66, $65 & $63 puts also look interesting, but are very illiquid, with only 52 open contracts between all three strike prices, which some traders will not like.
Tying It All Together
CLR stock has many interesting characteristics that investors & traders alike will find positive.
Investors will like their valuation metrics & the stability of their dividend.
Traders will like their current momentum, but may be more pleased with the liquidity of their options contracts after this week’s weekly expiration passes.
Overall, CLR stock is worth taking a closer look at, regardless of how your portfolio is structured.
*** I DO NOT OWN SHARES OF CLR STOCK AT THE TIME OF PUBLISHING THIS NOTE ***
Major stock indexes continued to slide this last week, despite a mid-week brief rally focused around the Federal Reserve announcement & Powell conference.
Energy prices continued to climb, the dollar remained relatively flat & earnings reports continued to come in, with more on deck next week.
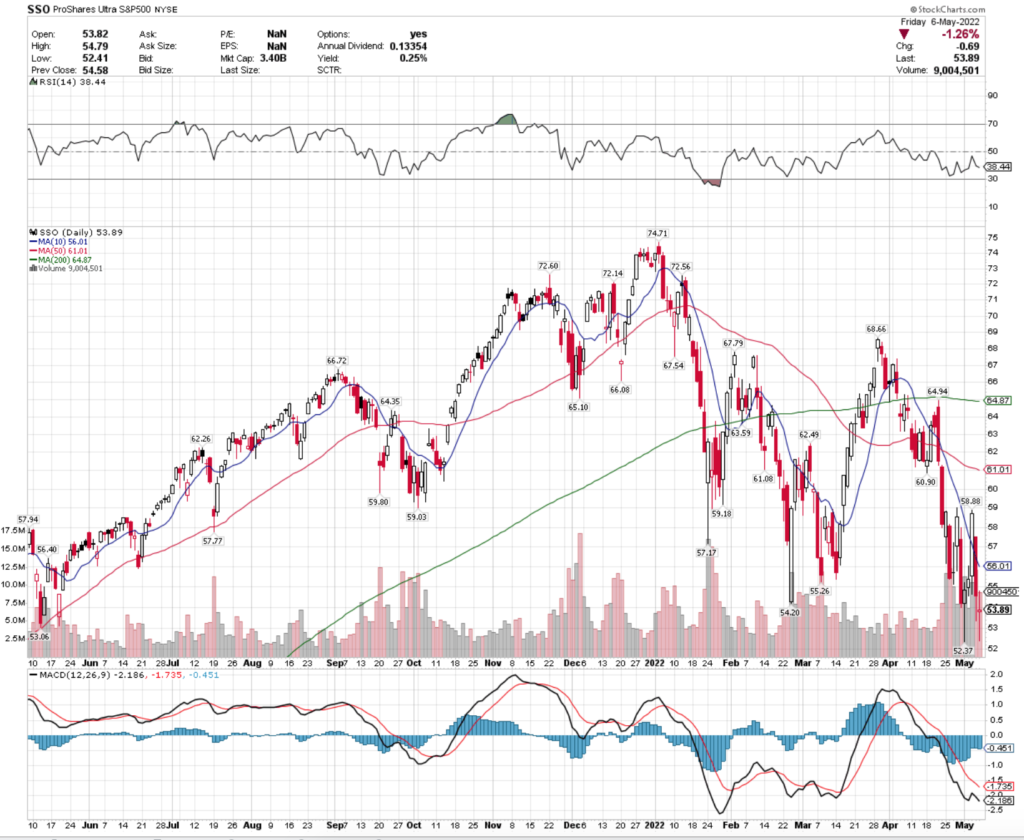
SSO, the ProShares Ultra S&P 500 ETF traded on above average volume this past week, with their MACD signaling more pain to come as it looks to be in relative free-fall.
SSO ETF – ProShares Ultra S&P 500 ETF
With an RSI at 38, there may be an opportunity to trade options around the ETF & profit while waiting for the dip to rebound.
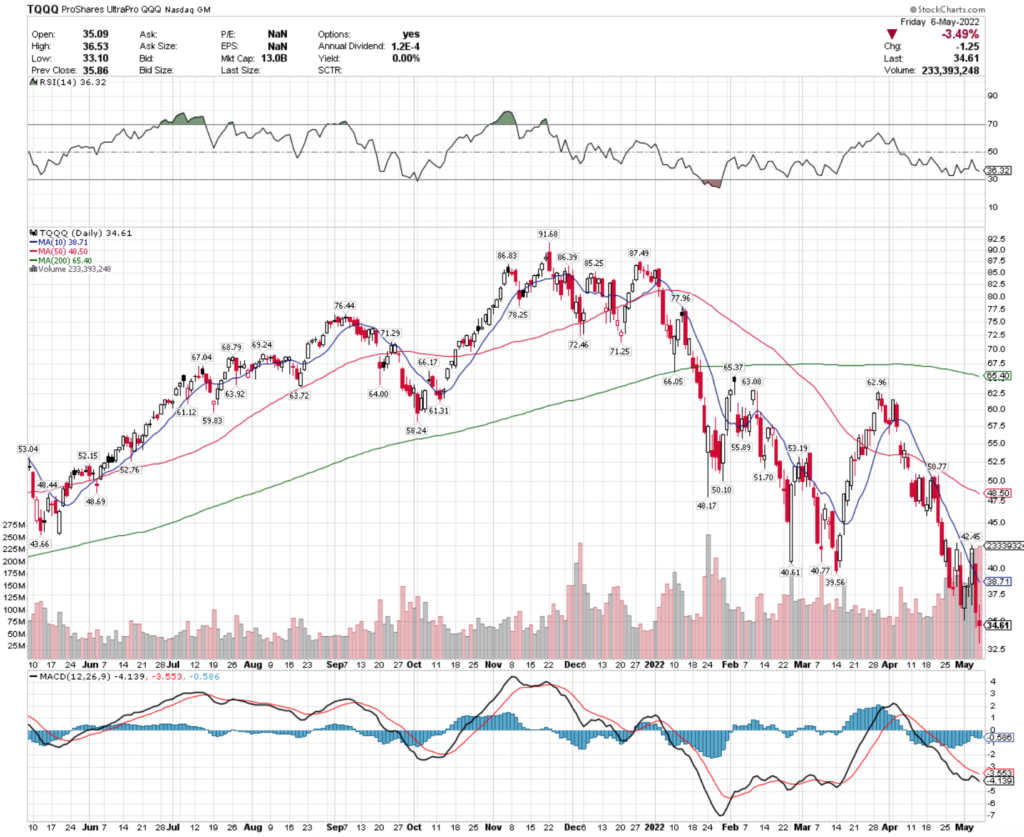
TQQQ, the ProShares UltraPro QQQ ETF is in a more extreme, yet similar camp, as their holdings are more focused on names that such as technology & sciences, which tend to have higher levels of debt & be impacted more greatly by interest rate changes.
TQQQ ETF – ProShares UltraPro QQQ ETF
The technicals on TQQQ’s chart look similar to SSO’s; higher volume than average this week, RSI at 36 & a MACD that is showing more downward momentum to come.
Let’s take a look into some of the top & bottom performing sectors & geo-locations based on their technical ratings.
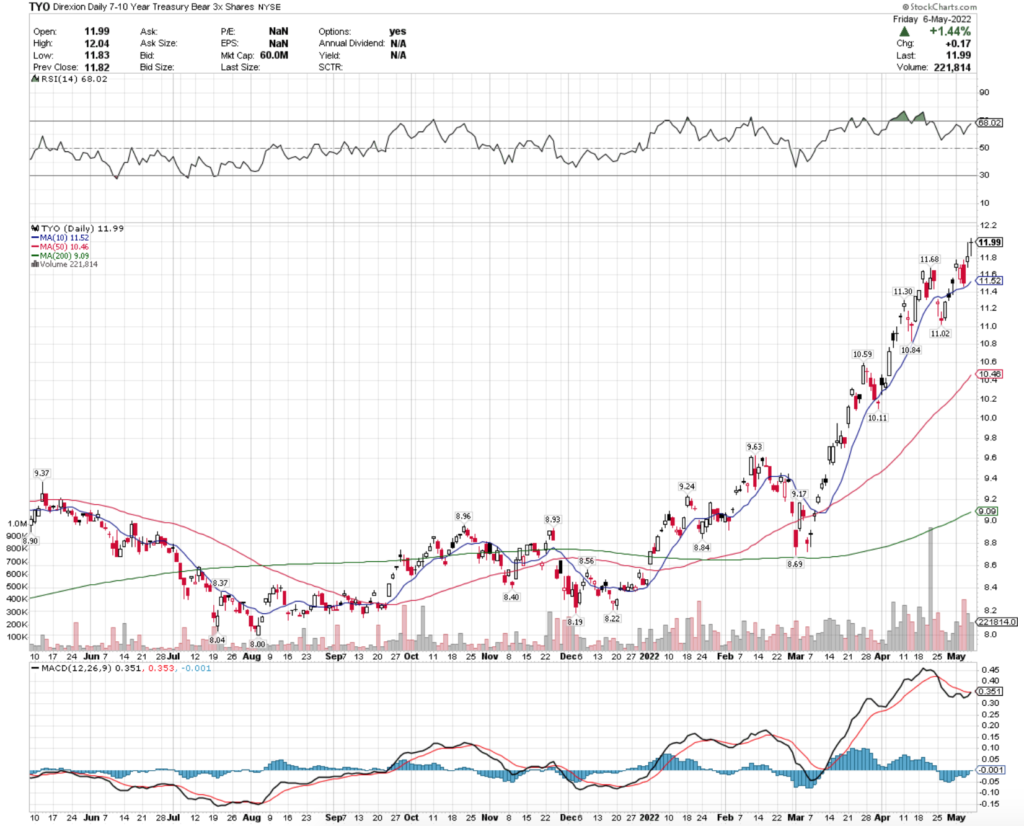
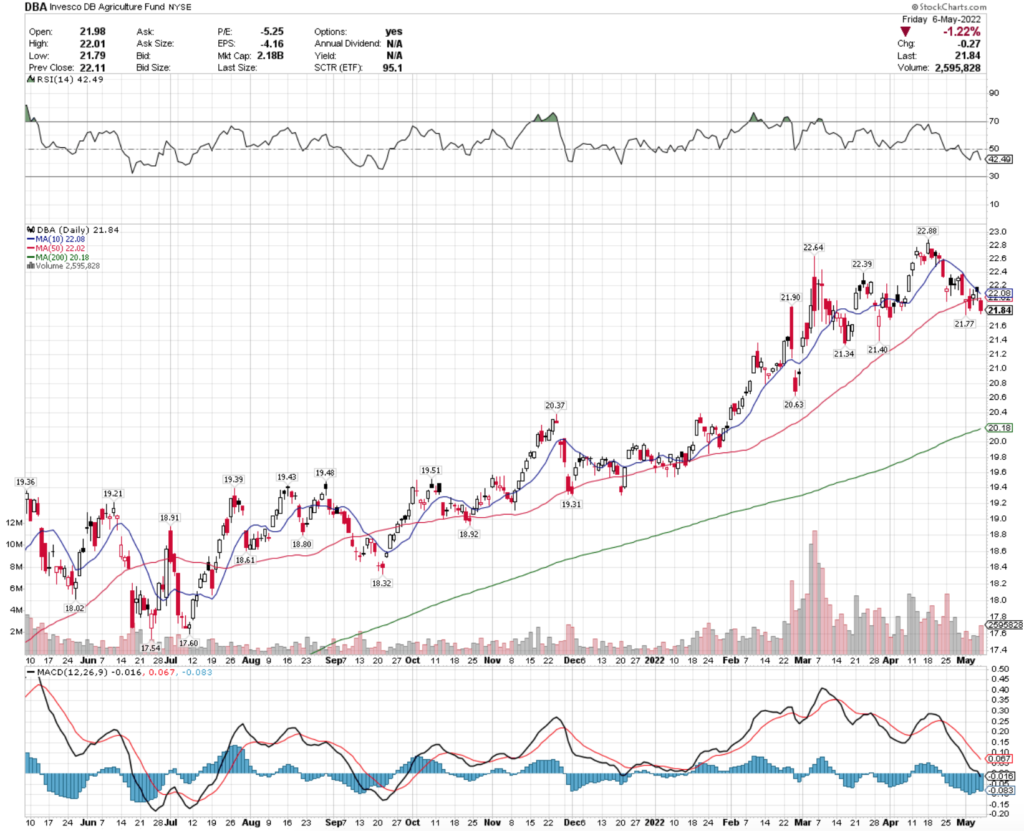
Energy (ERX), 7-10 Year Treasury Bear (TYO), Utilities (UTES) & Agriculture (DBA) Bullishly Leading The Markets
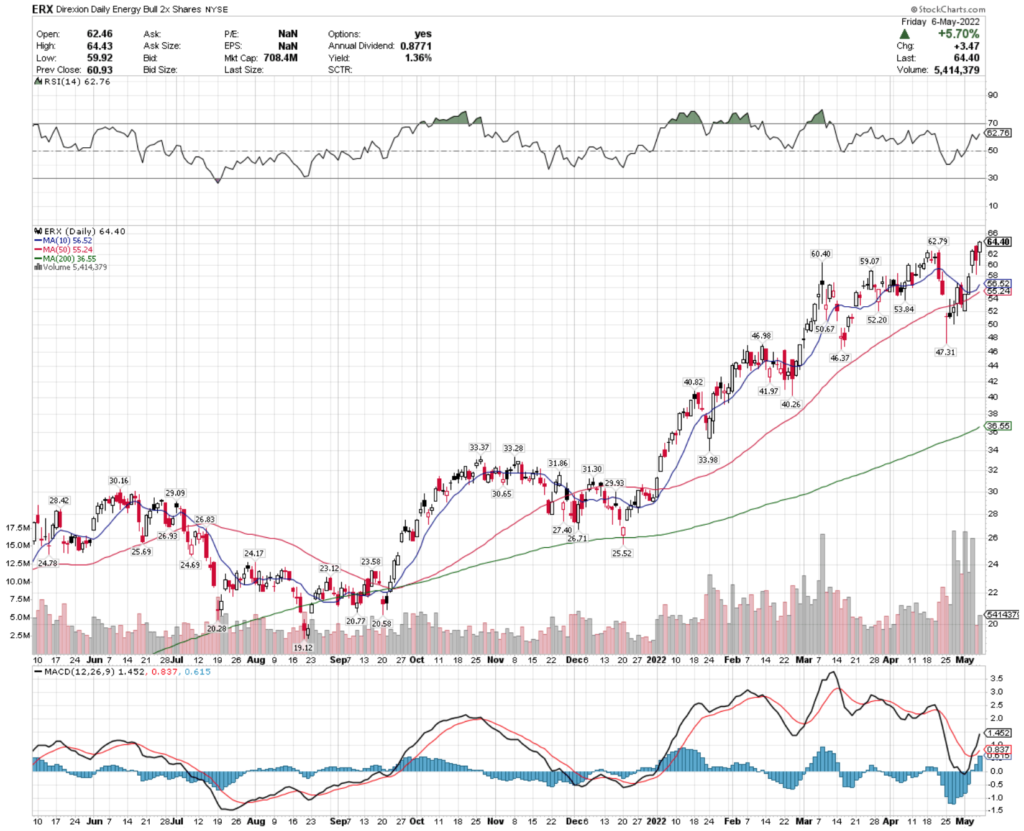
ERX ETF – Direxion Daily Energy Bull 2x Shares ETF
I don’t think that this surprises anyone, but something interesting here is that after their gap up on Wednesday, their trading volumes have dropped below average for the past year, which is even lower than the average for the last 1-2 months.
Their RSI is still in the 60’s & their MACD looks healthy, but there may be some near-term pullback that can be used as an entry-point based on the closeness of the 10 & 50 day moving averages.
ERX pays a 1.36% dividend yield, which can be used as a cushion for those entering a long-only position.
The $62.79 level will be key to watch this week, as they try to stay above it.
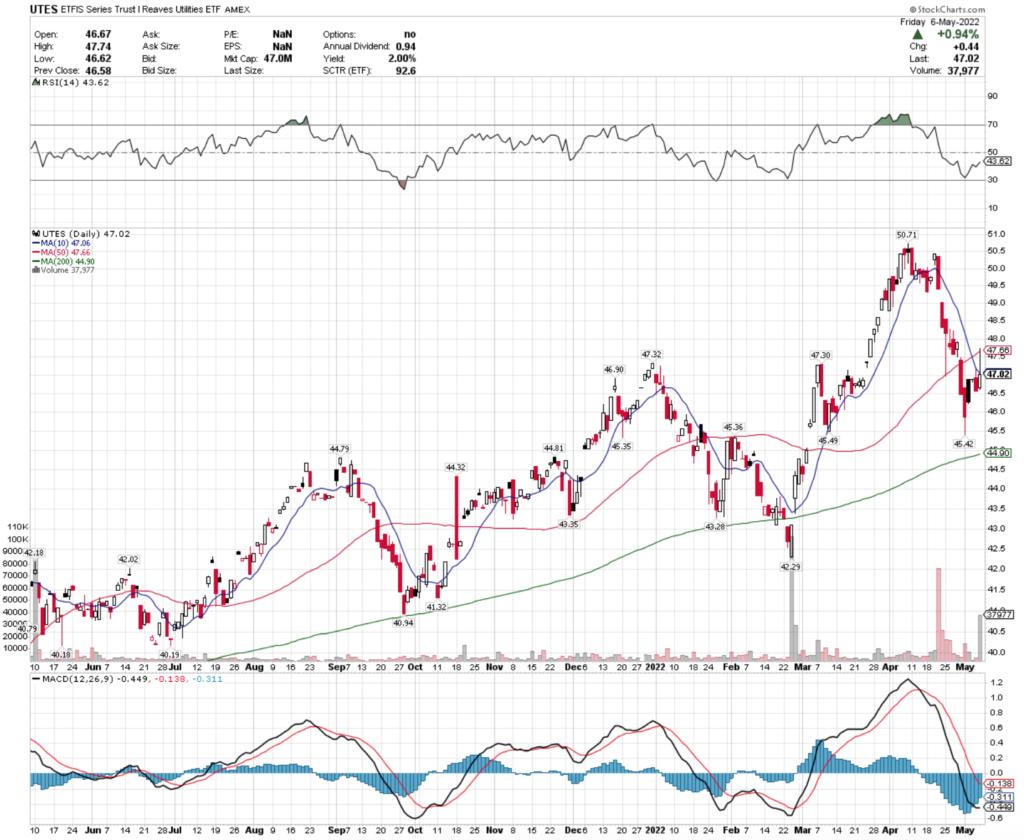
UTES ETF – EFTIS Series Trust I Reaves Utilities ETF
While they aren’t out of the woods just yet, their MACD is beginning to curl upwards, and their RSI is still in the low 40’s, which may signal the turning of momentum into a bullish near-term period.
UTES provides a 2% cushion for investors in the form of their dividend for stockholders who plan to build a position for the longer-term.
While they do not have a dividend yield, they do have options that can be used to soften the landing on entering a new position via long-short.
DBA’s MACD is still trending downwards, but it is beginning to signal potential signs of a reversal in the near-term, which is supported by their RSI at 42.
I would be watching how they hold $21.77, as well as how their price reacts when the 10 & 50 day moving averages meet.
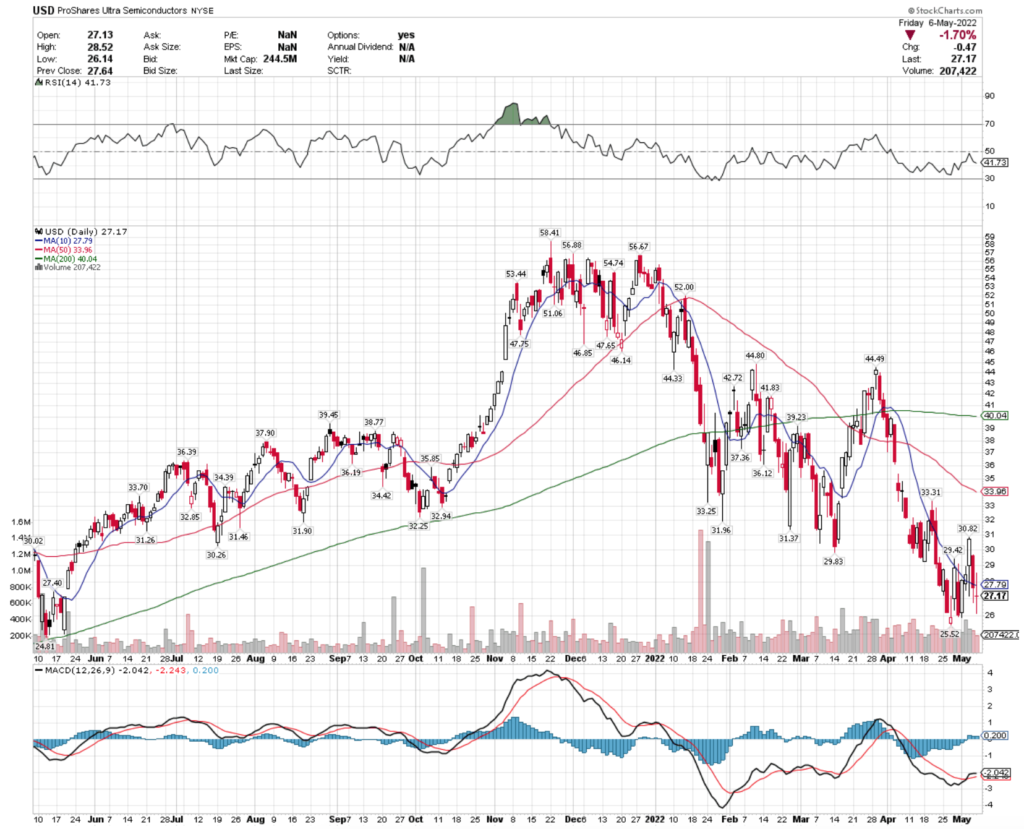
Blockchain (BKCH), Cannabis (YOLO), Semiconductors (USD) & Social Sentiment (BUZZ) Bearishly Lagging The Markets
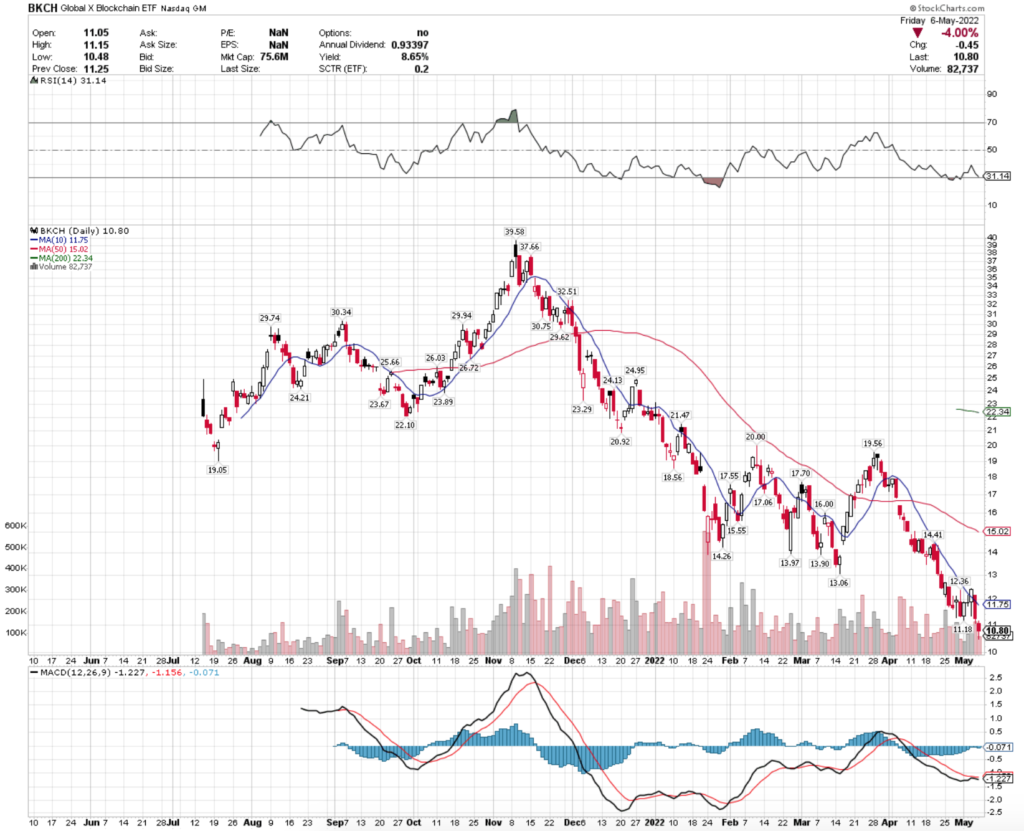
BKCH, the Global X Blockchain ETF has struggled since its inception in July 2021,falling 72.7% over its first 2 quarters on the market.
BKCH ETF – Global X Blockchain ETF
BKCH does not have options to trade yet, but they do offer an 8.65% dividend yield, which interested investors can use as a cushion for building their position, should they hold it for over a year.
They look poised to reverse trend & gain some losses back as their RSI approaches the 30, or “oversold” mark & their MACD looks to try & crossover bullishly, but it is too speculative to tell for sure, given the interest rate concerns impacting tech names.
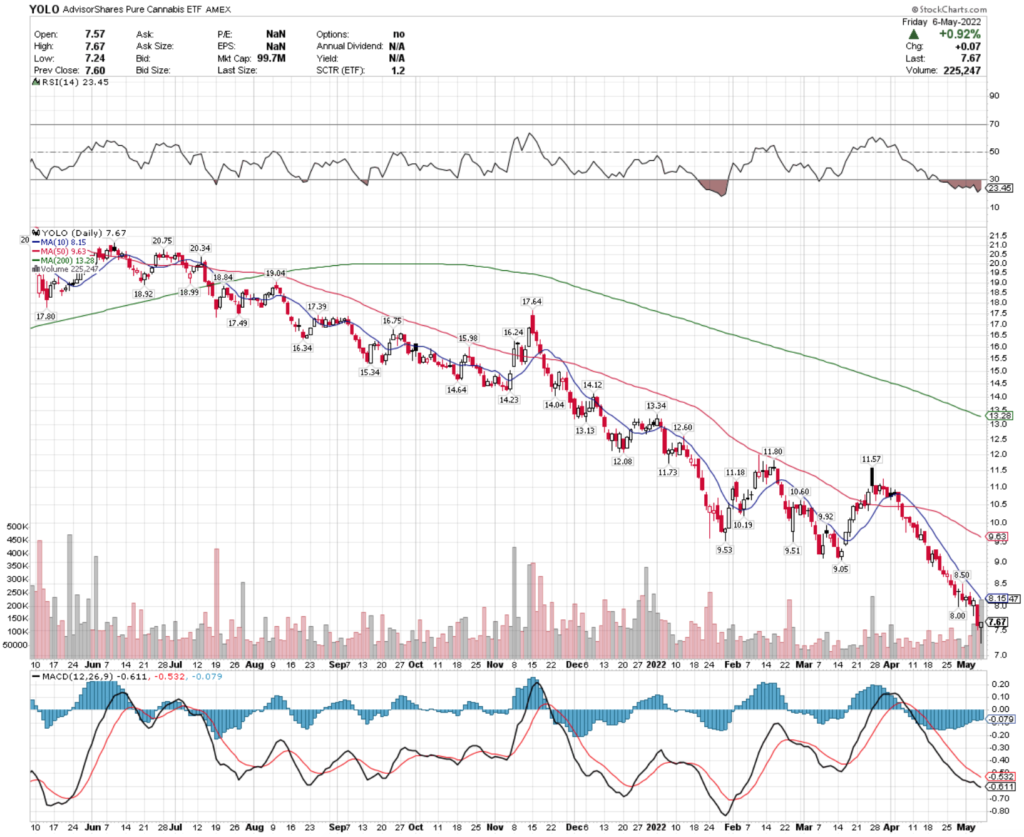
YOLO, the AdvisorShares Pure Cannabis ETF has been steadily declining since June of 2021, although there may be an end in sight, as Friday 5/6/2022 resulted in a hammer candlestick at their current low price for the year.
YOLO ETF – AdvisorShares Pure Cannabis ETF
Those interested in entering a long position here or buying down their average price for existing positions may see this as a sign of confidence in a near-term reversal.
Their RSI is well-oversold & their MACD is beginning to flatten, which could lead to more bullish momentum, should their trading volumes continue to stay above average for the year in the near-term. (I have a long position in TOKE, another cannabis ETF)
With no options to use as a hedge & no dividend to offer a cushion from more losses, this will be an interesting one to watch.
USD’s MACD is currently bullish, but they will need to break above their 10 day moving average in the near-term in order to keep it from crossing back bearishly.
Anyone thinking of entering USD should also consider buying some puts as well in order to protect themselves from potential near-term losses.
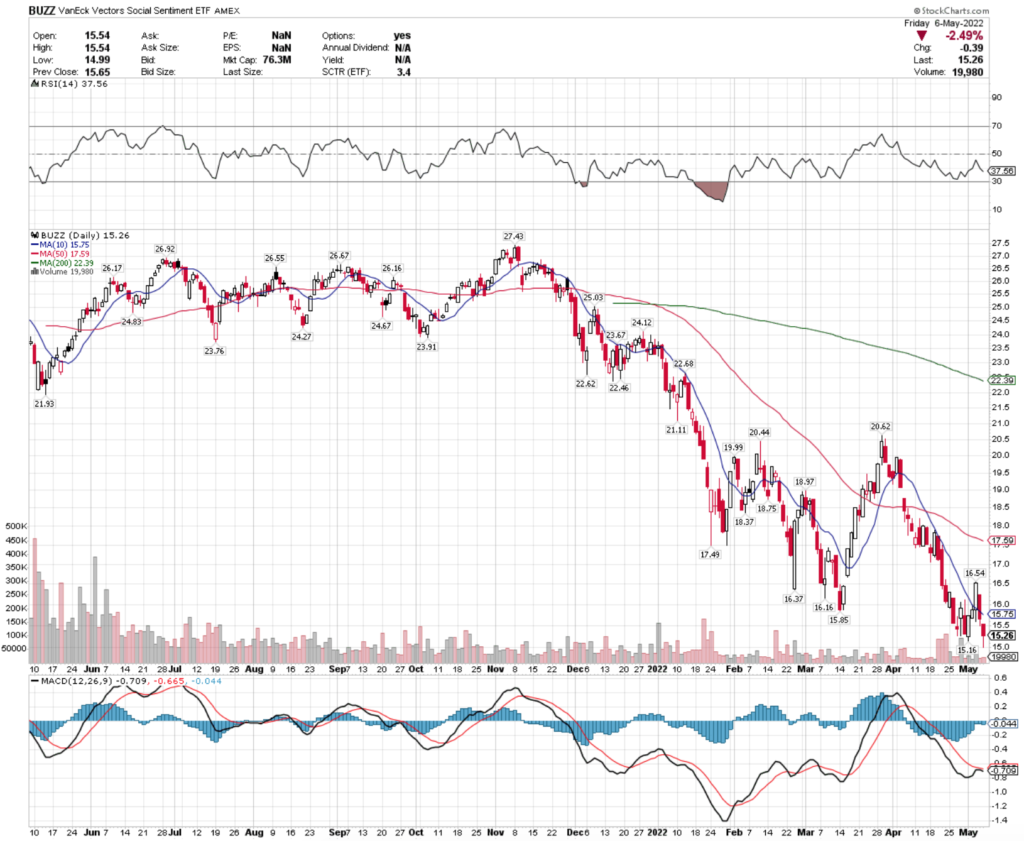
BUZZ, the VanEck Vectors Social Sentiment ETF has performed poorly since topping out in November 2021, posting 44.4% losses from their high.
BUZZ ETF – VanEck Vectors Social Sentiment ETF
Their trading volumes have been steadily going down since last August to October, with a few random flare ups, signaling that investors aren’t particularly keen on their concept.
Their MACD is trying to break out bullishly, but a reversal will be heavily reliant on yesterday’s hammer candlestick, making the $15/share mark a good place to be keeping an eye on as the begin trading again next week.
Tying It All Together
Next week will be interesting, particularly Wednesday’s CPI numbers, which will be one of the week’s focal points.
Thursday’s PPI data & jobless claims data will also be something to keep an eye on, to look for inconsistencies with other recently reported data points that markets have been trying to digest.
Another couple sets of numbers that will shed better light on inflation are coming on Tuesday, with the NFIB small business index & the real household savings rate (SAAR), as this will shed more light into how inflation is impacting people.
Earnings reports will also add in another dimension that markets will need to deal with, with 1,177 companies reporting (per Yahoo).
Results & guidance numbers reported will give more insight into the current state of the economy beyond the data prints that we have been reading each week.
*** I DO NOT OWN SHARES OF SSO, TQQQ, ERX, TYO, UTES, DBA, BKCH, YOLO, USD, or BUZZ AT THE TIME OF PUBLISHING THIS ARTICLE ***
*** I HAVE A LONG POSITION IN TOKE, WHICH IS MENTIONED ABOVE IN THE BODY OF THIS ARTICLE ***
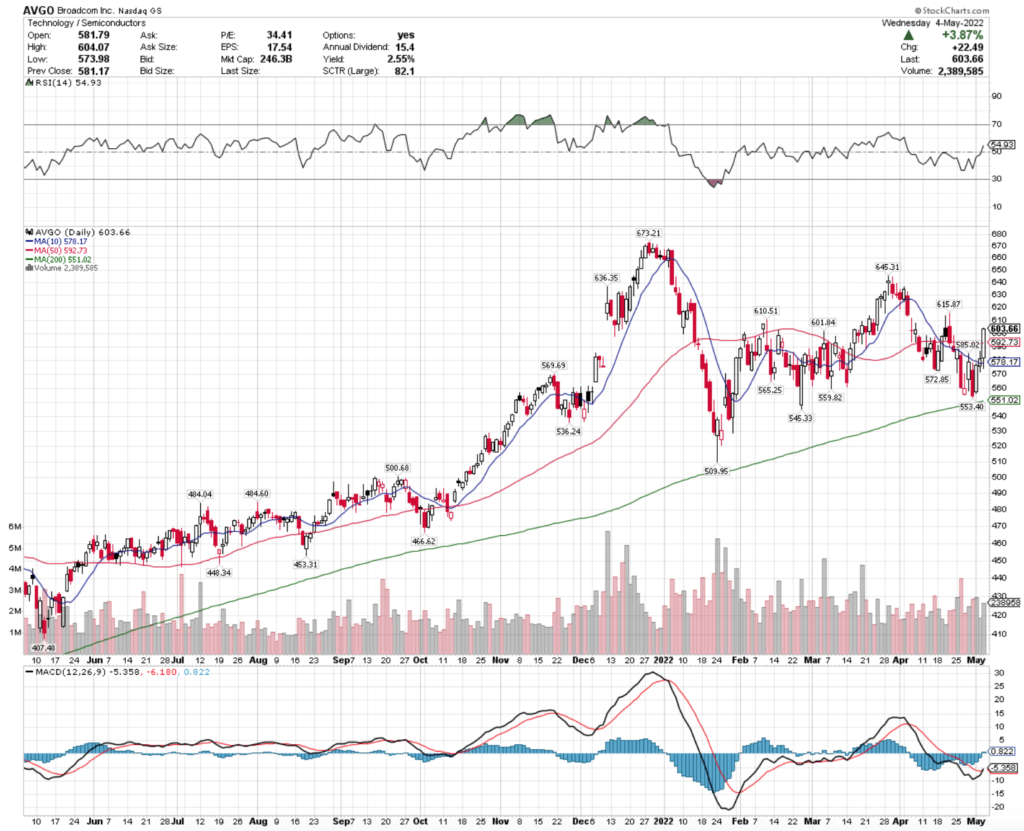
Broadcom Inc. stock trades under the ticker AVGO & has shown recent bullishness during a volatile market period that traders & investors should take a closer look into.
AVGO stock closed at $603.66/share on 4/4/2022.
Broadcom Inc. AVGO Stock’s Technicals Broken Down
AVGO Stock Price: $603.66
10 Day Moving Average: $578.17
50 Day Moving Average: $592.73
200 Day Moving Average: $551.02
RSI: 54.9
MACD: -5.358
Yesterday, AVGO stock completed a bullish MACD crossover, while also breaking out above its 50 day moving average bullishly.
Their RSI is still neutral at 54, and their recent trading volumes have been above average compared to the rest of the year prior, signaling that they may have more bullish momentum to come in the near-term.
They need to test & break out above the $604.20, $605.54, & $607.64/share resistance levels as they continue climbing higher.
Broadcom Inc. AVGO Stock As A Long-Term Investment
Long-term oriented investors may find AVGO stock’s P/E (ttm) of 31.61 to be appealing, but may balk at their 9.85 P/B (mrq).
They recently reported 15.8% Quarterly Revenue Growth Y-o-Y, with 79.4% Quarterly Earnings Growth.
Investors will want to take a closer look into the details of AVGO stock’s balance sheet, as they have $10.22B in Total Cash (mrq), with $39.5B in Total Debt (mrq).
AVGO stock pays a 2.65% dividend yield, which should be sustainable in the near-term, but may warrant tightening in the long-run as their payout ratio is 84.95%.
83.1% of AVGO stock’s outstanding share float is owned by institutional investors.
Broadcom Inc. AVGO Stock As A Short-Term Trade Using Options
Short-term focused traders can use options to profit from movements in AVGO stock, while hedging against broader market volatility.
I am looking at the contracts with the 5/20 expiration date.
The $597.50, $600 & $602.50 call options look appealing, although they they are somewhat low on open interest (586 total contracts at time of writing).
Given that AVGO has weekly expiration dates, expect to see more liquidity in their options as the expiration date draws nearer.
The $610, $607.50 & $605 puts also look interesting, but have a similar issue with liquidity (507 total contracts at time of writing).
Tying It All Together
AVGO stock has a slightly more bullish near-term outlook than most stocks based on calls:puts at the 5/20 expiration date.
Traders will like their current momentum set up, and should expect to see more open interest in their options contracts as more weekly expiration dates pass.
Investors will like their dividend yield & P/E (ttm), but may think to look into how their debts are structured before making a long-term investment.
Overall, AVGO stock is worth taking a closer look at to see how it fits into your portfolio strategy.
*** I DO NOT OWN SHARES OF AVGO STOCK AT THE TIME OF PUBLISHING THIS PIECE ***
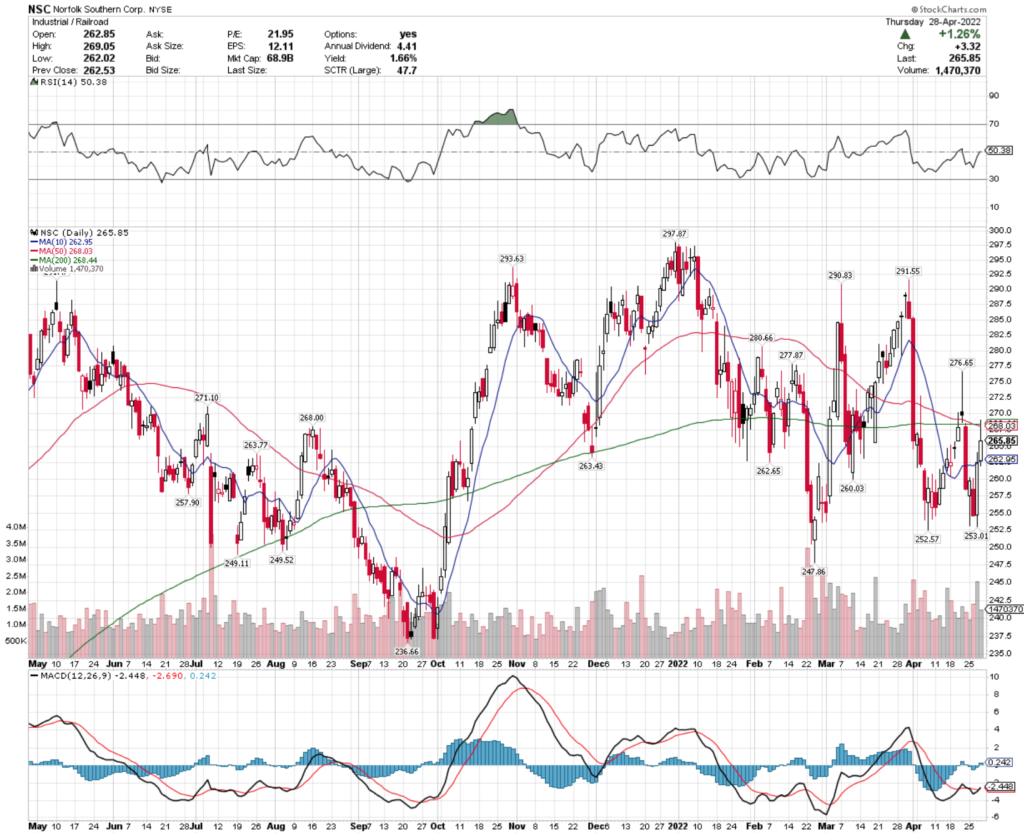
Their balance sheet will require a closer examination, with $839M in Total Cash (mrq) & $14.79B in Total Debt (mrq).
NSC stock pays a 1.58% dividend, which appears to be stable in the long-term, with a 34.35% payout ratio.
76.64% of NSC stock’s outstanding share float is owned by institutional investors.
Norfolk Souther Corp. NSC Stock As A Short-Term Trade Using Options
Short-term oriented traders can use options to hedge against broader market volatility, while also profiting from price movements in any direction for NSC stock.
I am looking at the contracts with the 5/20 expiration date.
The $260, $262.50 & $265 calls all look appealing, but are relatively low in open interest at the moment.
Given that NSC has weekly expirations though, that will change in the near-term as more expiration dates pass by.
The $272.50, $270 & $267.50 puts also look appealing, but have a similar open interest situation that looks to improve in the coming weeks.
Tying It All Together
NSC stock has characteristics that traders & investors will both find appealing.
Investors will like their dividend yield & P/E (ttm), but may be wary of their balance sheet.
Traders will like their current momentum path & weekly expiration dates for their contracts, but will be disappointed by the limited levels of open interest their further out dated contracts have.
All-in-all, it is worth taking a closer look at NSC stock to see how it fits in with your portfolio strategy.
*** I DO NOT OWN SHARES OF NSC STOCK AT THE TIME OF WRITING THIS ARTICLE ***
Grupo Aroportuario del Sureste SA stock trades under the ticker ASR & has shown recent bullish behavior that traders & investors should take a closer look into.
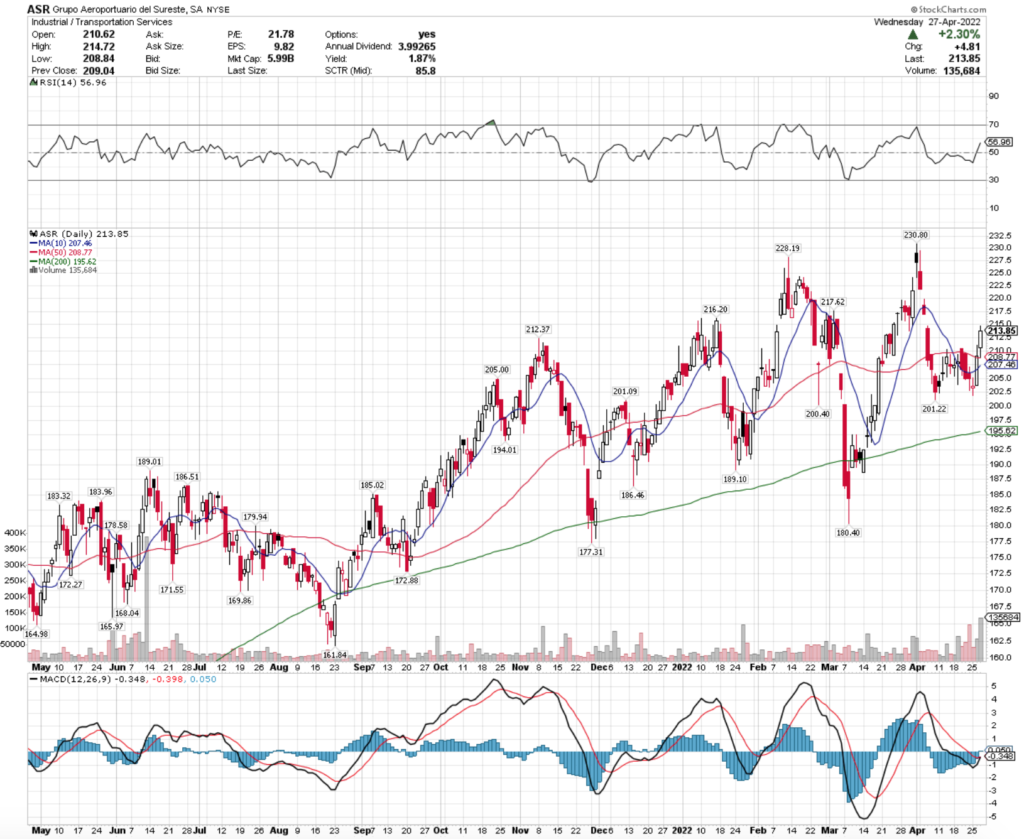
ASR stock closed at $213.85/share on 4/27/2022.
Grupo Aeroportuario del Sureste SA ASR Stock’s Technicals Broken Down
ASR Stock Price: $213.85
10 Day Moving Average: $207.46
50 Day Moving Average: $208.77
200 Day Moving Average: $195.62
RSI: 56.96
MACD: -0.348
Yesterday, ASR stock completed a bullish MACD crossover, while climbing 2.3%.
With a relatively neutral RSI & above average trading volume compared to the rest of the year, ASR looks to have more upward momentum in the near-term.
They will have to break above the $214.82, $216.91 & $218.78/share resistance levels.
Grupo Aeroportuario del Sureste SA ASR Stock As A Long-Term Investment
Long-term focused investors may like ASR stock’s valuation metrics, with a P/E (ttm) of 20.53 & a P/B (mrq) 3.31.
They recently reported 59.6% Quarterly Revenue Growth Y-o-Y, with 300.2% Quarterly Earnings Growth Y-o-Y.
Their balance sheet may need a closer review, with $8.77B in Total Cash (mrq) & $13.8B in Total Debt (mrq).
ASR stock pays a 1.96% dividend yield, which appears stable in the long run, with a 41.1% payout ratio.
25% of ASR stock’s outstanding share float is owned by institutional investors.
Grupo Aeroportuario del Sureste SA ASR Stock As A Short-Term Trade Using Options
Short-term oriented traders can trade ASR options in order to profit from their stock’s price movements while protecting themselves from volatility.
I am looking at the contracts with the 5/20 expiration date.
The $200, $210 & $220 calls all look appealing, but are highly illiquid with one contract of open interest at each strike price.
The $220 & $210 puts also look interesting, but have the same lack of liquidity issue.
Tying It All Together
Overall, ASR stock is worth taking a closer look at to see how it fits into your portfolio strategy.
Investors will like their valuation, as well as their dividend yield.
Traders will like their current momentum, but may be dissatisfied with how liquid their options are.
There are lots of great attributes to ASR stock.
*** I DO NOT OWN SHARES OF ASR STOCK AT THE TIME OF WRITING THIS ***
Sherwin Williams Co. stock trades under the ticker SHW & has shown recent bullishness that traders & investors should take a closer look into.
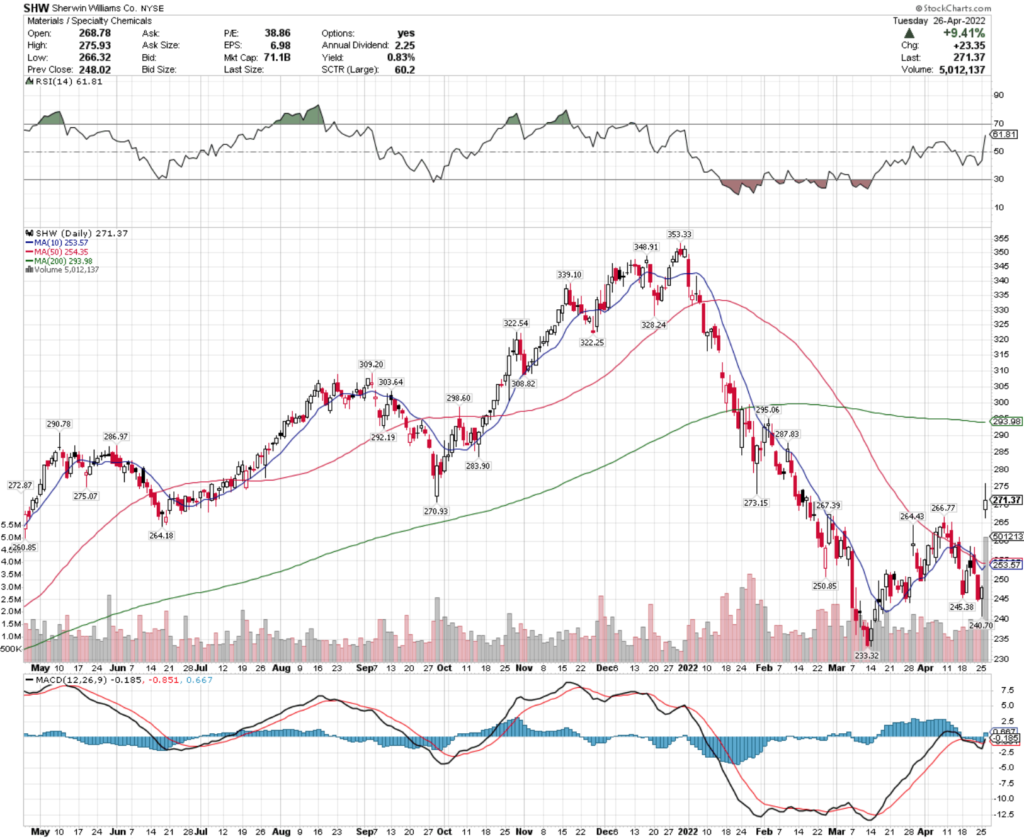
SHW stock closed at $271.37/share on 4/26/2022.
Sherwin Williams Co. SHW Stock’s Technicals Broken Down
SHW Stock Price: $271.37
10 Day Moving Average: $253.57
50 Day Moving Average: $254.35
200 Day Moving Average:$293.98
RSI: 61.8
MACD: -0.185
Yesterday, SHW stock completed a bullish MACD crossover, while gapping up 9.41% & breaking out above its 10 & 50 day moving averages.
With trading volume that is far above average compared to the prior year & an RSI that is 61, there looks to be more short-term momentum while SHW stock establishes a new price range.
They will need to break above the $271.49, $271.05 & $275.05/share resistance levels as they continue to climb higher.
Sherwin Williams Co. SHW Stock As A Long-Term Investment
Investors will like SHW stock’s P/E (ttm) of 35.09, but may not be too fond of their 26.2 P/B (mrq).
They recently reported 6.1% Quarterly Earnings Growth Y-o-Y, with -25% Quarterly Earnings Growth Y-o-Y.
Their balance sheet warrants a closer examination before investment, with Total Cash (mrq) of $165.7M & Total Debt (mrq) of $11.5B.
SHW stock pays a 0.89% dividend, which appears to be stable in the long run, with a 31.5% payout ratio.
79.34% of SHW stock’s outstanding share float is owned by institutional investors.
Sherwin Williams Co. SHW Stock As A Short-Term Trade Using Options
Short-term oriented traders can profit from movement in SHW stock by trading options, while also protecting themselves from broader market volatility.
I am looking at the contracts with the 5/20 expiration date.
The $250, $260 & $270 call options look appealing.
The $300, $290 & $280 puts also look interesting, but are very illiquid.
Tying It All Together
Overall, there are many advantages that SHW stock can bring to your portfolio.
Investors will like their dividend yield, as well as their valuation metrics.
Traders will like their current momentum, but may be disappointed by their levels of open interest.
SHW stock is worth taking a closer look into, regardless of your portfolio strategy.
*** I DO NOT OWN SHARES OF SHW STOCK AT THE TIME OF WRITING THIS ***
Avery Dennison Corp. stock trades under the ticker AVY & has shown recent bullish behavior that traders & investors should take a closer look at.
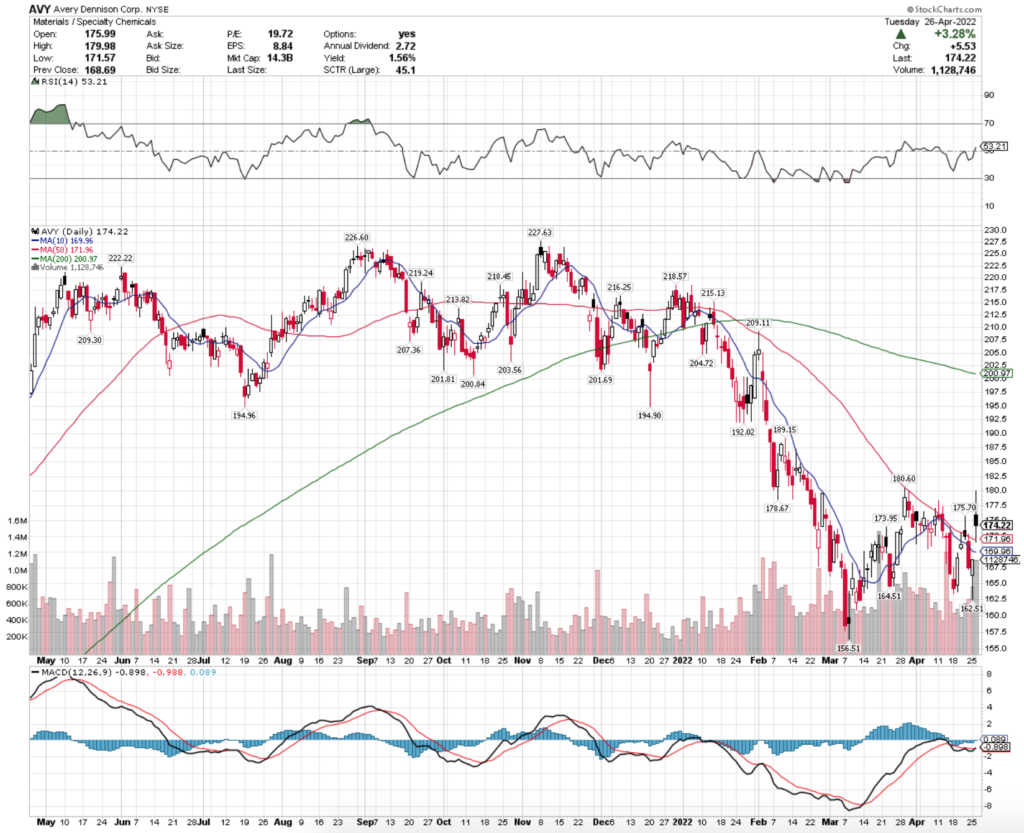
AVY stock closed at $174.22/share on 4/26/2022.
Avery Dennison Corp. AVY Stock’s Technicals Broken Down
AVY Stock Price: $174.22
10 Day Moving Average: $169.96
50 Day Moving Average: $171.96
200 Day Moving Average: $200.97
RSI: 53.2
MACD: -0.898
Yesterday, AVY stock completed a bullish MACD crossover, gapping up 3.28% & above both their 10 & 50 day moving averages.
Their recent trading volumes have been above average, and their RSI is still in neutral territory, signaling that there is more short-term momentum to come.
AVY stock needs to re-test & break through the $176.52, $177.57 & $178.36 resistance levels.
Avery Dennison Corp. AVY Stock As A Long-Term Investment
Long-term oriented investors will like AVY stock’s P/E (ttm) at 18.96, but may find their P/B (mrq) to be a bit too rich at 7.16.
They recently reported 9.7% Quarterly Revenue Growth Y-o-Y, with -4.6% Quarterly Earnings growth Y-o-Y.
Their balance sheet may require a closer examination before investment, with Total Cash (mrq) of $196.1M & Total Debt (mrq) of $3.3B.
AVY stock pays a 1.58% dividend, which appears to be stable in the long-run as their payout ratio is 30.12%.
91.2% of AVY stock’s outstanding share float is owned by institutional investors.
Avery Dennison Corp. AVY Stock As A Short-Term Trade Using Options
Short-term oriented traders can use options to profit from movements in AVY stock.
I am looking at the contracts with the 5/20 expiration date.
The $165, $170 & $175 call options look appealing, but have very limited open interest.
The $175 & $170 puts are the only strike prices with open interest that look to be in-the-money by expiration & are also lacking liquidity.
Tying It All Together
Overall, traders & investors should find AVY stock to be an interesting addition to consider for their portfolio.
Investors will like their dividend yield, but may want to look further into their balance sheet before investing.
Traders will like their current momentum, but will be disappointed by their levels of open interest.
AVY stock is worth taking a closer look at, regardless of your portfolio strategy.
*** I DO NOT OWN SHARES OF AVY STOCK AT THE TIME OF WRITING THIS ***