Packaging Corp of America stock trades under the ticker PKG & has recently shown bullish behavior in a time of market volatility.
PKG stock closed at $159.90/share on 5/27/2022.
Packaging Corp of America PKG Stock’s Technical Performance Broken Down
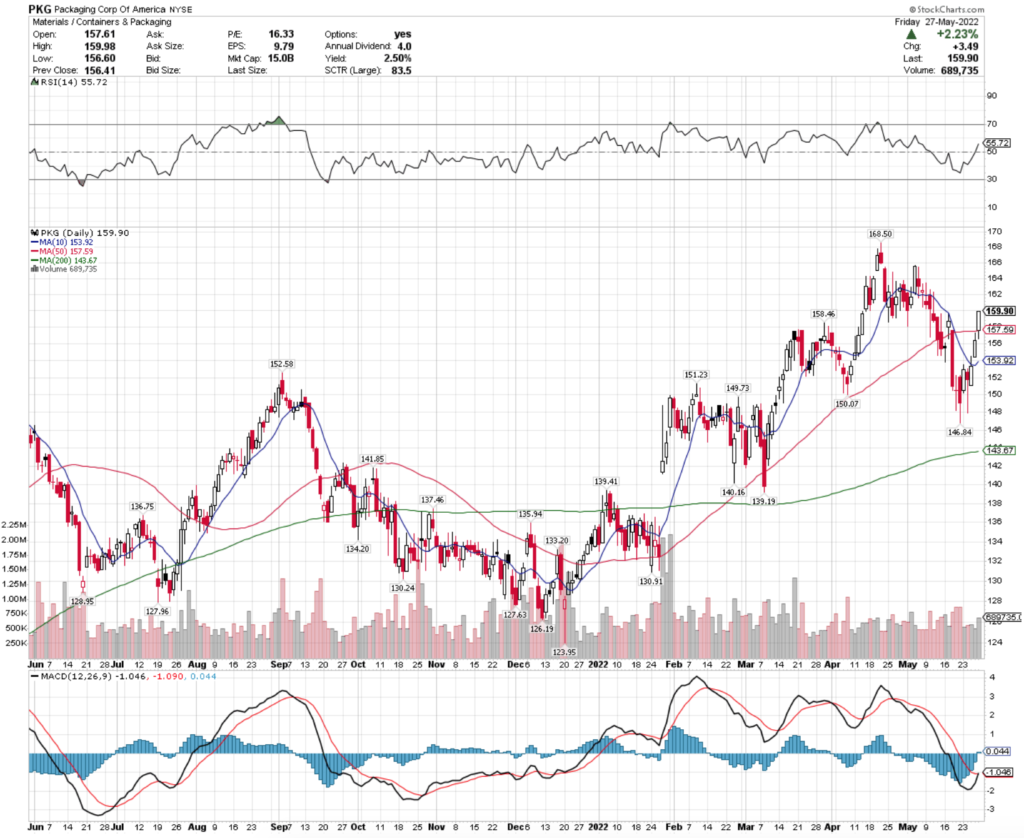
PKG Stock Price: $159.90
10 Day Moving Average: $153.92
50 Day Moving Average: $157.59
200 Day Moving Average: $143.67
RSI: 55.72
MACD: -1.046
On Friday, PKG stock completed a bullish MACD crossover, while breaking out above its 50 day moving average.
While their recent trading volumes have been about average compared to the year prior, there is only 2.4% between their 10 & 50 day moving averages, and their RSI is still neutral, signaling that there may be more near-term bullish momentum.
They will need to test the $165.72/share resistance level, before testing the $168.50/share level.
Packaging Corp of America PKG Stock As A Long-Term Investment
Long-term oriented investors will like PKG stock’s P/E (ttm) of 15.24, but may find their P/B (mrq) of 3.7 to be a bit too rich.
They recently reported 18.2% Quarterly Revenue Growth Y-o-Y, with 52.7% Quarterly Earnings Growth Y-o-Y.
Their balance sheet may require a closer review, with a reported $709.9M of Total Cash (mrq), along with $2.76B of Total Debt (mrq).
PKG stock pays a 2.56% dividend yield, which appears stable in the long-run, as their payout ratio is 40.9%.
95.49% of PKG stock’s outstanding share float is owned by institutional investors.
Packaging Corp of America PKG Stock As A Short-Term Trade Using Options
Short-term oriented traders can use options to capitalize on PKG stock’s price movements, while also hedging against broader market volatility.
I am looking at the contracts with the 6/17 expiration date.
The $145, $150 & $155 call options are all in-the-money, but are very illiquid with only 238 contracts between the three strike prices.
The $175, $170 & $165 put options are also all in-the-money, but have severely illiquid open interest levels (3 contracts)
Tying It All Together
PKG stock has a lot of characteristics that make it an interesting potential addition to your portfolio strategy.
Investors will like their valuation metrics & dividend yield, but may want to do more digging into their balance sheet before buying.
Traders will like their current momentum in this environment, but will likely be disappointed by the liquidity of their options contracts.
All-in-all, it is worth taking a closer look at PKG stock to see how it can fit into your portfolio’s strategy.
*** I DO NOT OWN SHARES OF PKG STOCK AT THE TIME OF PUBLISHING THIS ARTICLE ***