The VIX closed at 19.43, indicating an implied one day move of +/-1.22% & an implied one month move of +/-5.62% for the S&P 500.
Highest Technical Rated S&P 500 Components Per 2/25/2025’s Close:
1 – PLTR
2 – TPR
3 – GILD
4 – PM
5 – SOLV
6 – FOXA
7 – FOX
8 – TMUS
9 – FTNT
10 – RL
Lowest Technical Rated S&P 500 Components Per 2/25/2025’s Close:
1 – CE
2 – MRNA
3 – WST
4 – FMC
5 – SWKS
6 – EIX
7 – FSLR
8 – LW
9 – AMD
10 – AKAM
Highest Volume Rated S&P 500 Components Per 2/25/2025’s Close:
1 – SRE
2 – SOLV
3 – BSX
4 – PODD
5 – TT
6 – OTIS
7 – PWR
8 – SBAC
9 – AMT
10 – PSA
Lowest Volume Rated S&P 500 Components Per 2/25/2025’s Close:
1 – ALL
2 – CTVA
3 – RVTY
4 – BA
5 – GNRC
6 – ROK
7 – JNPR
8 – FRT
9 – HOLX
10 – TEL
Highest Technical Rated ETFs Per 2/25/2025’s Close:
1 – BABX
2 – BOIL
3 – YINN
4 – UNG
5 – XPP
6 – MSTZ
7 – SMST
8 – KTEC
9 – AMDS
10 – KSTR
Lowest Technical Rated ETFs Per 2/25/2025’s Close:
1 – MSOX
2 – KOLD
3 – BCHG
4 – YANG
5 – CONL
6 – AMDL
7 – MRNY
8 – CNBS
9 – CONY
10 – ZCSH
Highest Volume Rated ETFs Per 2/25/2025’s Close:
1 – LIAG
2 – UNIY
3 – BMVP
4 – IMAY
5 – ISEP
6 – EMEQ
7 – IPAV
8 – OVT
9 – SHRT
10 – ZIG
Lowest Volume Rated ETFs Per 2/25/2025’s Close:
1 – CCNR
2 – QMAG
3 – TBFC
4 – TSEC
5 – QCAP
6 – TOAK
7 – FCA
8 – ARP
9 – IIGD
10 – CARK
Highest Technical Rated General Stocks Per 2/25/2025’s Close:
1 – SXTC
2 – DOMH
3 – ONVO
4 – PWRMF
5 – VNET
6 – ZNOG
7 – STEC
8 – KC
9 – RAASY
10 – ATGL
Lowest Technical Rated General Stocks Per 2/25/2025’s Close:
1 – MULN
2 – CYCU
3 – CYN
4 – NKLA
5 – CHSN
6 – FTEL
7 – GCTK
8 – LGMK
9 – ACON
10 – LTRPB
Highest Volume Rated General Stocks Per 2/25/2025’s Close:
1 – ONVO
2 – WAFU
3 – FMTO
4 – BREA
5 – LVTX
6 – GTBP
7 – ADIL
8 – MFI
9 – RDHL
10 – VERO
Lowest Volume Rated General Stocks Per 2/25/2025’s Close:
1 – DBIN
2 – CYTOF
3 – PSYTF
4 – EDSA
5 – BRYFF
6 – PLSDF
7 – PLLTL
8 – NHYKF
9 – AHOTF
10 – OPWEF
*** THE LIST ABOVE IS STRICTLY FOR INFORMATIONAL PURPOSES – I MAY OR MAY NOT HAVE OR INITIATE A LONG, SHORT, OR LONG/SHORT POSITION IN ANY NAME ABOVE AT ANY TIME ***
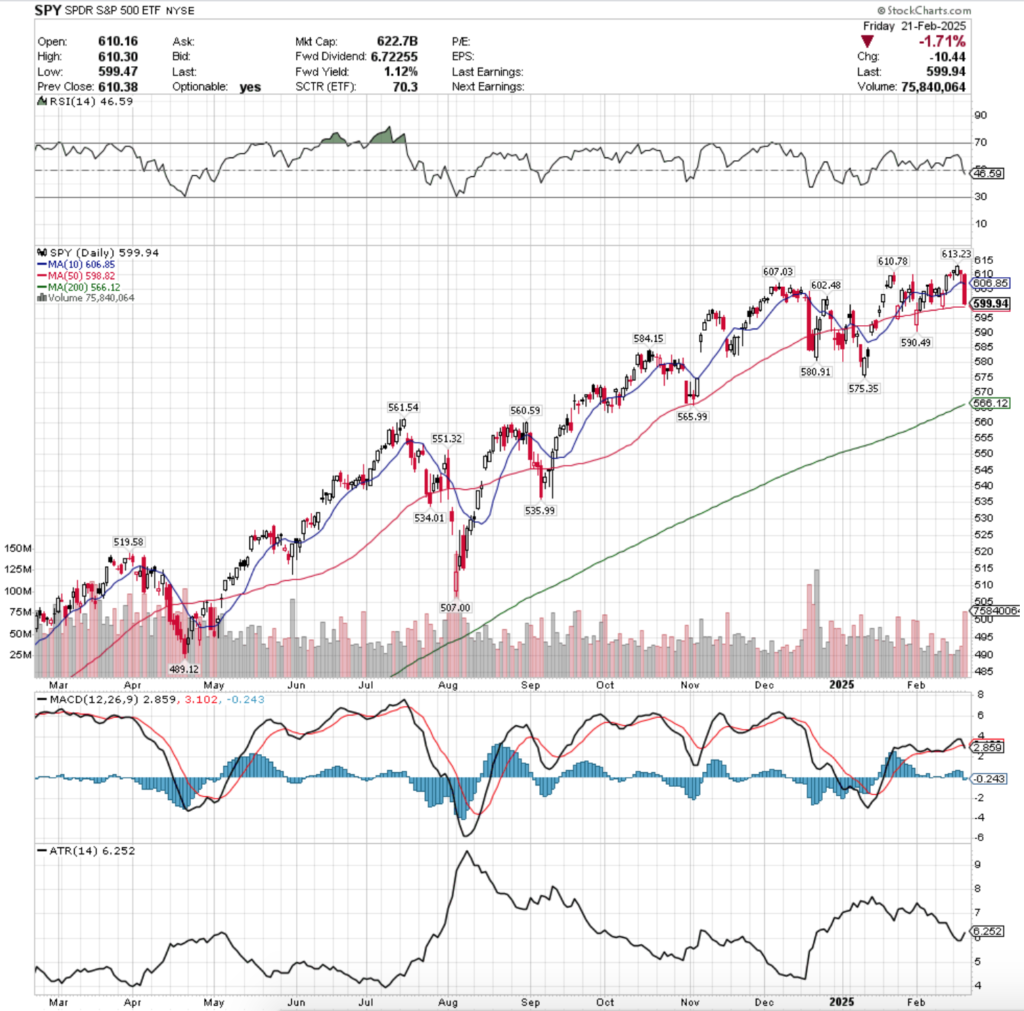
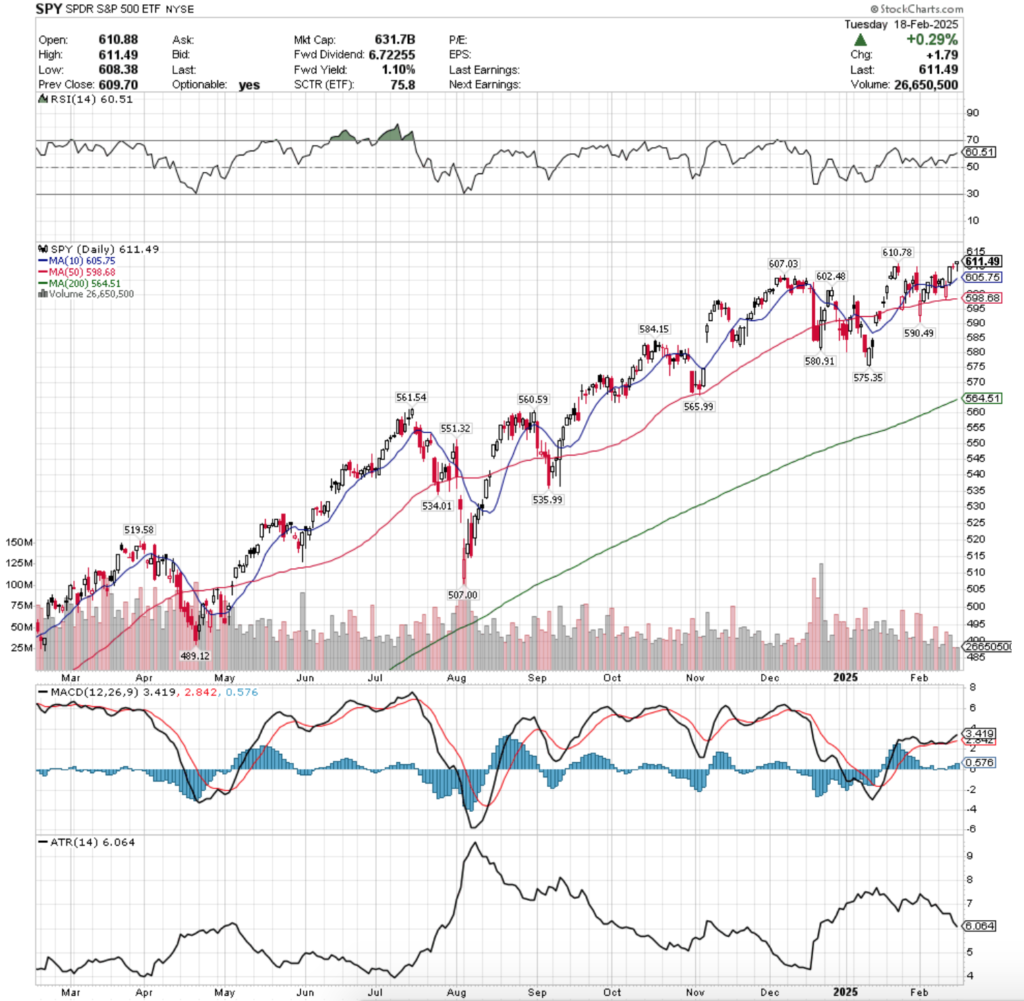
SPY, the SPDR S&P 500 ETF dropped -1.6% this week, while the VIX closed the week out at 18.21, indicating an implied one day move of +/-1.15% & an implied one month move of +/-5.26%.
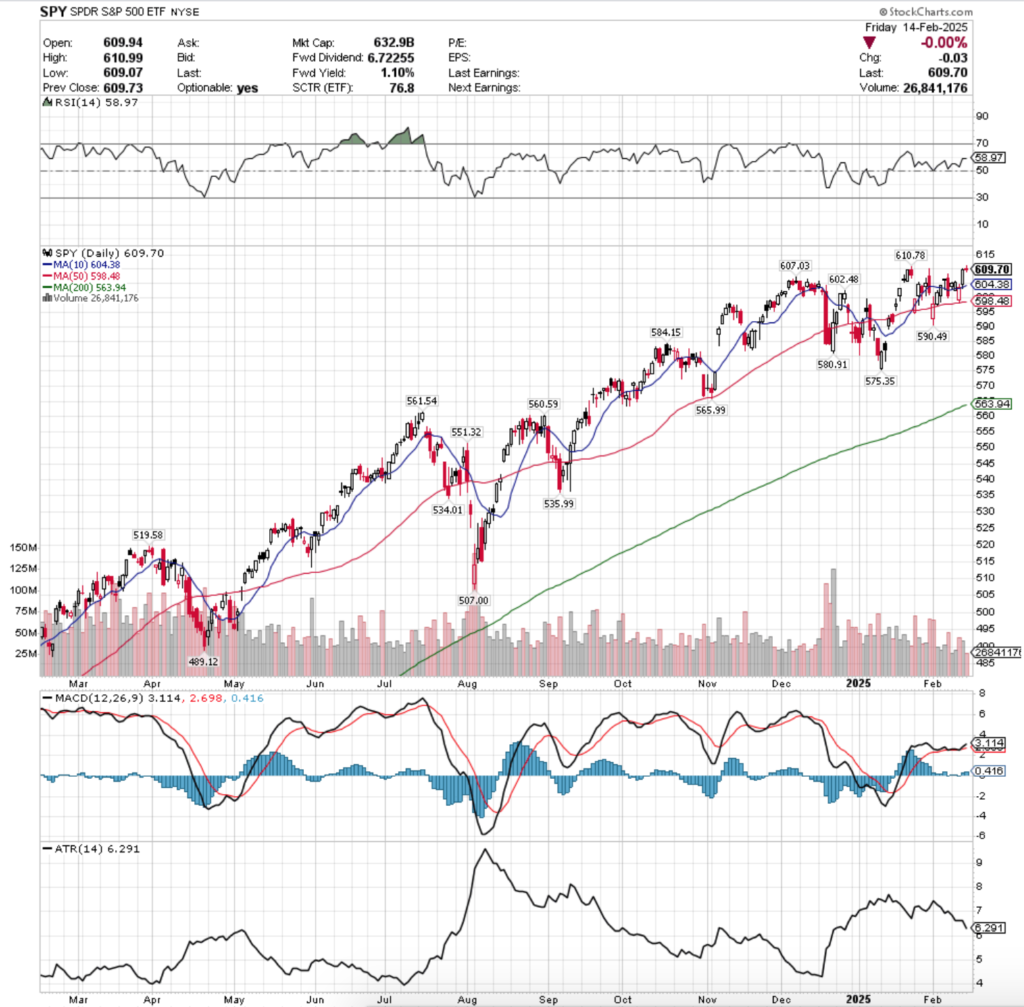
SPY ETF – SPDR S&P 500 ETF’s Technical Performance Over The Past Year
The RSI just crossed bearishly through the neutral 50 mark, while their MACD crossed over bearishly on Friday.
Volumes were -19.47% lower than the previous year’s average (42,707,500 vs. 53,030,635), which carries bearish sentiment with it given that the opening two sessions of the week were advancing, but had the lowest volumes of the week.
Readers should also refer to last week’s note where we broke down the major declines in prior year’s volume from today’s levels to the same metric from one year ago to see how this weak participation rate is even worse given how much less volume this past year has seen vs. the prior year.
Tuesday kicked last week off on a rather ominous note as the extremely low volume session resulted in a hanging man candle (bearish) that also closed lower than it opened, after an opening gap up from the previous Friday’s close.
Wednesday’s candle formed a bullish engulfing pattern with Tuesday’s, but with the same low volume turnout there was nothing to get excited about for SPY.
Thursday confirmed this when SPY opened in the middle of Wednesday’s range, before plunging lower & testing the support of the 10 day moving average.
Volumes were slightly higher than the preceding two days, and the day’s candle formed a bearish harami pattern.
Friday opened lower & on the highest volume of 2025 SPY plunged through the support of their 10 day moving average & made a run lower at the 50 DMA’s support level.
As I am finishing writing this on Tuesday morning SPY has already broken through the 50 DMA, which brings us to an interesting week ahead.
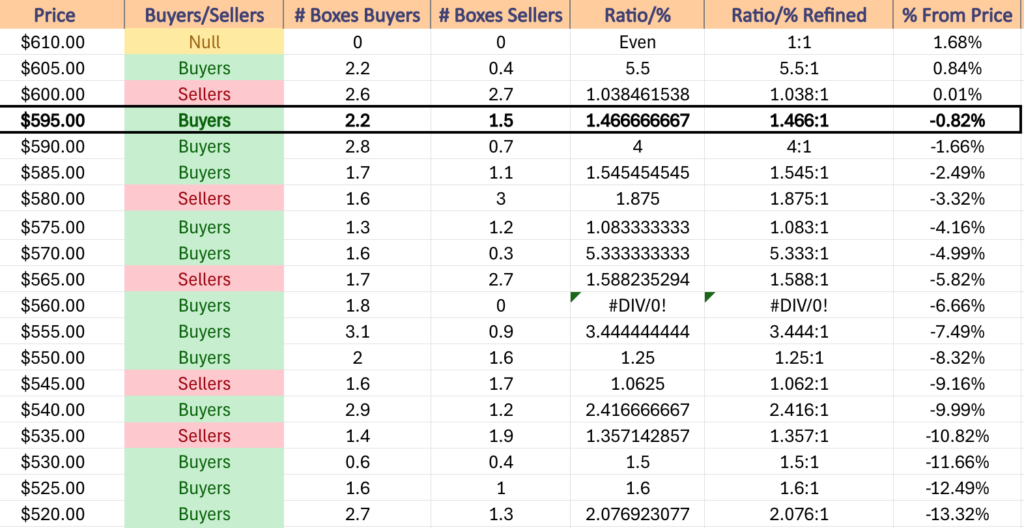
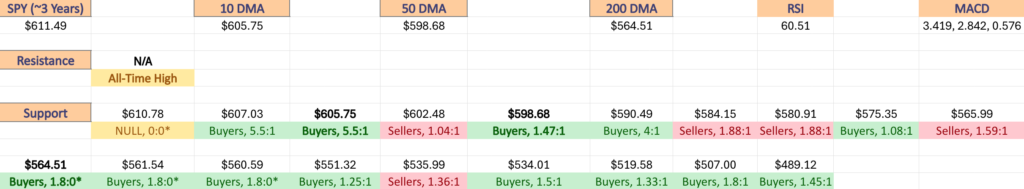
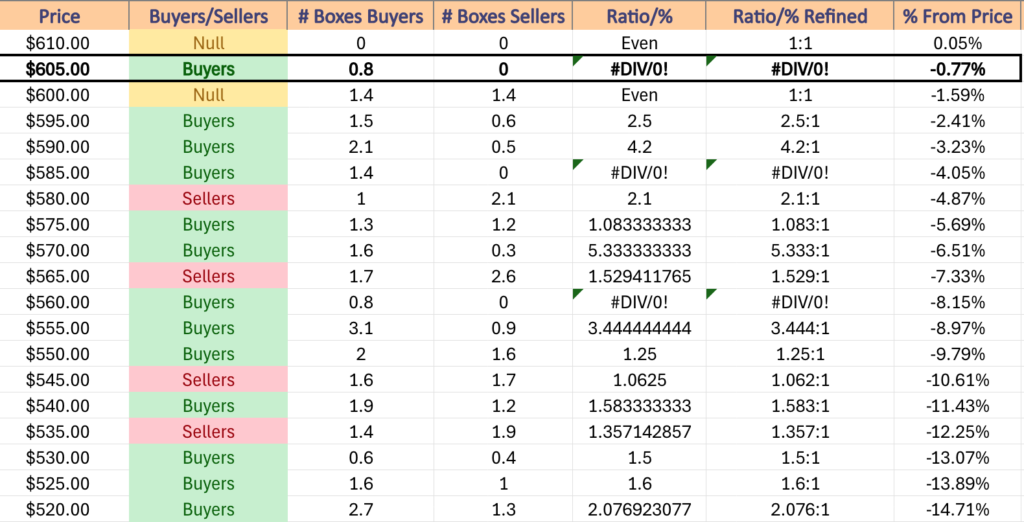
As the table below notes, there is now (Tuesday) only one support level between SPY’s current price & a price zone that has been dominated by the Sellers at a rate of 1.88:1 over the past ~2-3 years.
This makes it likely that these support levels will not be able to sustain SPY’s current declines, which would mean prices are scheduled to drop -3.32%+ from Friday’s closing price.
It seems unlikely that SPY will see any major advances this week, and the most likely outcome will be either a continued decline & or a consolidation around the 50 day moving average.
NVIDIA Corp.’s earnings call tomorrow afternoon will likely be the linchpin that dictates which of those two outcomes occurs.
It will require a massive beat in order to see a turnaround for SPY & the advances to continue, making this week’s theme to watch for is how closely aligned SPY’s price stays with their 50 day moving average.
In the event of declines & changing (lowering) of support levels, the table below is useful to measure the strength or weakness of the new support/resistance levels.
One other item that should be on readers’ radar in the coming weeks is that the 200 day moving average (long-term trend) is -5.64% below Friday’s closing price.
That long-term trend line is also located in a Seller dominated zone, meaning that SPY’s long-term trend is potentially at risk of breaking down, as Sellers have been the favorites of the $565-569.99/share zone at a rate of 1.59:1 over the past ~2-3 years.
This will be especially interesting to watch if the price remains below the 10 & 50 day moving averages for many days or if it strays too far south of them.
SPY has support at the $598.82 (50 Day Moving Average, Volume Sentiment: Buyers, 1.47:1), $590.49 (Volume Sentiment: Buyers, 4:1), $584.15 (Volume Sentiment: Sellers, 1.88:1) & $580.91/share (Volume Sentiment: Sellers, 1.88:1), with resistance at the $602.48 (Volume Sentiment: Sellers, 1.04:1), $606.85 (10 Day Moving Average, Volume Sentiment: Buyers, 5.5:1), $607.03 (Volume Sentiment: Buyers, 5.5:1) & $610.78/share (Volume Sentiment: NULL, 0:0*).
SPY ETF’s Price Level:Volume Sentiment Over The Past ~2-3 Years
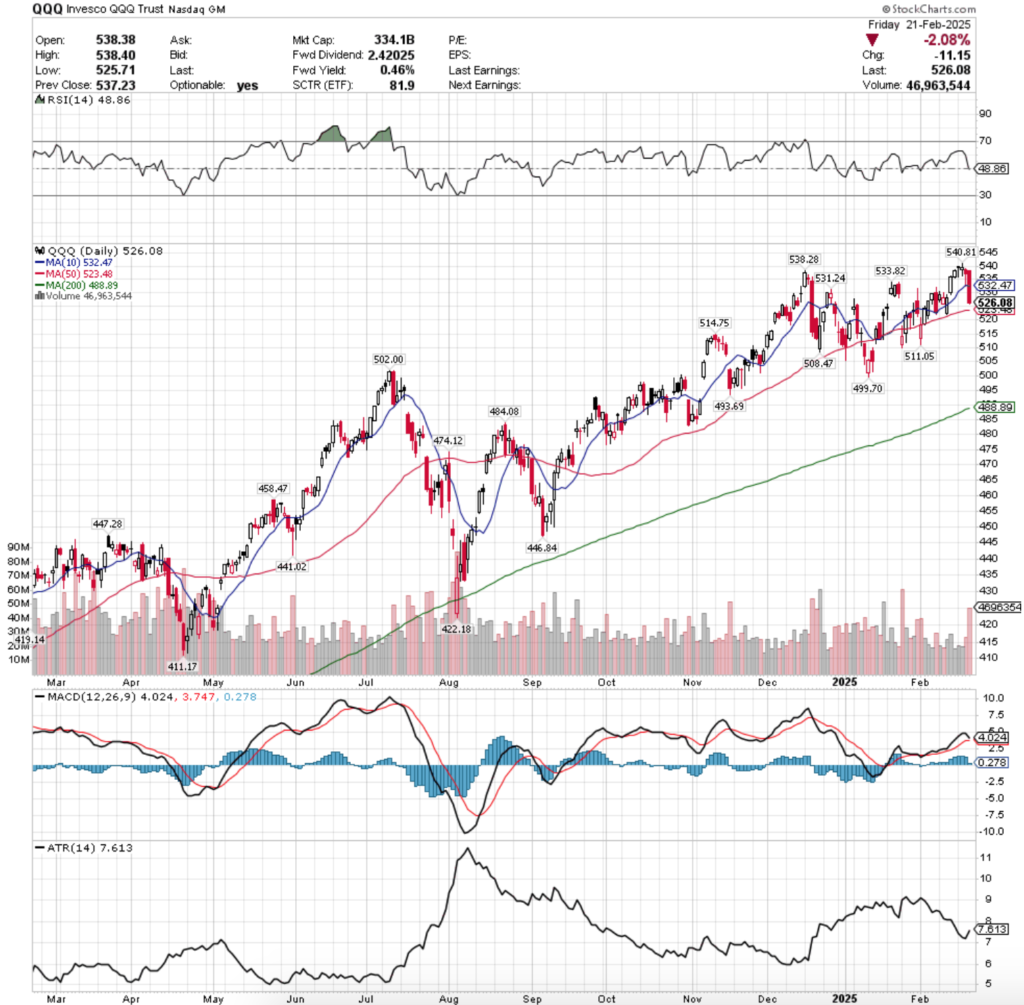
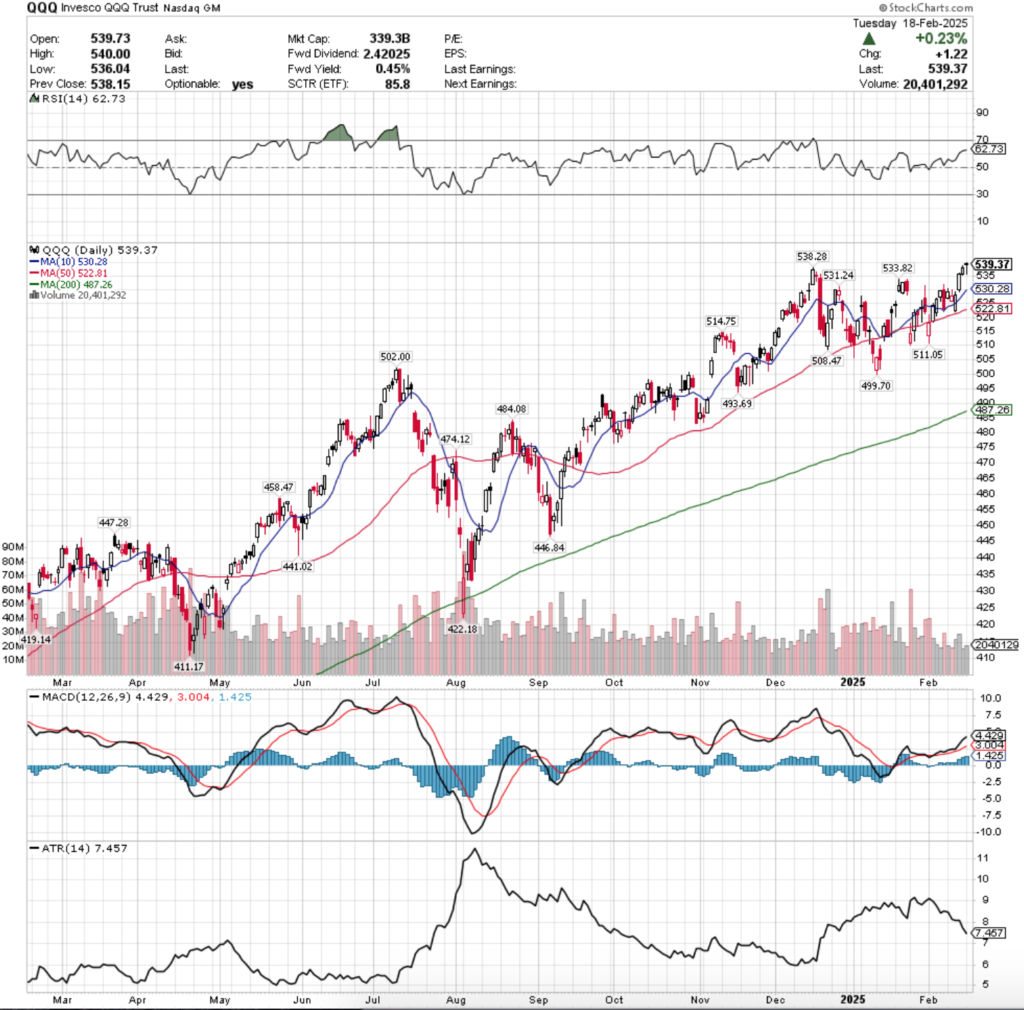
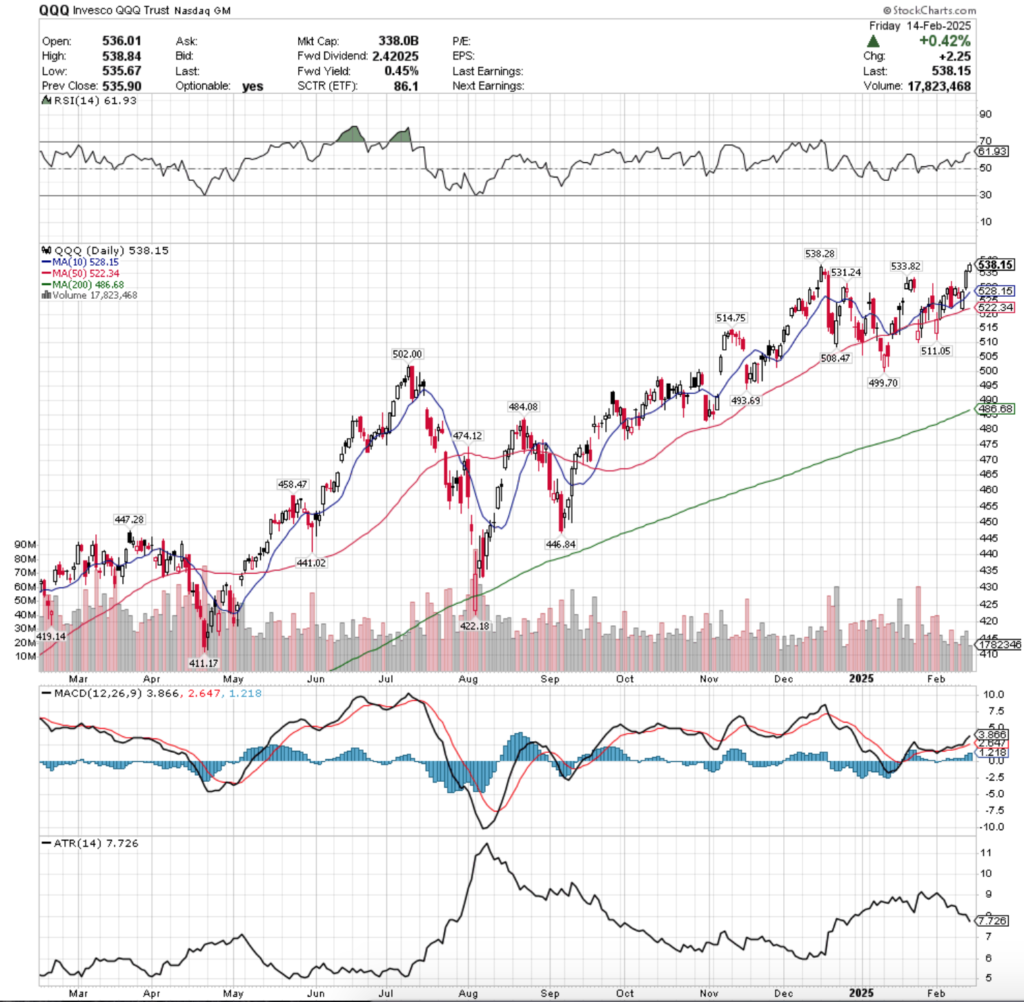
QQQ, the Invesco QQQ Trust ETF fell -2.24% last week, as the tech heavy index was not immune to the turbulence across broader markets.
QQQ ETF – Invesco QQQ Trust ETF’s Technical Performance Over The Past Year
The RSI also just crossed bearishly through the neutral 50-mark, while their MACD ended the week ready to bearishly crossover early this week.
Volumes were -18.83% below the previous year’s average (28,470,000 vs. 35,075,000), which much like SPY above is concerning given how low their current prior year’s average level is compared to that same metric from one year ago.
Tuesday kicked the week off in a similar manner to SPY, as QQQ opened on a gap up, but was forced lower to retrace most of the previous day’s range throughout the session on light volume & ultimately closed higher, but lower than it opened.
The uncertainty & skittishness continued into Wednesday, when another low participation session took place & the session ended as a high spinning top, indicating extreme uncertainty with a dash of nervousness among market participants.
Wednesday opened lower but was able to recover by the close & close higher on a day, but the caution lights were flashing brightly.
Thursday confirmed this when QQQ opened lower, briefly tried to climb higher, but was rejected & wound up going all the way down to test the support of the 10 day moving average.
While the support held up for Thursday, the session still resulted in a hanging man candle (bearish) & it became clear that with a little more volume there would be steeper losses on the horizon.
Friday delivered both the volume & the declines, as the third most active day of the year for QQQ fell straight through the 10 day moving average’s support, as market participants were all eager to hop out of the pool taking limited risk into the weekend.
While QQQ closed above the 50 day moving average’s support on Friday, it should be noted that it was only -0.49% below it when the session ended.
With the MACD set to crossover bearishly in the first half of this week, there will be a breakdown of QQQ’s 50 DMA.
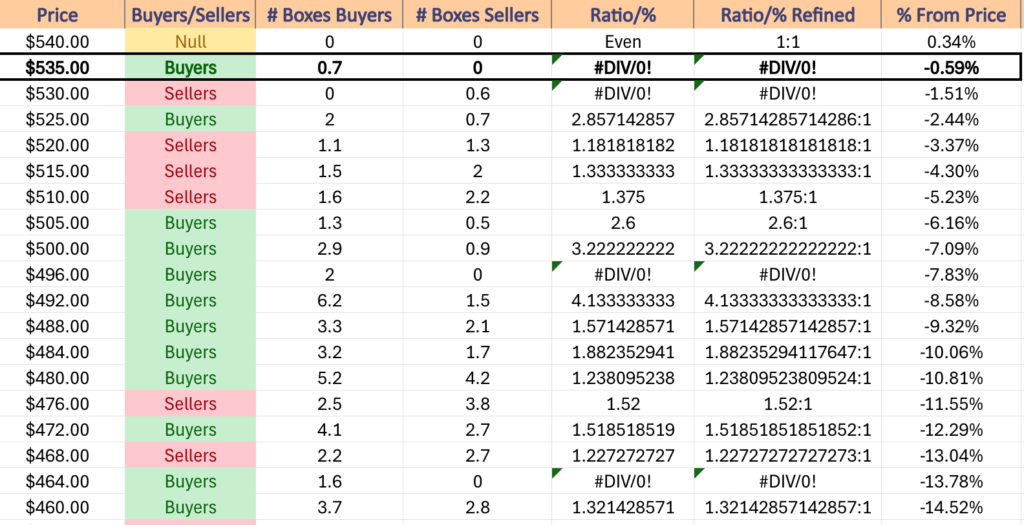
This is problematic, as the next two support levels for QQQ are in Seller dominated zones (see table below) & the lower range of the bottom zone is a -4.01% decline from Friday’s closing price.
While NVDA is sure to impact the price of QQQ this week, as we’ve published for weeks now anything to the upside that has staying power will need a big improvement in volume, else it should be viewed with skepticism.
All eyes should be watching how the price & 50 day moving average move in relation to one another this week, as pending no high volume pivot north & no outright disappointing news the best case scenario currently looks like QQQ’s price will move around straddling the 50 DMA’s support/resistance.
In the event of outright declines, the $499.70/share support level will be an area to keep an eye on as it occurs in a zone with limited data on historic selling pressure, as Buyers have typically outdone Sellers at a rate of 2:0*, which may mean we get to see more sellers emerge at this level.
It’s also important as its the second to last support level before the 200 day moving average (long-term trend) is approached by QQQ’s price, and in the event of a breakdown it appears that the long-term trend will at least be tested.
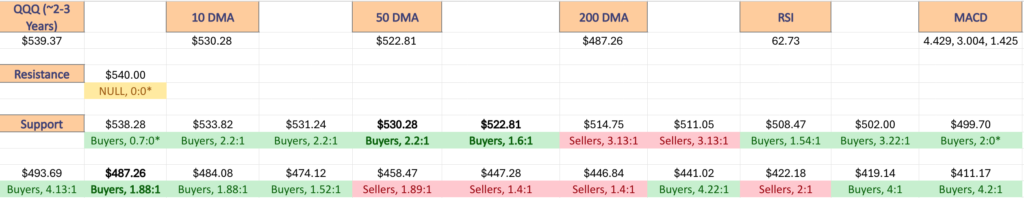
QQQ has support at the $523.48 (50 Day Moving Average, Volume Sentiment: Buyers, 1.6:1), $514.75 (Volume Sentiment: Sellers, 3.13:1), $511.05 (Volume Sentiment: Sellers, 3.13:1) & $508.47/share (Volume Sentiment: Sellers, 1.54:1), with resistance in the $531.24 (Volume Sentiment: Buyers, 2.2:1), $532.47 (10 Day Moving Average, Volume Sentiment: Buyers, 2.2:1), $533.82 (Volume Sentiment: Buyers, 2.2:1) & $538.28/share (Volume Sentiment: Buyers, 0.7:0*).
QQQ ETF’s Price Level:Volume Sentiment Over The Past ~2-3 Years
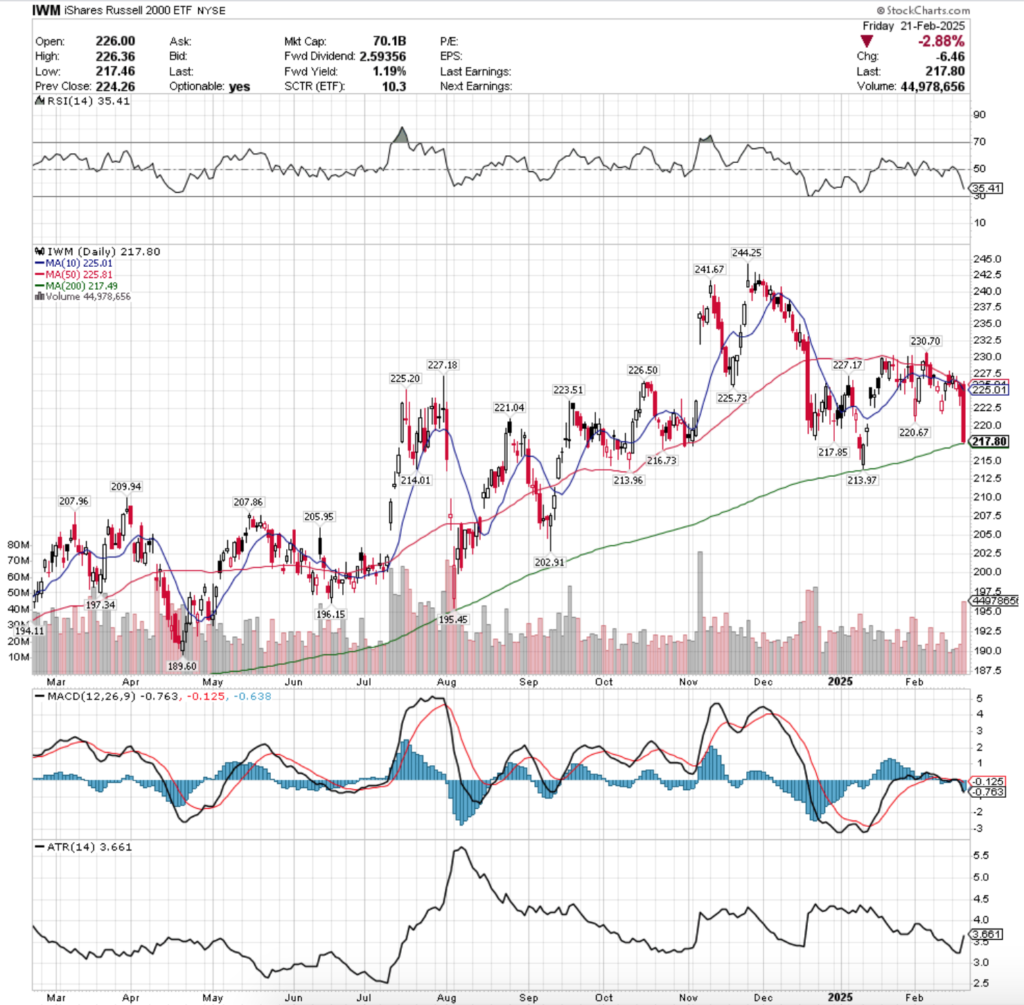
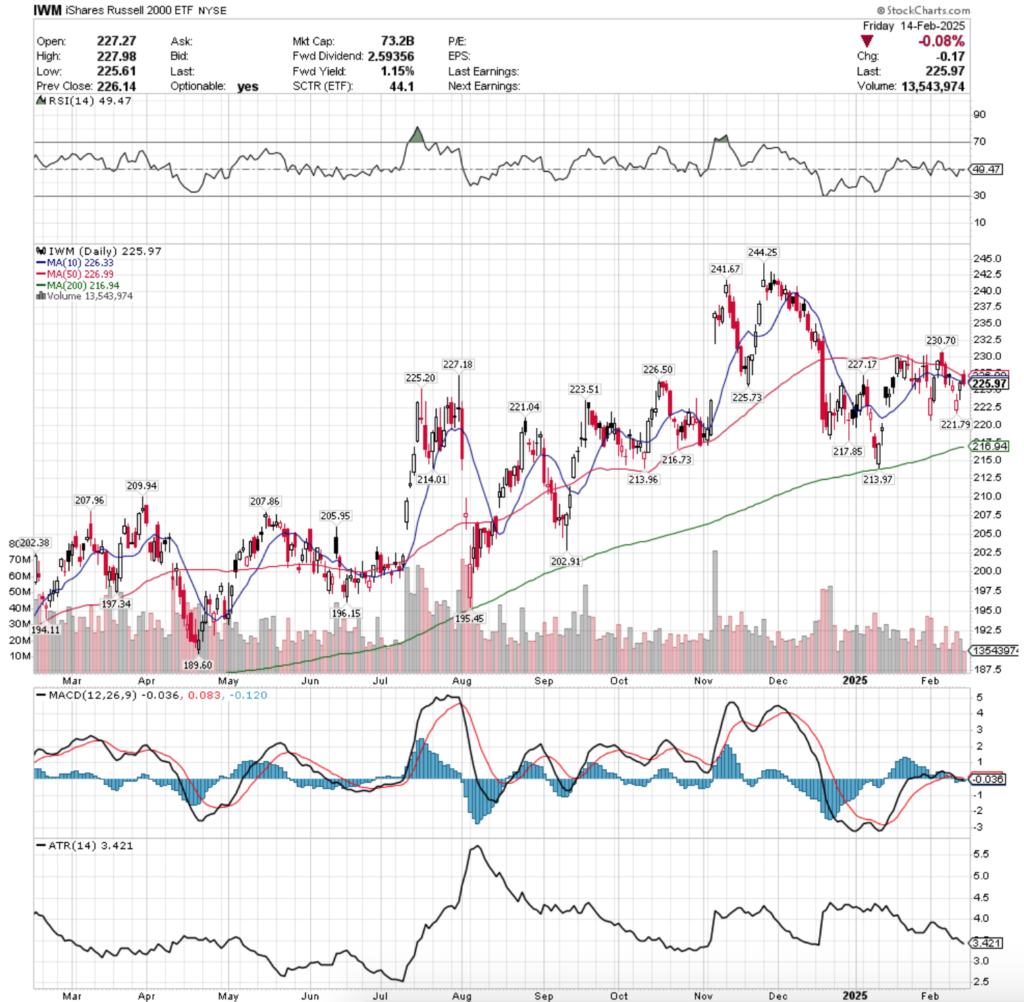
IWM, the iShares Russell 2000 ETF declined -3.62% last week, as the small cap index had the worst performance out of the major four index ETFs.
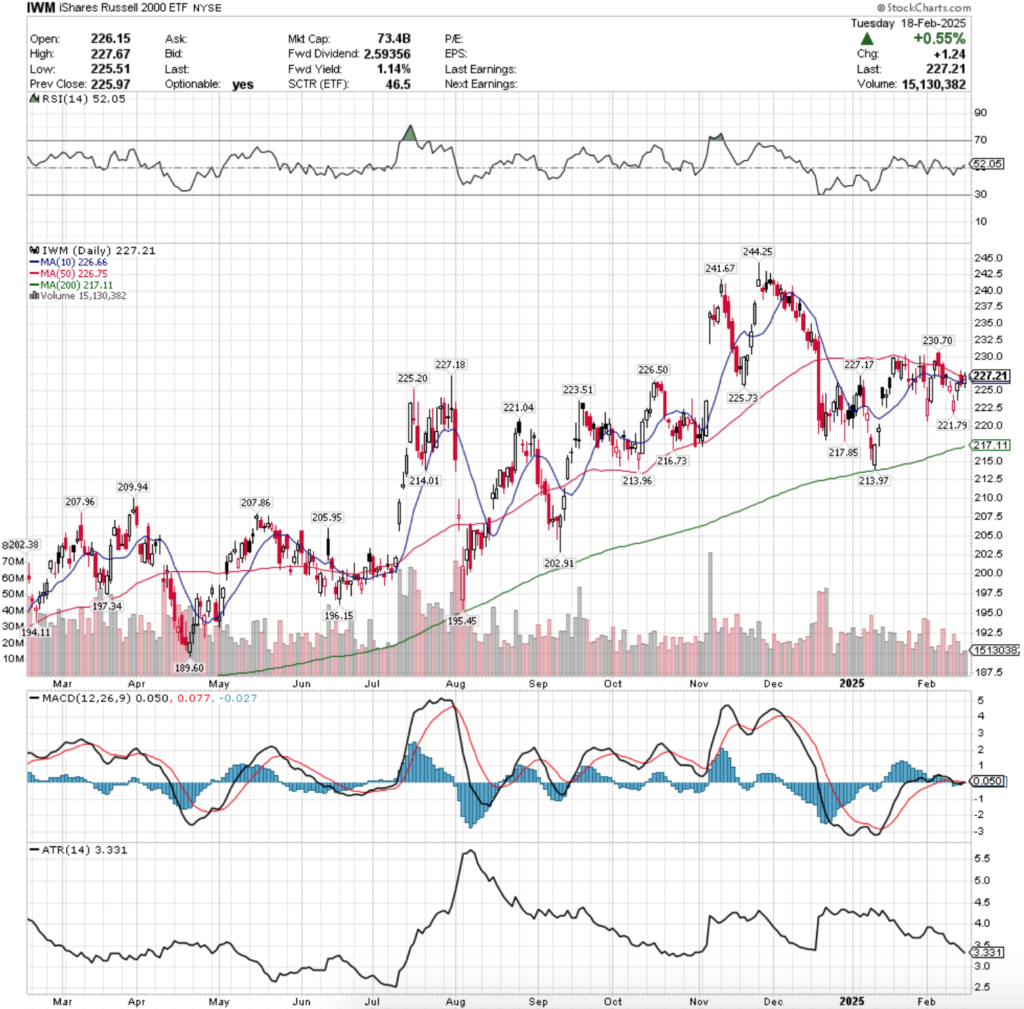
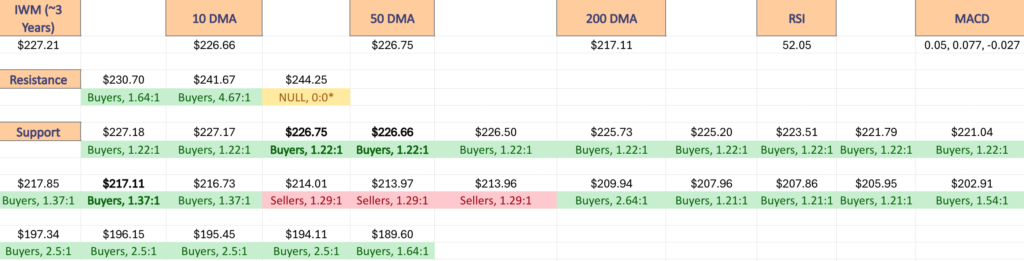
IWM ETF – iShares Russell 2000 ETF’s Technical Performance Over The Past Year
The RSI is approaching oversold territory & currently sits at 35.41, while the MACD has been bearish for the past few sessions.
Volumes were -17.72% below the prior year’s average (23,727,500 vs. 28,836,032), which is even low based on the standards of the prior two index ETF’s Y-o-Y comparisons, as IWM’s look-back comparison is only ~-15% from one year ago.
Tuesday started the week off on a positive, but worrisome note for the already battered IWM, as the week’s lowest volume session resulted in slight gains.
Wednesday saw the unraveling begin, with a gap down open that was below both the closely-knit 10 & 50 DMAs, and prices were able to run higher, temporarily breaking above each, but the day closed with low volume & in-line with the moving averages.
Thursday saw an uptick in volume, as IWM opened in-line with the 10 & 50 day moving averages, before cratering lower & leaving a lower shadow that showed that was still a lot of bearish sentiment abound.
Friday brought one of last week’s observations to the forefront quickly, as the session opened just above the 10 & 50 day moving averages, but the sellers came out at the highest level of 2025 to drive IWM’s price lower, to the point of temporarily breaking through the 200 DMA’s support.
IWM still closed just above the long-term trend line, but it became clear that there is appetite for IWM to continue lower in the near-term.
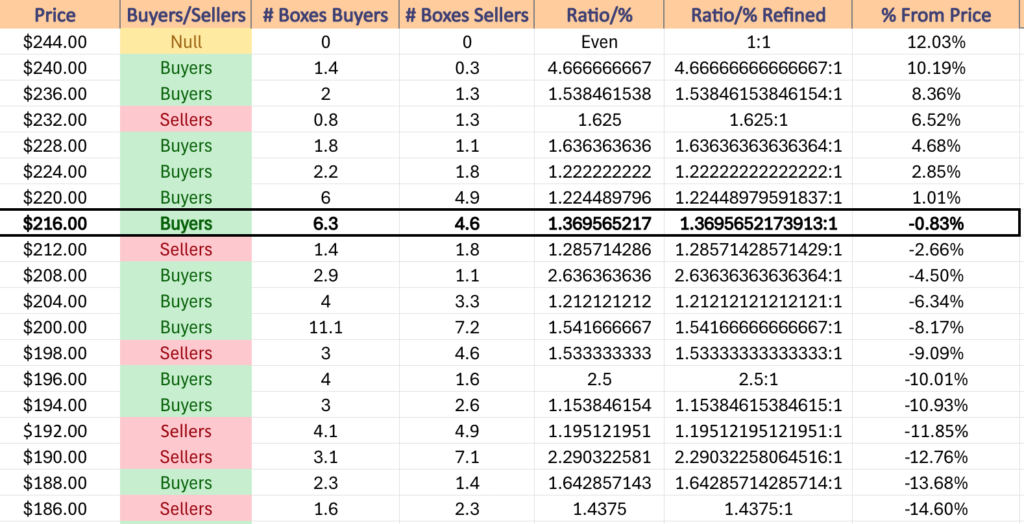
This is especially likely given that the $212-215.99/share price zone is historically a Seller’s Paradise at a rate of 1.29:1 over the past ~2-3 years.
In the event that this long-term trend does break down, it will be prudent to keep an eye on how the $208/share level holds up, as the Buyer dominated zones beneath it are not as strong as the $208-211.99 zone.
Otherwise, the current best case near-term scenario looks to be IWM oscillating around the 200 DMA while it continues its recent consolidation.
While it isn’t impossible, any upside move would need a great deal of volume behind it before it shows to have any staying power & sustainability, and it would also be stuck beneath some strong resistance levels/zones.
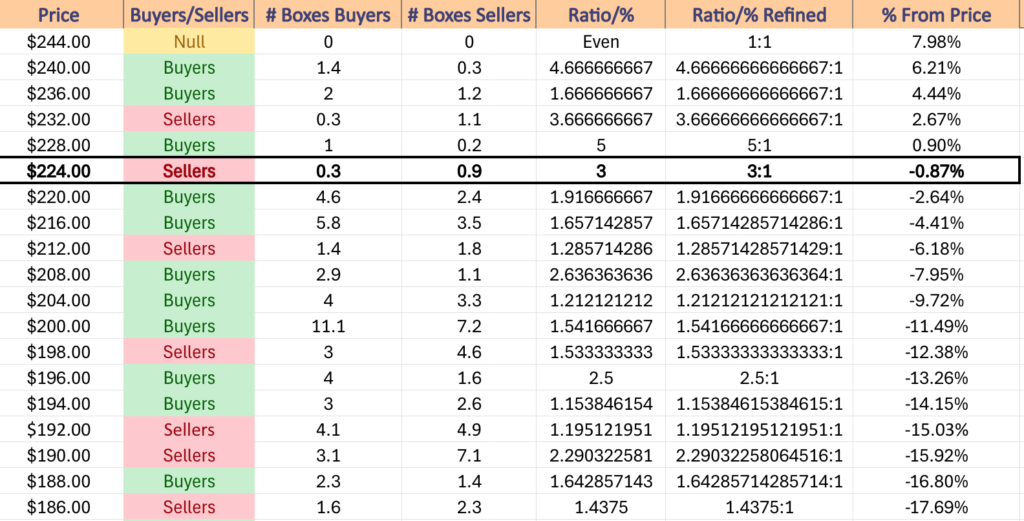
It would be wise to reference the table below in the coming weeks in regards to IWM’s price levels & support/resistance.
IWM has support at the $217.49 (200 Day Moving Average, Volume Sentiment: Buyers, 1.37:1), $216.73 (Volume Sentiment: Buyers, 1.37:1), $214.01 (Volume Sentiment: Sellers, 1.29:1) & $213.97/share (Volume Sentiment: Sellers, 1.29:1), with resistance at the $217.85 (Volume Sentiment: Buyers 1.37:1), $220.67 (Volume Sentiment: Buyers, 1.23:1), $221.04 (Volume Sentiment: Buyers, 1.23:1) & $223.51/share (Volume Sentiment: Buyers, 1.23:1).
IWM ETF’s Price Level:Volume Sentiment Over The Past ~2-3 Years
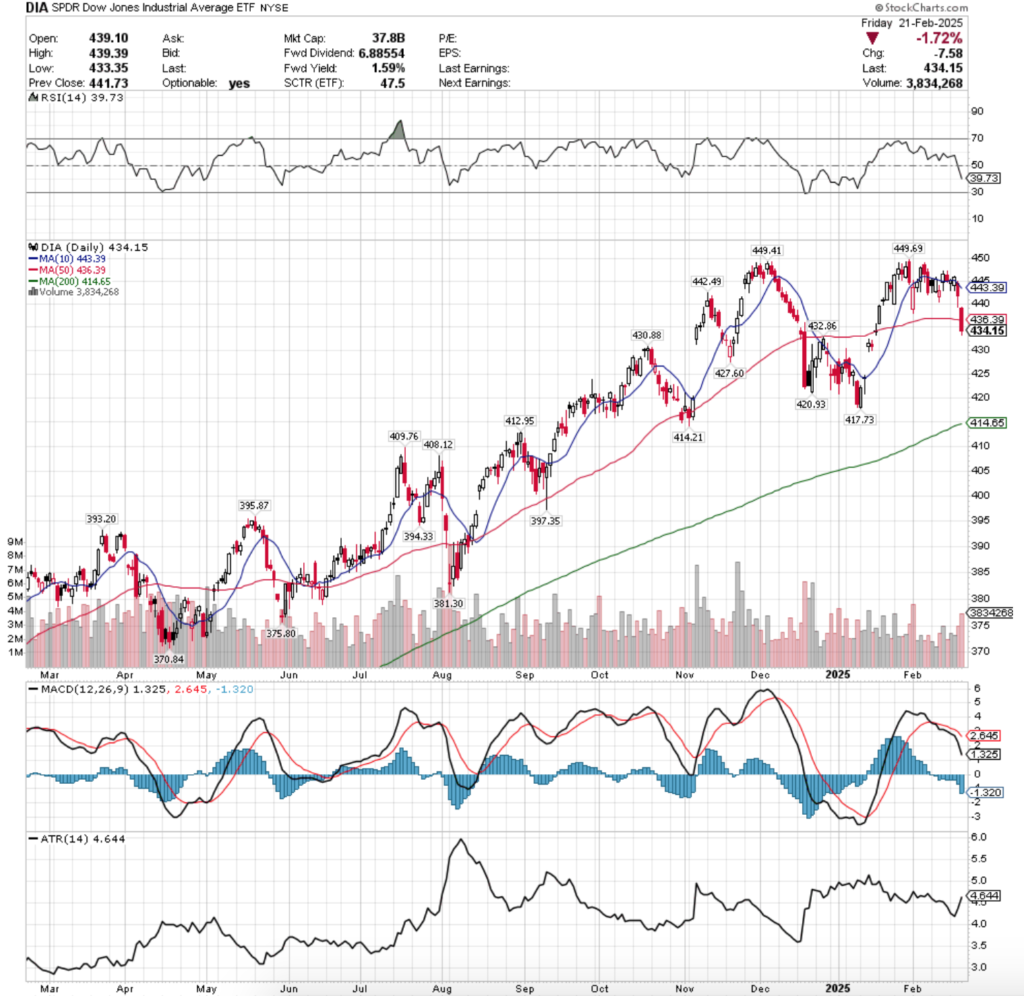
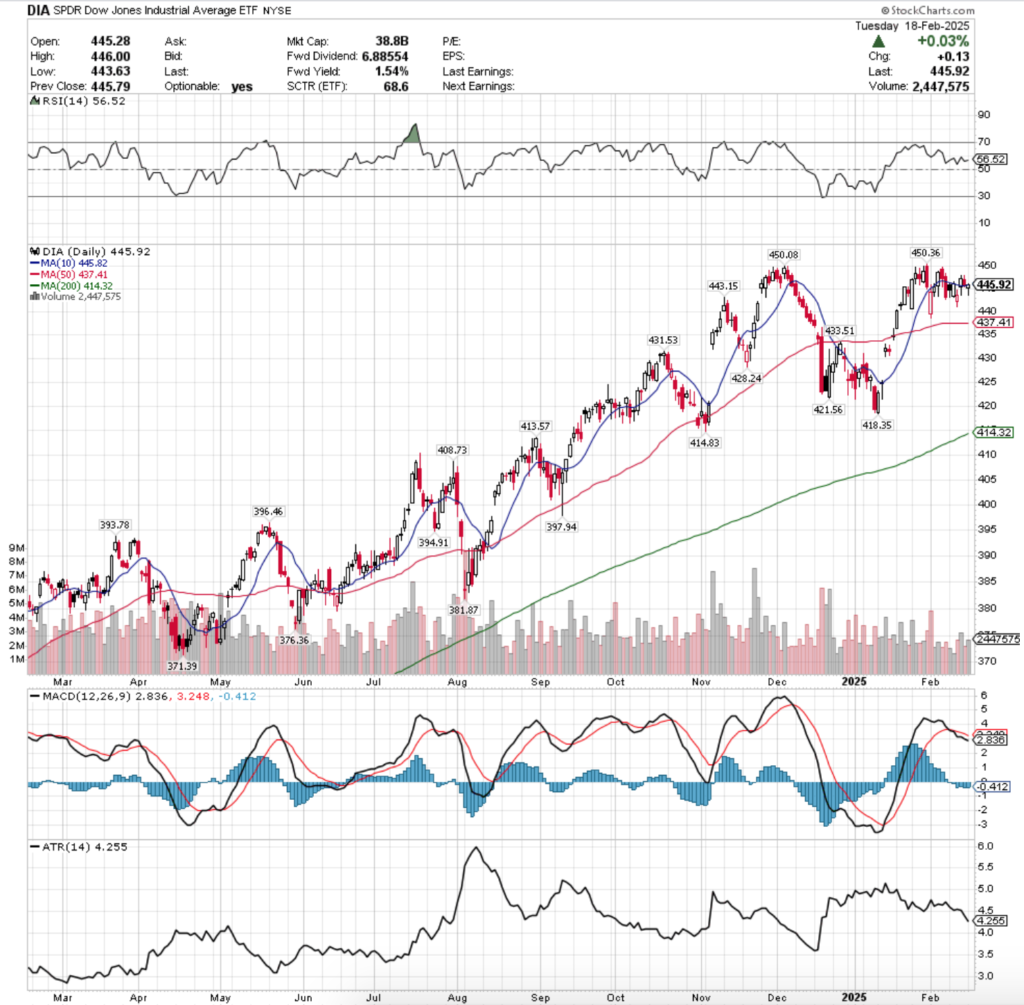
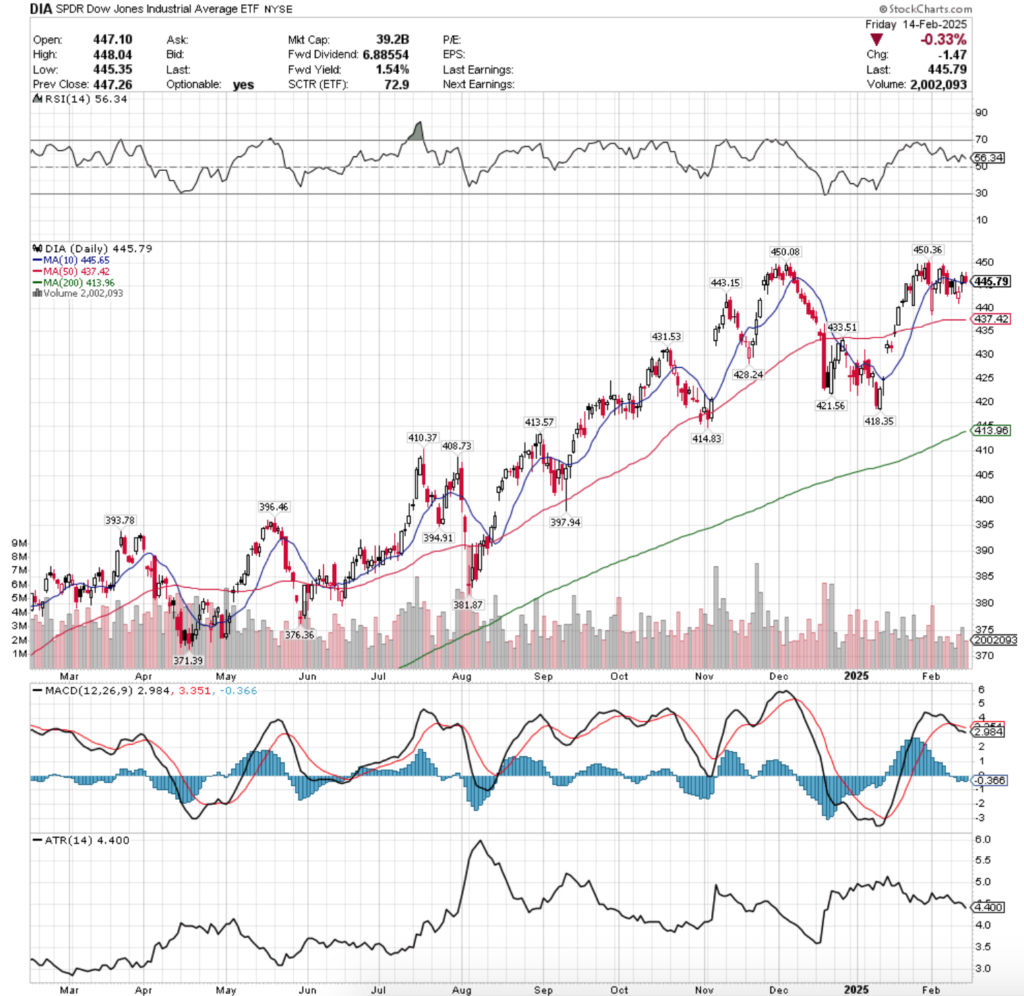
DIA ETF – SPDR Dow Jones Industrial Average SPDR ETF’s Technical Performance Over The Past Year
The RSI is also approaching the oversold level of 30 & currently sits bearishly at 39.73, while the MACD has been bearish for the past couple of weeks.
Volumes were -11.62% lower than the previous year’s average (2,872,500 vs. 3,250,159), which is a warning sign given that their Y-o-Y prior year’s average volume is only down -6%, so there is a bit of fear out there.
Tuesday saw a low volume session that’s lower shadow on the day’s candle & the fact that the day closed in-line with the resistance of the 10 day moving average signaled that there was a bit of trouble ahead for DIA.
Wednesday opened on a gap lower, tested to about the same depths as Tuesday, before powering north of the 10 DMA’s resistance to close above it for an advancing session.
However, the low volume levels did not provide adequate confirmation that the move had any traction.
Thursday opened lower, near in-line with the 10 DMA’s support, before caving & at one point trading below the $440/share mark.
Volumes ticked up on Thursday, hinting that there would be a big risk-off into the weekend session.
DIA provided that on Friday, while on the highest volume of the week & second highest of the year they opened on a gap down, blew through the 50 day moving average & continued lower, closing in a daily decline of -1.72%.
With the 50 DMA broken through, it puts the long-term trend in danger, as it sits -4.5% below Friday’s closing price.
Now that the 10 & 50 DMAs are both sitting atop the price, it looks like there will be continued weakness & some profit taking in the coming week(s) for DIA.
One area of strength that they have is that there are more support touch-points along the way down to the 200 DMA re-test, but if there are broader market declines that will be of little importance.
Best case outlook for DIA for the rest of the week is a consolidation range around the 50 DMA, but there are a few windows that still haven’t been filled which may lead to a re-test of that long-term trend line sooner than most anticipate.
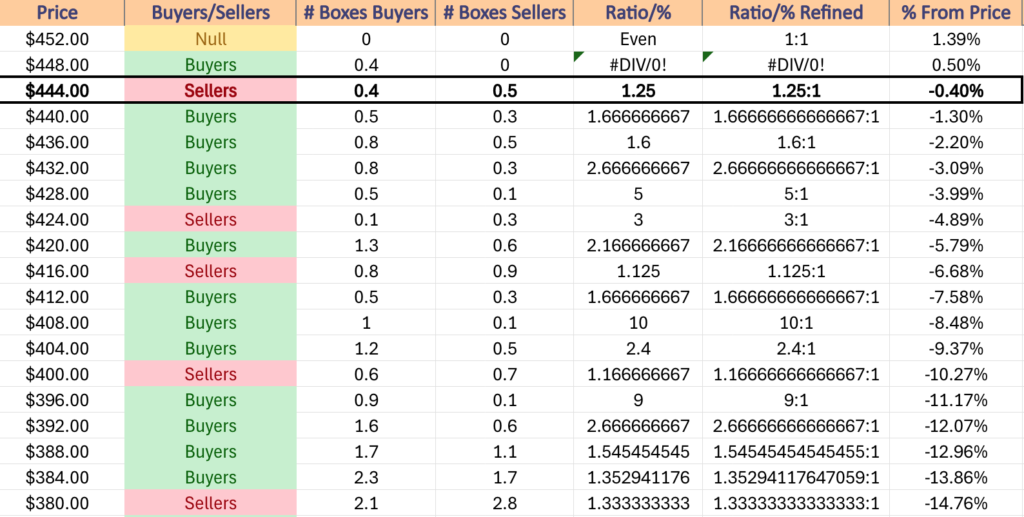
It would be wise to reference the table below as DIA approaches & retests support/resistance levels over the next week or two to understand how market participants have typically behaved at these levels.
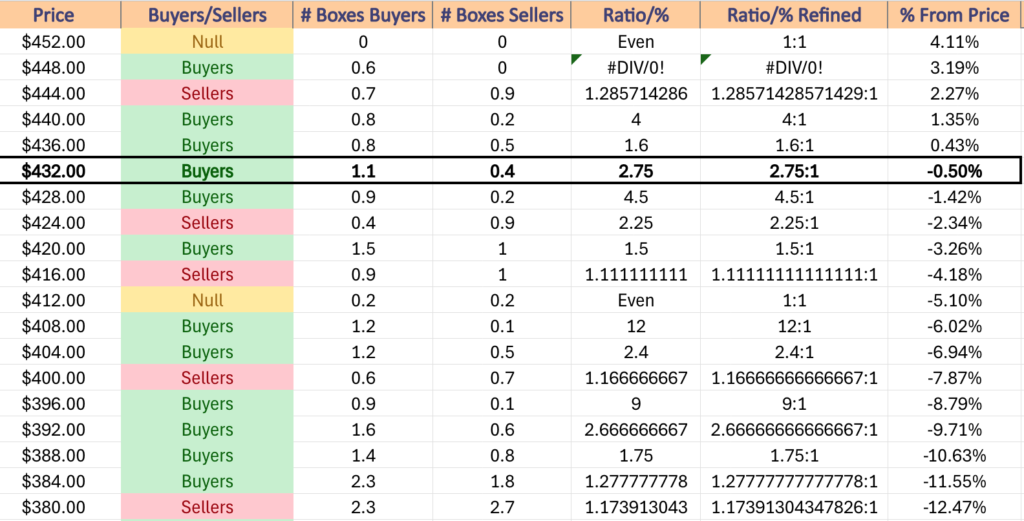
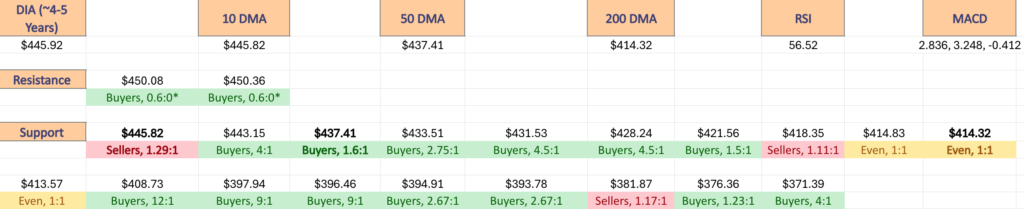
DIA has support at the $432.86 (Volume Sentiment: Buyers, 2.75:1), $430.88 (Volume Sentiment: Buyers, 4.5:1), $427.60 (Volume Sentiment: Sellers, 2.25:1) & $420.93/share (Volume Sentiment: Buyers, 1.5:1), with resistance at the $436.39 (50 Day Moving Average, Volume Sentiment: Buyers, 1.6:1), $442.49 (Volume Sentiment: Buyers, 4:1), $443.39 (10 Day Moving Average, Volume Sentiment: Buyers, 4:1) & $449.41/share (Volume Sentiment: Buyers 0.6:0*).
DIA ETF’s Price Level:Volume Sentiment Over The Past ~4-5 Years
The Week Ahead
Monday has no major economic data due for release.
BioCryst Pharmaceuticals, Clearway Energy, Domino’s Pizza, Fresh Del Monte, KBR, Owens Corning & Westlake all report earnings Monday before the opening bell, followed by Atlas Energy Solutions, Beyond, BWX Technologies, Cannae Holdings, Chegg, Civitas Resources, Clean Energy Fuels, Cleveland-Cliffs, Coterra Energy, Diamondback Energy, Douglas Dynamics, EverQuote, Goosehead Insurance, Helios Technologies, Hims & Hers Health, JBT Marel, LTC Properties, MediaAlpha, Myriad Genetics, Navitas Semiconductor, ONEOK, Primoris Services, ProAssurance, Public Storage, Quaker Chemical, Realty Income, Riot Platforms, SBA Communications, Tempus AI, Topgolf Callaway Brands, Trex, Trip.com Group, Ultra Clean Holdings, V2X, Veracyte, Viper Energy Partners, Ziff Davis & Zoom Communications, after the session’s close.
Fed President Logan speaks Tuesday at 3:20 am, followed by S&P Case-Shiller Home Price Index (20 Cities) at 9 am & Consumer Confidence at 10 am.
Tuesday’s pre-market earnings calls include Home Depot, AdaptHealth, Alcon, Amer Sports, American Tower, Archrock, Arcus Biosciences, Armstrong World Industries, Bank of Montreal, Bank of Nova Scotia, Carter’s, CECO Environmental, CG Oncology, Delek US Holdings, Diana Shipping, DigitalOcean, Driven Brands, Easterly Government Properties, Elanco Animal Health, Expro Group, GFL Environmental, Harmony Biosciences, Henry Schein, Integra, Interface, International Game Technology, Itron, Keurig Dr Pepper, Kiniksa Pharmaceuticals, Kontoor Brands, Krispy Kreme, LGI Homes, LivaNova, Novanta, Pinnacle West, Planet Fitness, Portillo’s, Public Service, Sealed Air, Sempra Energy, Shoals Technologies, Shutterstock, Super Group, TopBuild, Viking Holdings, Xenia Hotels & Xometry, with Agilon Health, AMC Entertainment, Axon, B&G Foods, Boston Beer, Caesars Entertainment, Camping World, CAVA Group, CCC Intelligent Solutions, Chord Energy, Coupang, Day One Biopharmaceuticals, ExlService, Extra Space Storage, First Solar, Flywire, Grocery Outlet, Huron Consulting, Inogen, Instacart, Interparfums, Intuit, Jack In The Box, Jazz Pharmaceuticals, Keysight Technologies, Lemonade, Light & Wonder, Lucid Group, Maravai Life Sciences, Masimo, Matson, Merit Medical, National Health, ODDITY Tech, OraSure, OUTFRONT Media, Par Pacific, Permian Resources, Playa Hotels & Resorts, PROCEPT BioRobotics, Range Resources, Revolve Group, RLJ Lodging Trust, RxSight, Skyward Specialty Insurance Group, Sprout Social, SPX Technologies, Supernus Pharma, TETRA Technologies, The Baldwin Group, Vaxcyte, WEBTOON Entertainment, Workday, Workiva, Zeta Global, ZipRecruiter & ZoomInfo all due to report after the closing bell.
Wednesday features New Home Sales data at 10 am.
ACM Research, Advance Auto Parts, AerCap, APi Group, Astec Industries, AvidXchange, Avista, Bentley Systems, Bloomin’ Brands, Brinks, CBIZ, Centuri Holdings, Clear Secure, Commscope, Dole, DT Midstream, EMCOR Group, Enovis Corp, Federal Signal, Geron, International Money Express, Janus International Group, Lantheus Holdings, Lineage, Loar Holdings, Lowe’s, Madrigal Pharmaceuticals, MGP Ingredients, National Vision, NRG Energy, ODP Corp, Option Care Health, Photronics, Rhythm Pharmaceuticals, Southwest Gas, StandardAero, Steven Madden, Taboola, The Vita Coco Company, United Parks & Resorts, Verisk Analytics & XPEL all report earnings before Wednesday’s opening bell, followed by the much anticipated Nvidia, Salesforce, Agilent Technologies, Albany International, Alphatec, Ambarella, Applied Optoelectronics, Barrett Business, Beyond Meat, Cactus, CareDx, Certara, Chemed, Chesapeake Utilities, Corcept Therapeutics, Dorman Products, eBay, Encore Capital, Energy Recovery, EPR Properties, Essential Utilities, Establishment Labs, EVERTEC, Expand Energy, FirstEnergy, Forward Air, Green Brick Partners, Greif, HEICO, Howard Hughes Holdings, Ibotta, Innovex International, Invitation Homes, IonQ, Joby Aviation, Kinetik, Kratos Defense and Security, LegalZoom.com, Magnite, MARA Holdings, Marqeta, Marriott Vacations, MYR Group, National Storage Affiliates, New Mountain Finance, Nutanix, Ormat Technologies, Ovintiv, Paramount Global, Pebblebrook Hotel Trust, Pure Storage, Root, Rush Street Interactive, Sarepta Therapeutics, Schrodinger, Seadrill, Sinclair Broadcast, Sitio Royalties, Snowflake, Stoneridge, Sun Communities, Sweetgreen, Synopsys, Talos Energy, Tandem Diabetes Care, Teladoc, TKO Group Holdings, Universal Health, Urban Outfitters, Vir Biotechnology, VSE Corp & Western Midstream who are all due to report after the closing bell.
Initial Jobless Claims, Durable-Goods Orders, Durable-Goods minus Transportation & GDP (second revision) are all due out Thursday morning at 8:30 am, followed by Pending Home Sales data at 10 am & Fed President Hammack speaking at 1:15 pm.
Thursday morning kicks off with earnings from Acushnet, ADT, American Woodmark, Ardagh Metal Packaging, Bath & Body Works, Beacon Roofing Supply, California Water, Cars.com, CIBC, Cogent Communications, Dentsply Sirona, Donaldson, Ducommun, Ecovyst, Endeavor Group, Evergy, Frontdoor, GoodRx, Gray Media, Hayward Holdings, Hilton Grand Vacations, Hormel Foods, Installed Building Products, International Seaways, J.M. Smucker, Kimbell Royalty Partners, Koppers Holdings, Life Time, LifeStance Health Group, Ligand Pharmaceuticals, Macerich, Millicom International Cellular, NCR Voyix, Nexstar, Norwegian Cruise Line, NovoCure, Papa John’s, Payoneer, PENN Entertainment, Playtika, Privia Health, Royal Bank of Canada, Scholar Rock, SITE Centers, Sotera Health, Stagwell, Starwood Property Trust, Strategic Education, TechnipFMC, Tecnoglass, TEGNA, Teleflex, Thryv, Toronto-Dominion Bank, Trimas, Vericel, Vertex, Vital Farms, Warby Parker & Warner Bros. Discovery, with Acadia Healthcare, Alignment Healthcare, Alkami Technology, Ameresco, American Healthcare REIT, Arcadium Lithium, Arcosa, Arlo Technologies, Array Technologies, Assured Guaranty, Astrana Health, Autodesk, AvePoint, Bloom Energy, Bloom Energy, Collegium Pharmaceutical, Compass Diversified, Crinetics Pharmaceuticals, CubeSmart, Cytokinetics, Definitive Healthcare, Dell Technologies, Diamondrock Hospitality, dLocal, DoubleVerify, Duolingo, Edison International, Elastic, FIGS, Inc., Fox Factory Holding, Green Dot, HP Inc., ICF International, ICU Medical, Iovance Biotherapeutics, Jamf Holding, MasTec, Metallus, Mosaic, Natera, NetApp, nLIGHT, Opendoor Technologies, Opko Health, Paramount Group, Pembina Pipeline, Perrigo, Progyny, PubMatic, Redfin, Rocket Companies, Rocket Lab USA, Solventum, SoundHound AI, Sunrun, Talen Energy, TransMedics Group, Treace Medical Concepts, Tutor Perini & Verra Mobility all scheduled to report after the closing bell.
Friday the week winds down with Personal Income, Personal Spending, PCE Index, PCE Index (Year-over-Year), Core PCE Index, Core PCE (Year-over-Year), Advanced U.S. Trade Balance in Goods, Advanced Retail Inventories & Advanced Wholesale Inventories data at 8:30 am, followed by Chicago Business Barometer (PMI) at 9:45 am, Existing Home Sales & Consumer Sentiment (final) at 10 am & Fed President Goolsbee speaking at 10:15 am.
Alpha Metallurgical Resources, ANI Pharmaceuticals, Apellis Pharmaceuticals, Chart Industries, Chart Industries, Fulgent Genetics, Integral Ad Science, Northwest Natural, Owens & Minor & PAR Technology are all due to report earnings before Friday’s opening bell.
See you back here next week!
*** I DO NOT OWN SHARES OR OPTIONS CONTRACT POSITIONS IN SPY, QQQ, IWM OR DIA AT THE TIME OF PUBLISHING THIS ARTICLE ***
The VIX closed at 15.66, indicating an implied one day move of +/-0.99% & an implied one month move of +/4.53-% for the S&P 500.
Highest Technical Rated S&P 500 Components Per 2/20/2025’s Close:
1 – PLTR
2 – TPR
3 – SMCI
4 – FTNT
5 – RL
6 – TPL
7 – HWM
8 – FOXA
9 – GILD
10 – UAL
Lowest Technical Rated S&P 500 Components Per 2/20/2025’s Close:
1 – CE
2 – WST
3 – MRNA
4 – FMC
5 – EIX
6 – SWKS
7 – AES
8 – STZ
9 – BIIB
10 – ENPH
Highest Volume Rated S&P 500 Components Per 2/20/2025’s Close:
1 – RCL
2 – EPAM
3 – HAS
4 – WMT
5 – AXON
6 – DLTR
7 – PWR
8 – PLTR
9 – POOL
10 – DVA
Lowest Volume Rated S&P 500 Components Per 2/20/2025’s Close:
1 – JNPR
2 – FDX
3 – STE
4 – TSCO
5 – EMR
6 – A
7 – UBER
8 – CTVA
9 – STX
10 – AJG
Highest Technical Rated ETFs Per 2/20/2025’s Close:
1 – BABX
2 – SMCX
3 – BOIL
4 – YINN
5 – XPP
6 – UNG
7 – CWEB
8 – FBL
9 – TARK
10 – KTEC
Lowest Technical Rated ETFs Per 2/20/2025’s Close:
1 – KOLD
2 – MSOX
3 – YANG
4 – BCHG
5 – MRNY
6 – TSLZ
7 – CNBS
8 – SBIT
9 – NVD
10 – TSDD
Highest Volume Rated ETFs Per 2/20/2025’s Close:
1 – HYDW
2 – BDEC
3 – FCFY
4 – WABF
5 – OOSP
6 – FAB
7 – USSH
8 – KURE
9 – BLLD
10 – QSML
Lowest Volume Rated ETFs Per 2/20/2025’s Close:
1 – CCNR
2 – TBFC
3 – SPC
4 – KCSH
5 – MDCP
6 – NPFI
7 – TBFG
8 – ZSEP
9 – XTWY
10 – XFEB
Highest Technical Rated General Stocks Per 2/20/2025’s Close:
1 – ATGL
2 – DOMH
3 – VNET
4 – GRRR
5 – RPID
6 – KC
7 – CPIX
8 – REBN
9 – PWRNF
10 – CMRX
Lowest Technical Rated General Stocks Per 2/20/2025’s Close:
1 – CYN
2 – MULN
3 – LGMK
4 – GCTK
5 – BIGGQ
6 – CDT
7 – DGLY
8 – CHSN
9 – ZCAR
10 – RTC
Highest Volume Rated General Stocks Per 2/20/2025’s Close:
1 – XOS
2 – WOK
3 – TWO
4 – MNDR
5 – RETO
6 – BRTX
7 – ARBV
8 – FGEN
9 – GB
10 – STSS
Lowest Volume Rated General Stocks Per 2/20/2025’s Close:
1 – BETRF
2 – LTRPA
3 – YERBF
4 – TSKFF
5 – OMQS
6 – PSHIF
7 – GECSF
8 – GAMI
9 – PYFRF
10 – LIMX
*** THE LIST ABOVE IS STRICTLY FOR INFORMATIONAL PURPOSES – I MAY OR MAY NOT HAVE OR INITIATE A LONG, SHORT, OR LONG/SHORT POSITION IN ANY NAME ABOVE AT ANY TIME ***
The VIX closed at 15.27, indicating an implied one day move of +/-0.96% & an implied one month move of +/-4.41% for the S&P 500.
Highest Technical Rated S&P 500 Components Per 2/19/2025’s Close:
1 – PLTR
2 – TPR
3 – SMCI
4 – FTNT
5 – UAL
6 – RL
7 – HWM
8 – FFIV
9 – CRWD
10 – GEV
Lowest Technical Rated S&P 500 Components Per 2/19/2025’s Close:
1 – CE
2 – WST
3 – MRNA
4 – FMC
5 – EIX
6 – AES
7 – SWKS
8 – STZ
9 – BIIB
10 – BG
Highest Volume Rated S&P 500 Components Per 2/19/2025’s Close:
1 – CE
2 – SMCI
3 – CDNS
4 – COO
5 – GRMN
6 – WST
7 – AXON
8 – ADI
9 – CSGP
10 – ANET
Lowest Volume Rated S&P 500 Components Per 2/19/2025’s Close:
1 – AJG
2 – JCI
3 – FDX
4 – STE
5 – AVB
6 – UBER
7 – APTV
8 – BDX
9 – GEV
10 – GE
Highest Technical Rated ETFs Per 2/19/2025’s Close:
1 – BABX
2 – SMCX
3 – BOIL
4 – UNG
5 – YINN
6 – TARK
7 – FBL
8 – WEBL
9 – XPP
10 – CWEB
Lowest Technical Rated ETFs Per 2/19/2025’s Close:
1 – KOLD
2 – MSOX
3 – YANG
4 – BCHG
5 – SARK
6 – TSLZ
7 – CNBS
8 – MRNY
9 – TSDD
10 – TSLQ
Highest Volume Rated ETFs Per 2/19/2025’s Close:
1 – TBFC
2 – USFI
3 – SNPD
4 – GLOF
5 – TBFG
6 – EVNT
7 – HFGO
8 – BDIV
9 – JHEM
10 – DBEZ
Lowest Volume Rated ETFs Per 2/19/2025’s Close:
1 – ADME
2 – MDCP
3 – EVIM
4 – UPAR
5 – KAUG
6 – DYNI
7 – BBEM
8 – SBND
9 – FDTB
10 – SECR
Highest Technical Rated General Stocks Per 2/19/2025’s Close:
1 – DOMH
2 – ATGL
3 – GRRR
4 – RPID
5 – CPIX
6 – VNET
7 – KC
8 – BBAI
9 – HIMS
10 – BSXGF
Lowest Technical Rated General Stocks Per 2/19/2025’s Close:
1 – FTEL
2 – LGMK
3 – GCTK
4 – CDT
5 – RGFC
6 – UPC
7 – CRKN
8 – VLCN
9 – ACON
10 – TCBP
Highest Volume Rated General Stocks Per 2/19/2025’s Close:
1 – SINT
2 – SLG
3 – OUT
4 – AUDD
5 – TRNR
6 – RSLS
7 – LYT
8 – CMMB
9 – GB
10 – ALZN
Lowest Volume Rated General Stocks Per 2/19/2025’s Close:
1 – ALPIB
2 – NROM
3 – OILSF
4 – PBSV
5 – GECSF
6 – DTEGF
7 – NSFDF
8 – SGBX
9 – AZREF
10 – LIQT
*** THE LIST ABOVE IS STRICTLY FOR INFORMATIONAL PURPOSES – I MAY OR MAY NOT HAVE OR INITIATE A LONG, SHORT, OR LONG/SHORT POSITION IN ANY NAME ABOVE AT ANY TIME ***
Stocks have had an interesting & full past month & a half since our last Volume Sentiment Analysis on 1/2/25, featuring declines, advances & a bit of consolidation as well.
SPY & QQQ are still near all-time highs, DIA’s ~1% below their ATH & IWM has been in a relatively range-bound oscillation phase.
Meanwhile, last night the VIX closed at 15.35, indicating an implied one day move of +/-0.97% & an implied one month move of +/-4.44% for the S&P 500.
There are a lot of mixed signals out there, but one thing is certain, market participants have lost steam & are beginning to get a bit nervous.
As noted in this week’s note, when comparing the previous year’s average volume vs. that same metric from 2/18/2024 SPY’s average volume is down -34.7% Y-o-Y, QQQ’s average volume is down -31.44% Y-o-Y, IWM’s is -15.93% lower Y-o-Y & DIA’s is -6% lower Y-o-Y.
This will need to change if there is going to be any meaningful breakouts above the recent all-time highs that are sustainable runs.
January’s FOMC minutes are due to be released this afternoon, NVDA reports earnings one week from today & there are still many other earnings reports due out this & next week, which are all things that traders & investors are waiting on before deciding their next moves.
With this in mind, it is important to understand how each index ETF has performed in recent history, as it lends clues into the strength/weakness of each index’s support/resistance levels.
This can be valuable when assessing risk in the event of retests of any of these levels.
Each section below contains a view of each index ETF’s chart (for a technical breakdown of each ETF’s chart please see this past weekend’s market review note), as well as a list of their current one year support & resistance levels with the volume sentiment noted beneath it on the table.
There is an additional table beneath this table with each price level’s sentiment, as well as a typed text version below that is able to be copied & pasted.
Note that “NULL, 0:0*” values denote areas that each name has traded at but with limited volume data to work with from a comparison standpoint in terms of creating a ratio of buyers:sellers (or vice versa) or is the outlier above the highest/lowest level with price data.
Also, prices that do have a ratio of Buyers:Sellers (Sellers:Buyers) where the denominator is 0 are denoted with an asterisk “*” as well.
In the written lists of the price levels & volume sentiments the price levels that contain support & resistance levels are marked in BOLD.
Recall that at price extremes such as the highs that we have recently hit there will tend to be skewed data due to the small sample size & factor that into how you interpret each price level’s reported sentiment.
This is intended to serve as an additional tool, similar to a barometer to use during your due diligence process & is not meant to replace doing your own research & is not financial advice.
Price Level:Volume Sentiment Analysis For SPY, The SPDR S&P 500 ETF
SPY ETF – SPDR S&P 500 ETF’s Technical Performance Over The Past Year
SPY, the SPDR S&P 500 ETF‘s volume above is concerning, given that their resistance level is their all-time high but volumes have been visibly declining throughout 2025.
In the event that there is no catalyst higher the data below will be helpful to assess the risks associated with each support level’s retest in the near-term.
The flattening of SPY’s moving averages is also an area of concern, making it even more important to review the data in the tables below, which outlines the volume sentiments of each price level SPY has traded at over the past ~3 years.
SPY ETF’s Price Level:Volume Sentiment Over The Past ~3 Years At One Year Support/Resistance Levels
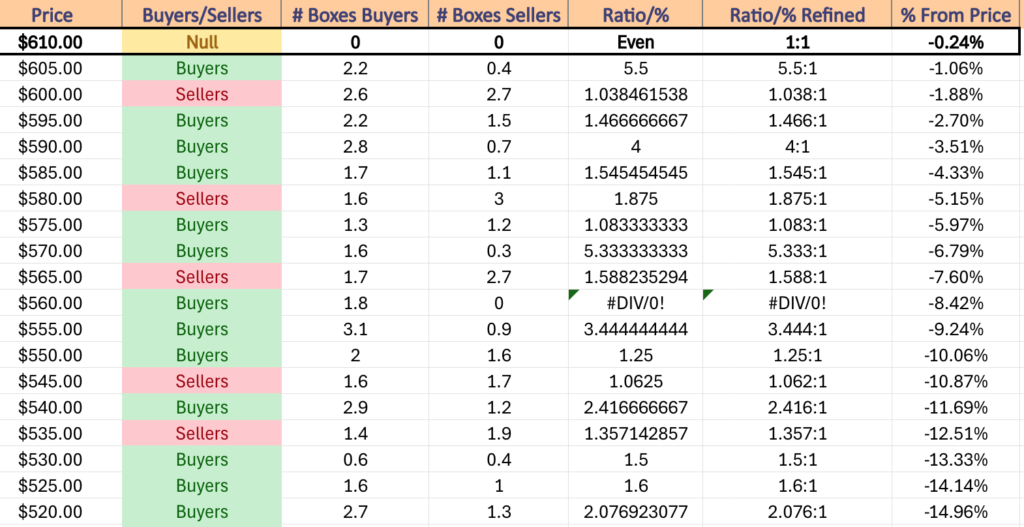
SPY ETF’s Price Level:Volume Sentiment Over The Past ~3 Years
Price Level:Volume Sentiment For SPY ETF Over The Past ~3 Years
Price Level:Volume Sentiment For SPY ETF Over The Past ~3 Years
SPY ETF’s Price Level:Volume Sentiment Over The Past ~3 Years
$610 – NULL – 0:0*, -0.24% From Current Price Level – Current Price Level & All-Time High**
$605 – Buyers – 5.5:1, -1.06% From Current Price Level – 10 Day Moving Average*
$600 – Sellers – 1.04:1, -1.88% From Current Price Level
$595 – Buyers – 1.47:1, -2.7% From Current Price Level – 50 Day Moving Average*
$590 – Buyers – 4:1, -3.51% From Current Price Level
$585 – Buyers – 1.55:1, -4.33% From Current Price Level
$580 – Sellers – 1.88:1, -5.15% From Current Price Level
$575 – Buyers – 1.08:1, -5.97% From Current Price Level
$570 – Buyers – 5.33:1, -6.79% From Current Price Level
$565 – Sellers -1.59:1, -7.6% From Current Price Level
$560 – Buyers – 1.8:0*, -8.42% From Current Price Level – 200 Day Moving Average*
$555 – Buyers – 3.44:1, -9.24% From Current Price Level
$550 – Buyers – 1.25:1, -10.06% From Current Price Level
$545 – Sellers – 1.06:1, -10.87% From Current Price Level
$540 – Buyers – 2.42:1, -11.69% From Current Price Level
$535 – Sellers – 1.36:1, -12.51% From Current Price Level
$530 – Buyers – 1.5:1, -13.33% From Current Price Level
$525 – Buyers – 1.6:1, -14.14% From Current Price Level
$520 – Buyers -2.08:1, -14.96% From Current Price Level
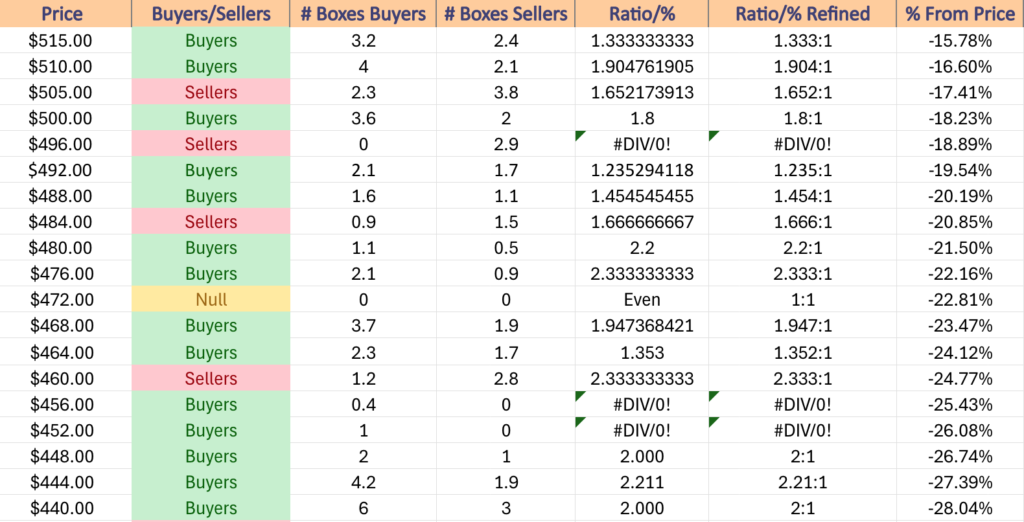
$515 – Buyers – 1.33:1, -15.78% From Current Price Level
$510 – Buyers – 1.9:1, -16.6% From Current Price Level
$505 – Sellers – 1.65:1, -17.14% From Current Price Level
$500 -Buyers – 1.8:1, -18.23% From Current Price Level
$496 – Sellers – 2.9:0*, -18.89% From Current Price Level
$492 – Buyers – 1.24:1, -19.54% From Current Price Level
$488 – Buyers – 1.45:1, -20.19% From Current Price Level
$484 – Sellers – 1.67:1, -20.85% From Current Price Level
$480 – Buyers – 2.2:1, -21.5% From Current Price Level
$476 – Buyers – 2.33:1, -22.16% From Current Price Level
$472 – NULL – 0:0*, – 22.81% From Current Price Level
$468 – Buyers – 1.95:1, -23.47% From Current Price Level
$464 – Buyers – 1.35:1, -24.12% From Current Price Level
$460 – Sellers – 2.33:1, -24.77% From Current Price Level
$456 – Buyers – 0.4:0*, -25.43% From Current Price Level
$452 – Buyers – 1:0*, -26.08% From Current Price Level
$448 – Buyers- 2:1, -26.74% From Current Price Level
$444 – Buyers – 2.21:1, -27.39% From Current Price Level
$440 – Buyers – 2:1, -28.04% From Current Price Level
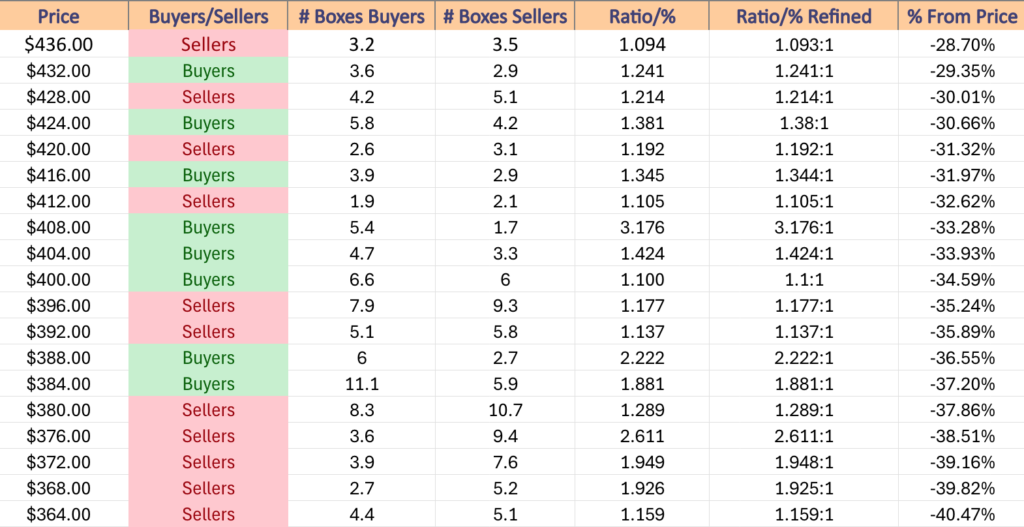
$436 – Sellers – 1.09:1, -28.7% From Current Price Level
$432 – Buyers – 1.24:1, -29.35% From Current Price Level
$428 – Sellers – 1.21:1, -30.01% From Current Price Level
$424 – Buyers – 1.38:1, -30.66% From Current Price Level
$420 – Sellers – 1.19:1, -31.32% From Current Price Level
$416 – Buyers – 1.34:1, -31.97% From Current Price Level
$412 – Sellers – 1.11:1, -32.62% From Current Price Level
$408 – Buyers – 3.18:1, -33.28% From Current Price Level
$404 – Buyers – 1.42:1, -33.93% From Current Price Level
$400 – Buyers – 1.1:1, -34.59% From Current Price Level
$396 – Sellers – 1.18:1, -35.24% From Current Price Level
$392 – Sellers – 1.14:1, -35.89% From Current Price Level
$388 – Buyers – 2.22:1, -36.55% From Current Price Level
$384 – Buyers – 1.88:1, -37.2% From Current Price Level
$380 – Sellers – 1.29:1, -37.86% From Current Price Level
$376 – Sellers – 2.61:1, -38.5% From Current Price Level
$372 – Sellers – 1.95:1, -39.16% From Current Price Level
$368 – Sellers – 1.93:1, -39.82% From Current Price Level
$364 – Sellers – 1.16:1, -40.47% From Current Price Level
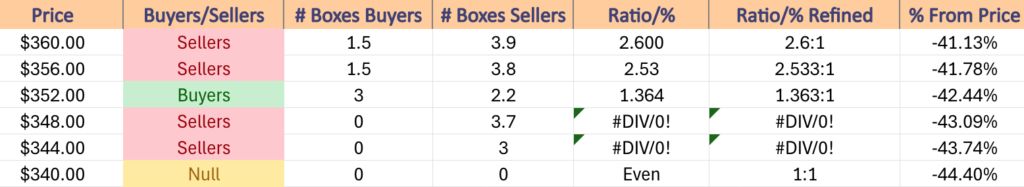
$360 – Sellers – 2.6:1, -41.13% From Current Price Level
$356 – Sellers – 2.53:1, -42.78% From Current Price Level
$352 – Buyers – 1.36:1. -42.44% From Current Price Level
$348 – Sellers – 3.7:0*, -43.09% From Current Price Level
$344 – Sellers – 3:0*, -43.74% From Current Price Level
$340 – NULL – 0:0*, -44.4% From Current Price Level
Price Level:Volume Sentiment Analysis For QQQ, The Invesco QQQ Trust ETF
QQQ ETF – Invesco QQQ Trust ETF’s Technical Performance Over The Past Year
QQQ, the Invesco QQQ Trust ETF that tracks the NASDAQ 100 has also witnessed a similar reduction in volume while sitting near all-time highs.
Without a meaningful increase in volume it seems unlikely that there’s much of a chance of a sustainable climb higher beyond the current ATH’s from here & that there will be retests of their more recent support levels.
Given that these support levels are relatively sparse as noted in this week’s note (link in into section), it is beneficial to understand how market participants have behaved at each price level QQQ’s traded at over the past ~2-3 years, shown below.
Price Level:Volume Sentiment For QQQ ETF Over The Past ~2-3 Years At Their One Year Support/Resistance Levels
Price Level:Volume Sentiment For QQQ ETF Over The Past ~2-3 Years
QQQ ETF’s Price Level:Volume Sentiment Over The Past ~2-3 Years
QQQ ETF’s Price Level:Volume Sentiment Over The Past ~2-3 Years
Price Level:Volume Sentiment For QQQ ETF Over The Past ~2-3 Years
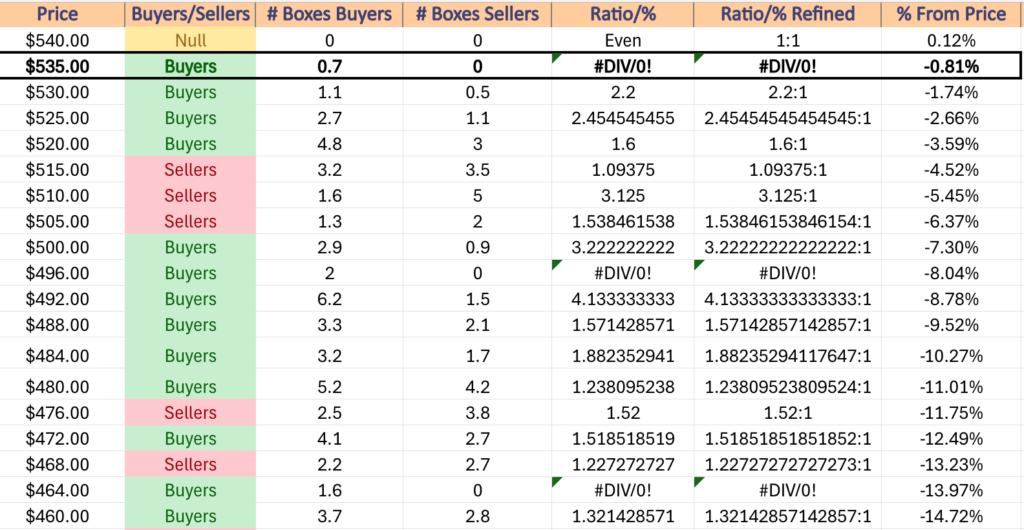
$540 – NULL – 0:0*, +0.12% From Current Price Level – All-Time High*
$535 – Buyers – 0.7:0*, -0.81% From Current Price Level – Current Price Level*
$530 – Buyers – 2.2:1, -1.74% From Current Price Level – 10 Day Moving Average*
$525 – Buyers – 2.46:1, -2.66% From Current Price Level
$520 – Buyers – 1.6:1, -3.59% From Current Price Level – 50 Day Moving Average*
$515 – Sellers – 1.09:1, -4.52% From Current Price Level
$510 – Sellers – 3.13:1, -5.45% From Current Price Level
$505 – Sellers – 1.54:1, -6.37% From Current Price Level
$500 – Buyers – 3.22:1, -7.3% From Current Price Level
$496 – Buyers – 2:0*, -8.04% From Current Price Level
$492 – Buyers – 4.13:1, -8.78% From Current Price Level
$488 – Buyers – 1.57:1, -9.52% From Current Price Level
$484 – Buyers – 1.88:1, -10.27% From Current Price Level – 200 Day Moving Average*
$480 – Buyers – 1.24:1, -11.01% From Current Price Level
$476 – Sellers – 1.52:1, -11.75% From Current Price Level
$472 – Buyers – 1.52:1, -12.49% From Current Price Level
$468 – Sellers – 1.23:1, -13.23% From Current Price Level
$464 – Buyers – 1.6:0*, -13.97% From Current Price Level
$460 – Buyers – 1.32:1, -14.72% From Current Price Level
$456 – Sellers – 1.89:1, -15.46% From Current Price Level
$452 – Buyers – 2.5:1, -16.2% From Current Price Level
$448 – Sellers – 1.39:1, -16.94% From Current Price Level
$444 – Sellers – 1.4:1, -17.68% From Current Price Level
$440 – Buyers – 4.22:1, -18.42% From Current Price Level
$436 – Buyers – 1.05:1, -19.16% From Current Price Level
$432 – Sellers – 2:1, -19.91% From Current Price Level
$428 – Buyers – 1.42:1, -20.65% From Current Price Level
$424 – Sellers – 1.06:1, -21.39% From Current Price Level
$420 – Sellers – 2:1, -22.13% From Current Price Level
$416 – Buyers – 4:1, -22.87% From Current Price Level
$412 – Sellers – 2.6:0*, -23.61% From Current Price Level
$408 – Buyers – 4.2:1, -24.36% From Current Price Level
$404 – Buyers – 2.2:1, -25.1% From Current Price Level
$400 – Buyers – 1.81:1, -25.84% From Current Price Level
$396 – Sellers – 1.1:0*, -26.58% From Current Price Level
$392 – Buyers – 1.5:1, -27.32% From Current Price Level
$388 – Buyers – 1:0*, -28.06% From Current Price Level
$384 – Buyers – 1.49:1, -28.81% From Current Price Level
$380 – Buyers – 1.89:1, -29.55% From Current Price Level
$376 – Buyers – 3.86:1. -30.29% From Current Price Level
$372 – Buyers – 1.2:1, -31.03% From Current Price Level
$368 – Sellers – 1.15:1, -31.77% From Current Price Level
$364 – Buyers – 1.66:1, -32.51% From Current Price Level
$360 – Buyers – 1.17:1, -33.26% From Current Price Level
$356 – Sellers – 1.13:1, -34% From Current Price Level
$352 – Buyers – 1.22:1, -34.74% From Current Price Level
$348 – Buyers – 1.14:1, -35.48% From Current Price Level
$344 – Buyers – 1.24:1, -36.22% From Current Price Level
$340 – Sellers – 1.17:1, -36.96% From Current Price Level
$336 – NULL – 0:0*, -37.71% From Current Price Level
$332 – Buyers – 3:1, -38.45% From Current Price Level
$328 – Sellers – 1:0*, -39.19% From Current Price Level
$324 – Even – 1:1, -39.93% From Current Price Level
$320 -Buyers – 4:1, -40.67% From Current Price Level
$316 – Buyers- 2.09:1, -41.41% From Current Price Level
$312 – Sellers – 1.76:1, -42.15% From Current Price Level
$308 – Buyers – 1.82:1, -42.9% From Current Price Level
$304 – Buyers – 7.1:1, -43.64% From Current Price Level
$300 – Sellers – 1.28:1, -44.38% From Current Price Level
$296 – Sellers – 1.63:1, -45.12% From Current Price Level
$292 – Buyers – 3.36:1, -45.86% From Current Price Level
$288 – Buyers – 1.11:1, -46.6% From Current Price Level
$284 – Sellers – 1.33:1, -47.35% From Current Price Level
$280 – Sellers – 1.5:1, -48.09% From Current Price Level
$276 – Buyers – 2.06:1, -48.83% From Current Price Level
$272 – Even – 1:1, -49.57% From Current Price Level
$268 – Sellers – 1.25:1, -50.31% From Current Price Level
$264 – Buyers – 1.18:1, -51.05% From Current Price Level
$260 – Sellers – 2:1, -51.8% From Current Price Level
$256 – NULL – 0:0*, -52.54% From Current Price Level
Price Level:Volume Sentiment Analysis For IWM, The iShares Russell 2000 ETF
IWM ETF – iShares Russell 2000 ETF’s Technical Performance Over The Past Year
IWM, the iShares Russell 2000 ETF‘s recent volume declines are similar to SPY & QQQ’s, but not quite as drastic when compared to the year prior.
Still, given that they have been oscillating between support & resistance zones for much of 2025 to date it is worth having an understanding of how each support/resistance level/zone has held up in terms of strength/weakness in order to assess risk moving forward.
The tables below outline IWM’s volume sentiment at each price level that they’ve traded at over the past ~3 years, which will also prove beneficial when they ultimately break out, be it to the upside or downside.
IWM ETF’s Price Level:Volume Sentiment Over The Past ~3 Years At Their One Year Support/Resistance Levels
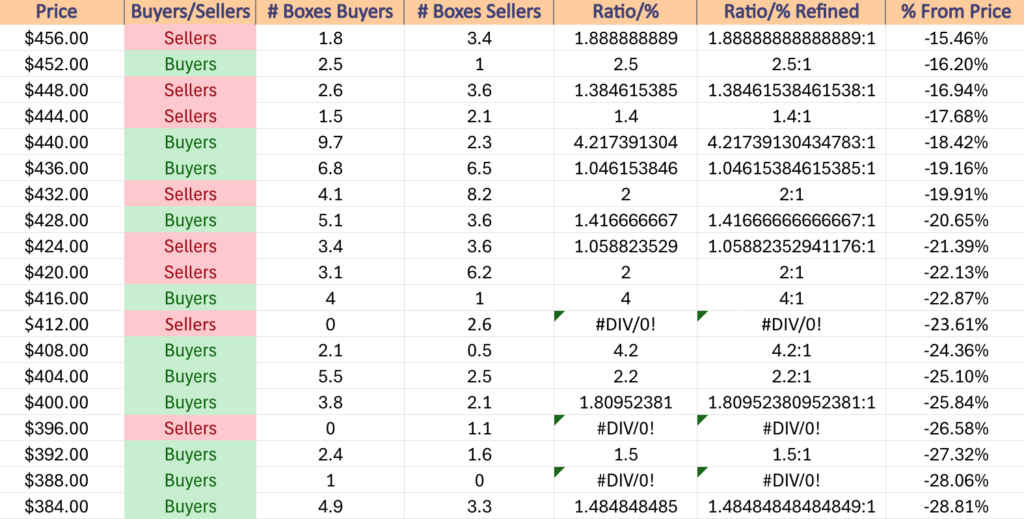
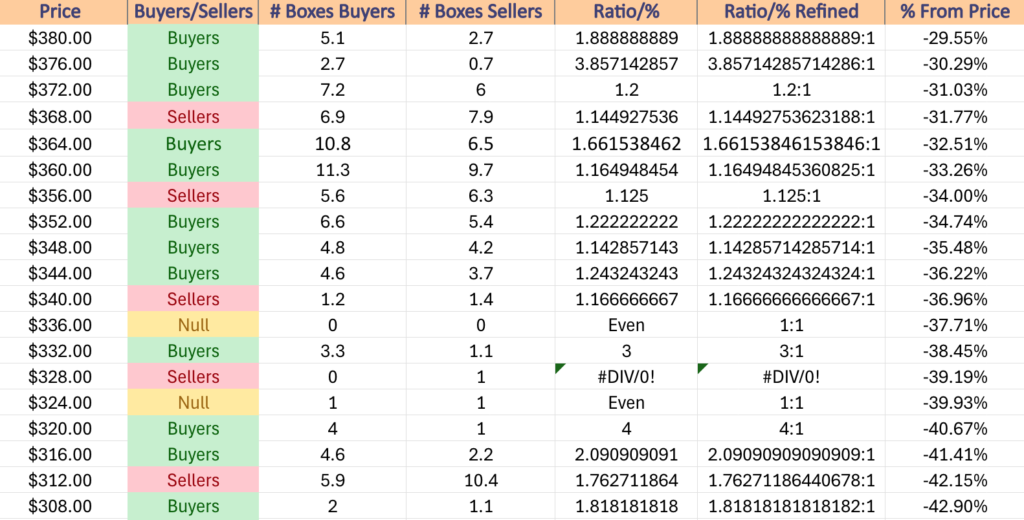
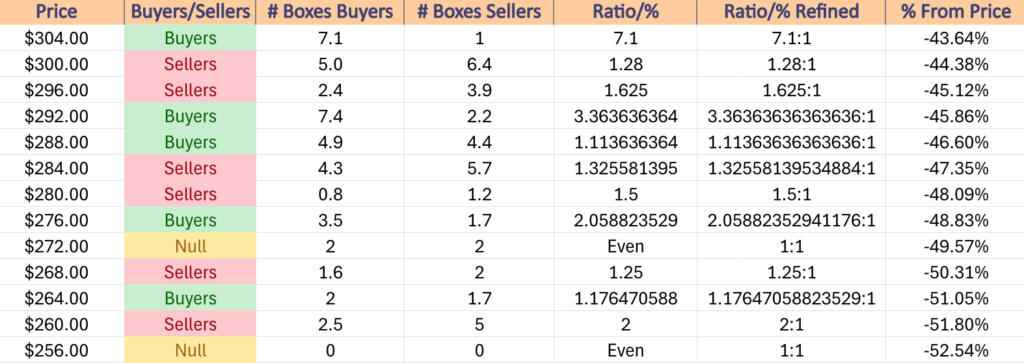
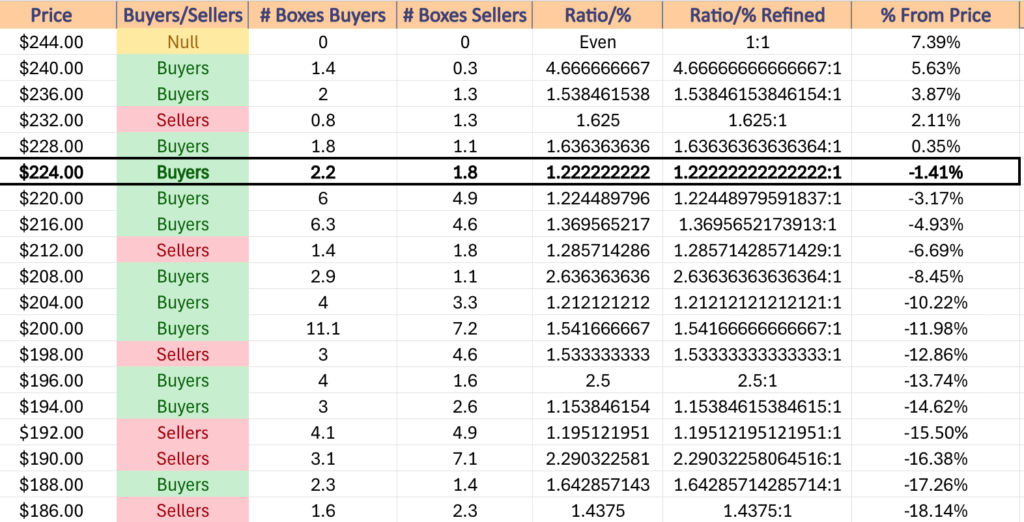
IWM ETF’s Price Level:Volume Sentiment Over The Past ~3 Years
Price Level:Volume Sentiment Over The Past ~3 Years For IWM ETF
$244 – NULL – 0:0*, +7.39% From Current Price Level – All Time High*
$240 – Buyers – 4.67:1, +5.63% From Current Price Level
$236 – Buyers – 1.54:1, +3.87% From Current Price Level
$232 – Sellers – 1.63:1, +2.11% From Current Price Level
$228 – Buyers – 1.64:1, +0.35% From Current Price Level
$224 – Buyers – 1.22:1, -1.41% From Current Price Level – Current Price Level, 10 & 50 Day Moving Averages***
$220 – Buyers – 1.23:1, -3.17% From Current Price Level
$216 – Buyers – 1.37:1, -4.93% From Current Price Level – 200 Day Moving Average*
$212 – Sellers – 1.29:1, -6.69% From Current Price Level
$208 – Buyers – 2.64:1, -8.45% From Current Price Level
$204 – Buyers – 1.21:1, -10.22% From Current Price Level
$200 – Buyers – 1.54:1, -11.98% From Current Price Level
$198 – Sellers – 1.53:1, -12.86% From Current Price Level
$196 – Buyers – 2.5:1, -13.74% From Current Price Level
$194 – Buyers – 1.15:1, -14.62% From Current Price Level
$192 – Sellers – 1.2:1, -15.5% From Current Price Level
$190 – Sellers – 2.29:1, -16.38% From Current Price Level
$188 – Buyers – 1.64:1, -17.26% From Current Price Level
$186 – Sellers – 1.44:1, -18.14% From Current Price Level
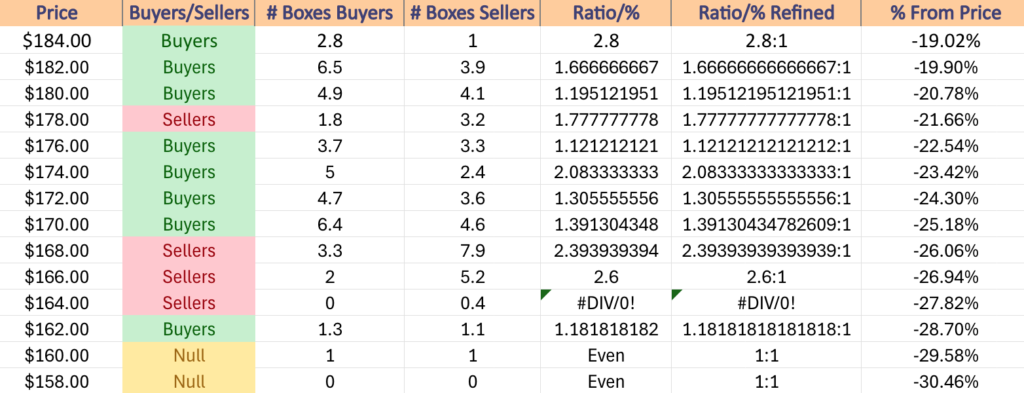
$184 – Buyers – 2.8:1, -19.02% From Current Price Level
$182 – Buyers – 1.67:1, -19.9% From Current Price Level
$180 – Buyers – 1.2:1, -20.78% From Current Price Level
$178 – Sellers – 1.78:1, -21.66% From Current Price Level
$176 – Buyers – 1.12:1, -22.54% From Current Price Level
$174 – Buyers – 2.08:1, -23.42% From Current Price Level
$172 – Buyers – 1.31:1, -24.3% From Current Price Level
$170 – Buyers – 1.39:1, -25.18% From Current Price Level
$168 – Sellers – 2.39:1, 26.06% From Current Price Level
$166 – Sellers – 2.6:1, -26.94% From Current Price Level
$164 – Sellers – 0.4:0*, -27.82% From Current Price Level
$162 – Buyers – 1.18:1, -28.7% From Current Price Level
$160 – Even – 1:1, -29.58% From Current Price Level
$158 – NULL – 0:0*, -30.46% From Current Price Level
Price Level:Volume Sentiment Analysis For DIA, The SPDR Dow Jones Industrial Average ETF
DIA ETF – SPDR Dow Jones Industrial Average ETF’s Technical Performance Over The Past Year
With a flat 10 Day Moving Average just below its price & a flat 50 DMA just -5.28% below it & limited other support levels it’s a good time to check in on the volume sentiment around the prices that it has traded at in recent history.
The tables below outline DIA’s volume sentiment at the price levels it has traded at over the past ~4-5 years.
DIA ETF’s Price Level:Volume Sentiment Over The Past ~4-5 Years At Their One Year Support/Resistance Levels
DIA ETF’s Price Level:Volume Sentiment Over The Past ~4-5 Years
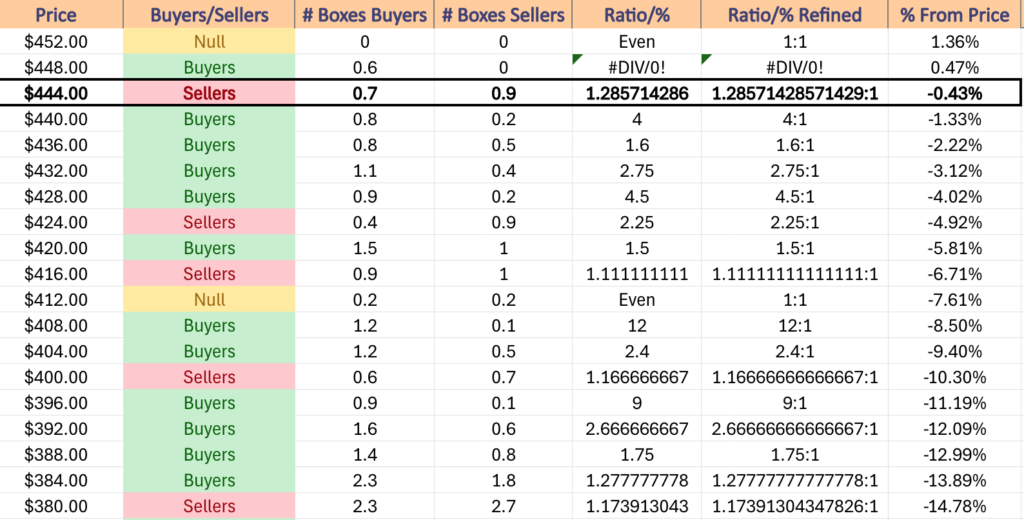
Price Level:Volume Sentiment Over The Past ~4-5 Years For DIA ETF
Price Level:Volume Sentiment Over The Past ~4-5 Years For DIA ETF
$452 – NULL – 0:0*, +1.36% From Current Price Level
$448 – Buyers – 0.6:0*, +0.47% From Current Price Level – All-Time High*
$444 – Sellers – 1.29:1, -0.43% From Current Price Level – Current Price Level & 10 Day Moving Average*
$440 – Buyers – 4:1, -1.33% From Current Price Level
$436 – Buyers – 1.6:1, -2.22% From Current Price Level – 50 Day Moving Average*
$432 – Buyers – 2.75:1, -3.12% From Current Price Level
$428 – Buyers – 4.5:1, -4.02% From Current Price Level
$424 – Sellers – 2.25:1, -4.92% From Current Price Level
$420 – Buyers – 1.5:1, -5.81% From Current Price Level
$416 – Sellers – 1.11:1, -6.71% From Current Price Level
$412 – Even – 1:1, -7.61% From Current Price Level – 200 Day Moving Average*
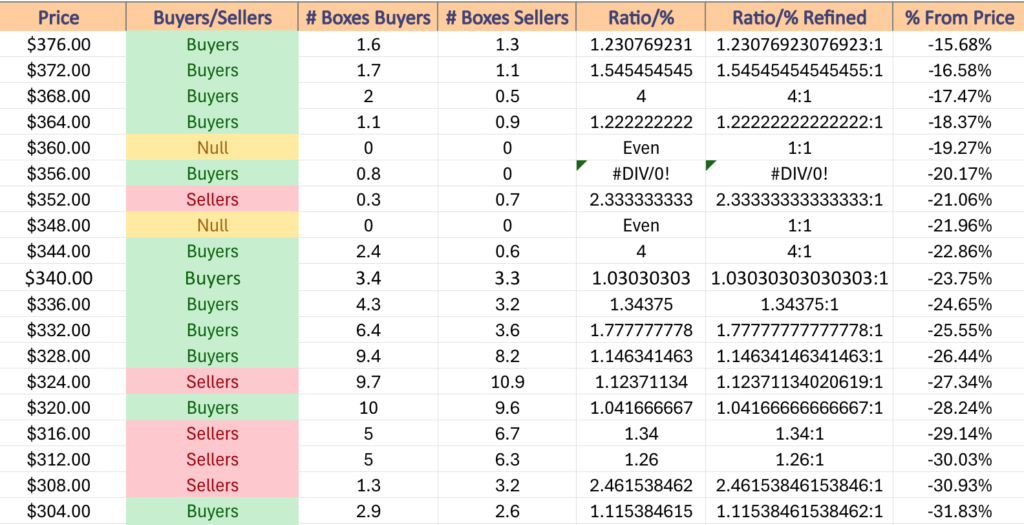
$408 – Buyers – 12:1, -8.5% From Current Price Level
$404 – Buyers – 2.4:1, -9.4% From Current Price Level
$400 – Sellers – 1.17:1, -10.3% From Current Price Level
$396 – Buyers – 9:1, -11.19% From Current Price Level
$392 – Buyers – 2.67:1, -12.09% From Current Price Level
$388 – Buyers – 1.75:1, -12.99% From Current Price Level
$384 – Buyers – 1.28:1, -13.89% From Current Price Level
$380 – Sellers – 1.17:1, -14.78% From Current Price Level
$376 – Buyers – 1.23:1, -15.68% From Current Price Level
$372 – Buyers – 1.55:1, -16.58% From Current Price Level
$368 – Buyers – 4:1, -17.47% From Current Price Level
$364 – Buyers – 1.22:1, -18.37% From Current Price Level
$360 – NULL – 0:0*, -19.27% From Current Price Level
$356 – Buyers – 0.8:0*, -20.17% From Current Price Level
$352 – Sellers – 2.33:1, -21.06% From Current Price Level
$348 – NULL – 0:0*, -21.96% From Current Price Level
$344 – Buyers – 4:1, -22.86% From Current Price Level
$340 – Buyers – 1.03:1, -23.75% From Current Price Level
$336 – Buyers – 1.34:1, -24.65% From Current Price Level
$332 – Buyers – 1.78:1, -25.55% From Current Price Level
$328 – Buyers – 1.15:1, -26.44% From Current Price Level
$324 – Sellers – 1.12:1, -27.34% From Current Price Level
$320 – Buyers – 1.04:1 – 28.24% From Current Price Level
$316 – Sellers – 1.34:1, -29.14% From Current Price Level
$312 – Sellers – 1.26:1, -30.03% From Current Price Level
$308 – Sellers – 2.46:1, -30.96% From Current Price Level
$304 – Buyers – 1.12:1, -31.83% From Current Price Level
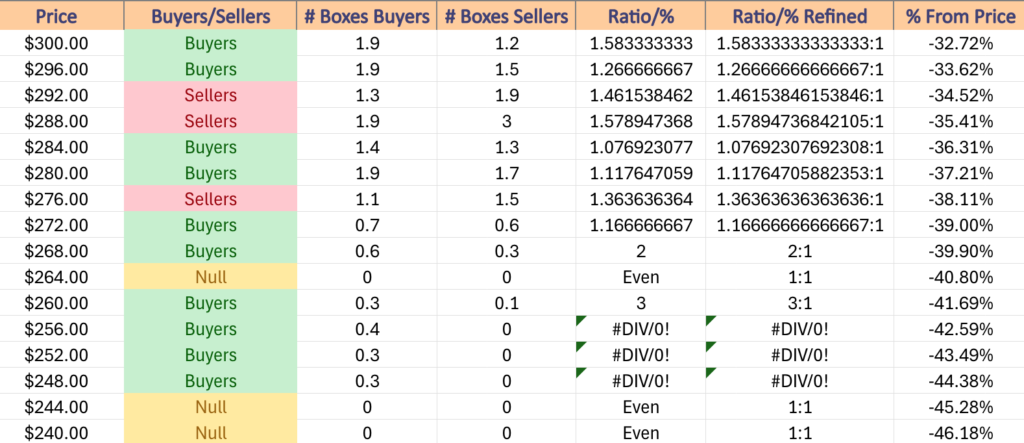
$300 – Buyers – 1.58:1, -32.72% From Current Price Level
$296 – Buyers – 1.27:1, -33.62% From Current Price Level
$292 – Sellers – 1.46:1, -34.52% From Current Price Level
$288 – Sellers – 1.58:1, -35.41% From Current Price Level
$284 – Buyers – 1.08:1, -36.31% From Current Price Level
$280 – Buyers – 1.12:1, -37.21% From Current Price Level
$276 – Sellers – 1.36:1, -38.11% From Current Price Level
$272 – Buyers – 1.17:1, -39% From Current Price Level
$268 – Buyers – 2:1, -39.9% From Current Price Level
$264 – NULL – 0:0*, -40.8% From Current Price Level
$260 – Buyers – 3:1, -41.69% From Current Price Level
$256 – Buyers – 0.4:0*, -42.59% From Current Price Level
$252 – Buyers – 0.3:0*, -43.49% From Current Price Level
$248 – Buyers – 0.3:0*, -44.38% From Current Price Level
$244 – NULL – 0:0*, -45.28% From Current Price Level
$240 – NULL – 0:0*, -46.18% From Current Price Level
*** I DO NOT OWN SHARES OR OPTIONS CONTRACT POSITIONS IN SPY, QQQ, IWM OR DIA AT THE TIME OF PUBLISHING THIS ARTICLE ***
The VIX closed at 15.35, indicating an implied one day move of +/-0.97% & an implied one month move of +/-4.44% for the S&P 500.
Highest Technical Rated S&P 500 Components Per 2/18/2025’s Close:
1 – PLTR
2 – TPR
3 – AXON
4 – SMCI
5 – FTNT
6 – RL
7 – CRWD
8 – CEG
9 – FFIV
10 – VST
Lowest Technical Rated S&P 500 Components Per 2/18/2025’s Close:
1 – WST
2 – MRNA
3 – FMC
4 – EIX
5 – SWKS
6 – AES
7 – STZ
8 – CE
9 – MRK
10 – HII
Highest Volume Rated S&P 500 Components Per 2/18/2025’s Close:
1 – INTC
2 – STZ
3 – WST
4 – CAG
5 – DFS
6 – SMCI
7 – ZTS
8 – ADI
9 – NKE
10 – ZBRA
Lowest Volume Rated S&P 500 Components Per 2/18/2025’s Close:
1 – SWK
2 – FDX
3 – ERIE
4 – CHTR
5 – PLD
6 – LH
7 – MS
8 – MHK
9 – FICO
10 – FAST
Highest Technical Rated ETFs Per 2/18/2025’s Close:
1 – BABX
2 – SMCX
3 – PTIR
4 – BOIL
5 – YINN
6 – TARK
7 – FBL
8 – WEBL
9 – CWEB
10 – XPP
Lowest Technical Rated ETFs Per 2/18/2025’s Close:
1 – MSOX
2 – KOLD
3 – YANG
4 – BCHG
5 – SARK
6 – MRNY
7 – CNBS
8 – NVD
9 – TSLZ
10 – NVDQ
Highest Volume Rated ETFs Per 2/18/2025’s Close:
1 – PY
2 – GBF
3 – TAXE
4 – SSFI
5 – ADIV
6 – FLGR
7 – AMPD
8 – GXUS
9 – NANR
10 – GENT
Lowest Volume Rated ETFs Per 2/18/2025’s Close:
1 – MDCP
2 – SIXP
3 – ZTWO
4 – SPC
5 – CCNR
6 – CPLB
7 – TAFL
8 – XOCT
9 – HELX
10 – BDGS
Highest Technical Rated General Stocks Per 2/18/2025’s Close:
1 – DOMH
2 – YOSH
3 – RPID
4 – ATGL
5 – GRRR
6 – BBAI
7 – VNET
8 – KC
9 – STIM
10 – BSXGF
Lowest Technical Rated General Stocks Per 2/18/2025’s Close:
1 – LGMK
2 – GCTK
3 – RIME
4 – CDT
5 – UPC
6 – BPTH
7 – CRKN
8 – RSLS
9 – VLCN
10 – ACON
Highest Volume Rated General Stocks Per 2/18/2025’s Close:
1 – EFOI
2 – SLG
3 – KWE
4 – IPHA
5 – PRFX
6 – ABVC
7 – SLDB
8 – RSLS
9 – UNIT
10 – HCTI
Lowest Volume Rated General Stocks Per 2/18/2025’s Close:
1 – PYFRF
2 – ALPIB
3 – NMREF
4 – BNPQF
5 – LTRPA
6 – GIKLY
7 – CYCN
8 – EMYB
9 – ZCMD
10 – FDVA
*** THE LIST ABOVE IS STRICTLY FOR INFORMATIONAL PURPOSES – I MAY OR MAY NOT HAVE OR INITIATE A LONG, SHORT, OR LONG/SHORT POSITION IN ANY NAME ABOVE AT ANY TIME ***
SPY, the SPDR S&P 500 ETF gained +1.49% last week, while the VIX closed the week at 14.77, indicating an implied one day move of +/-0.93% & an implied one month move of +/-4.27%.
SPY ETF – SPDR S&P 500 ETF’s Technical Performance Over The Past Year
Their RSI is flat, midway between the neutral 50 mark & overbought 70 mark, sitting currently at 58.97, whiel their MACD remains bullish, but muted on the histogram due to the relative range-bound action of the past two weeks.
Volumes were -36.69% lower than the prior year’s average level (33.804,000 vs. 53,393,785), indicating that there is still a lot of hesitancy among market participants & adds to fears noted in prior weeks’ notes about how the current all-time highs will be difficult to break with staying power unless there is a major uptick in market participation (see here).
This is also important to note, as over the passing two weeks SPY’s average annual prior year’s volume has declined -2.63%, which will continue as we’ve noted over the past year as since 4/19/2024 average volumes have fallen dramatically.
To visualize this, one year ago in 2/18/2024’s Market Review Note the previous year’s average level was 81,771,964 as volumes began to wane in general, meaning this week’s average prior year’s level has fallen -34.7% lower Y-o-Y.
This should be viewed with caution given that we are still near all-time highs, but 1 of every 3 transactions that used to take place among market participants is no longer happening, indicating a high degree of uncertainty & hesitancy.
Between the upcoming wave of earnings this week, the January FOMC minutes coming out on Wednesday & the anticipated NVDA earnings call on 2/26/25 it looks like things will continue to oscillate around the 10 day moving average, much like they have for the past couple of weeks.
Monday opened the week up with a bearish harami candle on very low volume, where the 10 DMA’s support was able to hold up.
Tuesday showed a gap down open to below the 10 DMA’s support, but the resistance level was broken & SPY managed to end the day higher, forming a bullish engulfing pattern on slightly stronger, but still very weak volume, confirming the uneasiness mentioned above.
Wednesday is where all eyes should be when looking at the past week’s chart, as the week’s highest volume session opened on a gap down that flirted with the 50 day moving average’s support to the downside, but was able to power higher, temporarily breaking above the resistance of the 10 day moving average, before closing in line with it.
As the week’s average volume numbers show though, this was still not much to write home about despite the “high turnout” for the week.
Thursday saw slightly lower volume than Wednesday, and opened on a gap up, tested the 10 DMA’s support & then powered higher for the day, but the volume was still rather poor when the context of the annualized average volume is taken into account from above.
Friday the week wound down on a note of caution heading into the shortened holiday week this week, as the second lowest volume of the week resulted in a single day -0.00% decline.
The reason for the concern is that the doji combined with Thursday’s candle look set to create an evening doji star pattern potentially, which would be indicative of near-term pain on the horizon for SPY.
The volume of the past week wasn’t enough to keep SPY’s price above the all-time high when it broke through it temporarily on Friday, and that theme is still on the table.
Even should a rally occur, if the volume isn’t noticeably higher it would be wise to view it with skepticism & expect a high probability of a throwback before mid-March.
Moving into the new week it is going to be interesting to see what sort of upside momentum can be gathered, as SPY is just beneath its all-time high, but needs the volume mentioned above.
The likely average case will be a continuation of the oscillations around the 10 day moving average that we have been watching for the past few weeks & like much of December held, with some gap moves & then consolidation ranges.
Should this be the case & or any downside breakdown at all of the 10 DMA’s support take place there will be reasons for being vigilant in the coming week(s).
The 10 DMA currently is in a price zone that has historically been even, 1:1 between sellers & buyers over the past ~2 years & there is only one other support level separating the 10 & 50 DMAs.
When you consider that the 50 DMA is only -0.98% below the 10 DMA there’s limited room for a decline & waning enthusiasm for dip buyers to step in & make hold up the limited support levels.
It should also be noted that ~2% below the 50 DMA is the following support level, before just over 1% lower a Seller zone is entered, where Sellers have shown up 2.1:1.
While the next price zone below that one is Buyer dominated, but only at a rate of 1.08:1 & the only current support level is a hair above the lowest level of that price zone (see table below).
It’s become very evident that there’s a great need for vigilance in the coming week(s).
SPY has support at the $607.03 (Volume Sentiment: Buyers, 0.8:0*), $604.38 (10 Day Moving Average, Volume Sentiment: Even, 1:1), $602.48 (Volume Sentiment: Even, 1:1) & $598.48/share (50 Day Moving Average, Volume Sentiment: Buyers, 2.5:1) price levels, with resistance at the $610.78/share (All-Time High, Volume Sentiment: NULL, 0:0*) price levels.
SPY ETF’s Price Level:Volume Sentiment Over The Past ~2 Years
QQQ, the Invesco QQQ Trust ETF advanced +2.91% last week, as the tech-heavy index managed to fare the best of the major four index ETFs.
QQQ ETF – Invesco QQQ Trust ETF’s Technical Performance Over The Past Year
Their RSI is still advancing towards the overbought level & sits at 61.93 after the past three sessions, while their MACD is bullish, but its histogram has been muted since crossing over eight sessions ago.
Volumes were -36.76% lower than the prior year’s average levels (22,352,000 vs. 35,344,781), which is especially unnerving when you consider that the current past year’s average volume is -31.44% lower than than one year ago’s.
It’s also troubling to see volume this muted when 80% of the past week was advancing sessions for QQQ, indicating that there is a real lack of enthusiasm & folks are beginning to get slightly more worried.
Monday kicked QQQ’s week off on a bullish note, where the second weakest volume of the week’s session resulted in a bullish harami pattern, setting the stage for more gains in the near-term.
But not before Tuesday opened on a gap down, but quickly recovered to test the $530/share mark temporarily & managed to close higher, despite it being the weakest volume session of the week.
Things got a bit stranger come Wednesday, where on another gap down open QQQ opened below the 10 Day Moving Average’s support & tested the support of the 50 DMA, before rallying higher to close above the 10 DMA on the week’s second highest volume level, setting up the following two days of advancing sessions.
The fact that the 50 DMA was tested on the open after prices remaining above it for over a week is cause for caution & heightened awareness heading into this week.
Thursday’s gap up open also is cause for caution, just one day after the 50 DMA test, as despite having the strongest volume of the week, given how weak the week’s volume was is not convincing of any switches being flipped to the bullish side of things.
Friday also raises some eyebrows, as despite a new 52-week high being reached intraday, volumes were not strong enough to suggest a serious breakout to the upside particularly when compared to the two prior days’ levels.
Tuesday will play an important part in determining whether the three day rally lives on or if we see QQQ go back to oscillating around the 10 day moving average for the next week until NVDA earnings on 2/26/2025.
Like SPY, any meaningful upside movement in the near-term that will be sustainable will require an uptick in volume, especially given how robust the $538-539 window has held up among market participants.
Throwbacks should be watched for in the event of a breakout that does not occur on strong volumes.
In terms of should we see a consolidation range form from the run up of the second half of the week the 10 day moving average will become a key area to watch.
The reason being that once QQQ hits $534.99/share it is in a Seller dominated zone until it reaches $530/share, which is the zone currently housing the two support levels between the price & the 10 DMA.
Things will get tricky from there as then the next support level is the 50 day moving average, which also falls in a Seller zone that is on top of two additional Seller zones historically (see table below) with very sparse support along the way.
With few support levels to gain footing on & so much historic selling activity for the next -5.23% below Friday’s closing price it will make for good reason to watch those moving averages closely.
QQQ has support at the $533.82 (Volume Sentiment: Sellers, 0.6:0*), $531.24 (Volume Sentiment: Sellers, 0.6:0*), $528.15 (10 Day Moving Average, Volume Sentiment: Buyers, 2.86:1) & $522.34/share (50 Day Moving Average, Volume Sentiment: Sellers, 1.18:1) price levels, with resistance at the $538.28/share (All-Time High, Volume Sentiment: Buyers, 0.7:0*) price levels.
QQQ ETF’s Price Level:Volume Sentiment Over The Past ~2 Years
IWM, the iShares Russell 2000 ETF declined -0.01% last week, as the small-cap index was the least favored of the four major index ETFs.
IWM ETF – iShares Russell 2000 ETF’s Technical Performance Over The Past Year
Their RSI is flat, just below the neutral 50 mark & sits currently at 49.47, while their MACD is bearish, but also flat after last week’s performance.
Volumes were -35.77% lower than the previous year’s average (18,670,000 vs. 29,066,135), showing that there is very much a “wait & see” attitude towards the small cap names, as last week IWM basically just tread water.
Compared to last year’s average volume, IWM’s current level is only -15.93% lower, which shows much greater participation than SPY or QQQ as noted above (2/18/2024’s note here).
Monday IWM started off on a troublesome foot, as the day formed a bearish harami pattern with Friday’s candle.
The session opened higher, but proceeded to break down below the 10 day moving average’s support before retracing back to close in-line with the 10 day moving average.
The next day opened on a gap down on stronger volume, but was able to close above its opening price.
Wednesday opened on yet another gap down, tested below the $222.50/share price mark but was able to run higher & closed above its open again, with the upper shadow indicating that there was some slight upside appetite, which was also confirmed by the week’s highest volume.
Thursday saw yet another gap open, but this time to the upside, which led to a retracement back to near Wednesday’s close, but ultimately IWM powered higher to close just beneath the 10 DMA’s resistance on the week’s second strongest volume.
Friday opened on a gap up in-line with the 50 day moving average’s resistance, broke out above it temporarily, before declining to close beneath the 10 DMA’s support.
IWM has a lot more local support levels than SPY or QQQ above did, which will help them in the near-term unless there is a broader market selloff that impacts all of the major indexes.
This is also important as their long-term trend line (200 DMA) is currently -4% below Friday’s closing price, and a retest of the long-term trend may not go as well as the one that occurred in early January.
In the coming week it appears like IWM will continue to oscillate around the 10 & 50 DMAs & move more in-line with DIA than SPY & QQQ as market participants digest a lot of uncertainty.
The table below can be used to assess the strength & weakness of the support/resistance levels that IWM encounters.
IWM has support at the $225.73 (Volume Sentiment: Sellers, 3:1), $225.20 (Volume Sentiment: Sellers, 3:1), $223.51 (Volume Sentiment: Buyers, 1.92:1) & $221.79/share (Volume Sentiment: Buyers, 1.92:1) price levels, with resistance at the $226.33 (10 Day Moving Average, Volume Sentiment: Sellers, 3:1), $226.50 (Volume Sentiment: Sellers, 3:1), $226.99 (50 Day Moving Average, Volume Sentiment: Sellers, 3:1) & $227.17/share (Volume Sentiment: Sellers, 3:1) price levels.
IWM ETF’s Price Level:Volume Sentiment Over The Past ~2 Years
DIA ETF – SPDR Dow Jones Industrial Average ETF’s Technical Performance Over The Past Year
Their RSI is trending back down towards the neutral 50 mark & sits currently at 56.43, while their MACD is bearish but has been flattening out after last week’s consolidation.
Volumes were -34.28% below their previous year’s average level (2,142,000 vs. 3,259,442), which is troubling when you consider how two of the three advancing sessions of the week were on extremely light volume compared to the two declining sessions.
DIA has managed to have the most stable Y-o-Y prior year’s average volume level, with the current one being just -6% below a year ago’s as market participants have clearly favored the security of blue chip stocks.
Much like IWM, DIA opened the week forming a bearish harami pattern with Friday’s hanging man candle, setting the stage for a week of uncertainty based on the unusually low volume.
Tuesday opened lower but was able to rally on another light volume session for form a bullish engulfing pattern that closed in-line with the 10 dya moving average.
Wednesday opened on a gap lower & tested lower before closing above its open, but as a spinning top candle indicating that there was still a great deal of uncertainty in the air.
Thursday the jumpiness continued with a gap up open that was in-line with the 10 DMA’s resistance, before testing lower to Wednesday’s close & then powering higher to close above the 10 DMA.
Friday market participants did not want to be carrying risk into the weekend & it resulted in a -0.33% declining day that closed just above the support of the 10 day moving average.
While DIA & IWM have moved in a more similar manner than SPY & QQQ, IWM has spent more time in consolidation ranges than DIA, leading to DIA having less support levels nearby.
This means it will be important to keep an eye on the volume sentiment at each of their price levels in the coming week(s), particularly as they are currently in a Seller dominated zone over the past 3-4 years at a rate of 1.25:1, which could aid in their price slipping.
Else, without much of an increase in volume it will be difficult to see any meaningful new all-time highs on the horizon that have staying power.
Expect prices to oscillate back & forth around the 10 DMA & between it & the 50 DMA in the coming week, barring any news that leads to a sell off, as DIA has shown resilience among the major indexes with market participants still wanting to buy blue chip names, just at muted levels of participation.
DIA has support at the $445.65 (10 Day Moving Average, Volume Sentiment: Sellers, 1.25:1), $443.51 (Volume Sentiment: Buyers, 1.67:1), $437.42 (50 Day Moving Average, Volume Sentiment: Buyers, 1.6:1) & $433.51/share (Volume Sentiment: Buyers, 2.67:1) price levels, with resistance at the $450.08 (Volume Sentiment: Buyers, 0.4:0*) & $450.36/share (All-Time High, Volume Sentiment: Buyers, 0.4:0*) price levels.
DIA ETF’s Price Level:Volume Sentiment Over The Past ~3-4 Years
The Week Ahead
Monday the market will be closed for President’s Day, but Fed President Harker speaks at 9:30, Feg Governor Bowman speaks at 10:20 am & Fed Governor Waller speaks at 6 pm & there will be no earnings reports.
The Empire State Manufacturing Survey data is released Tuesday at 8:30 am, followed by Home Builder Confidence Index data at 10 am, Fed President Daly speaking at 10:20 am & Fed Vice Chair for Supervision Barr speaking at 1 pm.
Tuesday morning’s before the bell earnings reports include Allegion, Blackbaud, Chemours, Donnelly Financial, Expeditors International of Washington, Fluor, Franklin Electric, GeneDx, Genuine Parts, Hillman Solutions, Medtronic, NeoGenomics, Sapiens International, TRI Pointe Homes, Valmont Industries, Viking Holdings, Visteon, Vulcan Materials, Watsco & Waystar Holdings, with Andersons, Arista Networks, Bumble, Cadence Design, Celanese, Community Health, Comstock, CoStar Group, CVR Energy, Devon Energy, Element Solutions, EQT Corp., Flowserve, Halozyme Therapeutics, Ingevity, Innospec, International Flavors & Fragrances, James Hardie, La-Z-Boy, Magnolia Oil & Gas, Matador Resources, Occidental Petroleum, Penumbra, Perdoceo Education, RB Global, Rush Enterprises, Select Water Solutions, Shift4 Payments, Sonoco Products, Ternium, Toll Brothers & Unisys due to report after the closing bell.
Wednesday morning brings us Housing Starts & Building Permits data at 8:30 am, followed by the January FOMC Minutes at 2pm & Fed Vice Chair Jefferson speaking at 5 pm.
Amicus Therapeutics, Analog Devices, Appian, Bausch + Lomb, Centuri Holdings, Charles River, Cinemark, Clarivate, Clean Harbors, Enlight Renewable Energy, Enpro, Etsy, First Majestic Silver, Fiverr, Garmin, Gentherm, Gibraltar Industries, Gildan Activewear, Global-E Online, Healthcare Realty, Hudbay Minerals, Ionis Pharmaceuticals, Ionis Pharmaceuticals, KinderCare Learning, Krystal Biotech, Loar Holdings, Louisiana-Pacific, Materion, OGE Energy, OneSpaWorld, Parsons, PROG Holdings, ProPetro, StandardAero, Stepan, Travel + Leisure, Trimble, Wingstop, Wix.com & Wolverine World Wide report earnings before Wednesday’s opening bell, followed by Klaviyo, ACV Auctions, Alamos Gold, American States Water, American Water Works, Amplitude, ANSYS, B2Gold, Bausch Health, BioMarin Pharmaceutical, Carvana, CF Industries, Cheesecake Factory, Churchill Downs, Clearwater Analytics, Coeur Mining, Enovix, Equinox Gold, Exact Sciences, Genco Shipping & Trading, Grand Canyon Education, Herbalife Nutrition, Host Hotels, ICON plc, IMAX, Innovative Industrial Properties, Innovex International, Jackson Financial, Kaiser Aluminum, Manulife Financial, McGrath RentCorp, Mister Car Wash, NerdWallet, Nordson, Northern Oil & Gas, Oceaneering International, ONE Gas, OPENLANE, Orion Engineered Carbons, Pan Am Silver, Park Hotels & Resorts, PRA Group, Remitly Global, Sabra Health Care REIT, SM Energy, SolarEdge Technologies, Sturm Ruger, Tanger Factory, Toast, Trupanion, Vimeo, Vital Energy & Wheaton Precious Metals.
Initial Jobless Claims & Philadelphia Fed Manufacturing Survey data are all released Thursday at 8:30 am, followed by Fed President Goolsbee speaking at 9:35 am, U.S. Leading Economic Indicators data at 10 am, Fed Vice Chair for Supervision Barr speaking at 2:30 pm & Fed Governor Kugler speaking at 5 pm.
Thursday morning kicks off with earnings from Walmart, Alight, Americold Realty Trust, Ardelyx, Autohome, Bandwidth, BigCommerce, Bilibili, Birkenstock Holding, Builders FirstSource, Cameco, Cenovus Energy, CenterPoint, Cheniere Energy, Choice Hotels, Constellium, Core Natural Resources, Cushman & Wakefield, Dana, DigitalBridge, Dun & Bradstreet, Endava, Enviri Corp, EPAM Systems, ESAB, Freshpet, FTI Consulting, Hasbro, IdaCorp, Insmed, Integer Holdings, Lamar Advertising, Laureate Education, Leonardo DRS, LKQ, Nutrien, Pediatrix Medical Group, Pool, Primo Brands Corp, Quanta Services, Reliance, Repligen, Sabre, Shake Shack, Southern, SpringWorks Therapeutics, Teck Resources, Tempur Sealy International, Trinity Industries, TripAdvisor, Unity Software, Upbound Group, Utz Brands & Wayfair before the opening bell, with Booking Holdings, ACCO Brands, Akamai Technologies, Alarm.com, Alliant Energy, American Homes 4 Rent, AMN Healthcare, Barings BDC, BJ Restaurants, Block, Boise Cascade, CarGurus, Con Edison, Dropbox, Employers Holdings, Evolent Health, eXp World Holdings, Fidelity National, Five9, Floor & Decor, Frontier Communications, Gaming and Leisure Properties, Glaukos, Globus Medical, Grid Dynamics, Guardant Health, indie Semiconductor, Insulet, iRhythm, Live Nation, MP Materials, Newmont Corp, NV5 Global, Rackspace Technology, Resideo, RingCentral, Rivian Automotive, Ryan Specialty Group, Ryman Hospitality, Select Medical, Sprouts Farmers Market, Texas Roadhouse, Universal Display, VICI Properties, Vicor & World Kinect all due to report after the session’s close.
Friday the week winds down with S&P Flash U.S. Services PMI & S&P Flash U.S. Manufacturing PMI data at 9:35 am, followed by Consumer Sentiment (final) & Existing Home Sales at 10 am, and Fed Vice Chairman Jefferson & Fed President Daly speaking at 11:30 am.
Atmus Filtration Technologies, Balchem, Brady, Oil States, Sunstone Hotel, Telephone & Data, TXNM Energy & Uniti Group are all due to report earnings on Friday morning before the session’s open.
See you back here next week!
*** I DO NOT OWN SHARES OR OPTIONS CONTRACT POSITIONS IN SPY, QQQ, IWM OR DIA AT THE TIME OF PUBLISHING THIS ARTICLE ***
The VIX closed at 15.1, indicating an implied one day move of +/-0.95% & an implied one month move of +/-4.36% for the S&P 500.
Highest Technical Rated S&P 500 Components Per 2/13/2025’s Close:
1 – PLTR
2 – TPR
3 – CRWD
4 – AXON
5 – FFIV
6 – RL
7 – FTNT
8 – NFLX
9 – GEV
10 – EXPE
Lowest Technical Rated S&P 500 Components Per 2/13/2025’s Close:
1 – WST
2 – MRNA
3 – FMC
4 – SWKS
5 – AES
6 – EIX
7 – CE
8 – STZ
9 – HII
10 – ENPH
Highest Volume Rated S&P 500 Components Per 2/13/2025’s Close:
1 – WST
2 – ZTS
3 – MGM
4 – ZBRA
5 – TAP
6 – INTC
7 – AWK
8 – GEHC
9 – WYNN
10 – ABNB
Lowest Volume Rated S&P 500 Components Per 2/13/2025’s Close:
1 – SWK
2 – TPL
3 – EQR
4 – DLTR
5 – BEN
6 – MPWR
7 – WBA
8 – APD
9 – HST
10 – JBL
Highest Technical Rated ETFs Per 2/13/2025’s Close:
1 – LFAW
2 – BABX
3 – FBL
4 – PTIR
5 – WEBL
6 – TARK
7 – YINN
8 – PSIL
9 – SKYU
10 – UCYB
Lowest Technical Rated ETFs Per 2/13/2025’s Close:
1 – MSOX
2 – MRNY
3 – BCHG
4 – YANG
5 – KOLD
6 – SARK
7 – TSLZ
8 – TSDD
9 – TSLQ
10 – CNBS
Highest Volume Rated ETFs Per 2/13/2025’s Close:
1 – SPAQ
2 – LIAO
3 – GXUS
4 – ECML
5 – LFAW
6 – AVNM
7 – EUSC
8 – HSUN
9 – MAYP
10 – GQI
Lowest Volume Rated ETFs Per 2/13/2025’s Close:
1 – QMAG
2 – AGRH
3 – USCL
4 – TSEC
5 – KLXY
6 – PABU
7 – ZSEP
8 – MYCJ
9 – SPYQ
10 – TBJL
Highest Technical Rated General Stocks Per 2/13/2025’s Close:
1 – DOMH
2 – AIFF
3 – SOPA
4 – GRRR
5 – BBAI
6 – WLGS
7 – RPID
8 – LTBR
9 – VNET
10 – APPS
Lowest Technical Rated General Stocks Per 2/13/2025’s Close:
1 – FTEL
2 – CLEU
3 – CYN
4 – DGLY
5 – UPC
6 – ACON
7 – VLCN
8 – CDT
9 – LICN
10 – ADTX
Highest Volume Rated General Stocks Per 2/13/2025’s Close:
1 – EDSA
2 – MBRX
3 – SLG
4 – OUT
5 – PRPH
6 – PEV
7 – OKAID
8 – MAMA
9 – DGLY
10 – IVAC
Lowest Volume Rated General Stocks Per 2/13/2025’s Close:
1 – PYFRF
2 – SBIG
3 – BETRF
4 – VNPKF
5 – LODFF
6 – OMQS
7 – PTHL
8 – LIMX
9 – TIMCF
10 – GIKLY
*** THE LIST ABOVE IS STRICTLY FOR INFORMATIONAL PURPOSES – I MAY OR MAY NOT HAVE OR INITIATE A LONG, SHORT, OR LONG/SHORT POSITION IN ANY NAME ABOVE AT ANY TIME ***
The VIX closed at 15.89, indicating an implied one day move of +/-1.00% & an implied one month move of +/-4.59% for the S&P 500.
Highest Technical Rated S&P 500 Components Per 2/12/2025’s Close:
1 – PLTR
2 – TPR
3 – AXON
4 – FFIV
5 – UAL
6 – RL
7 – GEV
8 – VST
9 – EXPE
10 – FTNT
Lowest Technical Rated S&P 500 Components Per 2/12/2025’s Close:
1 – MRNA
2 – FMC
3 – SWKS
4 – AES
5 – STZ
6 – EIX
7 – CE
8 – ENPH
9 – HII
10 – BIIB
Highest Volume Rated S&P 500 Components Per 2/12/2025’s Close:
1 – SCHW
2 – WAB
3 – GNRC
4 – MLM
5 – FOX
6 – FIS
7 – ZBRA
8 – CVS
9 – CF
10 – DFS
Lowest Volume Rated S&P 500 Components Per 2/12/2025’s Close:
1 – KLAC
2 – CEG
3 – MNST
4 – MMM
5 – MPWR
6 – SOLV
7 – AZO
8 – STT
9 – GEV
10 – AVGO
Highest Technical Rated ETFs Per 2/12/2025’s Close:
1 – BABX
2 – FBL
3 – PTIR
4 – WEBL
5 – YINN
6 – PSIL
7 – SKYU
8 – XPP
9 – TARK
10 – NUKZ
Lowest Technical Rated ETFs Per 2/12/2025’s Close:
1 – MSOX
2 – MRNY
3 – YANG
4 – BCHG
5 – KOLD
6 – CNBS
7 – AMDL
8 – SARK
9 – SBIT
10 – ZCSH
Highest Volume Rated ETFs Per 2/12/2025’s Close:
1 – TOAK
2 – CCNR
3 – HIDV
4 – JEMB
5 – FDNI
6 – INRO
7 – PP
8 – EZM
9 – AUGP
10 – TSEP
Lowest Volume Rated ETFs Per 2/12/2025’s Close:
1 – USCA
2 – BBEM
3 – TALF
4 – TSEC
5 – SIXP
6 – DYNI
7 – UJB
8 – MINV
9 – AGRH
10 – JMID
Highest Technical Rated General Stocks Per 2/12/2025’s Close:
1 – BBAI
2 – SOPA
3 – DOMH
4 – AIFF
5 – YOSH
6 – WLGS
7 – MNPR
8 – GRRR
9 – RPID
10 – LTBR
Lowest Technical Rated General Stocks Per 2/12/2025’s Close:
1 – CLEU
2 – FTEL
3 – GCTK
4 – CYN
5 – UPC
6 – VLCN
7 – ACON
8 – MBRX
9 – CRKN
10 – PLRX
Highest Volume Rated General Stocks Per 2/12/2025’s Close:
1 – KDLY
2 – TIVC
3 – XLO
4 – NKGN
5 – IMBBF
6 – APTO
7 – MAMA
8 – MYNA
9 – WISA
10 – TCBC
Lowest Volume Rated General Stocks Per 2/12/2025’s Close:
1 – RGXTF
2 – SBIG
3 – CYTOF
4 – OIIF
5 – EUBG
6 – GLBXF
7 – GECSF
8 – IFNNF
9 – NFUNF
10 – VHIBF
*** THE LIST ABOVE IS STRICTLY FOR INFORMATIONAL PURPOSES – I MAY OR MAY NOT HAVE OR INITIATE A LONG, SHORT, OR LONG/SHORT POSITION IN ANY NAME ABOVE AT ANY TIME ***
The VIX closed at 16.02, indicating an implied one day move of +/-1.01% & an implied one month move of +/-4.63% for the S&P 500.
Highest Technical Rated S&P 500 Components Per 2/11/2025’s Close:
1 – PLTR
2 – TPR
3 – AXON
4 – FFIV
5 – GEV
6 – UAL
7 – VST
8 – RL
9 – FTNT
10 – CEG
Lowest Technical Rated S&P 500 Components Per 2/11/2025’s Close:
1 – MRNA
2 – FMC
3 – SWKS
4 – EIX
5 – AES
6 – STZ
7 – CE
8 – ON
9 – ENPH
10 – HII
Highest Volume Rated S&P 500 Components Per 2/11/2025’s Close:
1 – FIS
2 – SCHW
3 – DD
4 – LDOS
5 – ECL
6 – PSX
7 – HUM
8 – SMCI
9 – MAR
10 – ZBRA
Lowest Volume Rated S&P 500 Components Per 2/11/2025’s Close:
1 – TPL
2 – SNPS
3 – BA
4 – GWW
5 – KEYS
6 – HD
7 – SBUX
8 – VST
9 – K
10 – KLAC
Highest Technical Rated ETFs Per 2/11/2025’s Close:
1 – BABX
2 – FBL
3 – PTIR
4 – WEBL
5 – PSIL
6 – SKYU
7 – YINN
8 – UCYB
9 – NUKZ
10 – FAS
Lowest Technical Rated ETFs Per 2/11/2025’s Close:
1 – MSOX
2 – MRNY
3 – BCHG
4 – KOLD
5 – YANG
6 – AMDL
7 – ZCSH
8 – NVD
9 – BTOP
10 – NVDQ
Highest Volume Rated ETFs Per 2/11/2025’s Close:
1 – IQSM
2 – UTRN
3 – JRE
4 – BUFP
5 – BSMC
6 – BLES
7 – SECR
8 – PBSE
9 – IBD
10 – IWLG
Lowest Volume Rated ETFs Per 2/11/2025’s Close:
1 – JMID
2 – GSID
3 – GGUS
4 – AAPR
5 – MAGG
6 – NDVG
7 – MQQQ
8 – OVT
9 – TBFC
10 – TIME
Highest Technical Rated General Stocks Per 2/11/2025’s Close:
1 – SOPA
2 – DOMH
3 – LTRY
4 – WLGS
5 – MNPR
6 – BBAI
7 – BSXGF
8 – ATGL
9 – KC
10 – GRRR
Lowest Technical Rated General Stocks Per 2/11/2025’s Close:
1 – FTEL
2 – GCTK
3 – ACON
4 – RIME
5 – UPC
6 – VLCN
7 – PLRX
8 – CRKN
9 – EYEN
10 – CDT
Highest Volume Rated General Stocks Per 2/11/2025’s Close:
1 – TWO
2 – AIFF
3 – INAB
4 – OMGA
5 – ABLV
6 – THRD
7 – DOMH
8 – ORMP
9 – OCEA
10 – LFWD
Lowest Volume Rated General Stocks Per 2/11/2025’s Close:
1 – GIKLY
2 – FEBO
3 – ASPU
4 – DMXCF
5 – RECT
6 – OIIIF
7 – ECDA
8 – CNNEF
9 – SGLY
10 – WVMDF
*** THE LIST ABOVE IS STRICTLY FOR INFORMATIONAL PURPOSES – I MAY OR MAY NOT HAVE OR INITIATE A LONG, SHORT, OR LONG/SHORT POSITION IN ANY NAME ABOVE AT ANY TIME ***