Charter Communications Inc. stock has recently shown great technical strength, making it worth considering for a short-term trade opportunity.
CHTR stock closed at $650.43/share on 1/21/21, while completing a bullish MACD crossover into a new uptrend.
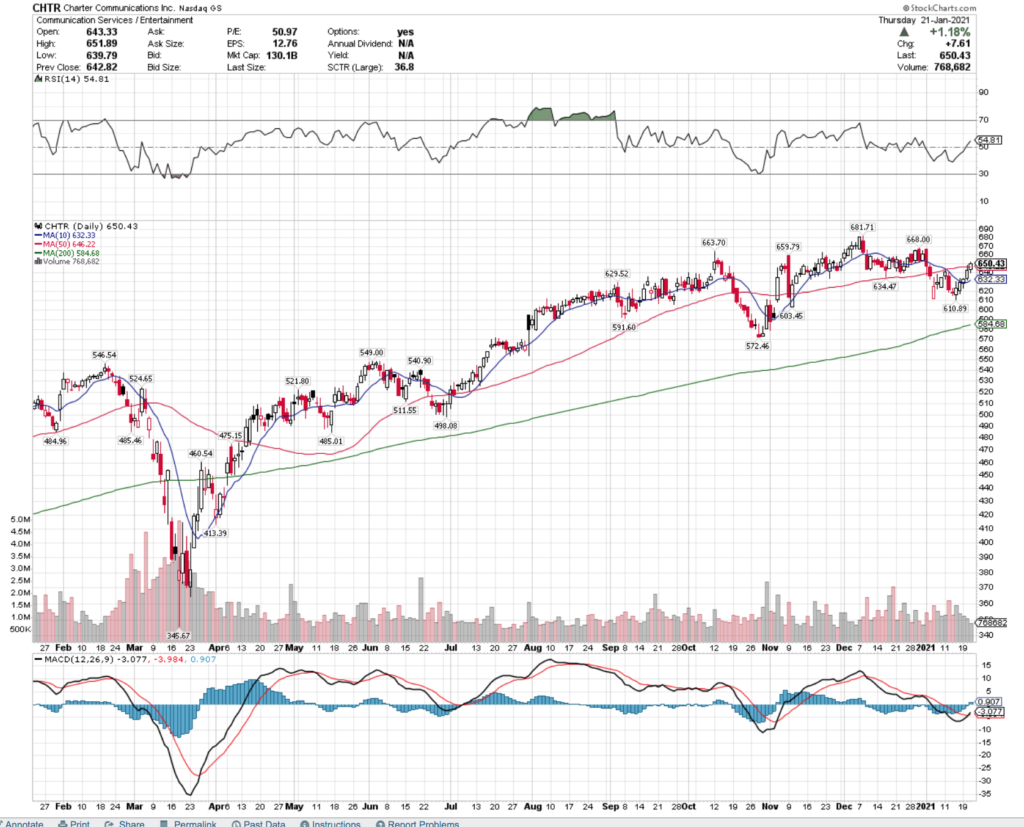
CHTR Stock Price: $650.43
10 Day Moving-Average: $632.33
50 Day Moving-Average: $646.22
200 Day Moving-Average: $584.68
RSI: 55
Given CHTR’s low RSI value & recent volume behind their upwards movement, this trend looks to have more room to run.
CHTR stock also has options that traders can take advantage of.
Looking at the 2/19 expiration date, the $650 calls are just in-the-money, although they may be lacking in liquidity as there is a very low open interest (13 as of writing this), which is something traders should be mindful of.
In the case of CHTR I’m not certain that I would be quick to sell any puts here, as in the event of a 10% correction, their price would be flirting with their 200 Day Moving-Average on a downtrend, which would be a bearish flag.
If I were going to, I may think to look at the $540 range for a strike price, which would give you an additional ~7% cushion for further declines in price.
All-in-all, Charter Communications Inc Stock looks to have a lot of good opportunities for short-term traders to take advantage of.
*** I DO NOT OWN SHARES OF CHTR STOCK ***