Last week’s market events were primarily driven by earnings & weakness in news, as well as anticipated tightening of interest rates to combat inflation.
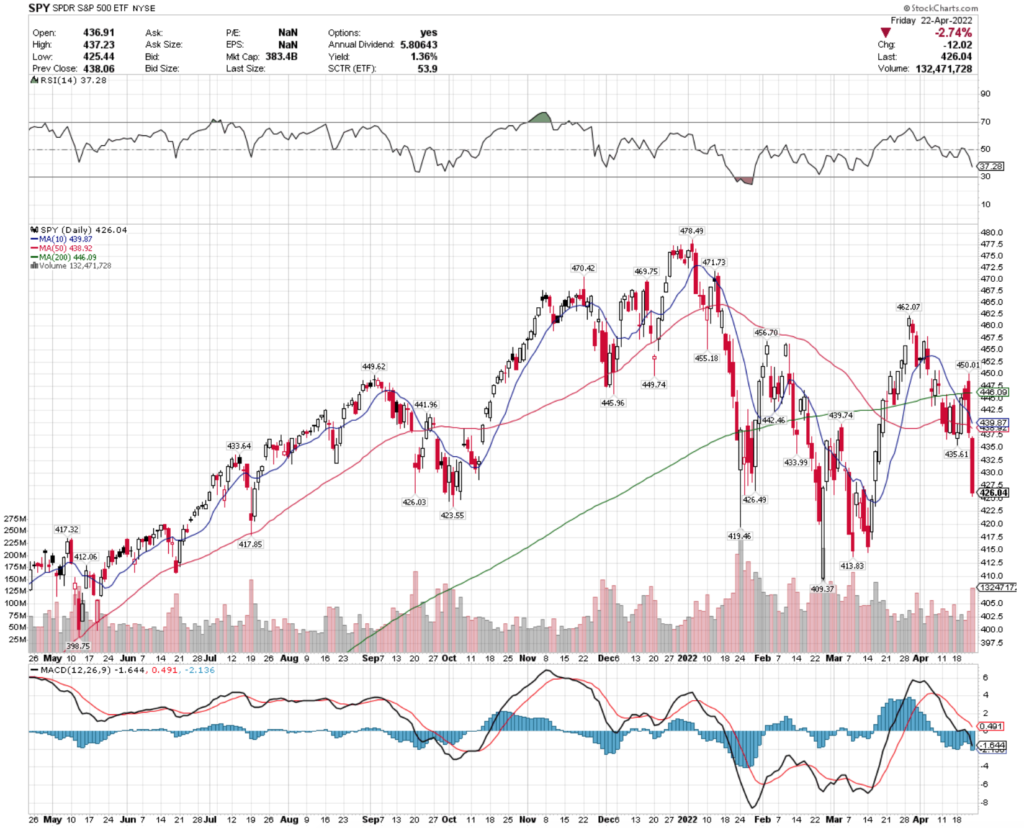
SPY, the SPDR S&P 500 ETF continued its choppy 2022, closing down in 4 of 5 sessions as investors tried sorting out what is going to come next for stocks & the economy.
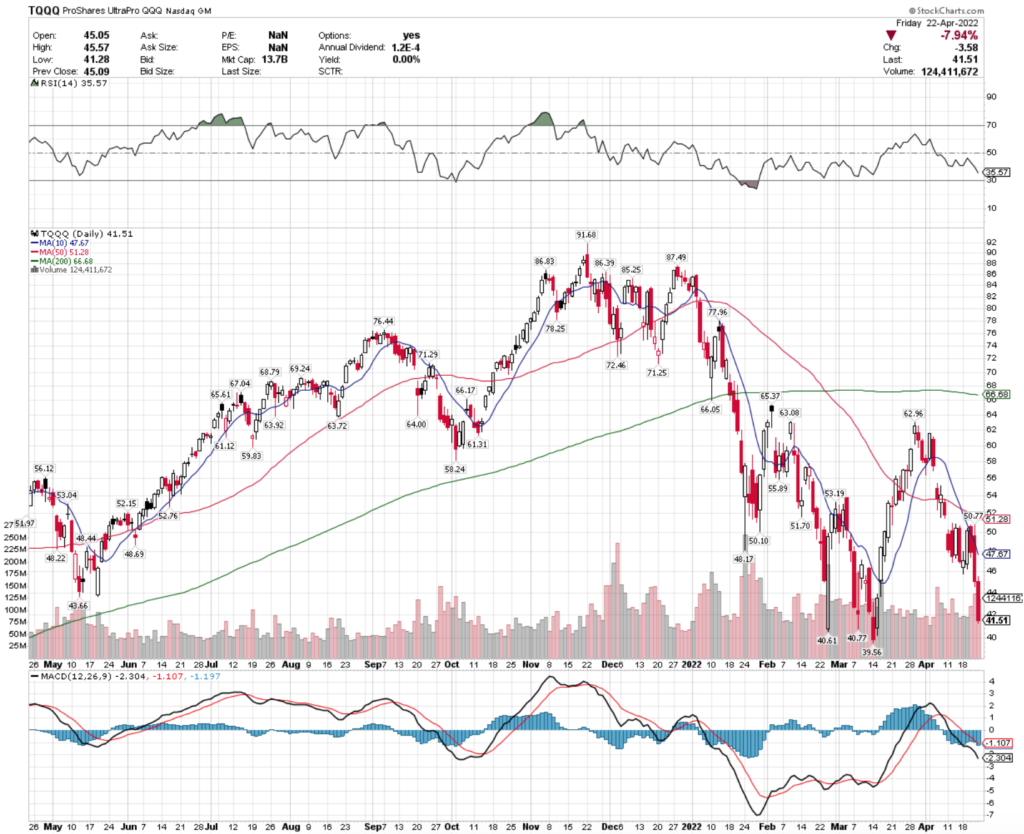
TQQQ, the ProShares UltraPro QQQ ETF that tracks the performance of the NASDAQ also struggled all week.
This week looks to be about the same catalysts as last, with more of a focus on technology names in the earnings department.
Let’s take a closer look at some of the best & worst performing ETFs by sector/geo-location for this week.
Corn (CORN), 20+ Year Treasuries (TBF), Soybeans (SOYB) & North American Pipelines (TPYP) Bullishly Lead The Markets
CORN, the Teucrium Corn Fund ETF has been on a steady climb since September 2021, and has finally cooled off over the last 3 days.
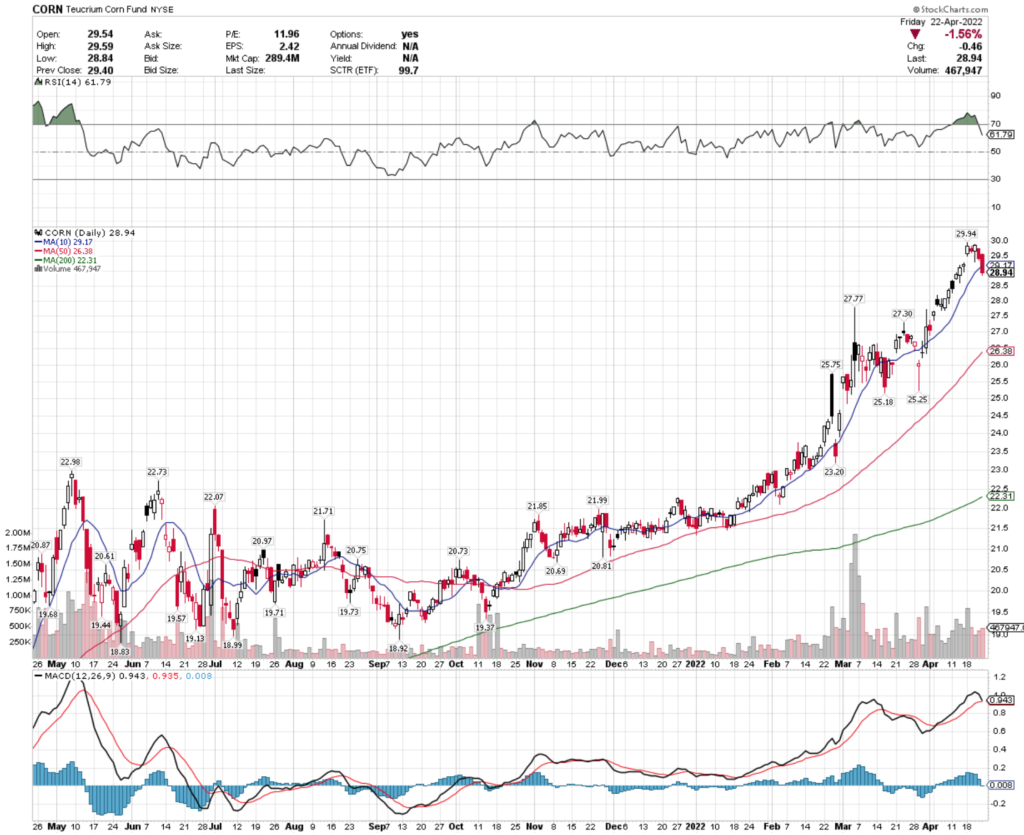
Based on their MACD & RSI, there looks to be a bit of voliatlity in store for them in the near-term, which is also supported by their recent above average trading volume levels.
There may be room for an entry into a new position soon, and with their options there looks to be many other opportunities for traders to profit as they establish a new price range after such rapid growth.
TBF, the ProShares Short 20+ Year Treasury ETF has enjoyed steady growth since December 2021’s lows.
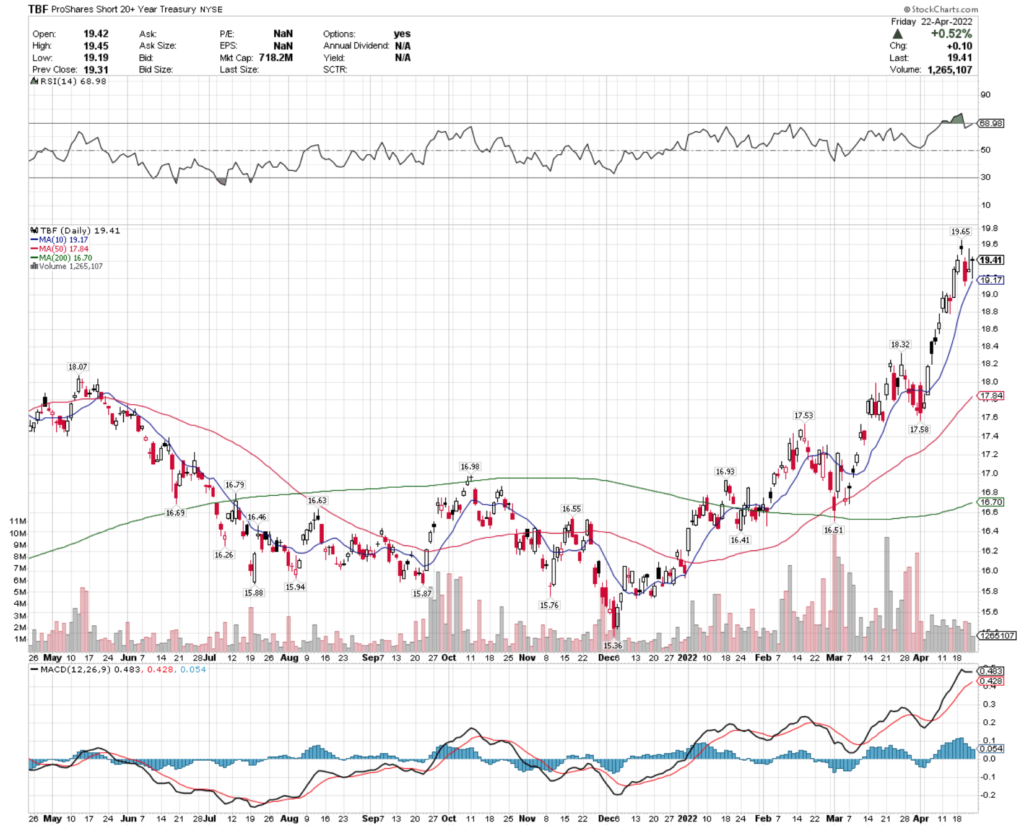
Their MACD is beginning to curl bearishly, and their RSI is at overbought territory, signaling that there may be some near-term volatility in store.
TBF’s trading volumes have been above average recently compared to the year prior, signaling that traders have confidence in the ETF – trading options would be a wise move to safely take some profits from their current momentum.
SOYB, the Teucrium Soybean Fund ETF has also enjoyed steady growth since November os 2021, but looks to be currently cooling off.
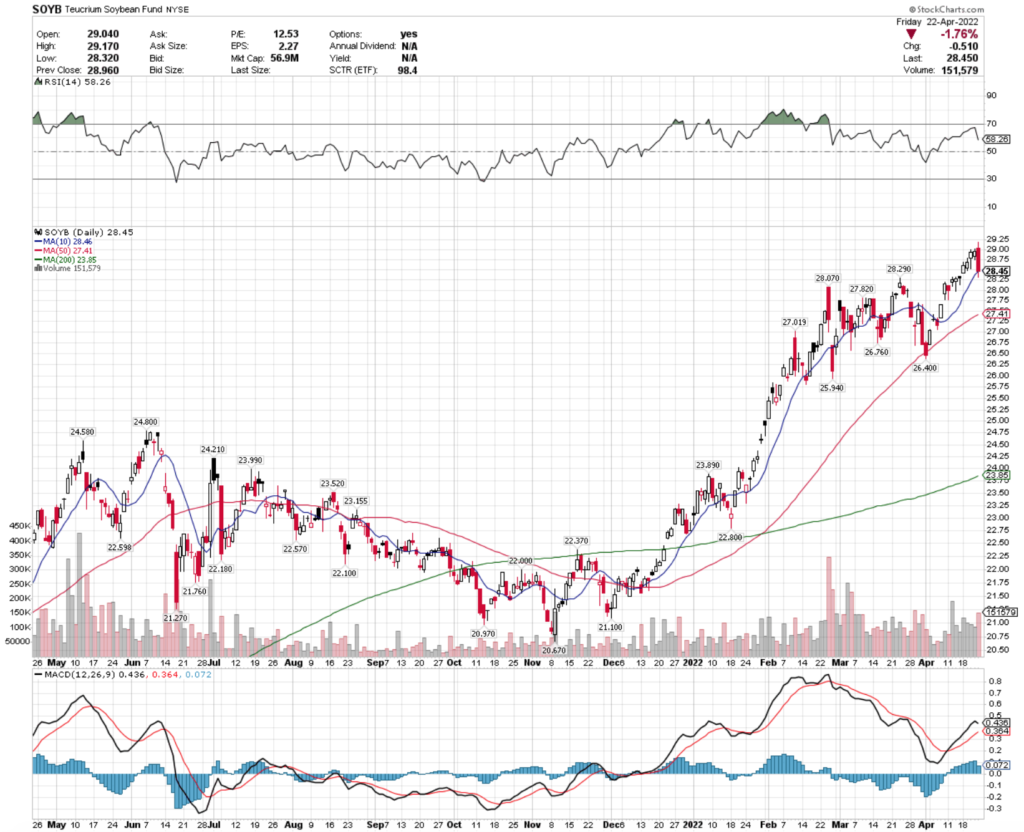
Their MACD is beginning to roll over bearishly, although their RSI is re-approaching neutral (50) & they look to have investor confidence based on their recent above average trading volumes.
TPYP, the Tortoise North American Pipeline Fund ETF has also been steadily climbing over the last year, until the last two trading sessions where it began to sell off.
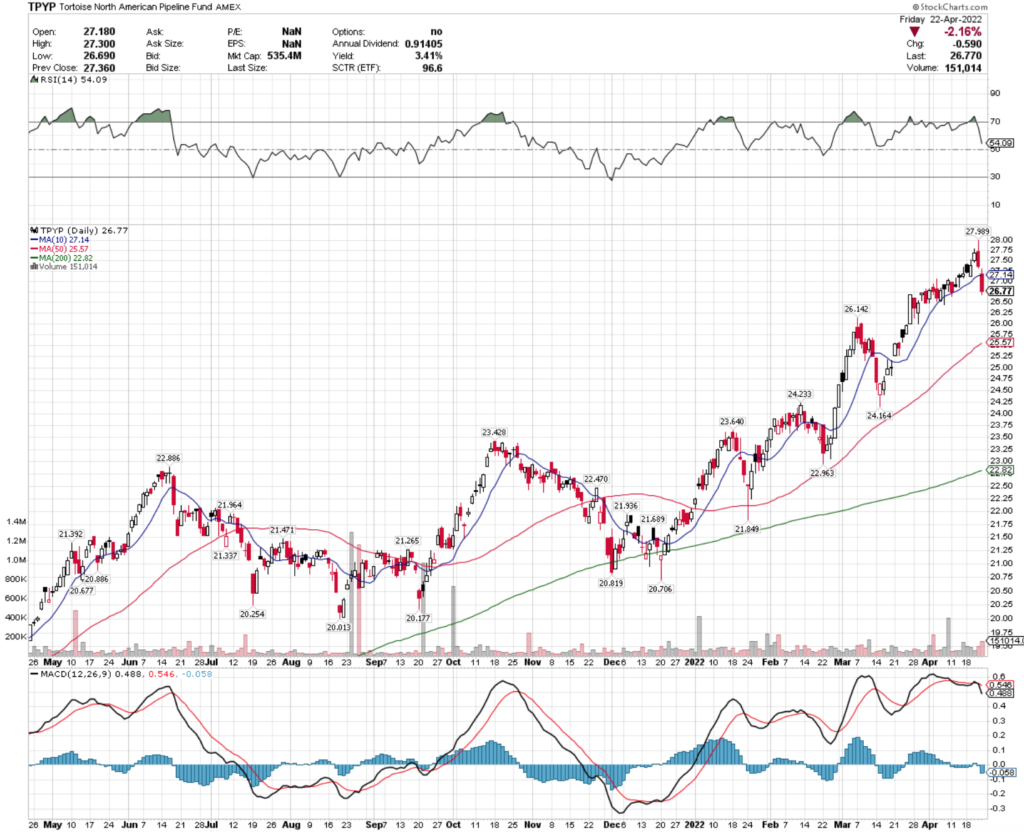
TPYP’s RSI was in need of a price shakeout, going from being overbought in the 70’s down to 54 over the last few days.
With a bearish MACD & no options contracts, the 3.4% dividend can be used as a cushion should the price continue lower.
Cloud Computing (SKYY), Entrepreneurs (ENTR), IPO’s (IPO) & Chindia (FNI) Bearishly Lagging The Markets
SKYY, the First Trust Cloud Computing ETF has not performed well as we have entered the rate tightening cycle.
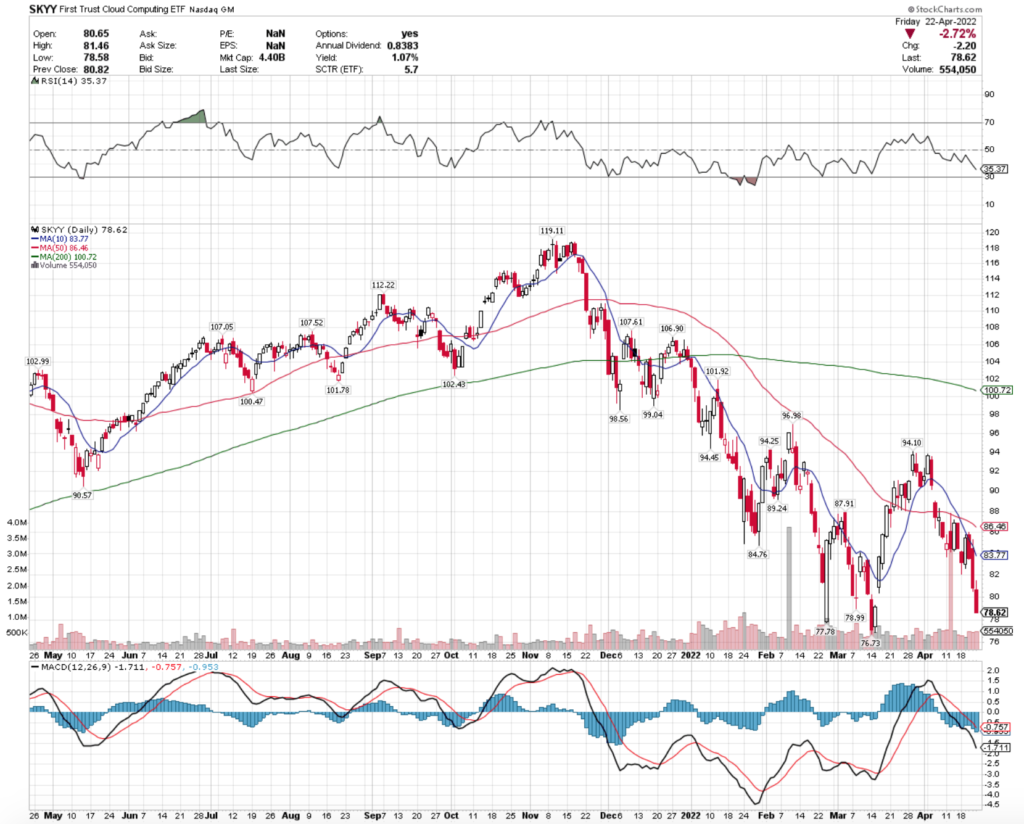
Their RSI is approaching oversold territory, but their MACD still looks bearish – they do have options contracts that can be used to profit alongside a long-position while the price comes down, as well as a 1.1% dividend.
ENTR, the ERShares Entrepreneur 30 ETF is in a similar position, but has suffered from having much less trading volume than SKYY.
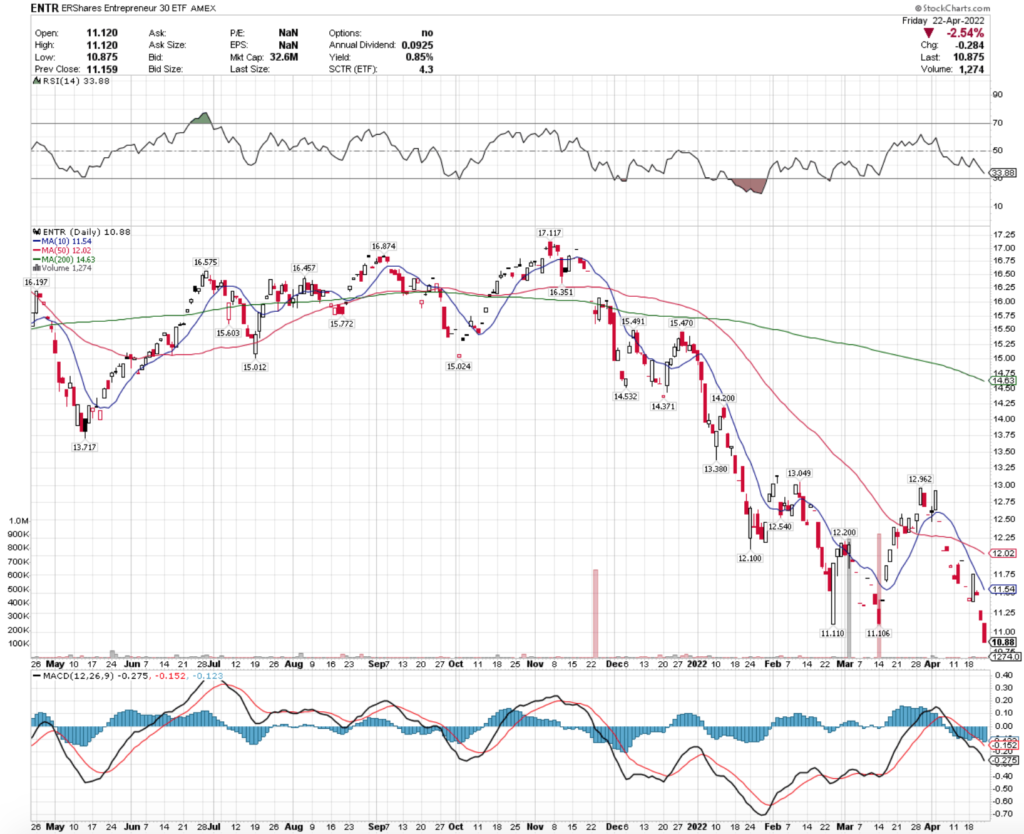
While ENTR does not have options to trade, they do offer a modest dividend that can be used as a cushion if entering a long-position.
However, their MACD & RSI do not appear level enough to safely begin thinking about that.
IPO, the Renaissance IPO ETF has continued moving downwards since November; also with a bearish MACD & oversold RSI.
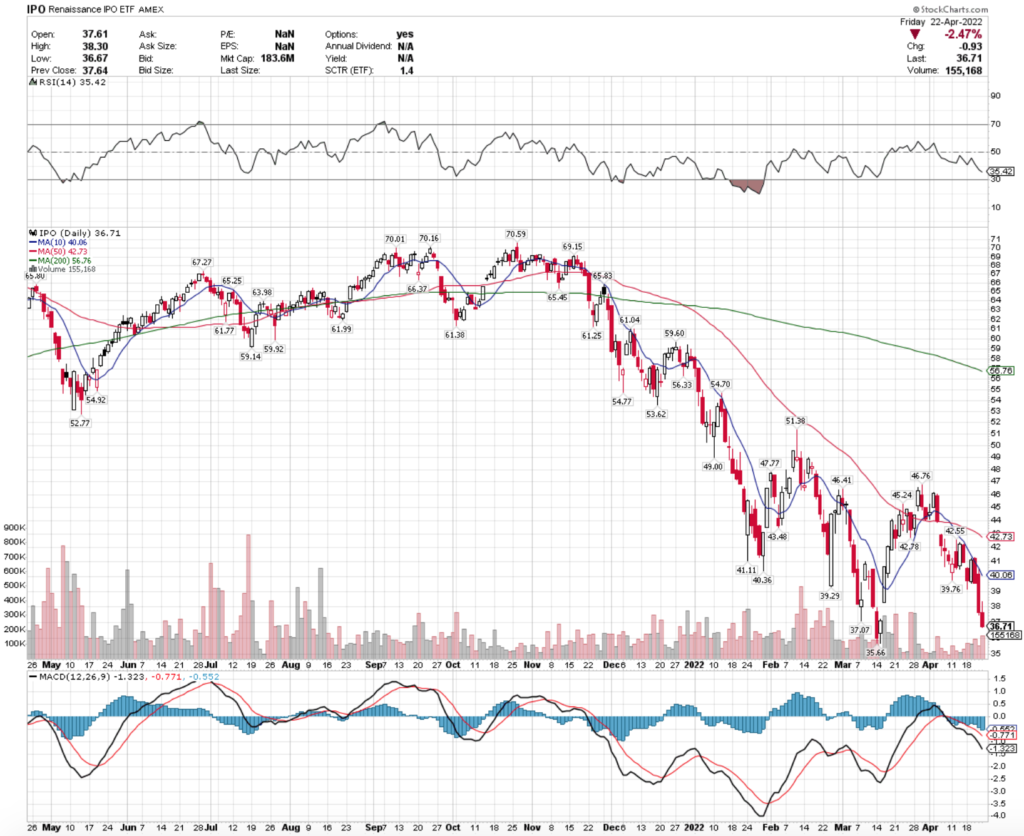
Their performance is also going to be tied heavily to interest rates & market liquidity, making this a name to be using options for as a safety net.
FNI, the First Trust ISE Chindia Index ETF has been steadily falling since a year ago, with very low volume levels.
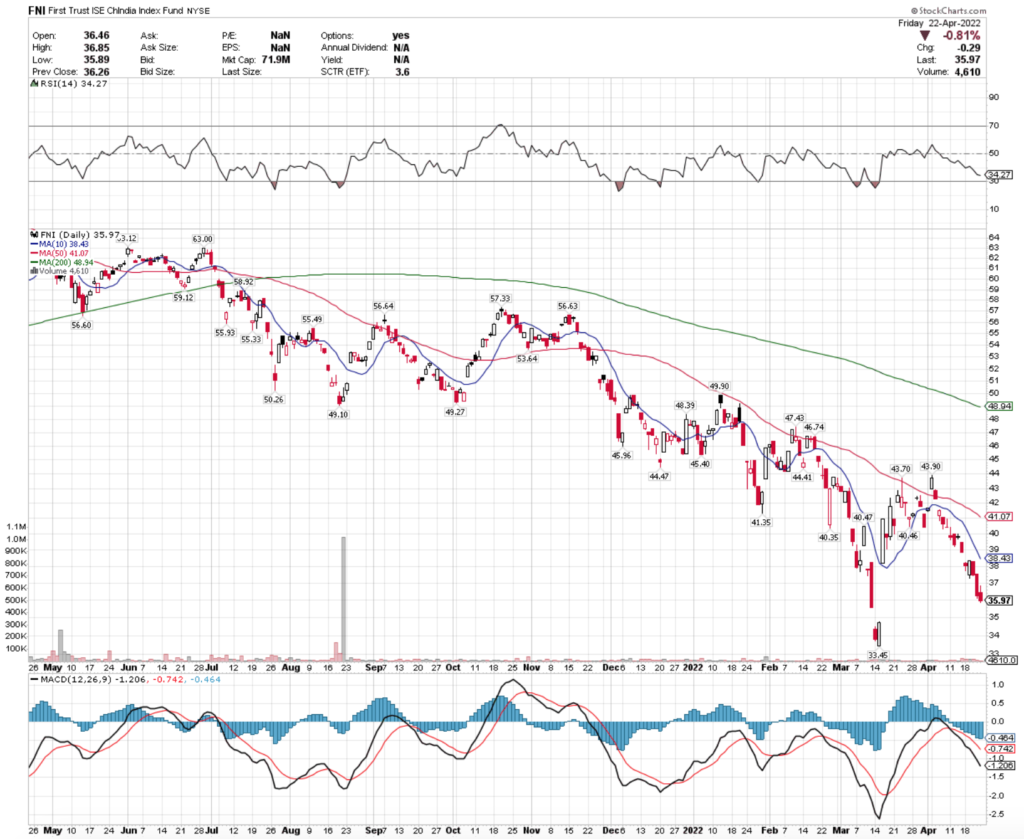
While their shares have tried to bounce in the last 2 months, there still looks to be a lot of weakness in this name.
Tying It All Together
All eyes will be set on earnings calls this week, as markets seek to rebound from a weak week prior.
Investors will be eager not just to hear about the performance of their holdings, but also to gain clues into the market landscape that may impact their stocks & the broader market in general.
Volumes will be important to keep a closer eye on, as they will give clues about the investor sentiment both in individual names, as well as in sector-specific ETFs.
Check back next week to see how different sectors fared in our next weekly review!
*** I DO NOT OWN SHARES OF SPY, TQQQ, CORN,TBF, SOYB, TPYP, SKYY, ENTR, IPO OR FNI AT THE TIME OF WRITING THIS ARTICLE ***