This week we will begin to hear about the impact that Covid has had on Black Friday & Cyber Monday, which will be a great barometer of consumer sentiment for a year that has hurt many financially.
Another item of interest will be to see not only how Covid cases/deaths continue to climb & where, but how drastic the “lockdown” measures taken to combat it will be.
I will also be interested in hearing more about Flu numbers, as we are in full on flu season now, and it isn’t sounding like that bad of a year, which raises suspicion on Covid reporting.
On Tuesday Powell will be testifying, when we also get the ISM Manufacturing PMI number, as well as the ISM Manufacturing New Orders Index, ISM Manufacturing Prices Paid & Employment Index numbers as well.
Wednesday brings the ADP Employment Change report, which will be interesting to see how seasonal jobs that may have been taken in year’s prior for the Christmas season fared due to Covid restrictions.
I’ll also be interested that day in the EIA Crude Oil Stocks Change, as well as the Fed’s Beige Book & Williams’s speech.
Thursday’s Initial Jobless Claims & 4-Week Average numbers will bring more clarity on the current employment situation, as well as shed light into how many jobs are still being lost as more & more companies are forced to reduce workforces due to virus restrictions; the ISM Services PMI will also be reported on Thursday.
Lastly, on Friday we will get to hear the Nonfarm Payrolls report, Trade Balance Numbers & Factory Orders M-o-M, all of which will help shed light into how the economy looks to be heading as we begin winter.
While markets tend to perform well in December, at/near all-time highs, any one bad report that doesn’t meet anticipated expectations may cause some of the jenga pieces to fall, providing a new entry point for market participants.
Lots of folks have been saying that they see it occurring in January 2021, but when markets are running this hot, any hiccups in data are prone to start a correction in prices.
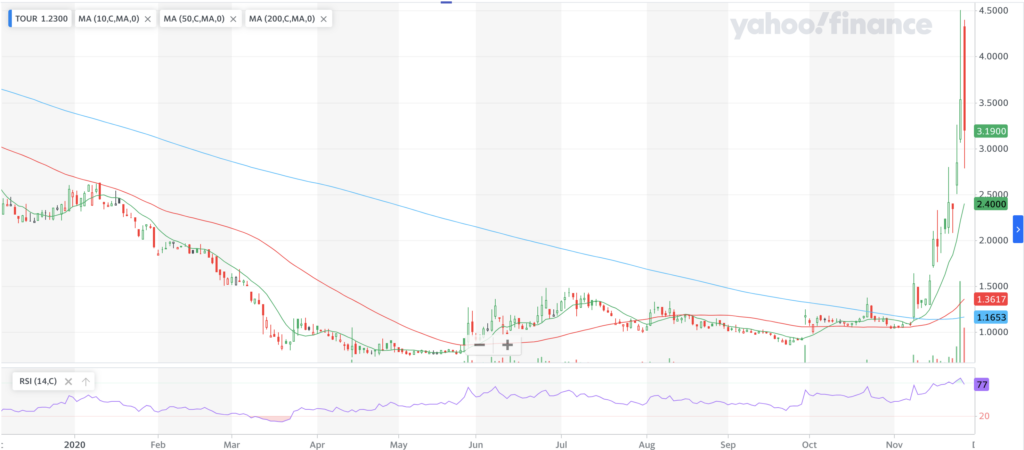
Tuniu Corporation stock has recently shown great technical growth & performance, trading under the ticker TOUR.
TOUR stock closed at $3.19/share on 11/27/20, preparing to close out November as a very strong month.
TOUR has options, in addition to common shares, making opportunities for all types of traders to profit from their stock performance.
TOUR Stock Price: $3.19
10 Day Moving-Average: $2.40
50 Day Moving-Average: $1.36
200 Day Moving-Average: $1.17
RSI: 77
While their RSI of 77 is still high, Tuniu corporation’s stock still looks to have legs to run, as it establishes a new range.
Traders of the common shares should be able to find advantageous entry points this week.
TOUR’s $2.50 calls are already in-the-money, with the $5 strike price being the next level.
Given that in the pre-market they are already beyond last week’s resistance level, the $5 calls aren’t as out of the question anymore, with a delta of .364.
From a puts perspective, I’d be favoring the $5 strike price, at the moment, unless they outperform that $5 mark, in which case the $7.50 puts will become cheaper.
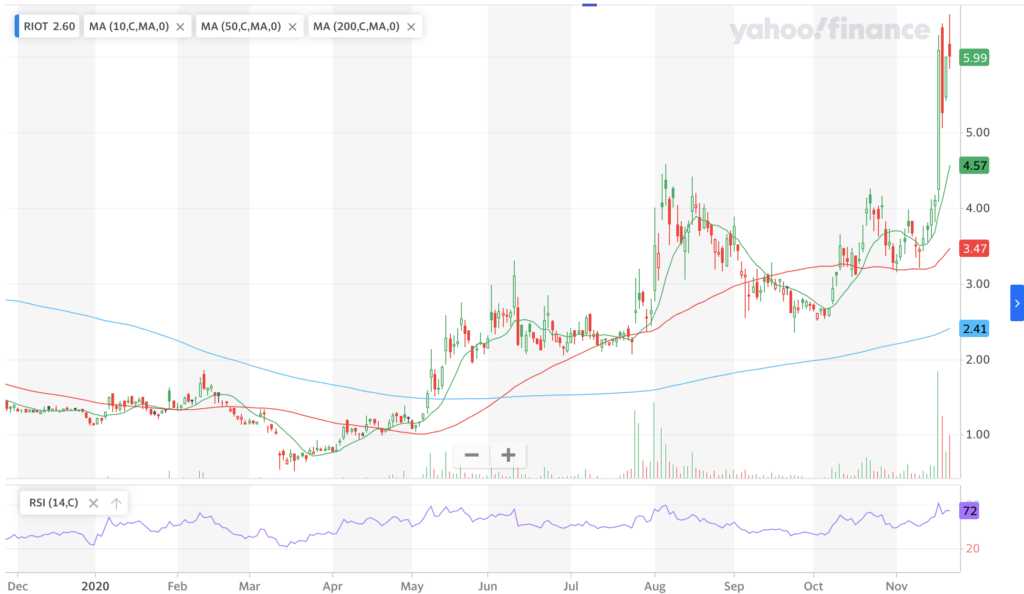
Riot Blockchain, Inc. stock trades under the ticker RIOT & closed for trading at $7.23 on 11/23/2020.
RIOT stock has recently been on a tremendous upswing, and looks to have more strength carrying it into the near future, making it worth consideration for a short-term trade.
RIOT Stock Price: $7.23
10 Day Moving-Average: $4.57
50 Day Moving-Average: $3.47
200 Day Moving-Average: $2.41
RSI: 72
With an RSI of 72, there is still room for RIOT to run in the next day or two, making a buying opportunity for common shares & call options alike.
I am favoring the $7 calls, and the $8 puts for RIOT stock options, as today’s pre-market pricing shows that there is still strength to be had, but within the next few days the puts will prove valuable as a hedge.
I’ll be watching the chart closely over the next week, but looking to purchase the options mentioned above this morning, favoring the calls.
As always, I encourage you to research RIOT stock before purchasing, but this does look to have some great potential in its current state.
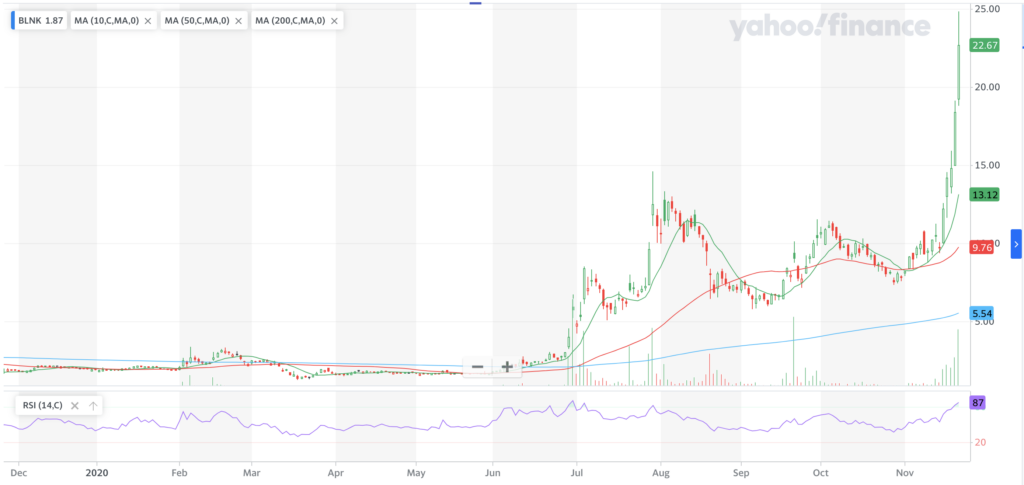
Blink Charging Co.’s stock trades under the ticker BLNK & has recently shown excellent technical strength, making it a prime candidate for a short to mid-term trade.
BLNK Stock closed at $22.67/share on 11/20/2020, after impeccable performance from 11/16/2020 onward.
BLNK Stock Price: $22.67
10 Day Moving-Average: $13.12
50 Day Moving-Average: $9.76
200 Day Moving-Average: $5.54
RSI: 87
While BLNK stock’s RSI is awfully high, there is still room for them to run, although there will likely be some form of a pullback before the common shares look to be priced at a good deal.
For anyone trading the common shares, I would be closely eyeing the charts if I dove in before seeing that RSI drop a bit more/prices correct and even out into a range.
For traders interested in BLNK options, the $22.50 or $25 calls are where I am looking, especially given their pre-market strength (+14% more as I write this).
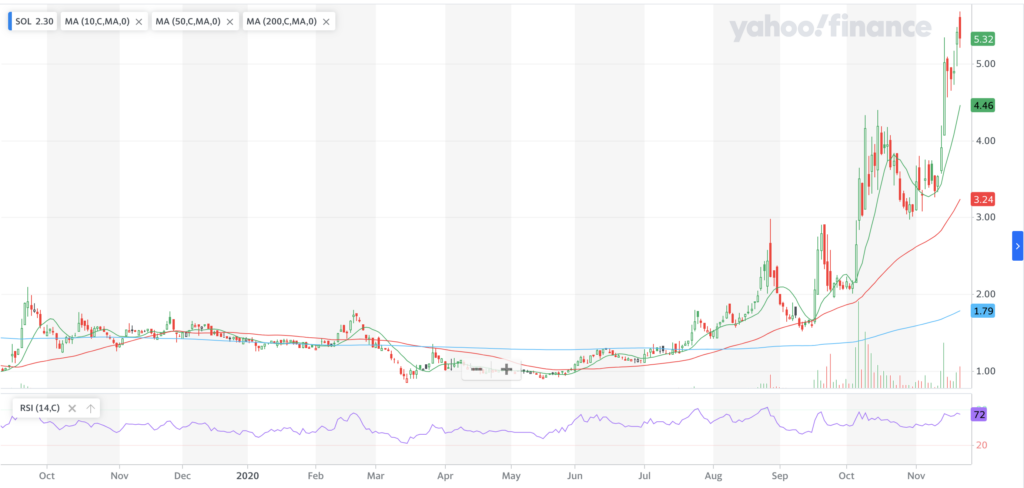
ReneSola stock trades under the ticker SOL, and closed at $5.32/share on 11/20/2020.
Since September they’ve been steadily climbing higher, with a particular noteworthy positive day on 11/13/2020.
SOL Stock Price: $5.32
10 Day Moving-Average: $4.46
50 Day Moving-Average: $3.24
200 Day Moving-Average: $1.79
RSI: 72
SOL stock’s moving averages still indicate there this is more room for their share price to run.
From an options perspective, the $5 strike price for the puts & calls seems like the safest idea, as the $2.50 & $7.50 options are awfully far from the current price of the underlying contract.
Purchasing the $5 call while it continues to climb, and then perhaps buying a $5 put, or selling a $7.50 call for the following month may be worth considering, pending your own due-diligence & following how their chart looks moving into 2021.
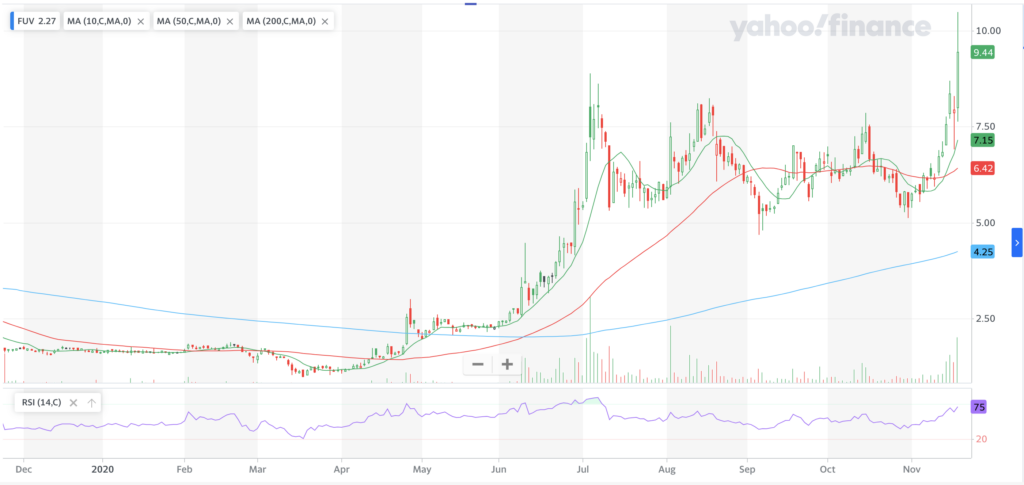
Arcimoto Inc. stock trades under the ticker FUV & closed for trading at $16 on 11/19/2020.
This morning in the pre-market it has shed 10% of its price, dropping to $14.35, opening up for a potential short-term trade opportunity.
While this mornings drop is likely the result of a blend of trimming after a 69%+ gain day & macro-market conditions pointing lower, FUV stock has displayed steady growth since May 2020.
FUV Stock Price: $16.00
10 Day Moving-Average: $7.15
50 Day Moving-Average: $6.42
200 Day Moving-Average: $4.25
RSI: 75
For traders interested in the common shares, today may not be the best pullback to buy into, but looking at the charts should help you determine the right amount of risk there.
From an options perspective, the 12/18 $15 calls may carry more risk than is worth taking, so I may think to look at the $12.50’s or the $10’s.
The puts on the other hand look much cheaper than the calls, with the at-the-money $15’s marked only at $3.95 (before the market opens, this should change upon the open), which may offer an opportunity for a few extra percentage points for a quick trade on today’s weakness.
All-in-all, FUV stock & options should look to give traders some great opportunity for a short-term trade.
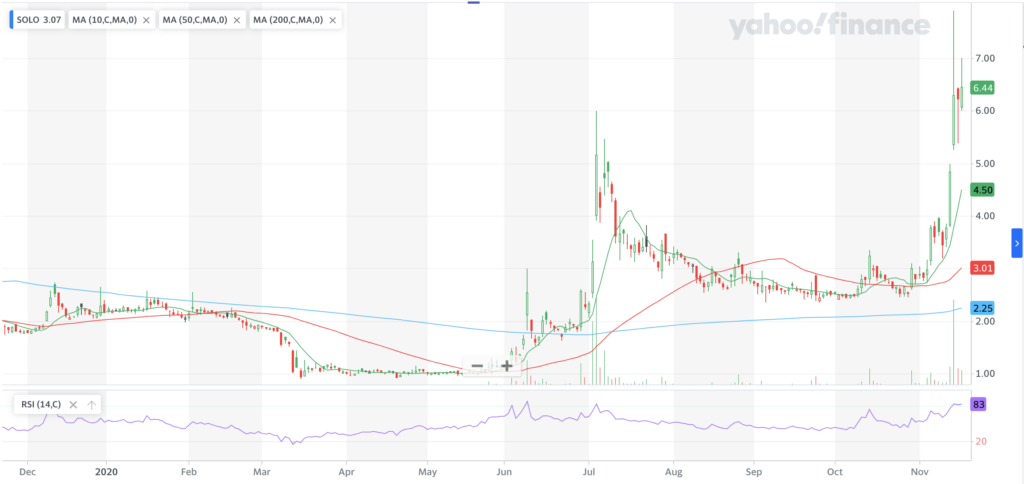
Electrameccanica Vehicles Corp. stock trades under the ticker SOLO, and closed yesterday at $6.91/share (11/18/2020).
This morning it has continued to climb in pre-market trading, currently at $7.63.
Given its recent technical strength, there are some good short-term trade opportunities for SOLO stock.
SOLO Stock Price: $6.91
10 Day Moving-Average: $4.50
50 Day Moving-Average: $3.01
200 Day Moving-Average: $2.25
RSI: 83
While it may climb a little higher & test the $7 range, SOLO’s RSI is currently showing over-bought conditions at 83.
With this in mind, I would be interested in tracking both the calls & puts that focus around wherever their new range may emerge, based on whether or not they can cross the $7 mark cleanly today/tomorrow.
SOLO’s calls can either have a $6 or a $7.50 strike price, if I were looking at the ones with tomorrow’s expiration I would favor the $6 strike price, while for the next expiration date the $7.50’s show signs of being able to be in the money, given their early morning performance today.
One thing to keep in mind about the $7.50 call expiring on 12/18/2020 is that their Theta is currently -0.025.
Looking at the puts, The $7.50 or the $9 are likely the best option for SOLO for tomorrow’s expiration, but I may instead set my sights on the 12/18/2020 expiration, given that their current strength does not indicate that a put for tomorrow will play out favorably.
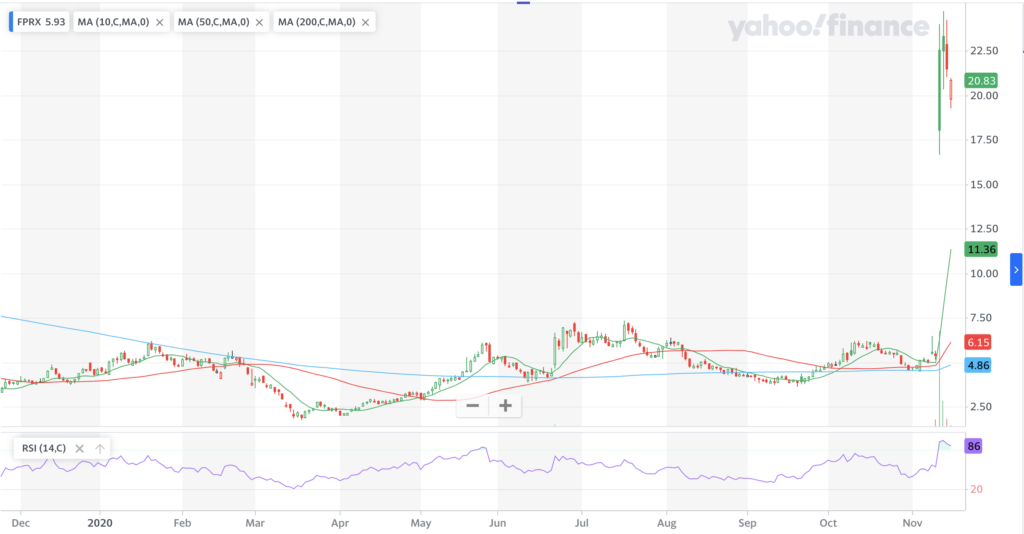
Five Prime Therapeutics, Inc. stock trades under the ticker FPRX & has recently shown great technical strength, closing for trading on 11/17/2020 at $20.20/share.
FPRX stock has quadrupled since 11/10/2020, which is indicated through its RSI, which is sending overbought signals.
While we can expect to see it decline a bit based on the RSI & the fact that its only hollow candlestick since it’s take-off day is red (down, but finished above where it opened), cautious entry from a common share position, and a position favoring puts for options is likely the best course of action.
FPRX Stock Price: $20.20
10 Day Moving-Average: $11.36
50 Day Moving-Average: $6.15
200 Day Moving-Average: $4.86
RSI: 86
From a calls perspective, I would be focused on the $20 or $17.50 strike prices, while focusing on the $20 or $22.50 strike prices on the puts.
This way your trade is protected from the overall market’s behavior, as something with an RSI this high may prove to be quite temperamental in the event of a major market drop.
Five Prime Therapeautics, Inc. stock is worth a closer look from a short-term perspective, whether via options or their common FPRX shares.
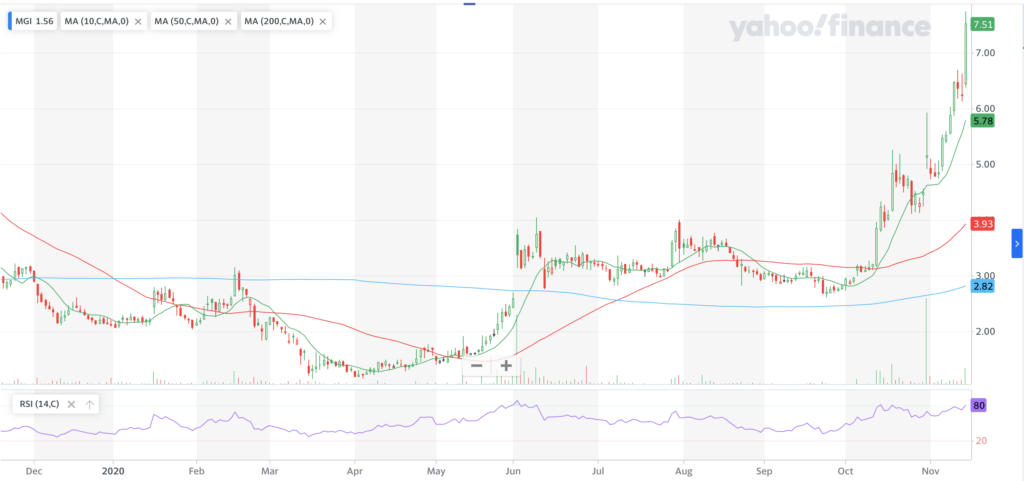
Moneygram International, Inc. stock trades under the ticker MGI & closed for trading at $8.10 on 11/16/2020.
MGI stock has recently displayed amazing technical strength, nearly doubling in price since 10/13/2020.
Moneygram has options, which are currently at-the-money when looking at the $8 strike prices.
Given the 0.56 delta of the $8 calls, I would look there and or at the $7 calls for the upside, with the same levels being targeted for the puts covering the downside, but favoring the higher strike price for the puts.
MGI Stock Price: $8.10
10 Day Moving-Average: $5.78
50 Day Moving-Average: $3.93
200 Day Moving-Average: $2.82
RSI: 80
MGI stock has great potential for a short-term trade, and is worth a second look by traders.
I’ll be looking at them today, as their pre-market price is down 2.5% to $7.90, making those strike prices even more attractive, but perhaps buying the calls & puts for different expiration dates.
Robinhood traders have become an interesting group of market participants, often making headlines as a collective after the COVID lockdowns.
This weekend I took a look at the names that made up their 100 Most Popular Stocks & ETFs list to get an idea of the types of names that they’re trading.
While the name infers that there will be 100 securities, there are only 98, as my Fidelity data screener does not cover two of the names, which was odd as usually it goes the other way around.
Breaking Down What Securities Robinhood Traders Prefer To Own
Most of the companies that you see listed in the Top 100 list are household names. UBER, F, JPM & KO are all on the list, along with some lesser known names such as WKHS, NIO & NKLA.
8 Sectors & 34 Industries are included in this list, along with ETFs.
Only 29% of all securities held offer a dividend yield, and using our Technical Rating Formula, 56 securities are above average for their technical performance rating, with 42 securities falling below the average technical rating.
ETFs are included in the list as well, but are being counted as their own unique sector & industry as there is diversity within each ETF on the list, which will be published in order of technical performance later in the article.
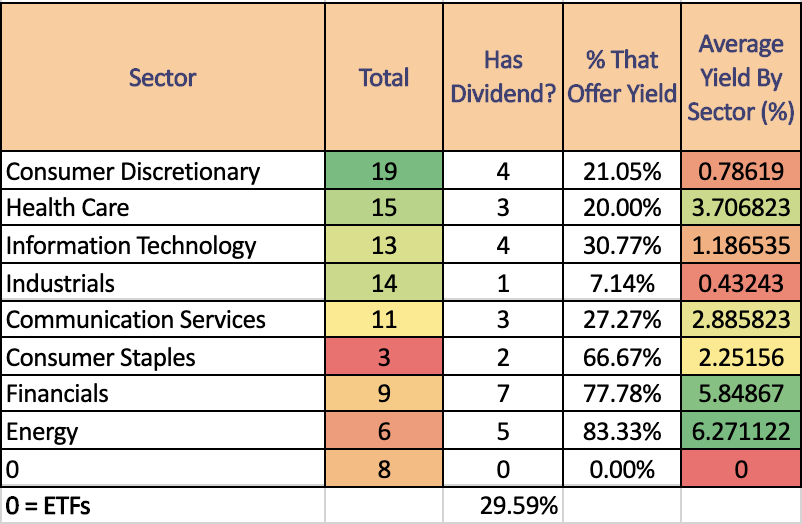
Examining The Robinhood Top 100 Owned Securities List By Sector
By sector, the names favor Consumer Discretionary stocks, such as PTON, TSLA & DKNG, with less emphasis going to Consumer Staples stocks, such as BYND, KO & WMT.
Healthcare (APHA, PFE & SRNE) & Information Technology (MSFT, WORK & ZM) are the second & third most popular sectors, while Energy (HAL, KOS & XOM) & Financials (WFC, IVR & BRK/B) are the second & third least owned sectors (not including ETFs, 0 in the chart above).
This makes sense, given that most retail investors are looking for products & names that they either use, or have an interest in, and or that they hear about often in the news (especially when the headlines are beneficial).
As to be expected, Energy sector stocks have the highest average Dividend Yield, followed by Financials & then Healthcare, with ETFs not offering a dividend, and the bottom three yielding sectors being Industrials, Consumer Discretionary & Information Technology.
From a Technical Rating standpoint, Consumer Discretionary has the highest average (which may be impacted by largest sample size), followed by Industrials & Information Technology.
The worst performing sectors from a technical perspective were Energy, Financials & Consumer Staples, with ETFs having the second worst performance.
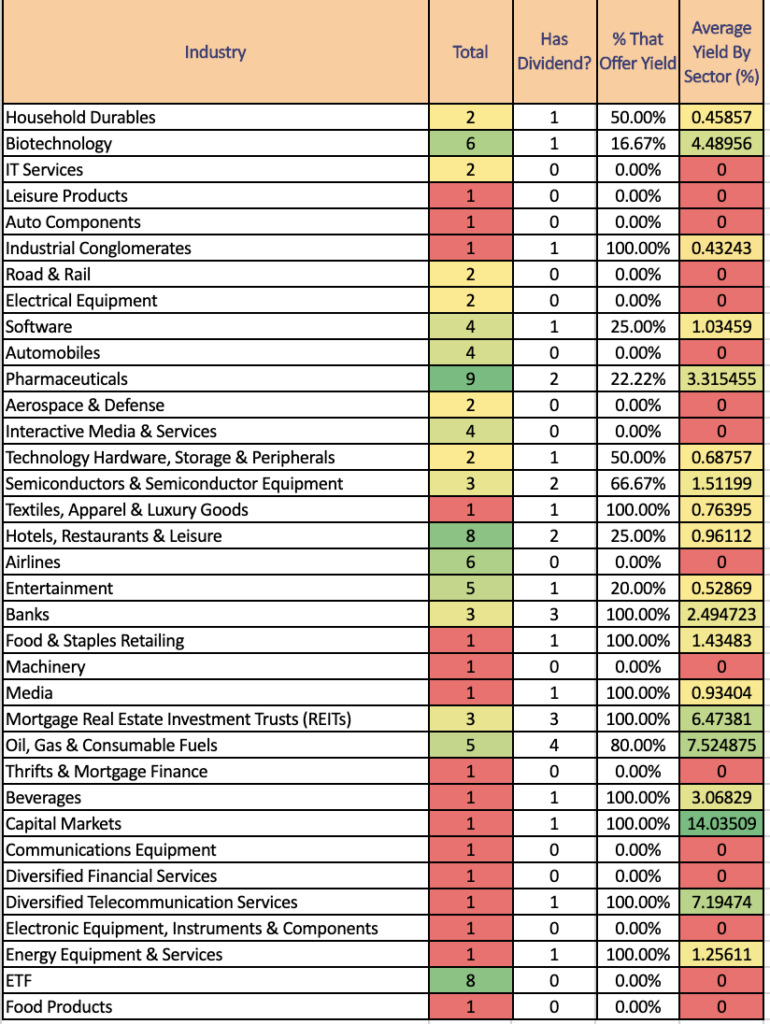
Breaking Down The Top 100 Robinhood Stocks By Industry
A really interesting point when we get down into the Industries that these securities are in, is that Pharmaceuticals is the top owned Industry (somewhat expected), trailed by Hotels, Restaurants & Leisure, ETFs & Biotechnology & Airlines.
This somewhat surprised me, as more countries are announcing more COVID measures, so I’m guessing that that trend will be shifting in the not-to-distant future.
The highest yielding industry is Capital Markets, followed by Oil, Gas & Consumable Fuels, & Diversified Telecommunication Services.
From a Technical Rating perspective, Electrical Equipment is the highest rated Industry, followed by Automobiles & Auto Components, while the worst faring Industries are Machinery, Food Products, ETFs & Entertainment.
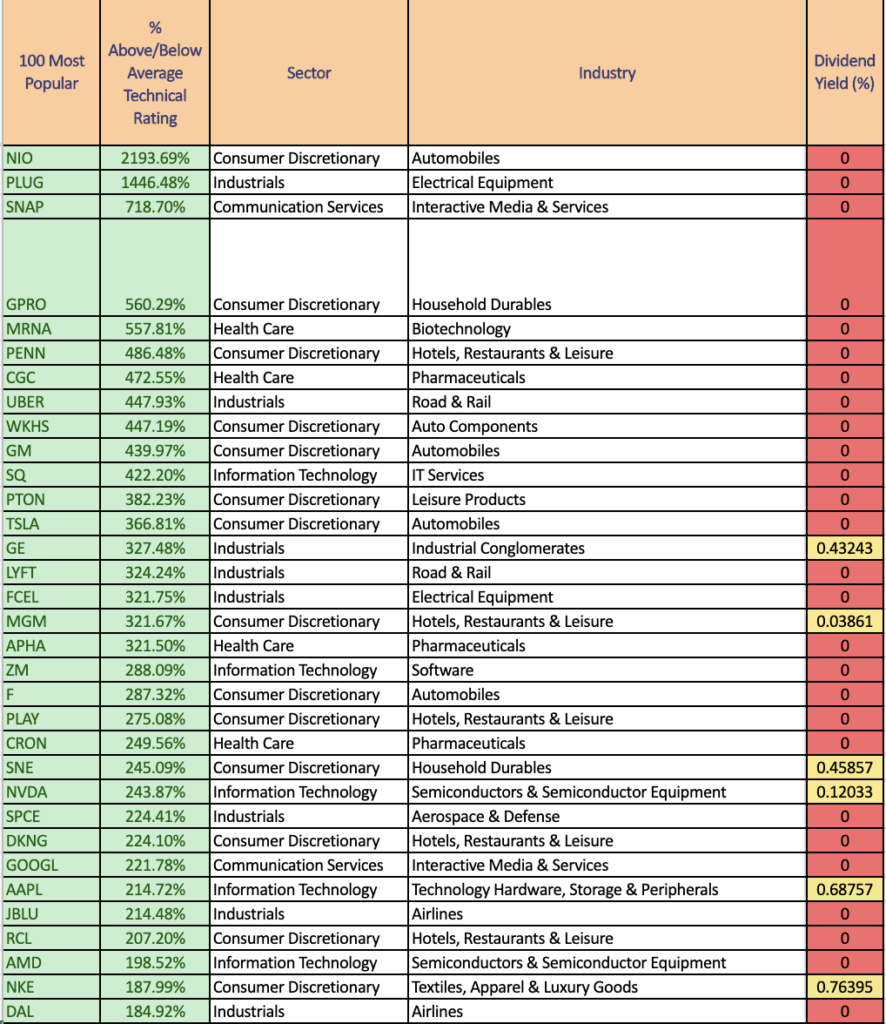
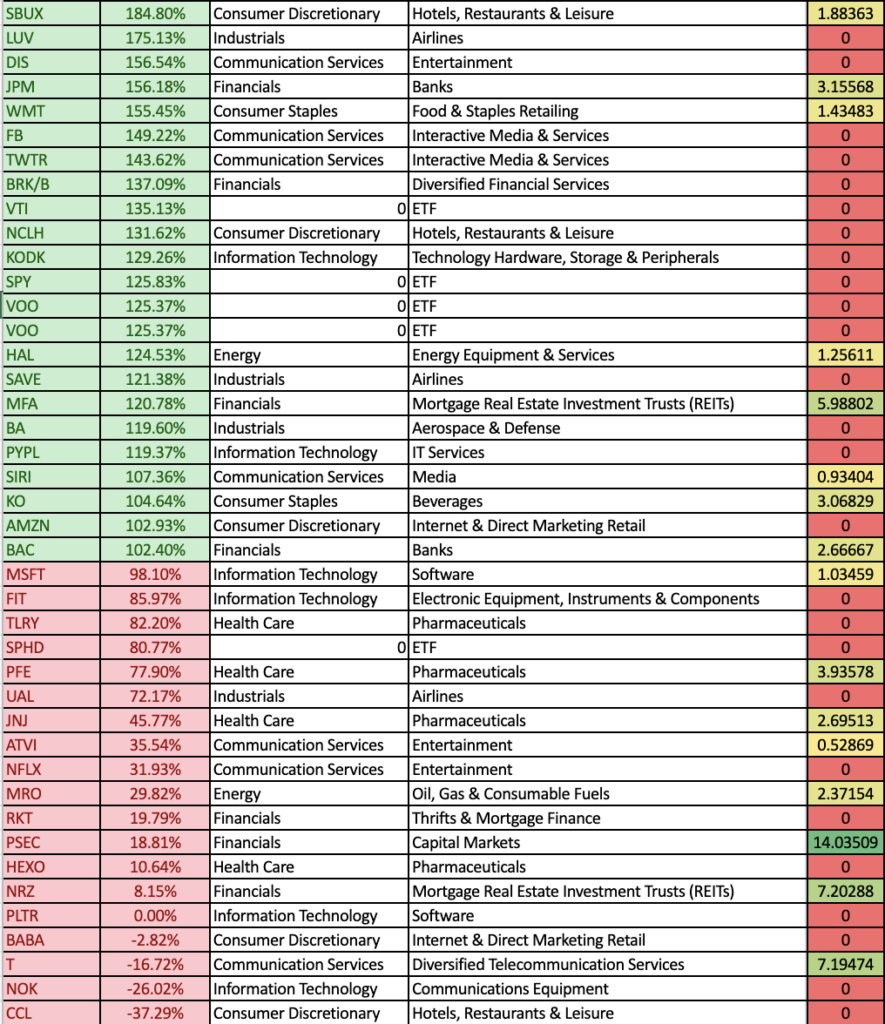
Who Are The Best Technical Performers Of The Robinhood Top 100 List?
Now, onto what everyone was waiting for, the good stuff.
I have ranked the stocks that were in the Robinhood Top 100 Most Owned list below (barring the two that Fidelity did not have data for, so 98 total names), along with how far above or below average their Technical Rating was (not going to give away all the good stuff 😉 ).
The Top 10 of the list are NIO, PLUG, SNAP, GPRO, MRNA, PENN, CGC, UBER, WKHS & GM.
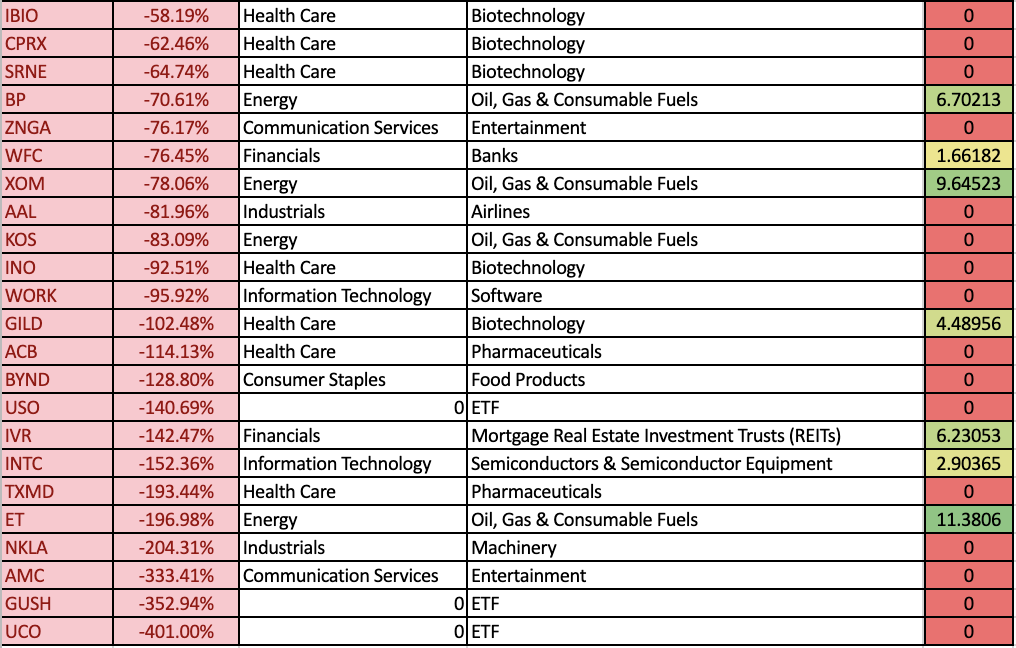
The Bottom 10 by technical performance are UCO, GUSH, AMC, NKLA, ET, TXMD, INTC, IVR, USO & BYND.
What’s most interesting about this list, is it breaks down how many people outside of the markets look at different companies, sectors & industries, as stock indexes are at all-time highs & the world still has growing concerns regarding COVID-19, the US Election results & more.
It will be interesting seeing how this list shifts in the coming weeks to months.