Blackstone Group Inc. stock trades under the ticker BX & has shown recent bullishness that traders & investors should research further.
BX stock closed at $122.85/share on 3/18/2022.
Blackstone Group Inc. BX Stock’s Technicals Broken Down
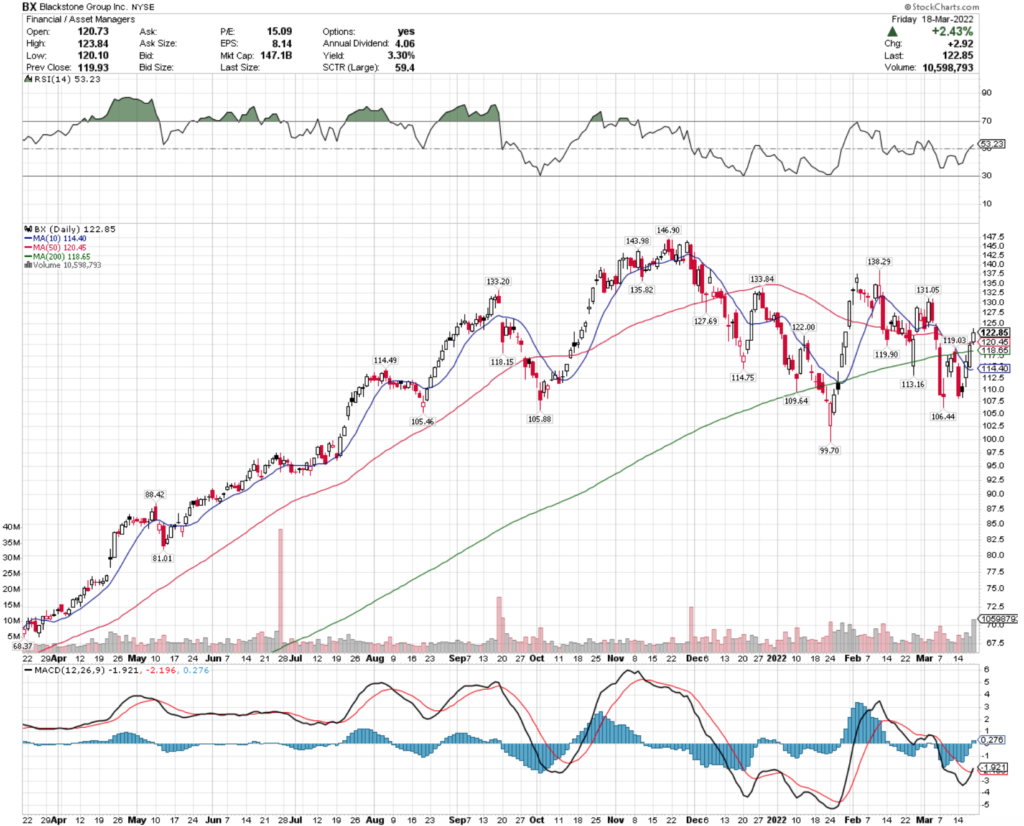
BX Stock Price: $122.85
10 Day Moving Average: $114.40
50 Day Moving Average: $120.45
200 Day Moving Average: $118.65
RSI: 53.23
MACD: -1.921
On Friday, BX stock completed a bullish MACD crossover, while breaking out above their 50 Day Moving Average.
With a neutral RSI & less than 2% between their 10 & 50 day moving averages, there looks to be more upwards momentum in the near-term for BX.
Their next resistance levels will be $123.84 & $124.99/share.
Blackstone Group Inc. BX Stock As A Long-Term Investment
Long-term oriented investors will find BX stock’s P/E (ttm) of 14.27 to be appealing, but may find their P/B (mrq) of 8.63 to be a bit rich.
Their most recent reporting showed 51.7% Quarterly Revenue Growth Y-o-Y, with 86.7% Quarterly Earnings Growth Y-o-Y.
BX stock’s balance sheet may require a closer examination, with Total Cash (mrq) of $2.27B & Total Debt (mrq) of $8.86B.
They offer a 3.39% dividend yield, which looks safe in the long-run given their 43.19% payout ratio.
~64% of BX stock’s outstanding share float is held by institutional investors.
Blackstone Group Inc. BX Stock As A Short-Term Trade Using Options
Short-term oriented traders can use options to profit from BX stock’s price movements in any direction.
I am looking at the contracts with the 4/14 expiration date.
The $123 & $124 calls look appealing, but are not particularly liquid; however this may change as Friday was March’s expiration date.
The $125 & $126 puts also look appealing, but have similar limited levels of open interest.
Tying It All Together
All-in-all, investors & traders will find lots of things to like about BX stock.
Investors will find their dividend appealing, as well as their P/E; however they may want to look deeper into their balance sheet before investing.
Traders will like their current momentum path, but may be disappointed by their options’ open interest levels.
BX stock is worth taking a closer look at, regardless of your trading style.
*** I DO NOT OWN SHARES OF BX STOCK ***