General Dynamics Corp GD Stock Analysis

General Dynamics Corp stock trades under the ticker GD & has shown recent bullish behavior that traders & investors should research further.

GD stock closed at $224.91/share on 5/31/2022.

General Dynamics Corp GD Stock’s Technical Performance Broken Down
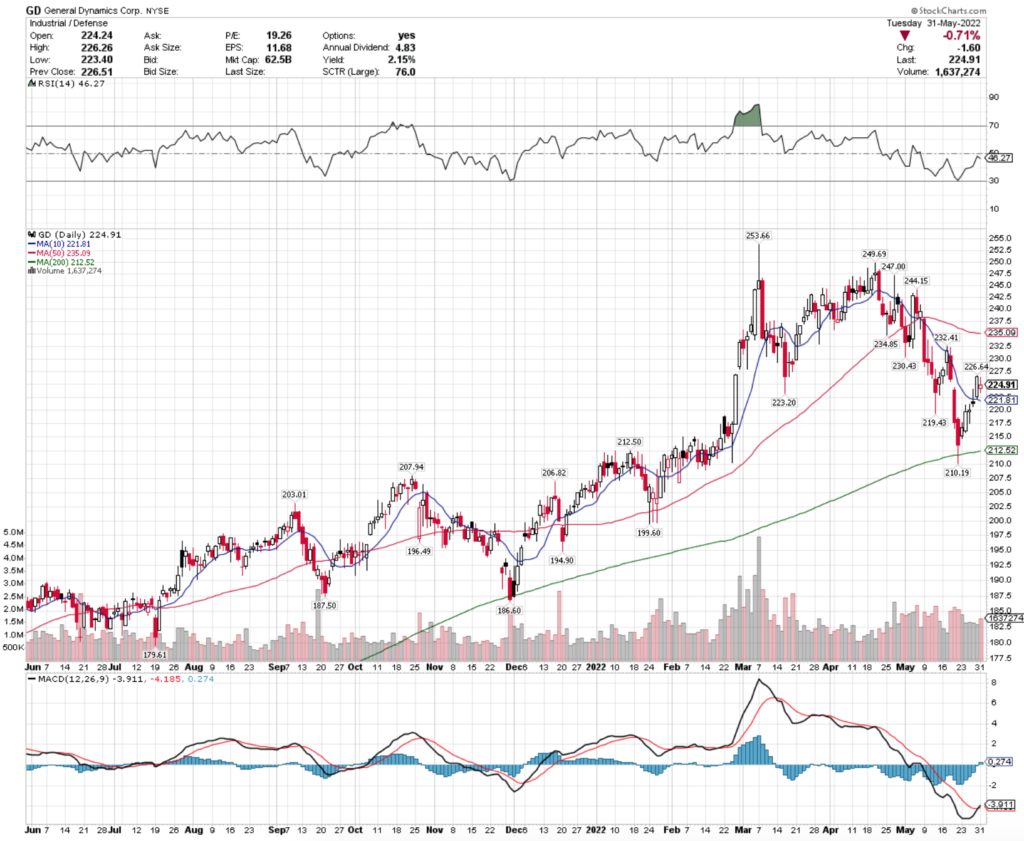
General Dynamics Corp GD Stock's Technical Performance Over The Last Year

GD Stock Price: $224.91

10 Day Moving Average: $221.81

50 Day Moving Average: $235.09

200 Day Moving Average: $212.52

RSI: 46.3

MACD: -3.911

Yesterday, GD stock completed a bullish MACD crossover, and has recently been trading on above average volume compared to the previous year.

Their RSI is still on the lower end of neutral, signaling that there may be additional momentum to come in the near-term.

They will need to break above the $226.64 & $230.43 resistance levels as they continue to climb higher.

General Dynamics Corp GD Stock As A Long-Term Investment

Long-term oriented investors will like GD stock’s 19.35 P/E (ttm), but may find that their 3.48 P/B (mrq) is a bit rich.

They recently reported 3.1% Quarterly Earnings Growth Y-o-Y.

Their balance sheet will require a further analysis, with a reported $2.91B in Total Cash (mrq) & $13.17B in Total Debt (mrq).

GD stock pays a 2.13% dividend yield, which appears stable in the long-term as their payout ratio is 51.54%.

86.54% of GD stock’s outstanding share float is owned by institutional investors.

General Dynamics Corp GD Stock As A Short-Term Trade Using Options

Short-term oriented traders can use options to profit from price movements in GD stock, while protecting themselves from broader market volatility.

I am looking at the contracts with the 6/17 expiration date.

The $217.50, $220 & $222.50 call options look appealing, but are all extremely illiquid.

The $230, $227.50 & $225 puts also look interesting, but suffer from the same low levels of open interest.

Tying It All Together

GD stock is worth taking a closer look at by long & short-term traders alike.

Long-term investors will like their valuation metrics & dividend yield.

Short-term focused traders will like their current momentum, but will be disappointed by their low levels of open interest.

Overall, it is worth seeing how GD stock can fit into your portfolio strategy.

*** I DO NOT OWN SHARES OF GD STOCK AT THE TIME OF PUBLISHING THIS ARTICLE ***
Unilever PLC UL Stock Analysis

Unilever PLC stock trades under the ticker UL & has shown recent bullishness that traders & investors should take a closer look into.

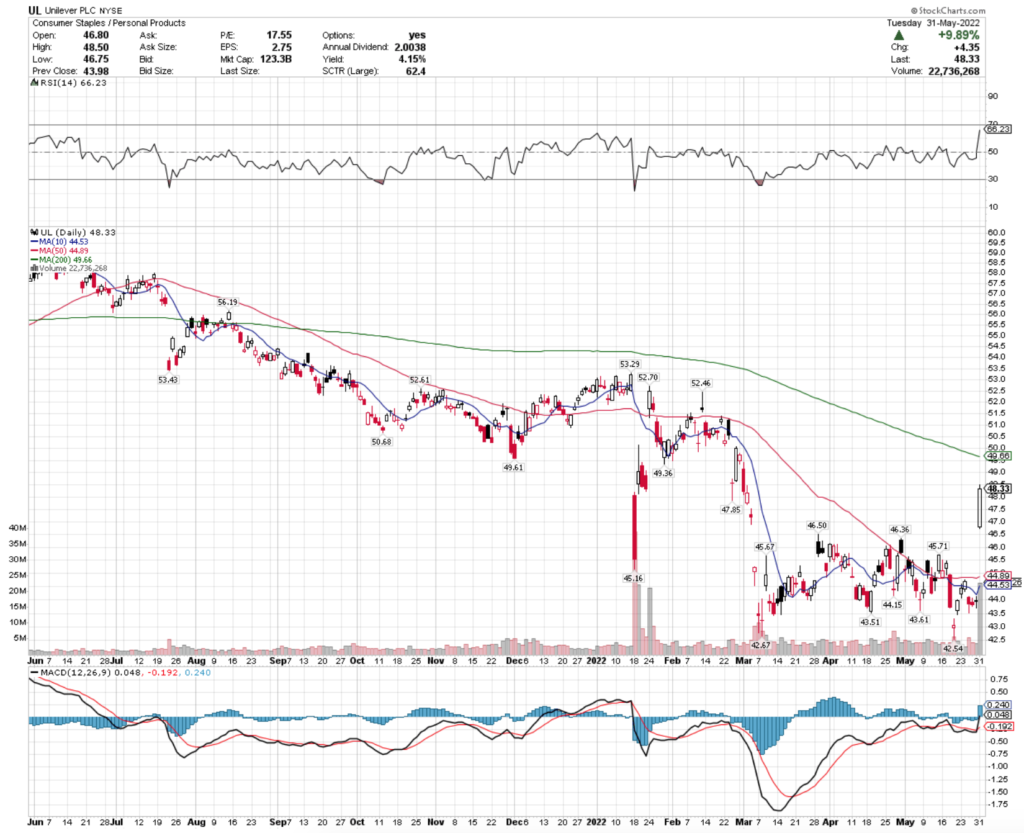
UL stock closed at $48.33/share on 5/31/2022.

Unilever PLC UL Stock’s Technical Performance Broken Down

Unilever PLC UL Stock's Technical Performance Over The Last Year

UL Stock Price: $48.33

10 Day Moving Average: $44.53

50 Day Moving Average: $44.89

200 Day Moving Average: $49.66

RSI: 66.23

MACD: -0.192

UL stock recently completed a bullish MACD crossover, and has been trading on above average volume in the last few months, compared to the year prior.

Yesterday’s 9.89% gap up brought their RSI to be much closer to overbought than it was the day before, and their 10 day moving average is <1% from their 50 day MA, signaling more bullish momentum to come in the near-term as they establish a new price range.

They will have to break above the $49.36 & $50.50/share resistance levels as it continues to climb higher.

Unilever PLC UL Stock As A Long-Term Investment

Long-term oriented investors will like UL stock’s P/E (ttm) of 18.25, but may find their P/B (mrq) of 6.33 to be a bit rich.

They recently reported 6.6% Quarterly Revenue Growth Y-o-Y, with 27.5% Quarterly Earnings Growth Y-o-Y.

Their balance sheet is worth taking a closer look into before making an investment, with $4.86B of Total Cash (mrq) & $30.13B in Total Debt (mrq).

UL stock pays a 3.95% dividend yield, which may become unstable over time, as their payout ratio is 73.44%.

9.55% of UL stock’s outstanding share float is owned by institutional investors.

Unilever PLC UL Stock As A Short-Term Trade Using Options

Short-term oriented traders can trade options to profit from UL stock’s price movements, while providing protection against losses.

I am looking at the contracts with the 6/17 expiration date.

The $47.50, $45 & $42.50 call options all look appealing, although the $42.50 strike is relatively illiquid compared to the other two.

The $55, $52.50 & $50 puts also look interesting, but are extremely illiquid with <300 contracts of open interest between the 3 strike prices.

Tying It All Together

UL stock has many interesting characteristics that traders & investors should find appealing.

Investors will like their dividend yield, although they may want to look closer into their balance sheet structure to see how their payout ratio may be impacted in the mid-to-long term.

Short-term traders will like UL stock’s current momentum, but will be disappointed by some of the open interest levels of some of their strike prices.

All-in-all, UL stock is worth taking a closer look into, to see how it fits into your portfolio strategy.

*** I DO NOT OWN SHARES OF UL STOCK AT THE TIME OF PUBLISHING THIS ARTICLE ***
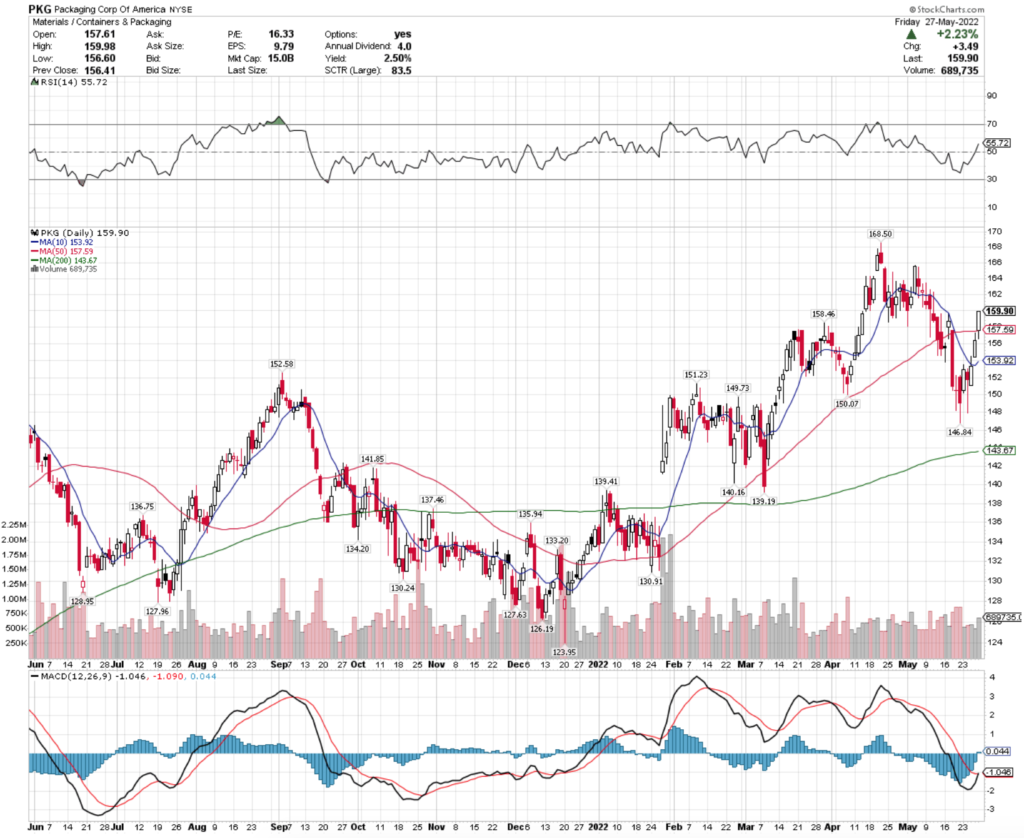
Packaging Corp of America PKG Stock

Packaging Corp of America stock trades under the ticker PKG & has recently shown bullish behavior in a time of market volatility.

PKG stock closed at $159.90/share on 5/27/2022.

Packaging Corp of America PKG Stock’s Technical Performance Broken Down

Packaging Corp Of America PKG Stock's Technical Performance Over The Past Year

PKG Stock Price: $159.90

10 Day Moving Average: $153.92

50 Day Moving Average: $157.59

200 Day Moving Average: $143.67

RSI: 55.72

MACD: -1.046

On Friday, PKG stock completed a bullish MACD crossover, while breaking out above its 50 day moving average.

While their recent trading volumes have been about average compared to the year prior, there is only 2.4% between their 10 & 50 day moving averages, and their RSI is still neutral, signaling that there may be more near-term bullish momentum.

They will need to test the $165.72/share resistance level, before testing the $168.50/share level.

Packaging Corp of America PKG Stock As A Long-Term Investment

Long-term oriented investors will like PKG stock’s P/E (ttm) of 15.24, but may find their P/B (mrq) of 3.7 to be a bit too rich.

They recently reported 18.2% Quarterly Revenue Growth Y-o-Y, with 52.7% Quarterly Earnings Growth Y-o-Y.

Their balance sheet may require a closer review, with a reported $709.9M of Total Cash (mrq), along with $2.76B of Total Debt (mrq).

PKG stock pays a 2.56% dividend yield, which appears stable in the long-run, as their payout ratio is 40.9%.

95.49% of PKG stock’s outstanding share float is owned by institutional investors.

Packaging Corp of America PKG Stock As A Short-Term Trade Using Options

Short-term oriented traders can use options to capitalize on PKG stock’s price movements, while also hedging against broader market volatility.

I am looking at the contracts with the 6/17 expiration date.

The $145, $150 & $155 call options are all in-the-money, but are very illiquid with only 238 contracts between the three strike prices.

The $175, $170 & $165 put options are also all in-the-money, but have severely illiquid open interest levels (3 contracts)

Tying It All Together

PKG stock has a lot of characteristics that make it an interesting potential addition to your portfolio strategy.

Investors will like their valuation metrics & dividend yield, but may want to do more digging into their balance sheet before buying.

Traders will like their current momentum in this environment, but will likely be disappointed by the liquidity of their options contracts.

All-in-all, it is worth taking a closer look at PKG stock to see how it can fit into your portfolio’s strategy.

*** I DO NOT OWN SHARES OF PKG STOCK AT THE TIME OF PUBLISHING THIS ARTICLE ***
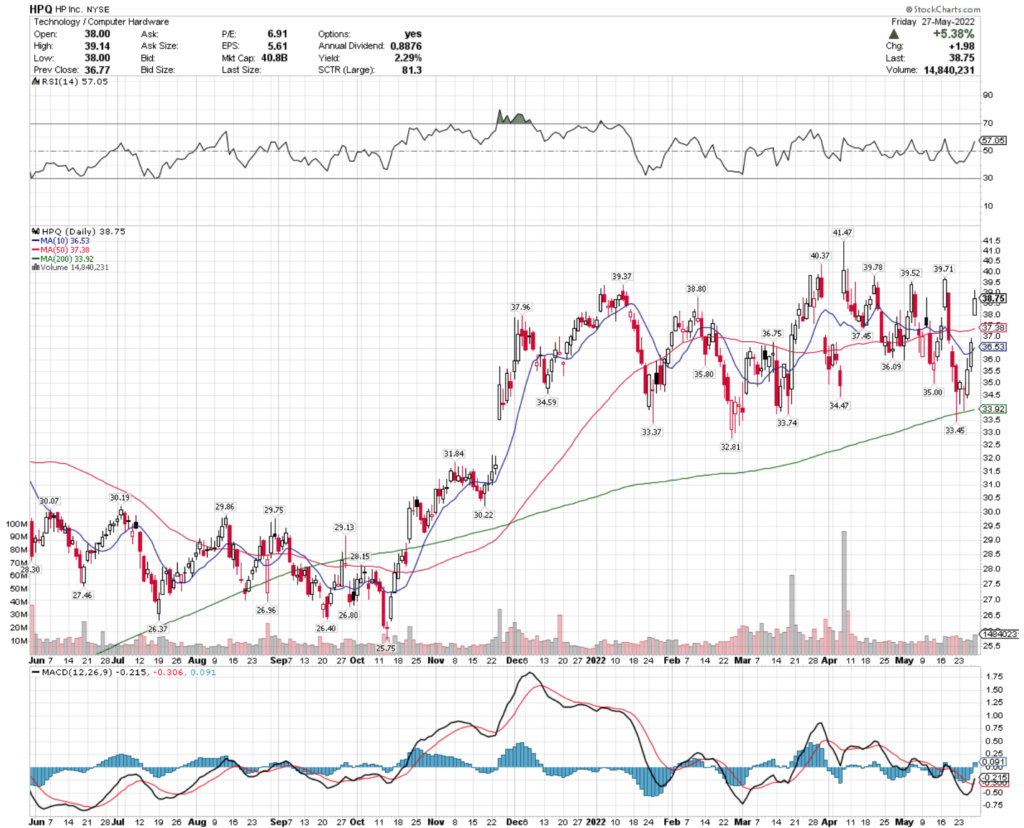
HP Inc. HPQ Stock Analysis

HP Inc. stock trades under the ticker HPQ & has recently shown bullishness that traders & investors should research further.

HPQ stock closed at $38.75/share on 5/27/2022.

HP Inc. HPQ Stock’s Technical Performance Broken Down

HP Inc. HPQ Stock's Technical Performance Over The Last Year

HPQ Stock Price: $38.75

10 Day Moving Average: $36.53

50 Day Moving Average: $37.38

200 Day Moving Average: $33.92

RSI:57.1

MACD: -0.215

HPQ completed a bullish MACD crossover on Friday, while gapping up 5.38% & breaking out above its 50 day moving average.

Recent trading volumes have been slightly above average compared with the year prior, and their RSI is still in the mid-high neutral range.

With only 2.3% between HPQ stock’s 10 & 50 day moving averages, there looks to be more bullish momentum to come in the near-term.

They will need to test & break above the $39.84 resistance level, before going on to test $41.47/share.

HP Inc. HPQ Stock As A Long-Term Investment

Long-term oriented investors will like HPQ stock’s 6.71 P/E (ttm).

They recently reported 8.8% Quarterly Revenue Growth Y-o-Y, with 1.7% Quarterly Earnings Growth Y-o-Y.

Their balance sheet is worth taking a closer review of before investment though, as they have a reported $3.4B in Total Cash (mrq) & $8.35B in Total Debt (mrq).

HPQ stock pays a 2.26% dividend yield, which appears sustainable in the long-term as their payout ratio is 15.14%.

88.9% of HPQ stock’s outstanding share float is owned by institutional investors.

HP Inc. HPQ Stock As A Short-Term Trade Using Options

Short-term oriented traders can use options to profit from HPQ stock’s price movements, while protecting themselves from broader market volatility.

I am looking at the contracts with the 6/17 expiration date.

The $37, $37.50 & $38 calls are all in-the-money & have sufficient levels of open interest.

The $41, $40 & $39 put options are also in-the-money, with the former being the less liquid of the three (261 contracts vs. 16,392 contracts for the other two strikes).

Tying It All Together

HPQ stock offers many unique characteristics that may make it a good addition to your porfolio.

Investors will like their valuation metrics & dividend yield, however they may want to research their balance sheet further before making an investment.

Traders will like their current momentum, as well as the liquidity of their options, and weekly expirations.

Overall, HPQ stock is worth taking a closer look at, to see how it fits into your portfolio strategy.

*** I DO NOT OWN SHARES OF HPQ STOCK AT THE TIME OF PUBLISHING THIS ARTICLE ***
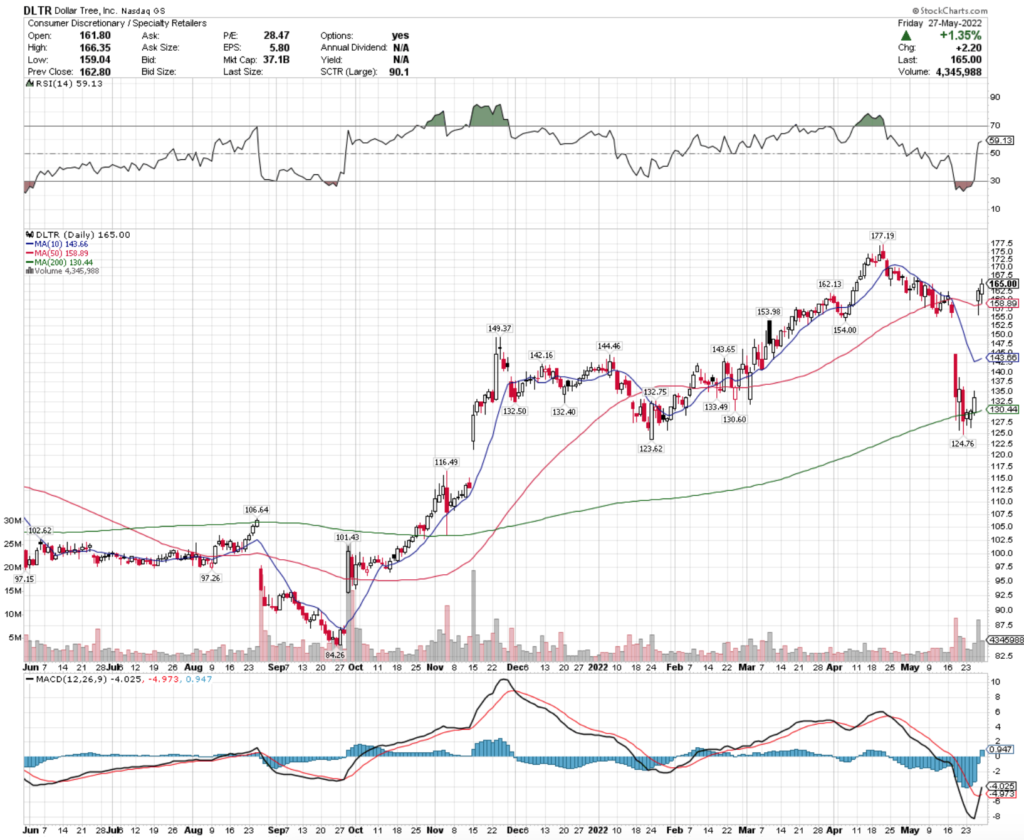
Dollar Tree Inc. DLTR Stock Analysis

Dollar Tree Inc. stock trades under the ticker DLTR & has recently shown bullishness that traders & investors should take a closer look into.

DLTR stock closed at $165/share on 5/27/2022.

Dollar Tree Inc. DLTR Stock’s Technical Performance Broken Down

Dollar Tree, Inc. DLTR Stock's Technical Performance Over The Last Year

DLTR Stock Price: $165

10 Day Moving Average: $143.66

50 Day Moving Average: $158.89

200 Day Moving Average: $130.44

RSI: 59.13

MACD: -4.025

On Friday, DLTR stock completed a bullish MACD crossover, the day following a gap up that broke them out above their 10 & 50 day moving averages.

Their recent trading volumes have been above average, and their RSI is still mid-high neutral, signaling that there may be more near-term momentum for DLTR stock.

They will need to break above the $172.70 resistance level, before testing the $177.19/share level.

Dollar Tree Inc. DLTR Stock As A Long-Term Investment

Long-term oriented investors will like DLTR stock’s 23.07 P/E (ttm), although their 3.9 P/B (mrq) may be viewed unfavorably by some.

They recently reported 6.5% Quarterly Revenue Growth Y-o-Y, along with 43.2% Quarterly Earnings Growth Y-o-Y.

Their balance sheet will require further examination before investing though, with reported $1.22B Total Cash (mrq) & $9.91B Total Debt (mrq).

Despite not paying a dividend, DLTR stock is still has 96.7% of its outstanding share float owned by institutional investors.

Dollar Tree Inc. DLTR Stock As A Short-Term Trade Using Options

Short-term focused traders can use options to profit from DLTR stock’s price movements in any direction.

I am looking at the contracts with the 6/17 expiration.

The $145, $155 & $160 call options are all in-the-money & have sufficient levels of open interest.

The $180, $175 & $170 puts also are in-the-money, but are very illiquid, signaling that the market has near-term bullish sentiment for DLTR stock.

Tying It All Together

DLTR stock has many interesting characteristics that traders & investors will want to research further.

Investors will like their valuation metrics, but will be disappointed by their lack of a dividend yield & may want to look closer into their balance sheet.

Traders will like their current momentum, weekly option expiration dates & how liquid their contracts are.

Overall, DLTR stock is worth taking a closer look into to see how it fits into your portfolio strategy.

*** I DO NOT OWN SHARES OF DLTR STOCK AT THE TIME OF PUBLISHING THIS ARTICLE ***
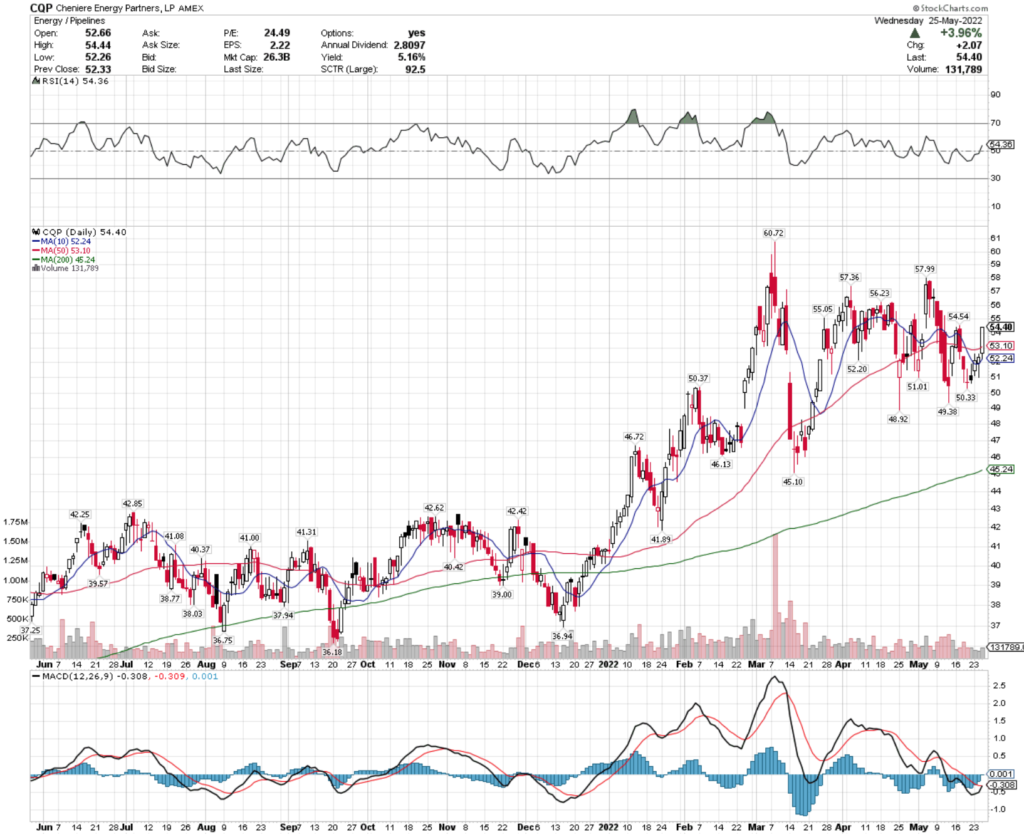
Cheniere Energy Partners L.P. CQP Stock

Cheniere Energy Partners L.P. stock trades under the ticker CQP & has shown recent bullishness that traders & investors should take a closer look into.

CQP stock closed at $54.40/share on 5/25/2022.

Cheniere Energy Partners L.P. CQP Stock’s Technicals Broken Down

Cheniere Energy Partners L.P. CQP Stock's Technical Performance Over The Last Year

CQP Stock Price: $54.40

10 Day Moving Average: $52.24

50 Day Moving Average: $53.10

200 Day Moving Average: $45.24

RSI: 54.4

MACD: -0.308

Yesterday, CQP stock completed a bullish MACD crossover, while breaking out above its 50 day moving average.

Despite trading on lighter than average volume, they look to have more near-term momentum, as their RSI is neutral & they have completed 4 consecutive days of gains.

They will need to break above the $54.44, $54.54 & $55.23/share resistance levels as they continue to climb higher.

Cheniere Energy Partners L.P. CQP Stock As A Long-Term Investment

Long-term oriented investors will like CQP stock’s P/E (ttm) of 22.6, but may be weary of their P/B (mrq).

They recently reported 69.5% Quarterly Revenue Growth Y-o-Y, although -54.2% Quarterly Earnings Growth Y-o-Y.

Their balance sheet will require a more thorough review, with $1.16B in Total Cash (mrq) & $17.28B in Total Debt (mrq).

CQP stock’s 5.39% dividend yield may not be sustainable in the long-run, as their payout ratio is reported >100%.

47.1% of CQP stock’s outstanding share float is owned by institutional investors.

Cheniere Energy Partners L.P. CQP Stock As A Short-Term Trade Using Options

Short-term oriented traders can use options to profit from CQP stock’s price movements, while hedging against broader market volatility.

I am looking at the contracts with the 6/17 expiration date.

The $48, $49 & $50 call options all look appealing, although they have relatively low levels of open interest.

The $60 & $55 puts are the only strike prices with open interest that are in-the-money, and are very illiquid.

Tying It All Together

CQP stock has many interesting attributes that make it worth considering as an addition to your portfolio.

Investors will like their P/E, however they may want to look closer into their balance sheet to see how debt may play a role in their size of their dividend in the years to come.

Traders will like their current momentum, but may be disappointed by the low levels of open interest of their options contracts.

Overall, CQP stock is worth taking a closer look into to see if it fits into your portfolio strategy.

*** I DO NOT OWN SHARES OF CQP STOCK AT THE TIME OF PUBLISHING THIS ARTICLE ***
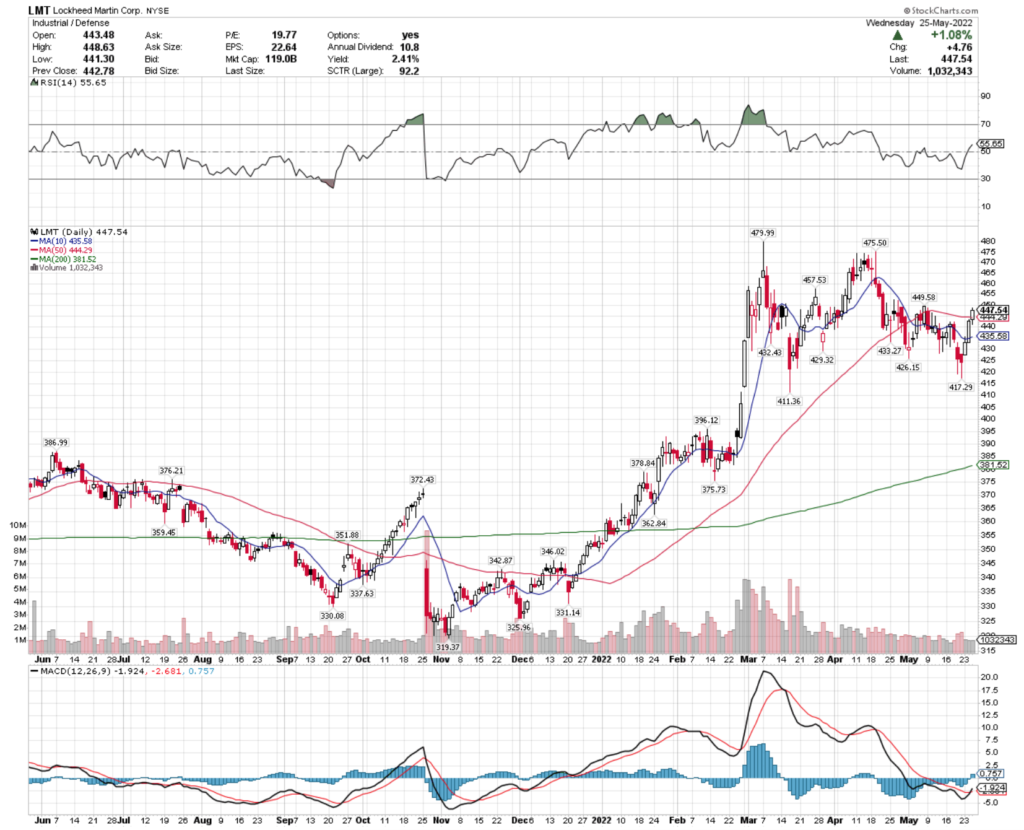
Lockheed Martin Corp. LMT Stock Analysis

Lockheed Martin Corp. stock trades under the ticker LMT & has shown recent bullishness that traders & investors should take a closer look into.

LMT stock closed at $447.54/share on 5/25/2022.

Lockheed Martin Corp. LMT Stock’s Technicals Broken Down

Lockheed Martin Corp. LMT Stock's Technical Performance Over The Last Year

LMT Stock Price: $447.54

10 Day Moving Average: $435.58

50 Day Moving Average: $444.29

200 Day Moving Average: $381.52

RSI: 55.7

MACD: -1.924

Yesterday, LMT stock completed a bullish MACD crossover, while breaking out above its 50 day moving average.

After three straight days of gains, and having a neutral RSI, there looks to be more room to run in the near-term for LMT stock.

They will need to break out above the $448.63, $448.78 & $449.58/share resistance levels.

Lockheed Martin Corp. LMT Stock As A Long-Term Investment

Long-term oriented investors will like LMT stock’s P/E (ttm) of 18.73, but may find their 11.28 P/B (mrq) to be a bit too rich.

They recently reported -8% Quarterly Revenue Growth Y-o-Y, with -5.7% Quarterly Earnings growth Y-o-Y.

Their balance sheet will require closer examination before investing, as they report $1.88B in Total Cash (mrq), with $11.64B of Total Debt (mrq).

LMT stock pays a 2.44% dividend yield, which appears stable in the long-run, as their payout ratio is 47.7%.

76.3% of LMT stock’s outstanding share float is owned by institutional investors.

Lockheed Martin Corp. LMT Stock As A Short-Term Trade Using Options

LMT stock has options that short term oriented traders can use to profit from their price movements, while protecting themselves from volatility.

I am looking at the contracts with the 6/17 expiration date.

The $435, $440 & $445 call options all look appealing & have sufficient levels of liquidity.

The $460, $455 & $450 puts also look appealing, although they have slightly lower open interest levels.

Tying It All Together

LMT stock offers a lot of opportunity for traders & investors alike.

Investors will like their dividend yield & valuation, but may want to look closer into their balance sheet structure.

Traders will like their current momentum, as well as the liquidity of their options contracts.

Overall, LMT stock is worth taking a closer look at to see if it fits into your portfolio strategy.

*** I DO NOT OWN SHARES OF LMT STOCK AT THE TIME OF PUBLISHING THIS ARTICLE ***
SBA Communications Corp. SBAC Stock

SBA Communications Corp. stock trades under the ticker SBAC & has shown recent bullishness that traders & investors should take a closer look into.

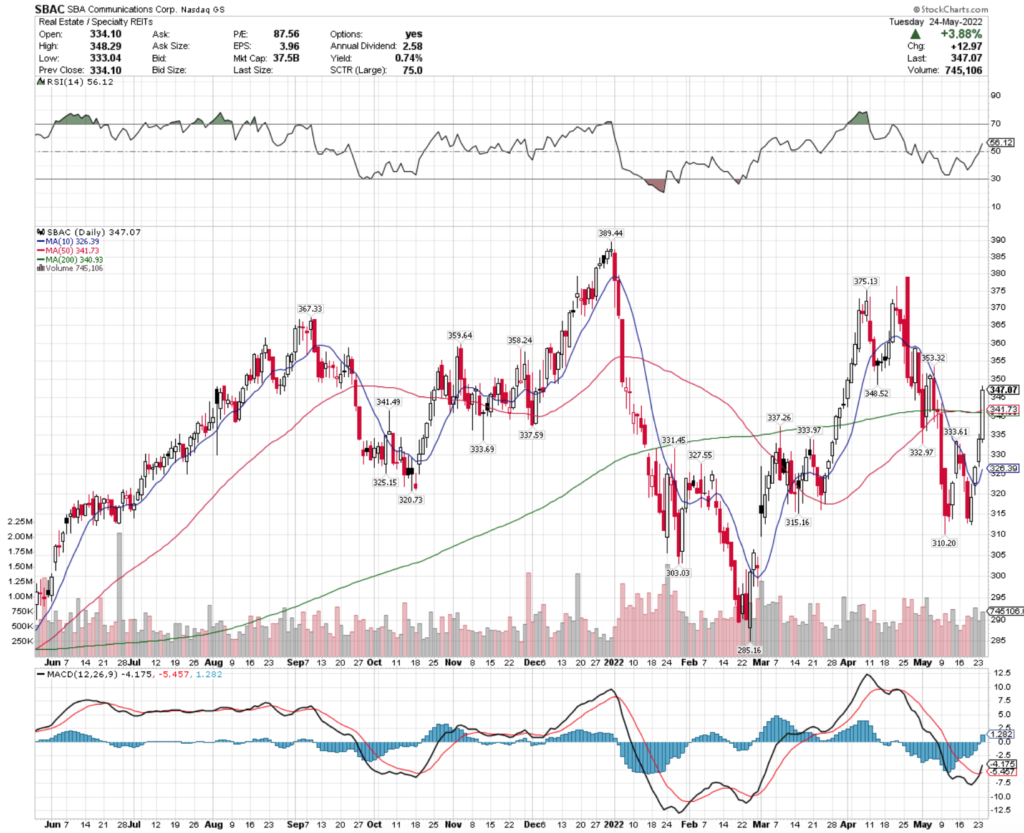
SBAC stock closed at $347.07/share on 5/24/2022.

SBA Communications Corp. SBAC Stock’s Technicals Broken Down

SBA Communications Corp. SBAC Stock's Technical Performance Over The Last Year

SBAC Stock Price: $347.07

10 Day Moving Average: $326.39

50 Day Moving Average: $341.73

200 Day Moving Average: $340.93

RSI: 56.12

MACD: -4.175

Yesterday, SBAC stock completed a bullish MACD crossover, while breaking out above its 50 & 200 day moving averages.

Their recent trading volumes have been about average for the last year, and their RSI is still neutral which signals more bullish momentum to come in the near-term.

They will need to break above the $348.29, $352.07 & $354.09/share resistance levels as they continue climbing higher.

SBA Communications Corp. SBAC Stock As A Long-Term Investment

Long-term oriented investors may find SBAC stock’s valuation metrics to be a bit high, with a P/E (ttm) of 82.3.

They recently reported 12.9% Quarterly Revenue Growth.

Their balance sheet will require a closer review, with $263.6M in Total Cash (mrq) & Total Debt (mrq) of $14.94B.

SBAC stock pays a 0.73% dividend yield, which appears stable in the long-term, but may need to be reduced as their payout ratio is 61.7%.

97.34% of SBAC stock’s outstanding share float is owned by institutional investors.

SBA Communications Corp. SBAC Stock As A Short-Term Trade Using Options

Short-term focused traders can use options to profit from movements in SBAC stock’s price, while hedging against volatility.

I am looking at the contracts with the 6/17 expiration date.

The $310, $330 & $340 calls all look appealing, but are rather illiquid, with low open interest levels.

The $370, $360 & $350 puts also look interesting, but are also lacking in open interest.

Tying It All Together

SBAC stock is worth taking a closer look into, whether you are trading it in the near-term or looking for a long-term investment.

Investors will like their dividend yield, but may want to look closer into their balance sheet.

Traders will like their current momentum, but may wish that their options were more liquid.

Overall, it is worth taking a closer look into how SBAC fits into your portfolio strategy.

*** I DO NOT OWN SHARES OF SBAC AT THE TIME OF PUBLISHING THIS POST ***

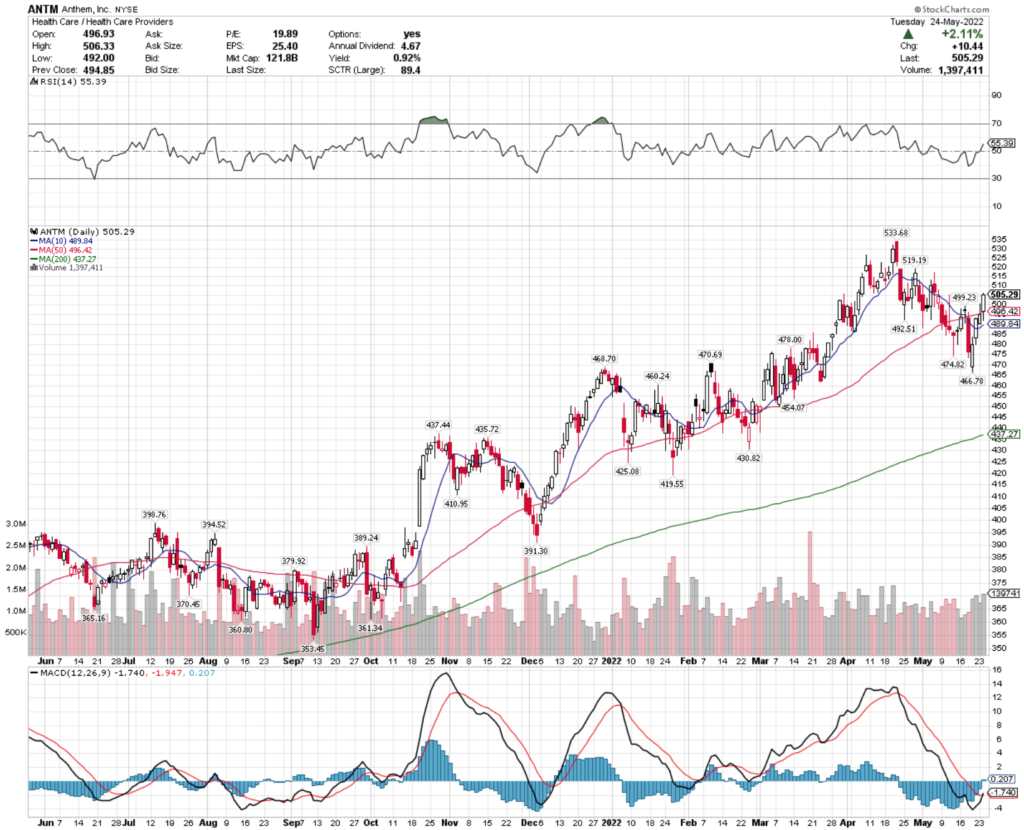
Anthem, Inc. ANTM Stock Analysis

Anthem, Inc. stock trades under the ticker ANTM & has recently shown bullishness that traders & investors should take a closer look into.

ANTM stock closed at $505.29/share on 5/24/2022.

Anthem, Inc. ANTM Stock’s Technicals Broken Down

Anthem, Inc. ANTM Stock's Technical Performance Over The Last Year

ANTM Stock Price: $505.29

10 Day Moving Average: $489.84

50 Day Moving Average: $496.42

200 Day Moving Average: $437.27

RSI: 55.4

MACD: -1.74

Yesterday, ANTM stock completed a bullish MACD crossover, while breaking out above its 50 day moving average.

They have recently traded on above average volume compared to the year prior & still have a neutral RSI, signaling that there is more momentum to come in the near-term.

ANTM will need to break above the $506.33, $508.07 & $511.06/share resistance levels.

Anthem, Inc. ANTM Stock As A Long-Term Investment

Long-term focused investors will like ANTM stock’s valuation metrics, with a 19.4 P/E (ttm) & a 3.3 P/B (mrq).

They recently reported 17.6% Quarterly Revenue Growth Y-o-Y & 8.4% Quarterly Earnings Growth Y-o-Y.

ANTM has a strong balance sheet, featuring $34.04B in Total Cash (mrq) & $24.19B in Total Debt (mrq).

Anthem, Inc. stock pays a 0.94% dividend yield, which appears stable in the long-term with a 18.4% payout ratio.

93.3% of ANTM stock’s outstanding share float is owned by institutional investors.

Anthem, Inc. ANTM Stock As A Short-Term Trade Using Options

Short-term oriented traders can use options to protect themselves from broader market volatility, while also profiting from their price movements.

I am looking at the contracts with the 6/17 expiration date.

The $500, $502.50 & $505 call options look appealing, although they are relatively illiquid, as there are weekly expiration for ANTM options.

The $520, $515 & $510 puts are also worth looking into as well, especially as more contracts are written in the coming weeks.

Tying It All Together

ANTM stock has many interesting characteristics that traders & investors alike will be interested in.

Investors will like their valuation metrics & balance sheet, as well as their dividend yield.

Traders will like their current momentum path, as well as their weekly options expirations.

Overall, ANTM stock is worth taking a closer look into, regardless of your portfolio strategy.

*** I DO NOT OWN SHARES OF ANTM STOCK AT THE TIME OF WRITING THIS ***

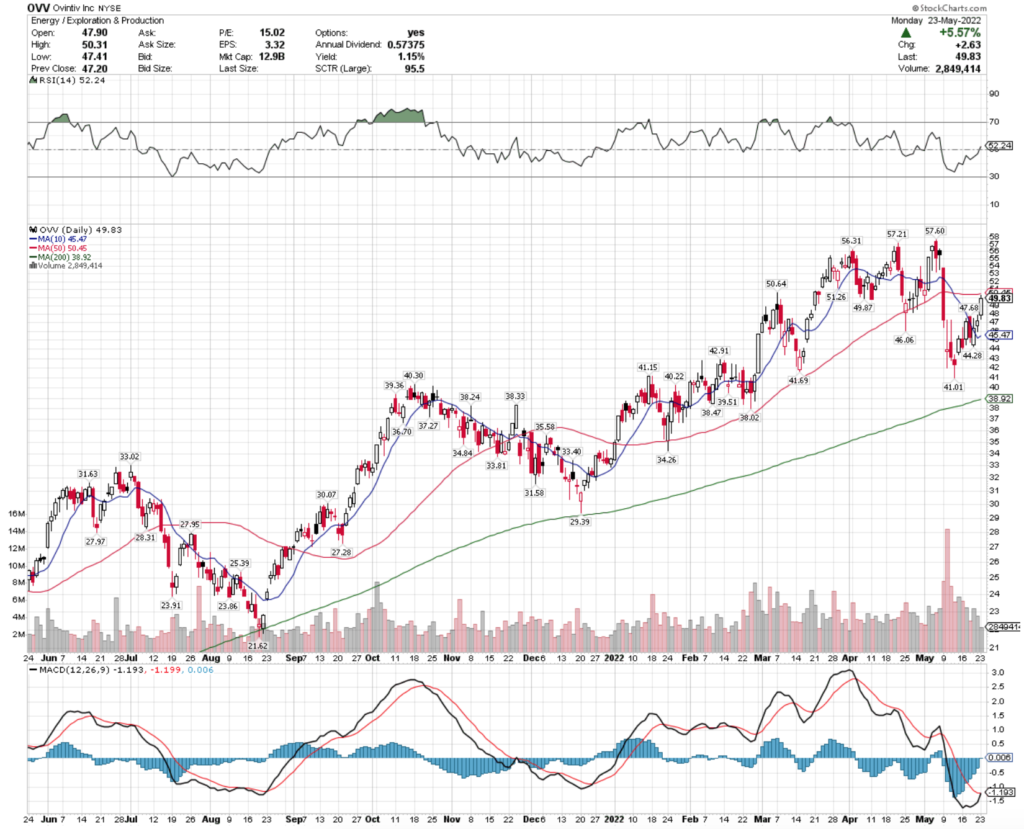
Ovintiv Inc. OVV Stock Analysis

Ovintiv Inc. stock trades under the ticker OVV & has shown recent bullishness despite broader market volatility.

OVV Stock closed at $49.83/share on 5/23/2022.

Ovintiv Inc. OVV Stock’s Technicals Broken Down

Ovintiv Inc. OVV Stock's Technical Performance Over The Last Year

OVV Stock Price: $49.83

10 Day Moving Average: $45.47

50 Day Moving Average: $50.45

200 Day Moving Average: $38.92

RSI: 52.24

MACD: -1.193

Yesterday, OVV stock completed a bullish MACD crossover, while settling 1.2% below their 50 day moving average.

Their recent trading volumes have been above average this month compared to the year prior, and their RSI is still neutral, signaling that there may be more upward momentum to come.

They need to break above the $50.31, $50.84 & $51.95/share resistance levels.

Ovintiv Inc. OVV Stock As A Long-Term Investment

Long-term oriented investors will like OVV stock’s valuation metrics, with a 14.07 P/E (ttm) & a 2.5 P/B (mrq).

They recently reported Quarterly Revenue Growth of 51.6%.

Their balance sheet will require a closer examination, with $271M of Total Cash (mrq) & $5.77B of Total Debt (mrq).

OVV stock pays a 1.22% dividend yield, which appears stable in the long-run as their payout ratio is only 17.82%.

81.55% of OVV stock’s outstanding share float is owned by institutional investors.

Ovintiv Inc. OVV Stock As A Short-Term Trade Using Options

Short-term oriented traders can use options to profit from price movements in any direction for OVV stock, while hedging against broader market volatility.

I am looking at the contracts with the 5/17 expiration date.

The $40, $45 & $50 calls look interesting, although the former strike price is very illiquid compared to the other two.

The $60, $55 & $50 puts are also appealing, but they have much lower levels of open interest vs. the puts, signaling that the market outlook for OVV in the near-term seems more bullish (despite the broader markets looking bearish).

Tying It All Together

Overall, OVV stock is worth taking a closer look into for investors & traders alike.

Investors will like their valuation metrics, as well as their dividend yield.

Traders will like their current momentum, but may be weary of their open interest levels of their options contracts.

Regardless of your portfolio strategy, OVV stock is worth researching further to see how it can be a profitable fit.

*** I DO NOT OWN SHARES OF OVV STOCK AT THE TIME OF PUBLISHING THIS ARTICLE ***