JinkoSolar Holding Co Ltd JKS Stock Analysis

JinkoSolar Holding Co. Ltd. stock trades under the ticker JKS & has recently shown very strong technicals.

Closing at $54.96 on 10/8/2020 after a slight price pullback, there look to be opportunities trading JKS stock options.

In anticipation of more of a price pullback, the slightly in-the-money $55 puts look attractive, as the next lowest level is $50, which would require a ~7% drop to become in-the-money.

The $55 puts expiring on 10/16 have a delta of -.047, while the $60 put’s delta is -0.67 & the $65 put’s delta is -0.82.

For Calls, I would be looking out to the December 18 expiration, at either the $50 calls which are already in-the-money and or the $55 calls, as once they become in-the-money the stock should have some decent momentum for growth.

In this instance, I would buy them separately based on the charts, as the call option decay may be exaggerated by election uncertainty and volatility.

JinkoSolar Holding Co LTD JSK Stock Chart For The Last Year

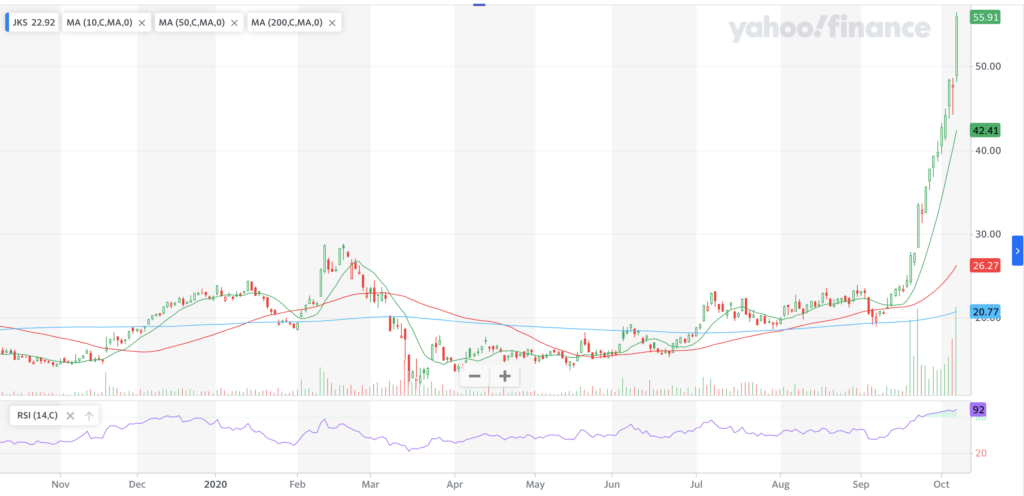
JKS Stock Price: $54.96

10 Day Moving-Average: $42.41

50 Day Moving-Average: $26.27

200 Day Moving-Average: $20.77

RSI: 92

The RSI of 92 is high, and should even itself out as JinkoSolar Holding Co LTD’s stock establishes a new trading range, at which time entering the call options outlined above would be beneficial.

I’ll be looking at the options outlined above in the coming days & weeks.

*** I DO NOT OWN SHARES OF JKS STOCK ***

Pioneer Power Solutions Inc. PPSI Stock Analysis

Pioneer Power Solutions Inc. stock trades under the ticker PPSI & closed for trading yesterday at $6.89.

After gapping up on 10/6/20 it has shown great technical strength, and is worth taking a closer look at.

PPSI has no options, so for a hedge, I would look at something similar to what I posted about yesterday for a NASDAQ hedge.

Pioneer Power Solutions Inc. PPSI Stock Chart For The Last Year

PPSI Price: $6.89

10 Day Moving-Average:$1.88

50 Day Moving-Average: $1.62

200 Day Moving-Average: $1.63

RSI:86

PPSI’s 50 Day Moving-Average is about to cross the 200 Day Moving-Average, so there should be more opportunities to take advantage of from a short-term trade perspective.

I’ll be eyeing an entry point today & tomorrow to see if there is a price level I like.

*** I DO NOT OWN ANY SHARES OF PPSI STOCK ***

Westwater Resources Inc. WWR Stock Analysis

Westwater Resources Inc. stock trades under the ticker WWR & has recently displayed technical strength, making it worth examining for trade opportunities.

WWR stock does not have options, but is a member of the NASDAQ, so while you have to buy the shares long, you can hedge against the position by using an inverse-NASDAQ Index ETF/ETN, or by buying options for or against the NASDAQ products.

An example, buying the SQQQ ETF, and or calls in it could be a means of hedging against the long WWR trade.

Westwater Resources Inc. WWR Stock Chart For The Last Year

WWR Price: $11.80

10 Day Moving-Average: $2.84

50 Day Moving-Average: $2.19

200 Day Moving-Average: $1.96

RSI: 94

While WWR’s RSI is high at 94, showing signs of being very overbought, after such a strong takeoff that is to be expected, and will go down to a more normal level as it establishes its new range.

WWR shows potential for being a good short-to-medium term trade.

*** I DO NOT OWN SHARES OF WWR STOCK ***

CBAK Energy Technology, Inc. CBAT Stock Analysis

CBAK Energy Technology, Inc. stock trades under the ticker CBAT & has recently shown technical strength that poses trade opportunities.

On Monday 10/5/2020 they closed at $4.15/share, and they show signs of continued growth into today in pre-market trading.

CBAT stock does not have options to trade, so a trader would need to hedge their risk using an inverse-NASDAQ Index ETF for any potential downward movement in price.

CBAT Price: $4.15

10 Day Moving-Average: $1.92

50 Day Moving-Average: $1.02

200 Day Moving-Average: $0.75

RSI: 78

Based on yesterday’s high price, they show room to run beyond $4.75+, and their pre-market price is currently just over $5.

I am looking to get into them today/tomorrow for a short term trade opportunity, as they do not fit the profile of the type of company I would invest in for the long haul.

*** I DO NOT OWN ANY SHARES OF CBAT ***

SPI Energy Co LTD SPI Stock Analysis

SPI Energy Co LTD trades under the ticker SPI & is a member of the NASDAQ index.

SPI stock’s premarket price is $8.10 on 9/30/2020, after gapping up a few days ago & there looks to be more opportunity for growth in the name.

SPI does not offer options, so timing will be important for an entry into a position of their common shares, which may be advantageous from a trading perspective.

SPI Energy Co LTD SPI Stock Chart For Last Year

SPI Price: $8.10

10 Day Moving-Average: $5.41

50 Day Moving-Average: $2.18

200 Day Moving-Average: $1.44

RSI: 73

I’ll be looking today for a quick entry & exit on SPI shares.

*** I DO NOT OWN SHARES OF SPI STOCK ***

Cassava Sciences Inc. SAVA Stock Analysis

Cassava Sciences Inc. trades under the ticker SAVA and has recently displayed technical strength that makes it worth looking a little closer at for a trade opportunity.

SAVA currently trades at $11.16 per the close of 9/28, and are currently down ~3% in the pre-market today as the futures trade mostly flat/slightly lower (per 7:30 am).

SAVA options that are closest to at-the-money are at $10 or $12.50 for calls and puts.

Given the breadth of that spread, I am going to look to be buying the slightly in-the-money options, as their Deltas are higher, and they offer some cushion for safety on a day like today which promises to be relatively uncertain.

SAVA Price: $11.16

10 Day Moving-Average: $9.36

50 Day Moving-Average: $4.55

200 Day Moving-Average: $5.02

RSI: 79

Their RSI is currently high, although that should begin to shake out as they establish a new price range.

I may start the day buying puts, and then as the price starts to settle down sell them and look to buy some calls & perhaps set up a straddle based around where the price is settled.

*** I DO NOT OWN ANY SHARES OF SAVA STOCK ***

VivoPower International PLC VVPR Stock Analysis

VivoPower International PLC stock trades under the ticker VVPR, and has recently displayed some noteworthy technical strength.

Overall, VVPR’s chart shows upward momentum, with eyes looking at their resistance level of $9.50, ~12% above where the current price is trading, making them worth considering for a trade, and perhaps a longer-term investment long shot idea.

VVPR Stock does not have options to trade, so for hedging purposes, if you were to buy shares, it would be wise to look at ETFs like SQQQ for days where a hedge is required.

VivoPower International PLC VVPR Stock One Year Chart

VVPR Price: $8.50

10 Day Moving-Average: $7.99

50 Day Moving-Average: $4.81

200 Day Moving-Average: $2.01

RSI: 58

I will be looking at VVPR for a short-term trade opportunity within the coming days.

*** I DO NOT OWN SHARES OF VVPR STOCK ***

Sunworks, Inc. SUNW Stock Analysis

Sunworks, Inc. trades under the ticker SUNW & has recently experienced a bullish surge in price. Yesterday alone SUNW stock climbed by ~239%, and as of 8:05 am it is down 16% from yesterday’s price amid mixed signals in the futures markets.

While it looks to establish its new trading range there should be many opportunities for traders to make some money.

Sunworks, Inc.’s stock does not have options, so a trader would be looking for an entry into common shares as it begins to readjust to its new price range.

A trader in this name will have to be vigilant though, as there are no puts to use to hedge against volatility, and using SQQQ calls or shares may be a bit too aggressive, despite SUNW’s high Beta of 2.96 (5 year monthly).

Sunworks, Inc. SUNW Stock Chart For The Past Year

SUNW Price: $3.28 (pre-market)

10 Day Moving-Average: $0.93

50 Day Moving-Average: $1.16

200 Day Moving-Average: $0.77

RSI: 68

While today may not be the best day to hop into them as it may be a risk off Friday for many folks, there should be some appealing entry points, particularly as the 10 Day Moving-Average prepares to cross the 50 Day Moving-Average in the coming trading sessions.

*** I DO NOT OWN ANY SHARES OF SUNW ***

Marinus Pharmaceuticals, Inc. MRNS Stock Analysis

Marinus Pharmaceuticals, Inc. trades under the ticker MRNS & has recently displayed signs of technical strength.

MRNS is currently $12.01/share.

After gapping up on 9/15 it is looking to establish a new range, and shows more room to increase in price with its 50 Day Moving-Average approaching the 200 Day in a positive manner.

Marinus Pharmaceuticals, Inc. MRNS Stock Chart For The Last Year

MRNS Price: $12.01

10 Day Moving-Average: $10.94

50 Day Moving-Average: $8.09

200 Day Moving-Average: $8.62

While MRNS does have options (my mistake from the date I published it saying it did not), it does show signs of being an interesting trade using the common stock. With what looks like more room to run, MRNS is worth considering for a short term trade.

*** I DO NOT OWN ANY SHARES OF MRNS STOCK ***

Cardiff Oncology, Inc. CRDF Stock Analysis

Cardiff Oncology, Inc. trades under the ticker CRDF & has recently shown a lot of technical strength.

Their current price is $11.50, making the $10 Call options more appealing than the $12.50 calls.

While the stock itself is relatively young, they have been on a tear since April, with recent major breakouts the last few days.

Cardiff Oncology, Inc. CRDF Stock Chart For Past Year

CRDF Price: $11.50

10 Day Moving-Average: $6.09

50 Day Moving-Average: $6.99

200 Day Moving-Average: N/A

RSI: 80

While the RSI is overbought, their recent few days’ strength is to blame, and their RSI should begin to smooth itself out soon. While I normally do not bother with companies this close to their IPO, this looks like the opportunity for a quick trade worth considering.

*** I DO NOT OWN SHARES OF CRDF STOCK ***