Sempra Energy SRE Stock Analysis

Sempra Energy stock trades under the ticker SRE & has shown recent bullishness that traders & investors should research further into.

SRE stock closed at $158.49/share on 2/17/2023.

Sempra Energy SRE Stock’s Technical Performance Broken Down

Sempra Energy SRE Stock's Technical Performance Over The Past Year
Sempra Energy SRE Stock’s Technical Performance Over The Past Year

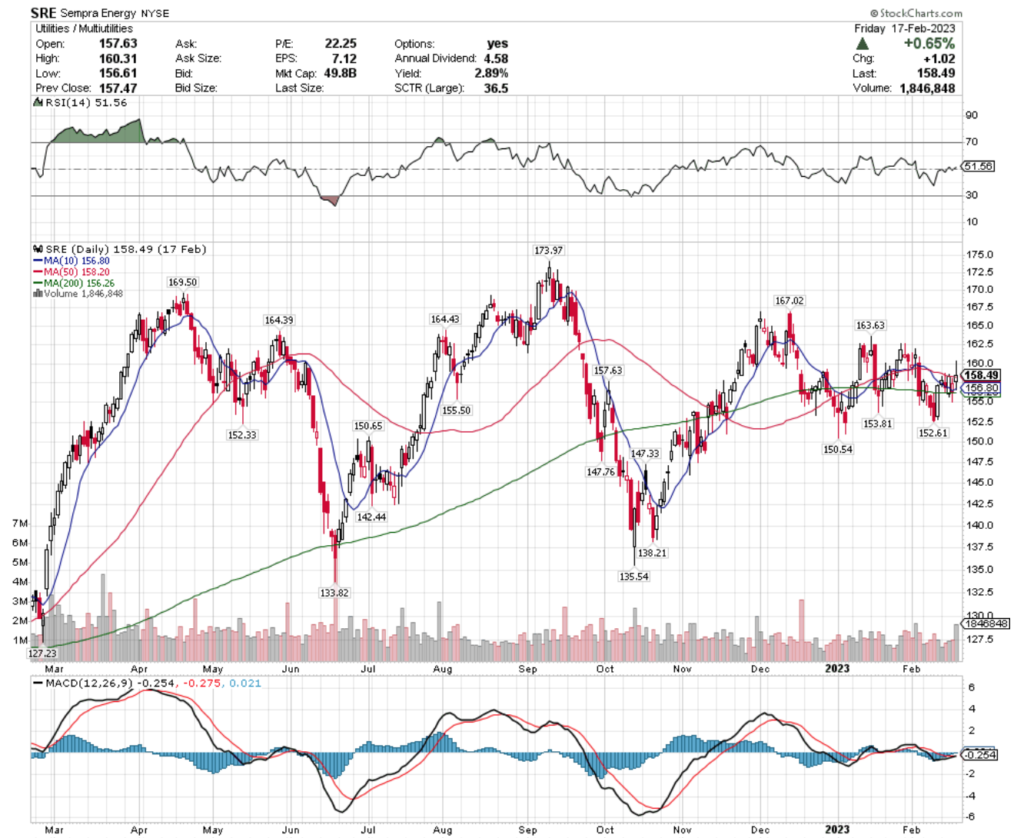
SRE Stock Price: $158.49

10 Day Moving Average: $156.80

50 Day Moving Average: $158.20

200 Day Moving Average: $156.26

RSI: 51.56

MACD: -0.254

On Friday, SRE stock completed a bullish MACD crossover, gaining +0.65% on the day’s session.

Recent trading volumes have been slightly below average compared to the year prior & their RSI is neutral after consolidating over the last few months.

SRE stock has support at the $158.20, $157.63 & $156.80/share price levels, as they try to break out above their $163.63, $164.39 & $164.43/share resistance levels.

Sempra Energy SRE Stock As A Long-Term Investment

Long-term focused investors will like SRE stock’s valuation metrics, with a 22.02 P/E (ttm) & 1.89 P/B (mrq).

They recently reported 20% Quarterly Revenue Growth Y-o-Y.

Their balance sheet will require a more thorough examination before investment, with $690M of Total Cash (mrq) & $27B of Total Debt (mrq).

SRE stock pays a 2.88% dividend, which may not be sustainable in the long-run, as their payout ratio is 63.43%.

88.69% of SRE stock’s outstanding share float is owned by institutional investors.

Sempra Energy SRE Stock As A Short-Term Trade Using Options

Traders with shorter time horizons can trade options to profit from SRE stock’s price movements, while protecting their portfolios from volatility.

I am looking at the contracts with the 4/21 expiration date.

The $150, $155, $140 & $145 call options are all in-the-money, listed from highest to lowest level of open interest.

The $160, $165 & $170 puts are also all in-the-money, with the former being more liquid than the latter strikes.

Tying It All Together

SRE stock has many interesting characteristics that traders & investors will find appealing.

Investors will like their valuation metrics & dividend yield, but may want to more thoroughly review their balance sheet before investing.

Traders will like their recent technical performance.

All-in-all, it is worth taking a closer look into SRE stock to see how it fits into your portfolio strategy.

*** I DO NOT OWN SHARES OR OPTIONS CONTRACTS IN SRE STOCK AT THE TIME OF PUBLISHING THIS ARTICLE ***

Juniper Networks JNPR Stock Analysis

Juniper Networks stock trades under the ticker JNPR & has shown recent bullishness that traders & investors should research further into.

JNPR stock closed at $31.53/share on 2/16/2023.

Juniper Networks JNPR Stock’s Technical Performance Broken Down

Juniper Networks JNPR Stock's Technical Performance Over The Past Year
Juniper Networks JNPR Stock’s Technical Performance Over The Past Year

JNPR Stock Price: $31.53

10 Day Moving Average: $31.16

50 Day Moving Average: $31.81

200 Day Moving Average: $29.51

RSI: 50.46

MACD: -0.123

Yesterday, JNPR stock completed a bullish MACD crossover, gaining 0.03% on the day’s session.

Recent trading volumes have been slightly above average compared to the year prior & their RSI is neutral after the stock has spent the last few months in a consolidation range.

Yesterday’s shooting star candlestick implies that there will be near-term weakness which will provide more favorable entries for investors & traders.

JNPR stock has support at the $31.41 & $31.16 (10 Day Moving Average), as they try to break out & above the $31.81 (50 Day Moving Average) & $31.88/share resistance levels.

Juniper Networks JNPR Stock As A Long-Term Investment

Long-term oriented investors will like JNPR stock’s valuation metrics, with a 22.05 P/E (ttm) & a 2.28 P/B (mrq).

They recently reported 11.5% Quarterly Revenue Growth Y-o-Y, with 35.7% Quarterly Earnings Growth Y-o-Y.

Their balance sheet looks decent upon first glance, with $1.09B of Total Cash (mrq) & $1.85B of Total Debt (mrq).

JNPR stock pays a 2.66% dividend, which appears to be sustainable in the long-run, with a 58.7% payout ratio.

92.2% of JNPR stock’s outstanding share float is owned by institutional investors.

Juniper Networks JNPR Stock As A Short-Term Trade Using Options

Short-term focused traders can use options to profit from price movements in JNPR stock, while protecting their portfolios from volatility.

I am looking at the contracts with the 3/17 expiration date.

The $31, $30 & $28 call options are all in-the-money, listed from highest to lowest level of open interest.

The $32, $34 & $33 puts are also all in-the-money, with the former being more liquid than the latter strikes.

As they have weekly expirations, expect to see more contracts for this expiration date as the day draws nearer.

Tying It All Together

JNPR stock has many interesting attributes that traders & investors are sure to find appealing.

Investors will like their valuation metrics, balance sheet & dividend yield.

Traders will like their recent technical performance, as well as their weekly options expiration dates.

All-in-all, it is worth taking a closer look into JNPR stock to see how it fits into your portfolio strategy.

*** I DO NOT OWN SHARES NOR OPTIONS POSITIONS IN JNPR STOCK AT THE TIME OF PUBLISHING THIS ARTICLE ***

Kraft Heinz Co. KHC Stock Analysis

Kraft Heinz Co. stock trades under the ticker KHC & has shown recent bullishness that traders & investors should look closer into.

KHC stock closed at $40.13/share on 2/15/2023.

Kraft Heinz Co. KHC Stock’s Technical Performance Broken Down

Kraft Heinz Co. KHC Stock's Technical Performance Over The Past Year
Kraft Heinz Co. KHC Stock’s Technical Performance Over The Past Year

KHC Stock Price: $40.13

10 Day Moving Average: $39.68

50 Day Moving Average: $40.41

200 Day Moving Average: $37.89

RSI: 50.54

MACD: -0.187

Yesterday, KHC stock completed a bullish MACD crossover, gaining +0.63% on the day’s session.

Recent trading volumes have been about average compared to the month prior, and their RSI is currently neutral.

They’ve recently been consolidating, with more near-term weakness signaled ahead, which will provide investors & traders with more favorable entry points.

KHC stock has support at the $40.04 & $39.68/share price levels, as they try to break out & above the $40.41 & $42.56/share resistance levels.

Kraft Heinz Co. KHC Stock As A Long-Term Investment

Long-term oriented investors will like KHC stock’s valuation metrics, with a 40.44 P/E (ttm) & a 1.01 P/B (mrq).

Investors will want to look into their recent growth metrics, with 2.9% Quarterly Revenue Growth Y-o-Y & -41.1% Quarterly Earnings Growth Y-o-Y.

Their balance sheet will also require a more thorough examination before investing, with $997M in Total Cash (mrq) & $20.24B of Total Debt (mrq).

KHC stock pays a 4.01% dividend, which may not be sustainable in the long-run as their payout ratio is over 100%.

80.33% of KHC stock’s outstanding share float is owned by institutional investors.

Kraft Heinz Co. KHC Stock As A Short-Term Trade Using Options

Traders with shorter time horizons can trade options to profit from KHC stock’s price movements, while protecting their portfolios from volatility.

I am looking at the contracts with the 3/17 expiration date.

The $40, $30 & $37.50 call options are all in-the-money, listed from highest to lowest level of open interest.

The $42.50 & $50 puts are also all in-the-money, with the former strike being more liquid than the latter two.

Tying It All Together

KHC stock has many unique attributes that traders & investors will like.

Investors will like their valuation metrics & dividend yield, but should be aware that it may not be sustainable in the long-run at such high levels.

Traders will like their recent technical performance, as well as how liquid their options are.

Overall, it is worth taking a closer look into KHC stock to see how it fits into your portfolio strategy.

*** I DO NOT OWN SHARES OR OPTIONS POSITIONS IN KHC STOCK AT THE TIME OF PUBLISHING THIS ARTICLE ***

Viper Energy Partners LP VNOM Stock Analysis

Viper Energy Partners LP stock trades under the ticker VNOM & has shown recent bullishness that traders & investors should look closer into.

VNOM stock closed at $32.42/share on 2/14/2023.

Viper Energy Partners LP VNOM Stock’s Technical Performance Broken Down

Viper Energy Partners LP VNOM Stock's Technical Performance Over The Past Year
Viper Energy Partners LP VNOM Stock’s Technical Performance Over The Past Year

VNOM Stock Price: $32.42

10 Day Moving Average: $30.93

50 Day Moving Average: $31.42

200 Day Moving Average: $30.13

RSI: 55.86

MACD: -0.095

Yesterday, VNOM stock completed a bullish MACD crossover, gaining 2.72% on they day’s session.

Their RSI is neutral at 55 & recent trading volumes have been below average compared to the year prior, as their price has been consolidating over the last few months.

VNOM stock has support at the $32.34 & $31.42/share price levels, as they try to break out above the $32.49 & $32.58/share resistance levels.

Viper Energy Partners LP VNOM Stock As A Long-Term Investment

Long-term oriented investors will like VNOM stock’s 13.83 P/E (ttm), but may find their 3.22 P/B (mrq) to be a bit rich.

They recently reported 64.1% Quarterly Revenue Growth Y-o-Y, with 371.4% Quarterly Earnings Growth Y-o-Y.

Their balance sheet will require a more thorough examination, with $11.62M of Total Cash (mrq) & $669.64M of Total Debt (mrq).

VNOM stock pays a 7.73% dividend, which may not be sustainable in the long-run, as their payout ratio is over 100%.

78.4% of VNOM stock’s outstanding share float is owned by institutional investors.

Viper Energy Partners LP VNOM Stock As A Short-Term Trade Using Options

Traders with shorter time horizons can trade options to profit from price movements in VNOM stock, while hedging their portfolios against volatility.

I am looking at the contracts with the 3/17 expiration date.

The $32, $31 & $30 call options are all in-the-money, listed from highest to lowest level of open interest.

The $33, $35 & $34 puts are also all in-the-money, with the former being more liquid than the latter strikes.

Tying It All Together

VNOM stock has many interesting attributes that traders & investors will find appealing.

Investors will like their valuation metrics, but should be aware that their dividend yield is not well covered by earnings or cash flows.

Traders will like their recent technical performance, as well as how liquid their options are.

Overall, it is worth taking a closer look into VNOM stock to see how it fits into your portfolio strategy.

*** I DO NOT OWN SHARES OR OPTIONS POSITIONS IN VNOM STOCK AT THE TIME OF PUBLISHING THIS ARTICLE ***

Marathon Oil MRO Stock Analysis

Marathon Oil stock trades under the ticker MRO & has shown recent bullishness that traders & investors should take a closer look at.

MRO stock closed at $27.33/share on 2/13/2023.

Marathon Oil MRO Stock’s Technical Performance Broken Down

Marathon Oil MRO Stock's Technical Performance Over The Past Year
Marathon Oil MRO Stock’s Technical Performance Over The Past Year

MRO Stock Price: $27.33

10 Day Moving Average: $26.69

50 Day Moving Average: $27.21

200 Day Moving Average: $26.53

RSI: 51.42

MACD: -0.152

Yesterday, MRO stock completed a bullish MACD crossover, despite losing -1.51% on the day.

Their RSI is neutral & recent trading volumes have been below average compared to the year prior, signaling uncertainty in where to value their shares.

The candlesticks of the last few days signal that there appears to be some near-term weakness on the horizon, which can offer a better entry point for investors or traders.

MRO stock has support at the $27.21 (2 support points at this level), as well as at $26.69, as they try to break out above the $27.72 & $27.82/share resistance levels.

Marathon Oil MRO Stock As A Long-Term Investment

Long-term oriented investors will like MRO stock’s valuation metrics, with a 5.33 P/E (ttm) & a 1.57 P/B (mrq).

They recently reported 40% Quarterly Revenue Growth Y-o-Y, with 344% Quarterly Earnings Growth Y-o-Y.

Their balance sheet will require a more thorough examination, with $1.12B of Total Cash (mrq) & $4.11B of Total Debt (mrq).

MRO stock pays a 1.15% dividend, which appears to be sustainable in the long-run, as their payout ratio is 5.57%.

79.14% of MRO stock’s outstanding share float is owned by institutional investors.

Marathon Oil MRO Stock As A Short-Term Trade Using Options

Traders with shorter time horizons can trade options to profit from MRO stock’s price movements, while protecting their portfolios from broader market volatility.

I am looking at the contracts with the 3/17 expiration date.

The $27, $25 & $26 call options are all in-the-money, with the former being more liquid than the latter strikes.

The $32, $31 & $29 puts are also all in-the-money, listed from highest to lowest level of open interest.

Tying It All Together

MRO stock has many interesting characteristics that traders & investors are sure to find appealing.

Investors will like their safe dividend, as well as their valuation metrics, but may want to research into the structure of their balance sheet further before investing.

Traders will like their recent technical performance, as well as how liquid their options are.

Overall, it is worth taking a closer look into how MRO stock fits into your portfolio strategy.

*** I DO NOT OWN SHARES OR OPTIONS POSITIONS IN MRO STOCK AT THE TIME OF PUBLISHING THIS ARTICLE ***

Occidental Petroleum Corp. OXY Stock Analysis

Occidental Petroleum Corp. stock trades under the ticker OXY & has shown recent bullishness that traders & investors should research further into.

OXY stock closed at $65.63/share on 2/11/2023.

Occidental Petroleum Corp. OXY Stock’s Technical Performance Broken Down

Occidental Petroleum Corp. OXY Stock's Technical Performance Over The Past Year
Occidental Petroleum Corp. OXY Stock’s Technical Performance Over The Past Year

OXY Stock Price: $65.53

10 Day Moving Average: $63.50

50 Day Moving Average: $64.15

200 Day Moving Average: $64.82

RSI: 54.4

MACD: -0.227

On Friday, OXY stock completed a bullish MACD crossover, gaining 3.84% on the day’s session.

Recent trading volumes have been below average & their RSI is neutral, signaling the market is uncertain as to where they value OXY after its recent consolidation period.

OXY stock has support at the $64.82 (200 Day Moving Average) & $64.60/share price level, as they attempt to break out & above their $65.78 & $66.63/share resistance levels.

Occidental Petroleum Corp. OXY Stock As A Long-Term Investment

Investors with long-term time horizons will like OXY stock’s 5.45 P/E (ttm) & their 3.15 P/B (mrq).

They recently reported 38.3% Quarterly Revenue Growth Y-o-Y, with 231.6% Quarterly Earnings Growth Y-o-Y.

Their balance sheet will require a more thorough examination, with $1.23B of Total Cash (mrq) & $21.67B of Total Debt (mrq).

OXY pays a modest, but sustainable 0.63% dividend, which has a 3.32% payout ratio.

79.2% of OXY stock’s outstanding share float is owned by institutional investors.

Occidental Petroleum Corp. OXY Stock As A Short-Term Trade Using Options

Trades focused on short-term time frames can trade options to profit from OXY stock’s price movements while protecting their portfolio from volatility.

I am looking at the contracts with the 3/17 expiration date.

The $65, $60 & $62.50 call options are all in-the-money, listed from highest to lowest level of open interest.

The $70, $65 & $72.50 puts are also all in-the-money, with the former being more liquid than the latter strike prices.

Tying It All Together

OXY stock has many interesting attributes that traders & investors are sure to find appealing.

Investors will like their safe dividend, as well as their valuation metrics.

Traders will like their recent technical performance, as well as how liquid their options are.

All-in-all, it is worth taking a closer look into OXY stock to see how it fits into your portfolio strategy.

*** I DO NOT OWN SHARES OR OPTIONS CONTRACT POSITIONS IN OXY STOCK AT THE TIME OF PUBLISHING THIS ARTICLE ***

Automatic Data Processing, Inc. ADP Stock Analysis

Automatic Data Processing, Inc. stock trades under the ticker ADP & has shown recent bullish behavior that traders & investors should take notice of.

ADP stock closed at $223.91/share on 2/9/2023.

Automatic Data Processing, Inc. ADP Stock’s Technical Performance Broken Down

Automatic Data Processing, Inc. ADP Stock's Technical Performance Over The Past Year
Automatic Data Processing, Inc. ADP Stock’s Technical Performance Over The Past Year

ADP Stock Price: $233.91

10 Day Moving Average: $224.81

50 Day Moving Average: $241.90

200 Day Moving Average: $232.15

RSI: 39.24

MACD: -4.808

Yesterday, ADP stock completed a bullish MACD crossover, despite losing -0.03% on the day’s session.

Recent trading volumes have been above average compared to the year prior, and their RSI is on the oversold side.

However, their recent candlesticks are signaling further near-term decline, which should provide better entry-points for investors.

ADP stock has support at the $222.13 & $218.49/share level, as they try to break out above their $224.24 & $224.81 (10 Day Moving Average) resistance levels.

Automatic Data Processing, Inc. ADP Stock As A Long-Term Investment

Long-term oriented investors will like ADP stock’s 34.07 P/E (ttm), but may find their 30.72 P/B(mrq) to be a bit higher than they’d prefer.

They recently reported 9.1% Quarterly Revenue Growth Y-o-Y, with 17.1% Quarterly Earnings Growth Y-o-Y.

Their balance sheet will require a more thorough examination before investing, with $1.36B of Total Cash (mrq) & $3.42B of Total Debt (mrq).

ADP stock pays a 1.95% dividend, which may not be sustainable in the long-run, as their payout ratio is 58.11%.

83.25% of ADP stock’s outstanding share float is owned by institutional investors.

Automatic Data Processing, Inc. ADP Stock As A Short-Term Trade Using Options

Traders with shorter time horizons can trade options to profit from ADP stock’s price movements, while protecting their portfolio from volatility.

I am looking at the contracts with the 3/17 expiration date.

The $220, $200 & $195 call options are all in-the-money, listed in order of highest to lowest level of open interest.

The $230, $240 & $250 puts are also all in-the-money, with the former being more liquid than the latter strike prices.

Tying It All Together

ADP stock has many interesting characteristics that traders & investors are sure to find appealing.

Investors will like their dividend yield, as well as their recent growth metrics, but may want to look deeper into their balance sheet’s structure.

Traders will like their recent technical performance, but may be disappointed by how liquid their options are.

Overall, it is worth taking a closer look into ADP stock to see how it fits into your portfolio strategy.

*** I DO NOT OWN SHARES OR OPTIONS CONTRACT POSITIONS IN ADP STOCK AT THE TIME OF PUBLISHING THIS ARTICLE ***

Quest Diagnostics Inc. DGX Stock Analysis

Quest Diagnostics Inc. stock trades under the ticker DGX & has shown recent bullish behavior that traders & investors should research further into.

DGX stock closed at $146.28/share on 2/8/2023.

Quest Diagnostics Inc. DGX Stock’s Technical Performance Broken Down

Quest Diagnostics Inc. DGX Stock's Technical Performance Over The Past Year
Quest Diagnostics Inc. DGX Stock’s Technical Performance Over The Past Year

DGX Stock Price: $146.28

10 Day Moving Average: $146.13

50 Day Moving Average: $149.53

200 Day Moving Average: $137.56

RSI: 46.95

MACD: -1.153

Yesterday, DGX stock completed a bullish MACD crossover, gaining 0.25% on the day’s session.

Recent trading volumes have been above average compared to the year prior & their RSI is neutral, but their recent candlesticks signal there may be near-term weakness for a more favorable entry-point.

DGX stock has support at the $146.19 & $143.58/share price levels, as they try to break out & above the $149.53 & $150.57/share resistance levels.

Quest Diagnostics Inc. DGX Stock As A Long-Term Investment

Long-term oriented investors will like DGX stock’s valuation metrics, with a 17.92 P/E (ttm) & a 2.69 P/B (mrq).

They recently reported -15% Quarterly Revenue Growth Y-o-Y, with -74.1% Quarterly Earnings Growth Y-o-Y, which investors will want to look closer into.

Their balance sheet will also require a more thorough review, with $315M of Total Cash (mrq) & $4.62B of Total Debt (mrq).

DGX stock pays a 1.81% dividend, which appears to be sustainable in the long-run, as their payout ratio is 24.84%.

97.7% of DGX stock’s outstanding share float is owned by institutional investors.

Quest Diagnostics Inc. DGX Stock As A Short-Term Trade Using Options

Traders with shorter time horizons can trade options to protect their portfolio from volatility, while profiting from movements in DGX stock’s price.

I am looking at the contracts with the 3/17 expiration date.

The $145, $135 & $140 call options are all in-the-money, listed from most to least levels of open interest.

The $150 puts are also in-the-money.

Tying It All Together

DGX stock has many interesting attributes that traders & investors are sure to find appealing.

Investors will like their dividend, as well as their valuation metrics, but will want to review their balance sheet & recent growth in more detail.

Traders will like their recent technical performance, but may wish their options were more liquid.

Overall, it is worth taking a closer look into DGX stock to see how it fits into your portfolio strategy.

*** I DO NOT OWN SHARES OR OPTIONS POSITIONS IN DCOM STOCK AT THE TIME OF PUBLISHING THIS ARTICLE ***

Dime Community Bancshares, Inc. DCOM Stock Analysis

Dime Community Bancshares, Inc. stock trades under the ticker DCOM & has shown recent bullish behavior that traders & investors should research further into.

DCOM stock closed at $31.51/share on 2/8/2023.

Dime Community Bancshares, Inc. DCOM Stock’s Technical Performance Broken Down

Dime Community Bancshares, Inc. DCOM Stock 's Technical Performance Over The Past Year
Dime Community Bancshares, Inc. DCOM Stock ‘s Technical Performance Over The Past Year

DCOM Stock Price: $31.51

10 Day Moving Average: $30.93

50 Day Moving Average: $32.22

200 Day Moving Average: $31.53

RSI: 48.39

MACD: -0.321

Yesterday, DCOM stock completed a bullish MACD crossover, gaining 0.29% on the day’s session.

Recent trading volumes have been about average compared to the year prior, and their RSI is neutral, but yesterday’s hanging man candlestick signals there may be near-term weakness that will provide a more favorable entry point for investors.

DCOM has support at the $31.40 & $31.14 (multiple times) price levels, as they try to break above the $31.53 (200 Day Moving Average) & $31.56/share resistance levels.

Dime Community Bancshares, Inc. DCOM Stock As A Long-Term Investment

Long-term investors will like DCOM stock’s valuation metrics, with an 8.5 P/E (ttm) & 1.16 P/B (mrq).

They recently reported -10.6% Quarterly Revenue Growth Y-o-Y, with 13.3% Quarterly Earnings Growth Y-o-Y, which investors would be wise to look closer into.

Their balance sheet will also require a more thorough examination, with $323.78M of Total Cash (mrq) & $1.53B of Total Debt (mrq).

DCOM stock pays a 3.06% dividend yield, which appears to be sustainable in the long-run, as their payout ratio is 25.74%.

73.81% of DCOM stock’s outstanding share float is owned by institutional investors.

Dime Community Bancshares, Inc. DCOM Stock As A Short-Term Trade Using Options

Traders with shorter time horizons can trade options to profit from price movements in DCOM stock, while protecting their portfolios from volatility.

I am looking at the contracts with the 3/17 expiration date.

The $30 call options are in-the-money.

The $35 puts are also all in-the-money.

After the 2/17 expiration date passes there may be more liquidity for the 3/17 expiration.

Tying It All Together

DCOM stock offers many interesting opportunities for traders & investors.

Investors will like their dividend & their valuation metrics, but may want to review their balance sheet & recent growth metrics in more detail.

Traders will like their recent technical performance, but will be disappointed by how illiquid their options are.

All-in-all, it is worth taking a closer look into DCOM stock to see how it fits into your portfolio strategy.

*** I DO NOT OWN SHARES OR OPTIONS CONTRACT POSITIONS IN DCOM STOCK AT THE TIME OF PUBLISHING THIS ARTICLE ***

3M Co. MMM Stock Analysis

3M Co. stock trades under the ticker MMM & has shown recent bullish behavior that traders & investors should look deeper into.

MMM stock closed at $116.90/share on 2/7/2023.

3M Co. MMM Stock’s Technical Performance Broken Down

3M Co. MMM Stock's Technical Performance Over The Past Year
3M Co. MMM Stock’s Technical Performance Over The Past Year

MMM Stock Price: $116.90

10 Day Moving Average: $115.64

50 Day Moving Average: $122.40

200 Day Moving Average: $128.04

RSI: 45.15

MACD: -1.928

Yesterday, MMM stock completed a bullish MACD crossover, gaining 0.34% on the day’s session.

Recent trading volumes have been about average compared to the past year & their RSI is just below neutral, with their most recent candlesticks signaling some short-term losses which can provide a good entry point.

MMM stock has support at the $115.64 (10 Day Moving Average) & $114.76/share price levels, as they try to break out above the $117.80 & $120.85/share resistance levels.

3M Co. MMM Stock As A Long-Term Investment

Long-term focused investors will like MMM stock’s 11.38 P/E (ttm), but may find their 4.31 P/B (mrq) to be a bit too rich.

They recently reported -6.2% Quarterly Revenue Growth Y-o-Y, with -59.6% Quarterly Earnings Growth Y-o-Y, which investors may want to dig deeper into.

Prospective investors would also be best served by reading deeper into their balance sheet, with $3.98B of Total Cash (mrq) & $16.2B of Total Debt (mrq).

MMM stock pays a 5.12% dividend, which may not be sustainable in the long-run, as their payout ratio is 58.55%.

68.3% of MMM stock’s outstanding share float is owned by institutional investors.

3M Co. MMM Stock As A Short-Term Trade Using Options

Traders focused on shorter time horizons can trade options to profit from MMM stock’s price movements, while protecting their portfolios from volatility.

I am looking at the contracts with the 3/17 expiration date.

The $115, $110 & $100 call options are all in-the-money, listed from most to least liquid strike price.

The $120, $125 & $130 puts are also all in-the-money, listed from highest to lowest level of open interest.

Tying It All Together

MMM stock has many interesting characteristics that traders & investors are sure to find appealing.

Investors will like their dividend yield, but may want to look deeper into recent fundamental performance, as well as into their balance sheet structure.

Traders will like their recent technical performance, as well as how liquid their options are.

All-in-all, it is worth taking a closer look into MMM stock to see how it fits into your portfolio strategy.

*** I DO NOT OWN SHARES OF NOR OPTIONS POSITIONS IN MMM STOCK AT THE TIME OF PUBLISHING THIS ARTICLE ***