Eli Lilly & Co. LLY Stock Analysis

Eli Lilly & Co. stock trades under the ticker LLY & has shown recent bullish behavior that traders & investors should research further into.

LLY stock closed at $315.02/share on 3/10/2023.

Eli Lilly & Co. LLY Stock’s Technical Performance Broken Down

Eli Lilly & Co. LLY Stock's Technical Performance Over The Past Year
Eli Lilly & Co. LLY Stock’s Technical Performance Over The Past Year

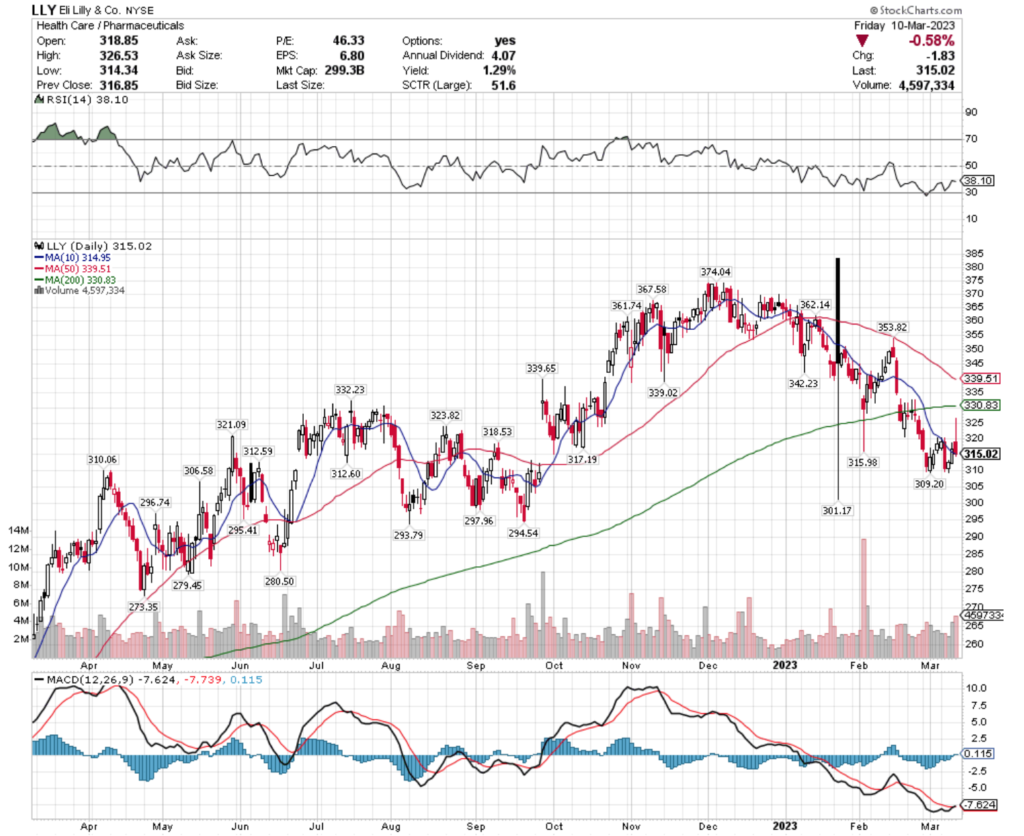
LLY Stock Price: $315.02

10 Day Moving Average: $314.95

50 Day Moving Average: $339.51

200 Day Moving Average: $330.83

RSI: 38.10

MACD: -7.624

On Friday, LLY stock completed a bullish MACD crossover, despite falling -0.58% on the day’s session.

Their RSI is heading towards oversold & recent trading volumes have been above average compared to the year prior.

While their price has been consolidating over the past couple of weeks after a downfall, it is still signaling more near-term weakness to come, which will provide traders & investors with a better entry point.

LLY stock has support at the $312.60, $312.59, $310.06 & $309.20/share price levels, as they try to break out above their $315.98, $317.19, $318.53 & $321.09/share price levels.

Eli Lilly & Co. LLY Stock As A Long-Term Investment

Long-term oriented investors will like LLY stock’s 46.23 P/E (ttm), but will find their 28.52 P/B (mrq) to be a bit too rich.

Investors may also want to review LLY stock’s recently reported -8.7% Quarterly Revenue Growth Y-o-Y & 12.3% Quarterly Earnings Growth Y-o-Y.

Their balance sheet will also warrant an additional review, with $2.44B of Total Cash (mrq) & $17.14B of Total Debt (mrq).

LLY stock pays a 1.24% dividend, which may be sustainable in the long-run, as their payout ratio is 56.81%.

84.4% of LLY stock’s outstanding share float is owned by institutional investors.

Eli Lilly & Co. LLY Stock As A Short-Term Trade Using Options

Traders with shorter time horizons can use options to profit from LLY stock’s price movements, while protecting their portfolios from volatility.

I am looking at the contracts with the 4/21 expiration date.

The $300, $310 & $280 call options are all in-the-money, listed from highest to lowest level of open interest.

The $320, $330 & $350 puts are also all in-the-money, with the former being more liquid than the latter strikes.

Tying It All Together

LLY stock has many interesting charactertistisc thats traders & investors should research further into.

Investors will like their P/E (ttm) & dividend yield, but may want to look into the makeup of their balance sheet for clues as to how sustainable it is.

Traders will like their recent technical performance, as well as how liquid their options are.

All-in-all, it is worth taking a closer look into LLY stock to see how it fits into your portfolio strategy.

*** I DO NOT OWN SHARES OR OPTIONS CONTRACT POSITIONS IN LLY STOCK AT THE TIME OF PUBLISHING THIS ARTICLE ***

Waste Management, Inc. WM Stock Analysis

Waste Management, Inc. stock trades under the ticker WM & has shown recent bullishness that traders & investors should research further into.

WM stock closed at $150.62/share on 3/9/2023.

Waste Management, Inc. WM Stock’s Technical Performance Over The Past Year

Waste Management, Inc. WM Stock's Technical Performance Over The Past Year
Waste Management, Inc. WM Stock’s Technical Performance Over The Past Year

WM Stock Price: $150.62

10 Day Moving Average: $149.54

50 Day Moving Average: $152.35

200 Day Moving Average: $157.79

RSI: 48.84

MACD: -0.910

Yesterday, WM stock completed a bullish MACD crossover, gaining +0.95% on the day’s session.

Their RSI is neutral & recent trading volumes have been about average compared to the year prior, but yesterday’s shooting star candlestick with the large shadow signals near-term losses on the horizon.

This makes it imperative for traders & investors to mind WM stock’s $149.93, $149.54 (10 day moving average) & $148.30/share support levels, while they try to break out above their $150.66, $151.03 & $152.35 (50 day moving average) resistance levels.

Waste Management, Inc. WM Stock As A Long-Term Investment

Long-term focused investors will like WM stock’s 27.97 P/E (ttm), but will find their 8.98 P/B (mrq) to be a bit rich.

They recently reported 5.5% Quarterly Revenue Growth Y-o-Y, with -1.4% Quarterly Earnings Growth Y-o-Y.

Their balance sheet will require a more thorough examination, with $351M of Total Cash (mrq) & $15.51B of Total Debt (mrq).

WM stock pays a 1.74% dividend, which appears to be sustainable as their payout ratio is 48.24%.

83.26% of WM stock’s outstanding share float is owned by institutional investors.

Waste Management, Inc. WM Stock As A Short-Term Trade Using Options

Traders with short time horizons can trade options to profit from WM stock’s price movements, while protecting their portfolio from volatility.

I am looking at the contracts with the 4/21 expiration date.

The $150, $145 & $135 call options are all in-the-money, listed from highest to lowest level of open interest.

The $160, $155 & $165 puts are also all in-the-money, listed from most to least liquid strike price.

Tying It All Together

WM stock has many interesting attributes that traders & investors will like.

Investors will like their sustainable dividend, as well as their P/E (ttm).

Traders will like their recent technical performance, as well as how liquid their options are.

Overall, it is worth taking a closer look into WM stock to see how it fits into your portfolio strategy.

*** I DO NOT OWN SHARES OR OPTIONS CONTRACTS IN WM STOCK AT THE TIME OF PUBLISHING THIS ARTICLE ***

DR Horton Inc. DHI Stock Analysis

DR Horton Inc. stock trades under the ticker DHI & has shown recent bullishness that traders & investors should research further into.

DHI stock closed at $94.94/share on 3/9/2023.

DR Horton Inc. DHI Stock’s Technical Performance Broken Down

DR Horton Inc. DHI Stock's Technical Performance Over The Past Year
DR Horton Inc. DHI Stock’s Technical Performance Over The Past Year

DHI Stock Price: $94.94

10 Day Moving Average: $92.10

50 Day Moving Average: $94.40

200 Day Moving Average: $79.61

RSI: 53.3

MACD: -0.693

Yesterday, DHI stock completed a bullish MACD crossover, gaining +1.23% on the day’s session.

Recent trading volumes have been slightly above average compared to the year prior & their RSI is neutral, but yesterday’s gap up with a shooting star candlestick implies that there will be near-term losses.

For this reason, it is smartest to wait & see how DHI stock’s support levels of $94.40 (50 day moving average), $92.22 & $92.10 (10 day moving average), while they try to break out & above their $103.88 resistance level.

DR Horton Inc. DHI Stock As A Long-Term Investment

Long-term oriented investors will like DHI stock’s valuation metrics, with a 5.68 P/E (ttm) & a 1.56 P/B (mrq).

Prospective investors may want to look into their recently reported 2.9% Quarterly Revenue Growth Y-o-Y, as well as their -16% Quarterly Earnings Growth Y-o-Y.

Their balance sheet will also require a more thorough examination, with $2.39B of Total Cash (mrq) & $5.75B of Total Debt (mrq).

DHI stock pays a 0.99% dividend, which appears to be sustainable in the long-run, as their payout ratio is 5.75%.

88.82% of DHI stock’s outstanding share float is owned by institutional investors.

DR Horton Inc. DHI Stock As A Short-Term Trade Using Options

Traders with shorter time horizons can trade options to profit from DHI stock’s price movements, while protecting their portfolio from volatlity.

I am looking at the contracts with the 4/21 expiration date.

The $92.50, $90, $87.50 & $85 call options are all in-the-money, listed from most to least liquid strike.

The $100, $95 & $97.50 puts are also all in-the-money, listed from highest to lowest level of open interest.

Tying It All Together

DHI stock has many unique characteristics that traders & investors are sure to like.

Investors will like their stable dividend, as well as their valuation metrics, but may want to look further into their balance sheet.

Traders will like their recent technical performance, as well as how liquid their options are.

All-in-all, it is worth taking a closer look into DHI stock to see how it fits into your portfolio strategy.

*** I DO NOT OWN SHARES OR OPTIONS CONTRACTS OF DHI STOCK AT THE TIME OF PUBLISHING THIS ARTICLE ***

Weis Markets, Inc. WMK Stock Analysis

Weis Markets, Inc. stock trades under the ticker WMK & has shown recent bullishness that traders & investors should research further into.

WMK stock closed at $81.87/share on 3/8/2023.

Weis Markets, Inc. WMK Stock’s Technical Performance Broken Down

Weis Markets, Inc. WMK Stock's Technical Performance Over The Past Year
Weis Markets, Inc. WMK Stock’s Technical Performance Over The Past Year

WMK Stock Price: $81.87

10 Day Moving Average: $80.41

50 Day Moving Average: $83.82

200 Day Moving Average: $80.38

Yesterday, WMK stock completed a bullish MACD crossover, gaining +0.97% on the day’s session.

Their RSI is neutral & recent trading volumes have been about average compared to the year prior, as they’ve spent the past week consolidating after some gains at the beginning of the month.

Their recent candlesticks imply that there is weakness on the horizon, which can provide a more opportune entry point for a position.

WMK stock has support at the $80.43, $80.41 (10 day moving average) & $80.38 (200 day moving average), as they try to break out above the $82.18, $82.59 & $83.82 (50 day moving average) resistance levels.

Weis Markets, Inc. WMK Stock As A Long-Term Investment

Long-term oriented investors will like WMK stock’s valuation metrics, with a 17.64 P/E (ttm) & a 1.64 P/B (mrq).

They recently reported 18% Quarterly Revenue Growth Y-o-Y, with 27.7% Quarterly Earnings Growth Y-o-Y.

Their balance sheet is also appealing, with $344.42M of Total Cash (mrq) & $185.95M of Total Debt (mrq).

WMK stock pays a 1.63% dividend, which appears to be sustainable in the long-run, as their payout ratio is 27.96%.

37.63% of WMK stock’s outstanding share float is owned by institutional investors.

Weis Markets, Inc. WMK Stock As A Short-Term Trade Using Options

Traders with shorter time horizons can use options to profit from WMK stock’s price movements, while protecting their portfolios from volatility.

I am looking at the contracts with the 4/21 expiration date.

The $75 & $80 call options are both in-the-money.

The $85 & $100 puts are also both in the money, listed from highest to lowest level of open interest.

Tying It All Together

WMK stock has many interesting characteristics that traders & investors will find appealing.

Investors will like their balance sheet, as well as their dividend yield.

Traders will like their recent technical performance, but may wish their options had more liquidity.

Overall, it is worth taking a closer look into how WMK stock fits into your portfolio strategy.

*** I DO NOT OWN SHARES OR OPTIONS CONTRACT POSITIONS IN WMK STOCK AT THE TIME OF PUBLISHING THIS ARTICLE ***

Texas Instruments, Inc. TXN Stock Analysis

Texas Instruments, Inc. stock trades under the ticker TXN & has shown recent bullishness that traders & investors should look closer into.

TXN stock closed at $176.22/share on 3/8/2023.

Texas Instruments, Inc. TXN Stock’s Technical Performance Broken Down

Texas Instruments, Inc. TXN Stock's Technical Performance Broken Down
Texas Instruments, Inc. TXN Stock’s Technical Performance Broken Down

TXN Stock Price: $176.22

10 Day Moving Average: $172.64

50 Day Moving Average: $173.42

200 Day Moving Average: $166.34

RSI: 54.06

MACD: -0.357

Yesterday, TXN stock completed a bullish MACD crossover, gaining +2.42% on the day’s session.

Recent trading volumes have been about average compared to the year prior & their RSI is neutral, after they’ve spent much of the last month in a consolidation range.

TXN stock has support at the $174.54, $173.47 & $173.42 (50 day moving average), as they try to break out above their $176.50, $177.36 & $179.89/share resistance levels.

Texas Instruments, Inc. TXN Stock As A Long-Term Investment

Long-term oriented investors will like TXN stock’s 18.39 P/E (ttm), but may find their 10.76 P/B (mrq) to be a bit rich.

Investors should look for more reasons behind their recently reported -3.4% Quarterly Revenue Growth Y-o-Y, as well as their -8.2% Quarterly Earnings Growth Y-o-Y.

Their balance sheet looks appealing, with $9.07B of Total Cash (mrq) & $9.15B of Total Debt (mrq).

TXN stock pays a 2.73% dividend, which appears to be sustainable in the long-run, as their payout ratio is 49.84%.

88% of TXN stock’s outstanding share float is owned by institutional investors.

Texas Instruments, Inc. TXN Stock As A Short-Term Trade Using Options

Traders with shorter time horizons can trade options to profit from price movements in TXN stock’s price, while protecting their portfolio from volatility.

I am looking at the contracts with the 4/21 expiration date.

The $175, $170 & $160 call options are all in-the-money, listed from highest to lowest level of open interest.

The $180, $185 & $190 puts are also all in-the-money, with the former strike being more liquid than the latter two.

Tying It All Together

TXN stock has many interesting characteristics that traders & investors are sure to find appealing.

Investors will like their balance sheet & dividend yield, but may want to look deeper into their recent growth metrics.

Traders will like their recent technical performance & how liquid their options are.

All-in-all, it is worth taking a closer look into TXN stock to see how it fits into your portfolio strategy.

*** I DO NOT OWN SHARES OR OPTIONS CONTRACT POSITIONS IN TXN STOCK AT THE TIME OF PUBLISHING THIS ARTICLE ***

Starwood Property Trust Inc. STWD Stock Analysis

Starwood Property Trust Inc. stock trades under the ticker STWD & has shown recent bullish behavior that traders & investors should research further into.

STWD stock closed at $20.10/share on 3/7/2023.

Starwood Property Trust Inc. STWD Stock’s Technical Performance Broken Down

Starwood Property Trust Inc. STWD Stock's Technical Performance Over The Past Year
Starwood Property Trust Inc. STWD Stock’s Technical Performance Over The Past Year

STWD Stock Price: $20.10

10 Day Moving Average: $19.58

50 Day Moving Average: $19.84

200 Day Moving Average: $20.44

RSI: 52.16

MACD: -0.106

Yesterday, STWD stock completed a bullish MACD crossover, despite falling -2.24% on the day’s session.

Their RSI is neutral & their recent trading volumes have been higher than usual.

The momentum behind their MACD crossover is mostly due to their bullish gap up on Monday, and traders & investors would be wise to wait to see how they perform in the coming days to see if the gap is not filled due to external macro conditions impacting the stock.

STWD stock has support at the $20.10 price level where they currently sit, as well as at the $19.84 (50 day moving average), $19.58 (10 day moving average) & $19.50/share price levels, as they try to break out above their $20.36, $20.37, $20.41 & $20.44 (200 day moving average)/share price levels.

Starwood Property Trust Inc. STWD Stock As A Long-Term Investment

Investors with longer time horizons will like STWD stock’s valuation metrics, with a 7.42 P/E (ttm) & a 0.93 P/B (mrq).

They recently reported -13.2% Quarterly Revenue Growth Y-o-Y, with 53.1% Quarterly Earnings Growth Y-o-Y.

Their balance sheet will require a closer examination before investment, with $369.68M of Total Cash (mrq) & $20.64B of Total Debt (mrq).

STWD stock pays a 9.34% dividend, which may not be sustainable at such a high level for the long-run, as their payout ratio is 70.07%.

46.12% of STWD stock’s outstanding share float is owned by institutional investors.

Starwood Property Trust Inc. STWD Stock As A Short-Term Trade Using Options

Traders with shorter time horizons can trade options to profit from STWD stock’s price movements, while protecting their portfolios from volatility.

I am looking at the contracts with the 4/21 expiration date.

The $20, $18 & $19 call options are in-the-money, listed from highest to lowest level of open interest.

The $21, $24 & $23 puts are also all in-the-money, with the former being more liquid than the latter strikes.

Tying It All Together

STWD stock has many interesting characteristics that traders & investors are sure to find appealing.

Investors will like their valuation metrics and dividend yield, but may want to look for clues into its sustainability over the long-run.

Traders will like their recent technical performance & how liquid their options are.

All-in-all, it is worth taking a closer look into STWD stock to see how it fits into your portfolio strategy.

*** I DO NOT OWN SHARES OR OPTIONS CONTRACT POSITIONS IN STWD AT THE TIME OF PUBLISHING THIS ARTICLE ***

CNH Industrial NV CNHI Stock Analysis

CNH Industrial NV stock trades under the ticker CNHI & has shown recent bullishness that traders & investors should research further into.

CNHI stock closed at $16.82/share on 2/23/2023.

CNH Industrial NV CNHI Stock’s Technical Performance Broken Down

CNH Industrial NV CNHI Stock's Technical Performance Over The Past Year
CNH Industrial NV CNHI Stock’s Technical Performance Over The Past Year

CNHI Stock Price: $16.82

10 Day Moving Average: $16.39

50 Day Moving Average: $16.55

200 Day Moving Average: $13.94

RSI: 54.39

MACD: -0.048

Yesterday, CNHI stock completed a bullish MACD crossover, gaining +2.5% on the day’s session.

Recent trading volumes have been about average compared to the year prior & their RSI is neutral.

They have climbed steadily in February, but are signaling near-term weakness, which investors & traders can use to get a more favorable entrypoint.

Using the past 52 week’s data, CNHI stock has support at the $16.55 (50 day moving average), $16.54 & $16.39/share price levels, as they try to break out above their $17.98/share resistance level.

CNH Industrial NV CNHI Stock As A Long-Term Investment

Long-term oriented investors will like CNHI stock’s 11.01 P/E (ttm), but may find their 3.18 P/B (mrq) to be a bit too rich.

They recently reported -23.5% Quarterly Revenue Growth Y-o-Y, with 96% Quarterly Earnings Growth Y-o-Y, which investors may want to look into with more detail.

Their balance sheet also warrants a closer review, with $3.8B of Total Cash (mrq) & $22.96B of Total Debt (mrq).

CNHI stock pays a 2.32% dividend, which appears sustainable in the long-run, as their payout ratio is 19.81%.

50.12% of CNHI stock’s outstanding share float is owned by institutional investors.

CNH Industrial NV CNHI Stock As A Short-Term Trade Using Options

Traders with shorter time horizons can use options to profit from CNHI stock’s price movements, while protecting their portfolios from volatility.

I am looking at the contracts with the 3/17 expiration date.

The $15, $12.50 & $10 call options are all in-the-money, with the former strike prices being more liquid than the latter ones.

The $17.50 puts are also in-the-money.

Tying It All Together

CNHI stock has many unique attributes that traders & investors will find appealing.

Investors will like their stable dividend yield, as well as their valuation metrics.

Traders will like their recent technical performance.

Overall, it is worth taking a closer look into CNHI stock to see how it fits into your portfolio strategy.

*** I DO NOT OWN SHARES OR OPTIONS CONTRACTS IN CNHI STOCK AT THE TIME OF PUBLISHING THIS ARTICLE ***

Tyson Foods Inc. TSN Stock Analysis

Tyson Foods Inc. stock trades under the ticker TSN & has shown recent bullishness that traders & investors should research further into.

TSN stock closed at $62.36/share on 2/23/2023.

Tyson Foods Inc. TSN Stock’s Technical Performance Broken Down

Tyson Foods Inc. TSN Stock's Technical Performance Over The Past Year
Tyson Foods Inc. TSN Stock’s Technical Performance Over The Past Year

TSN Stock Price: $62.36

10 Day Moving Average: $61.10

50 Day Moving Average: $63.18

200 Day Moving Average: $72.72

RSI: 49.31

MACD: -0.761

Yesterday, TSN stock completed a bullish MACD crossover, gaining +1% on the day’s session.

Recent trading volumes have been above average compared to the year prior & their RSI is neutral.

However, recent days’ candlesticks are signaling that there is more short-term losses on the horizon, which provide opportunity for more favorable entry points for traders & investors.

TSN stock has support at the $61.10, $59.65 & $59.38/share price level, as they try to break out above their $62.49, $63.01 & $63.16/share resistance levels.

Tyson Foods Inc. TSN Stock As A Long-Term Investment

Long-term oriented investors will like TSN stock’s valuation metrics, with a 9.17 P/E (ttm) & a 1.12 P/B (mrq).

They recently reported 2.5% Quarterly Revenue Growth Y-o-Y, with -71.8% Quarterly Earnings Growth Y-o-Y, which investors may want to get a better understanding about.

Their balance sheet will also require a more thorough examination, with $656M of Total Cash (mrq) & $8.35B of Total Debt (mrq).

TSN stock pays a 3.01% dividend, which appears to be sustainable in the long run as their payout ratio is 27.64%.

85.16% of TSN stock’s outstanding share float is owned by institutional investors.

Tyson Foods Inc. TSN Stock As A Short-Term Trade Using Options

Traders with shorter time horizons can use options to profit from TSN stock’s price movements, while protecting their portfolio from volatility.

I am looking at the contracts with the 3/17 expiration date.

The $60, $55 & $57.50 call options are all in-the-money, listed from highest to lowest level of open interest.

The $62.50, $65 & $67.50 puts are also all in-the-money, with the former being more liquid than the latter two strikes.

Tying It All Together

TSN stock has many interesting characteristics that traders & investors should look closer into.

Investors will like their valuation metrics & dividend yield, but may want to research their balance sheet structure in more detail before investing.

Traders will like their recent technical performance, as well as how liquid their options are.

Overall, it is worth taking a closer look into how TSN stock fits into your portfolio strategy.

*** I DO NOT OWN SHARES OR OPTIONS CONTRACTS IN TSN STOCK AT THE TIME OF PUBLISHING THIS ARTICLE ***

Anheuser-Busch InBev ADR BUD Stock Analysis

Anheuser-Busch InBev ADR stock trades under the ticker BUD & has shown recent bullishness that traders & investors should research further into.

BUD stock closed at $59.10/share on 2/21/2023.

Anheuser-Busch InBev ADR BUD Stock’s Technical Performance Broken Down

Anheuser-Busch InBev ADR BUD Stock's Technical Performance Over The Past Year
Anheuser-Busch InBev ADR BUD Stock’s Technical Performance Over The Past Year

BUD Stock Price: $59.10

10 Day Moving Average: $58.66

50 Day Moving Average: $59.76

200 Day Moving Average: $54.25

RSI: 49.63

MACD: -0.193

Yesterday, BUD stock completed a bullish MACD crossover, gaining +0.48% on the day’s session.

Their recent trading volumes have been below average compared to the year prior & their RSI is neutral, as their price has spent the past few months consolidating.

Recent technical indicators signal that there may be near-term losses on the horizon for BUD, which can provide better entry points for traders & investors.

BUD stock has support at the $58.66 (10 day moving average), $58.37 & $57.79/share price levels, as they try to break out & above their $59.76 (50 day moving average), $61.89 & $61.96/share resistance levels.

Anheuser-Busch InBev ADR BUD Stock As A Long-Term Investment

Long-term oriented investors will like BUD stock’s 23.74 P/E (ttm) & 1.63 P/B (mrq).

They recently reported 5.7% Quarterly Revenue Growth Y-o-Y & 473.2% Quarterly Earnings Growth Y-o-Y.

Their balance sheet will require a more thorough examination, with $7.36B of Total Cash (mrq) & $83.53B of Total Debt (mrq).

BUD stock offers a modest 0.97% dividend, which appears sustainable in the long-run, as their payout ratio is 21.9%.

6.28% of BUD stock’s outstanding share float is owned by institutional investors.

Anheuser-Busch InBev ADR BUD Stock As A Short-Term Trade Using Options

Traders with shorter time horizons can trade options to profit from BUD stock’s price movements, while protecting their portfolio from volatility.

I am looking at the contracts with the 3/17 expiration date.

The $55 & $59 call options are both in-the-money, with the former being more liquid than the latter strike.

The $60 puts are also in-the-money.

With weekly expirations, there will likely be more contracts written for this date as other contracts expire.

Tying It All Together

BUD stock has many interesting characteristics that traders & investors will find appealing.

Investors will like their valuation metrics & dividend, but may want to look closer into their balance sheet before investing.

Traders will like their recent technical performance, as well as their weekly option expirations.

Overall, it is worth taking a closer look into BUD stock to see how it fits into your portfolio strategy.

*** I DO NOT OWN SHARES OF BUD STOCK OR OPTIONS AT THE TIME OF PUBLISHING THIS ARTICLE ***

ConAgra Brands Inc. CAG Stock Analysis

ConAgra Brands Inc. stock trades under the ticker CAG & has shown recent bullishness that traders & investors should look deeper into.

CAG stock closed at $36.36/share on 2/21/2023.

ConAgra Brands Inc. CAG Stock’s Technical Performance Broken Down

ConAgra Brands Inc. CAG Stocks' Technical Performance Over The Past Year
ConAgra Brands Inc. CAG Stocks’ Technical Performance Over The Past Year

CAG Stock Price: $36.36

10 Day Moving Average: $36.22

50 Day Moving Average: $37.75

200 Day Moving Average: $34.75

RSI: 44.51

MACD: -0.449

Yesterday, CAG stock completed a bullish MACD crossover, dropping -0.14% on the day’s session.

Recent trading volumes have been about average compared to the year prior & their RSI is neutral, as the stock has been consolidating over the last couple of weeks.

Recent candlesticks are signaling future declines in the near-term, which can provide more favorable entry points for traders & investors.

CAG stock has support at the $36.22 (10 day moving average), $35.67 & $35.65/share price levels, as they try to break out above their $36.44, $37.75 (50 day moving average) & $40.93/share resistance levels.

ConAgra Brands Inc. CAG Stock As A Long-Term Investment

Long-term focused investors will like CAG stock’s valuation metrics, with a 25.4 P/E (ttm) & a 1.97 P/B (mrq).

They recently reported 8.3% Quarterly Revenue Growth Y-o-Y, with 38.6% Quarterly Earnings Growth Y-o-Y.

Their balance sheet will require a more thorough examination, with $39.7M of Total Cash (mrq) & $9.65B of Total Debt (mrq).

CAG stock pays a 3.53% dividend, which may not be sustainable in the long-run, as their payout ratio is 91.13%.

85.3% of CAG stock’s outstanding share float is owned by institutional investors.

ConAgra Brands Inc. CAG Stock As A Short-Term Trade Using Options

Traders with shorter time horizons can use options to profit from price movements in CAG stock, while protecting their portfolio from volatlity.

I am looking at the contracts with the 3/17 expiration date.

The $36, $34 & $35 call options are all in-the-money, listed from highest to lowest level of open interest.

The $37, $38 & $40 puts are also all in-the-money, with the former being more liquid than the latter strikes.

Tying It All Together

CAG stock has many interesting attributes that traders & investors are sure to like.

Investors will like their valuation metrics, but may want to look deeper into the status of their dividend’s sustainability, as well as their balance sheet before investing.

Traders will like their recent technical performance & weekly options expiration dates.

All-in-all, it is worth taking a closer look into CAG stock to see how it fits into your portfolio strategy.

*** I DO NOT OWN SHARES OR OPTIONS CONTRACTS IN CAG STOCK AT THE TIME OF PUBLISHING THIS ARTICLE ***