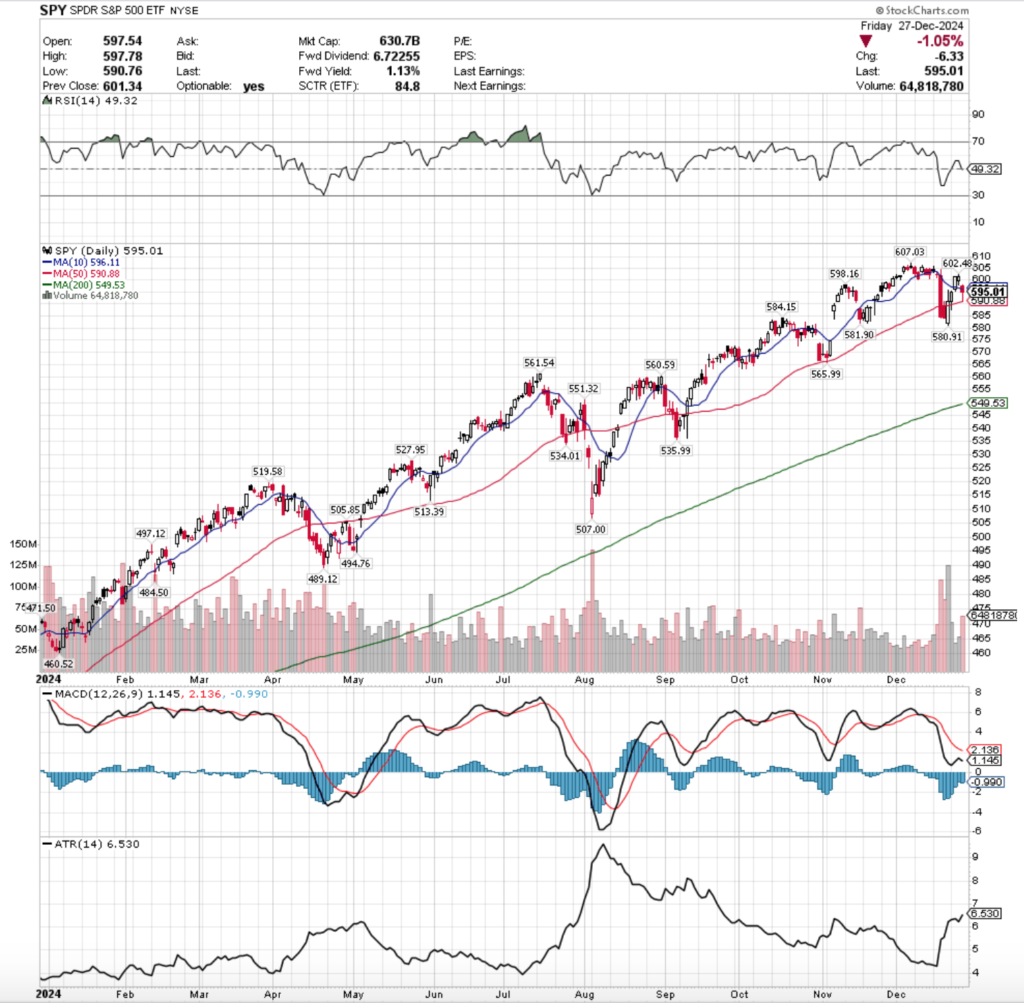
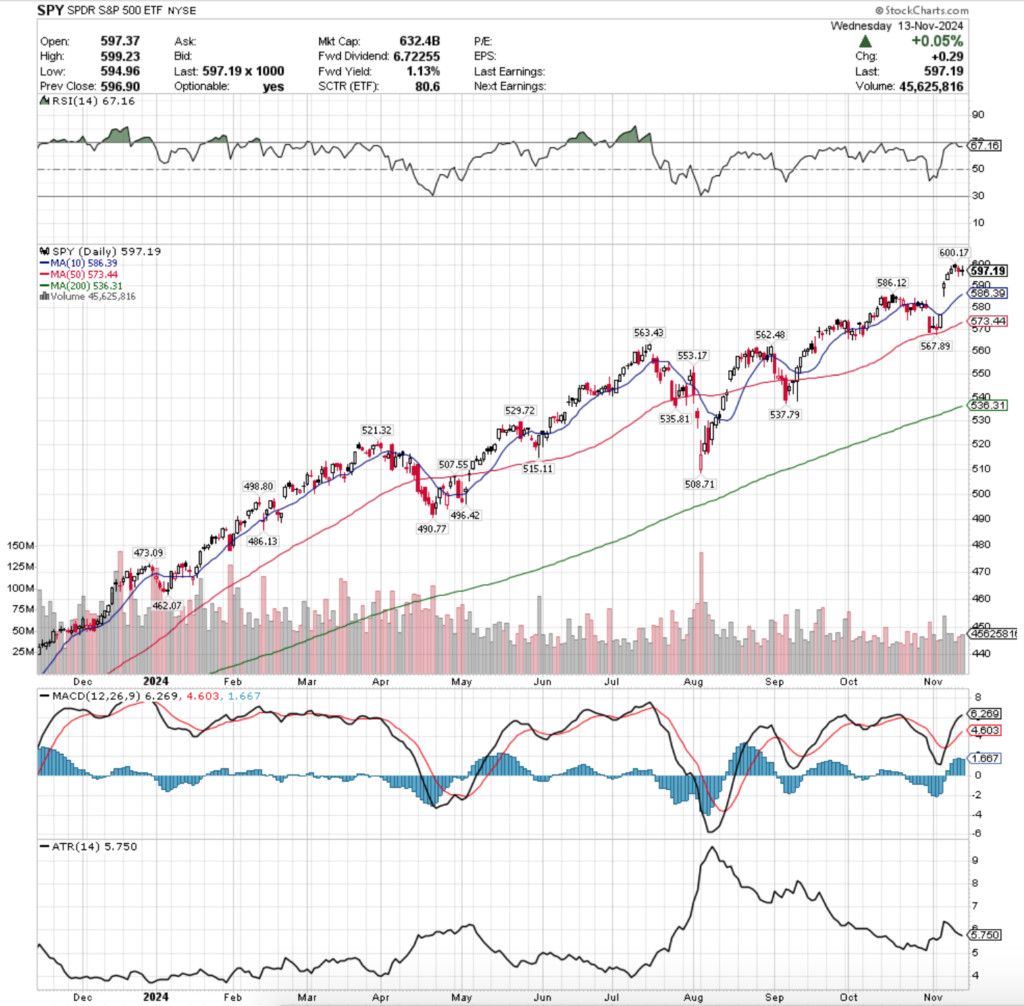
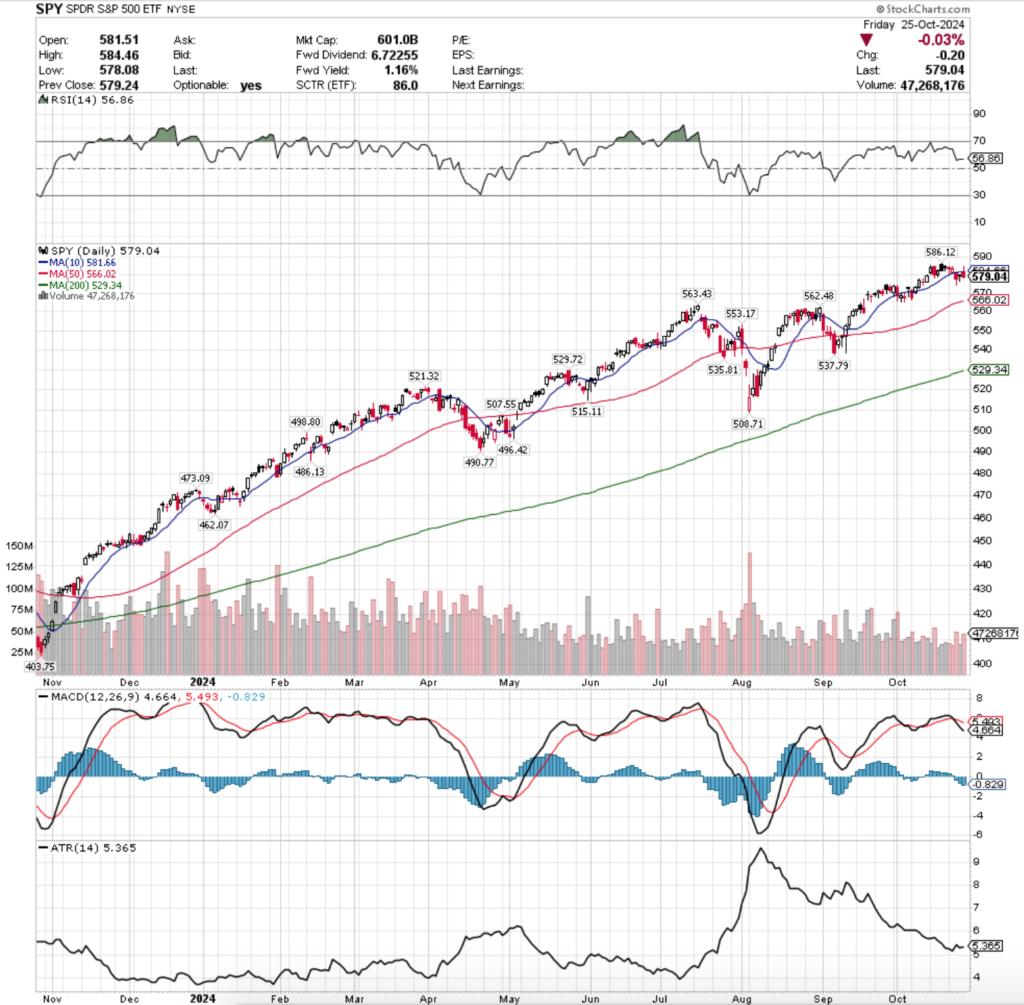
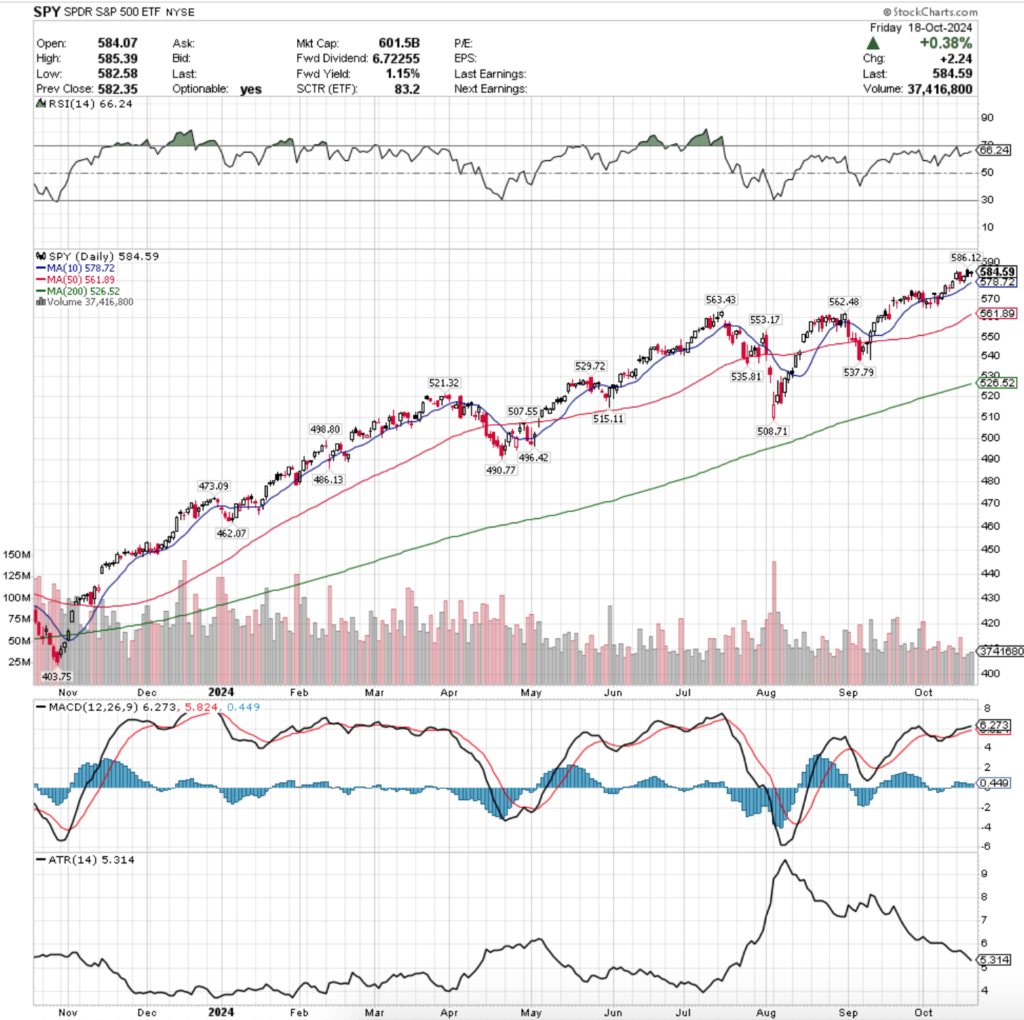
SPY, the SPDR S&P 500 ETF added +0.65% last week, while the VIX closed at 15.95, indicating an implied one day move of +/-1.01% & a one month implied move of +/-4.61%.
SPY ETF – SPDR S&P 500 ETF’s Technical Performance Over The Past Year
Their RSI just broke bearishly through the neutral 50 level & sits currently at 49.32, while their MACD has resumed its bearish descent.
Volumes were -14.68% lower than the prior year’s average (49,277,500 vs. 57,755,675), which is notable as Friday’s declining session had the highest volume of the shortened holiday week.
Monday continued the short-term reversal that was set into motion with the prior Friday’s breakout above the 50 day moving average’s resistance.
It should be noted though that the fragility noted in last week’s note was still in play on Monday, as the session opened above the 50 DMA’s support, but temporarily dipped below it, indicating that there was still downside appetite among investors, despite SPY powering higher to close close to the 10 DMA’s resistance.
Tuesday opened on a gap up to just below the 10 DMA, before powering higher to close above it, however the volume was weak, which can be attributed to the shortened trading session.
Christmas was Wednesday so there was no trading, but Thursday signaled that weakness was setting in.
Thursday SPY opened slightly lower, tested down to midway down Tuesday’s candle’s real body, before testing slightly above its close & settling marginally up for the day.
This set up Friday’s opening gap down to complete an evening star bearish pattern, as Friday opened just above the 10 DMA’s support, before breaking all the way down to the 50 DMA & settling down for the day on the week’s highest volume.
As noted in last week’s market note, the relationship between price & the 10 & 50 day moving averages will still be an area to focus on heading into the new year.
While volumes last week were higher relative to the weekly volumes of the past few months, they still were not high enough to drive a meaningful upward movement that would gather any traction.
Without seeing a meaningful increase in upside volume the evening star pattern will be in main focus moving into this week & next, particularly given how much profit taking took place on Friday.
As of writing this the 50 DMA’s support broke down already, leaving less support levels between SPY’s price & the long term trend (200 DMA).
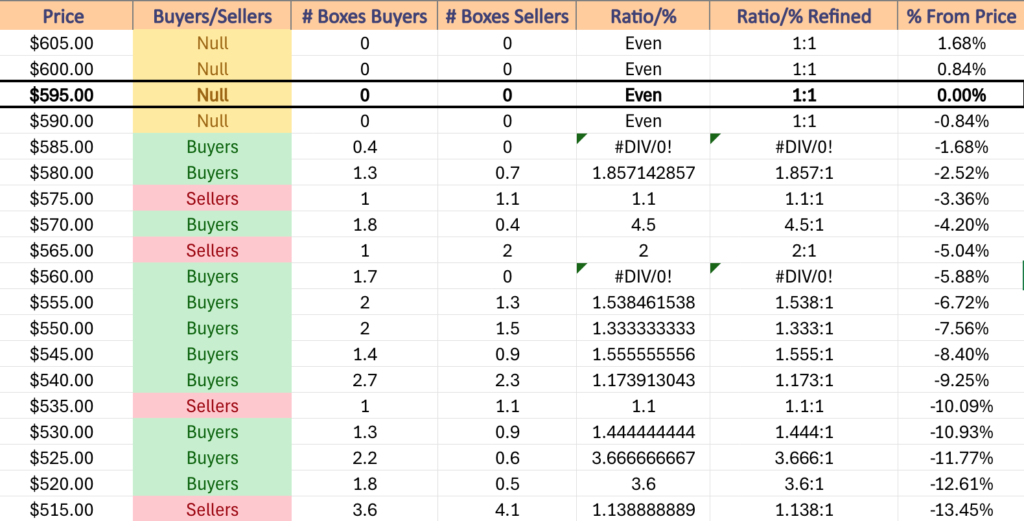
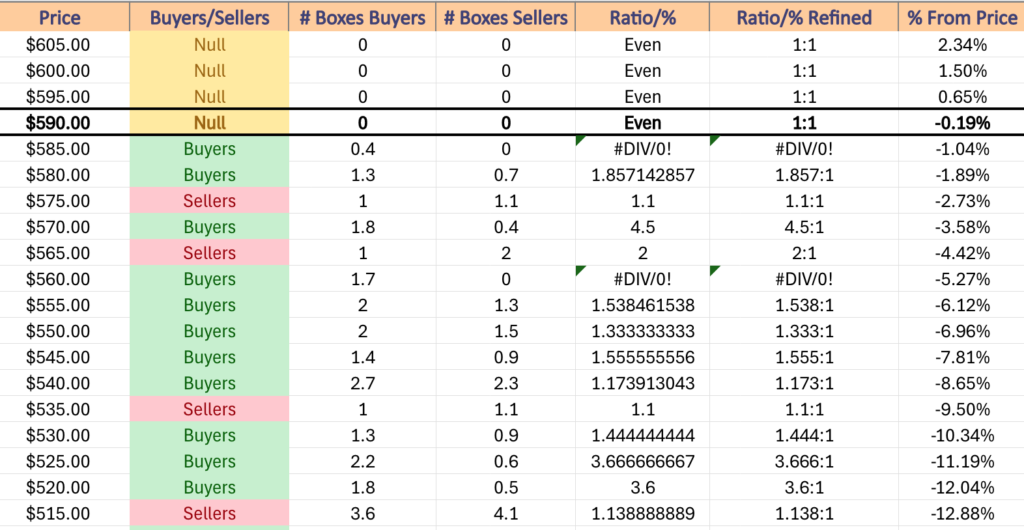
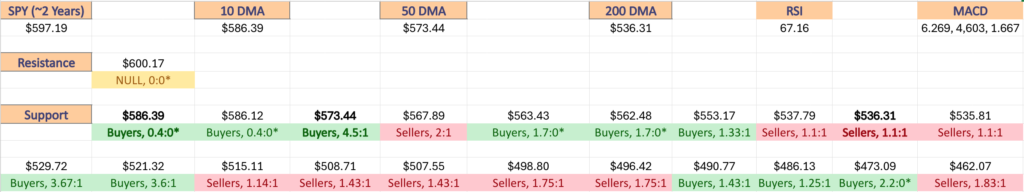
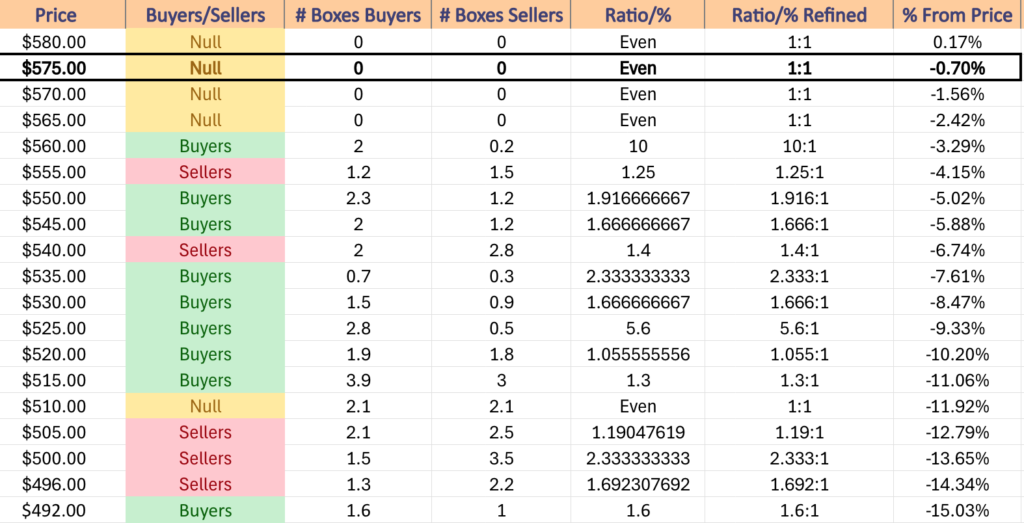
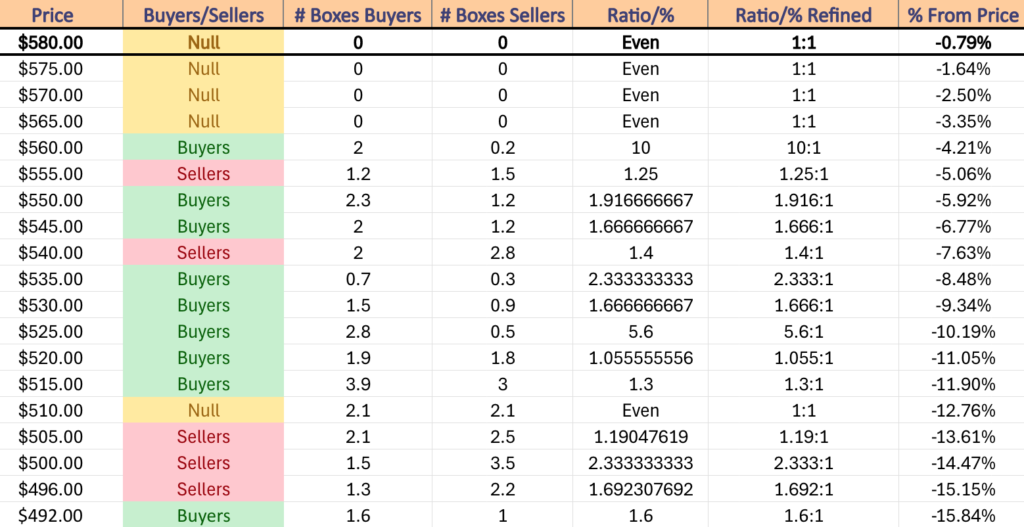
Should prices test the $580-584.99 price level they should have strong support given that there are three touch-points in that zone & that it has historically been dominated by Buyers at a rate of 1.86:1.
Should that break down the $570-579.99 price zones will be interesting to watch, as there are no formal support levels in that range, but there is Buyer dominated support at $570-574.99/share at a rate of 4.5:1.
If that window breaks down there is no support until $565.99/share, which occurs in a Seller dominated zone at a rate of 2:1 historically over the past ~2 years.
Declining to that support level would be a ~-5% decline from Friday’s close, and would open up SPY to further near-term declines based on support levels, which will be examined in more detail in next week’s note.
SPY has support at the $590.88 (50 Day Moving Average, Volume Sentiment: NULL, 0:0*), $584.15 (Volume Sentiment: Buyers, 1.86:1), $581.90 (Volume Sentiment: Buyers, 1.86:1) & $580.91/share (Volume Sentiment: Buyers, 1.86:1) price levels & resistance at the $596.11 (10 Day Moving Average, Volume Sentiment: NULL, 0:0*), $598.16 (Volume Sentiment: NULL, 0:0*), $602.48 (Volume Sentiment: NULL, 0:0*) & $607.03/share (All-Time High, Volume Sentiment: NULL, 0:0*) price levels.
SPY ETF’s Price Level:Volume Sentiment Over The Past ~2 Years
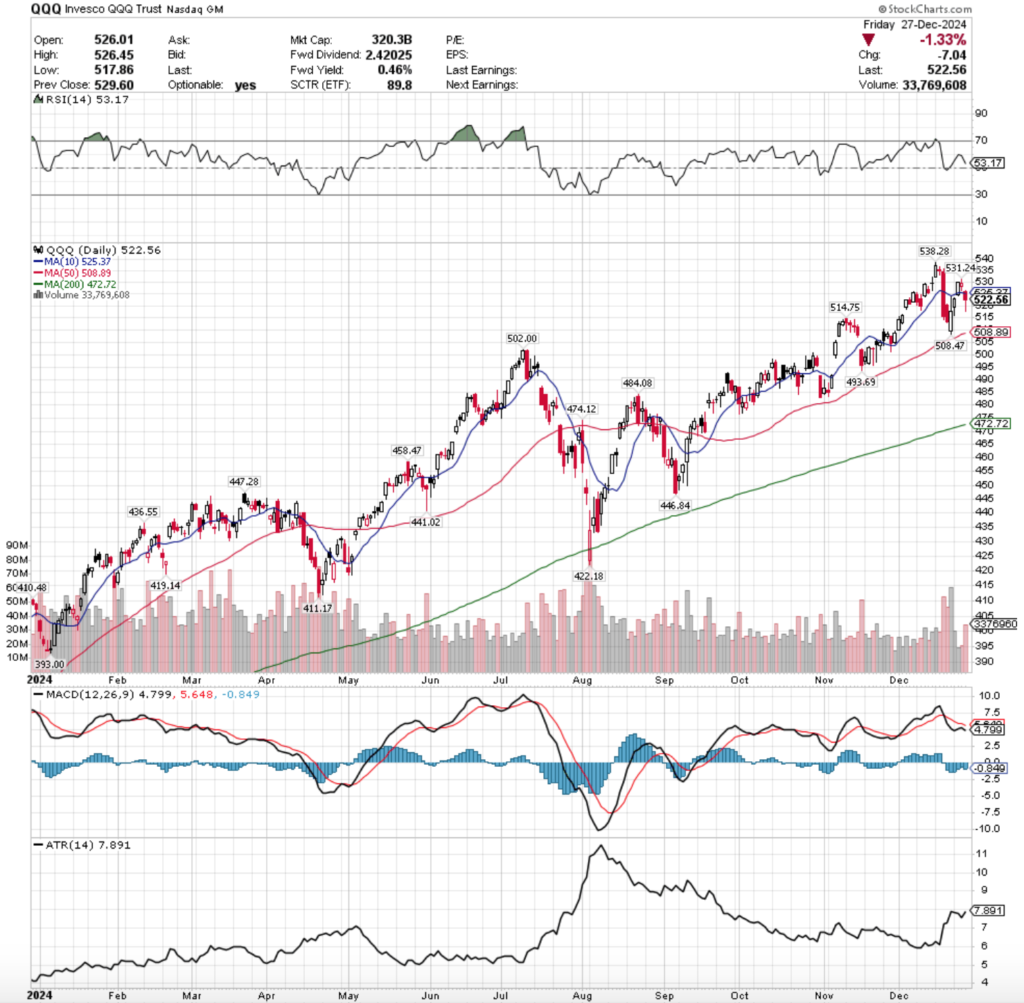
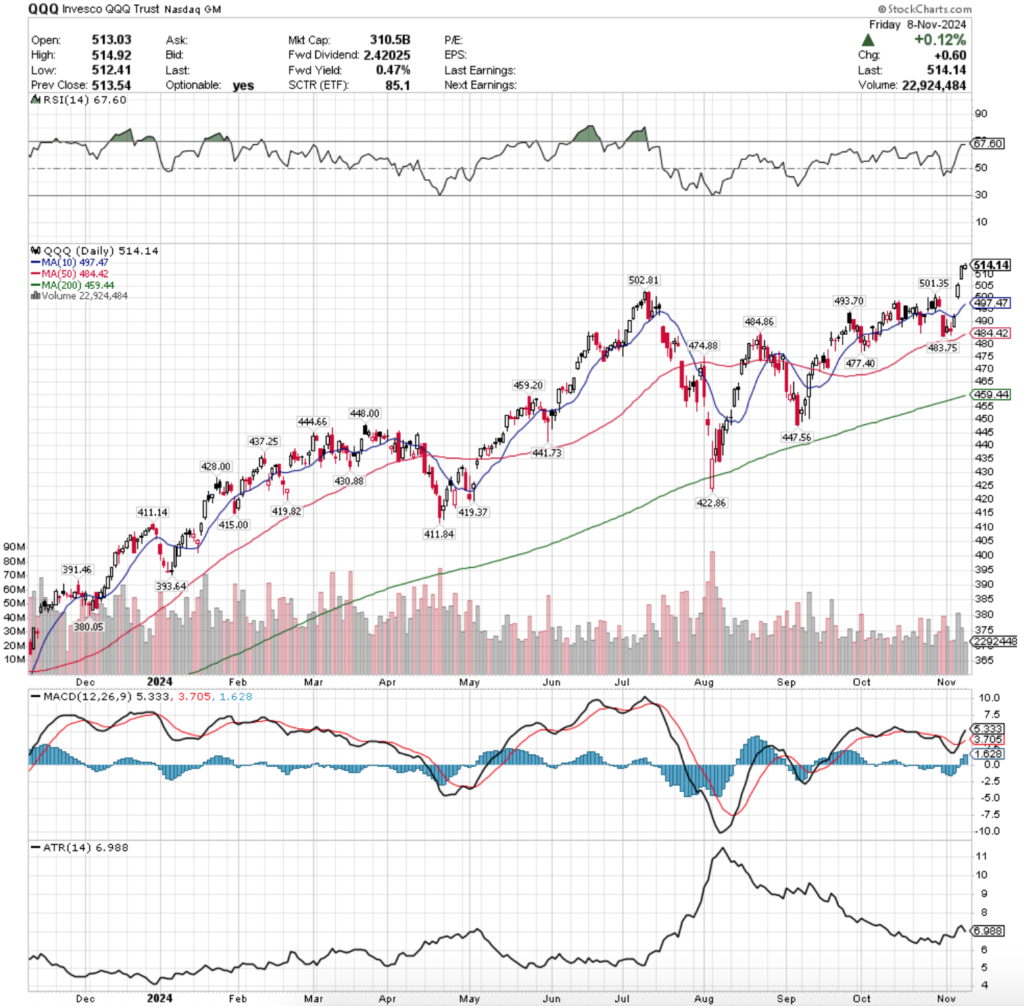
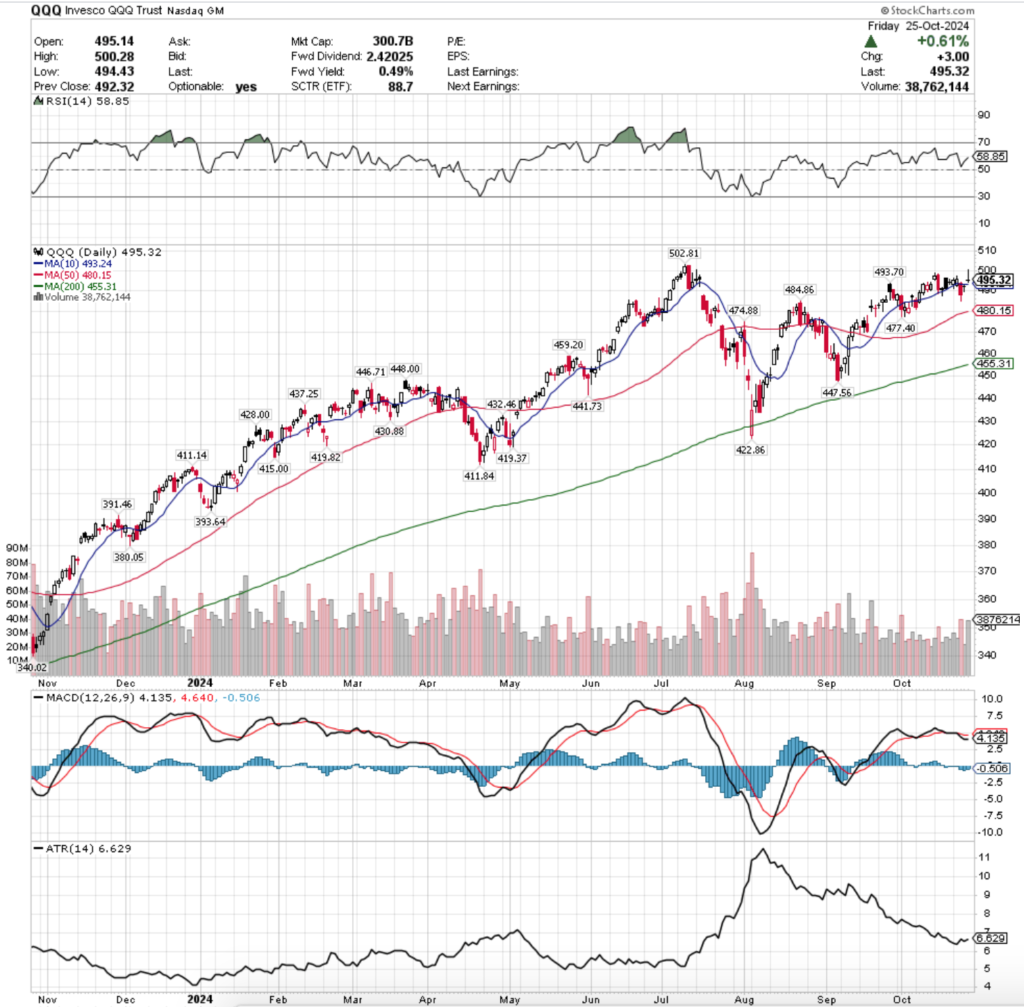
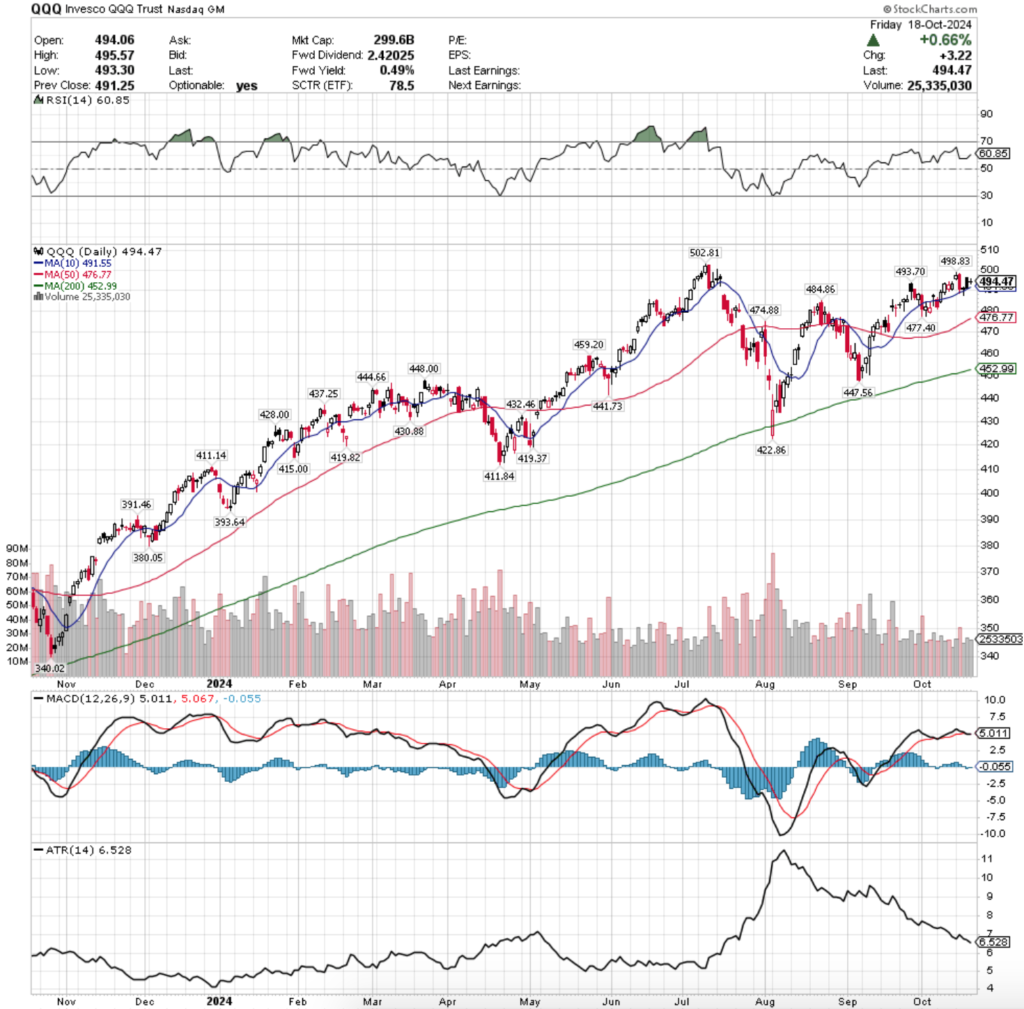
QQQ, the Invesco QQQ Trust ETF advanced +0.75% last week, as the tech heavy index was the most favored of the major four index ETFs.
QQQ ETF – Invesco QQQ Trust ETF’s Technical Performance Over The Past Year
Their RSI is bearishly approaching the neutral 50 mark & sits currently at 53.17, while their MACD is continuing bearishly lower.
Volumes were -32.54% lower than the prior year’s average level (25,052,500 vs. 37,137,143), as market participants were very cautious to approach the tech heavy index.
Much like last week, QQQ’s chart is quite similar this week to SPY’s, as Monday kicked off continuing the ascent of Friday’s session on an opening gap up that temporarily retraced into Friday’s range, before climbing to close the day higher.
Tuesday opened on a gap up that opened near the 10 day moving average’s resistance & managed to break out above it to close higher on the day, but on the lowest volume of the week, indicating that there was waning sentiment among market participants.
Thursday was also a low volume session that opened lower, tested midway through Tuesday’s trading range, before testing slightly higher & closing above its open, but still as a declining session.
The indecision shown by the spinning top candle & low volume set up QQQ for Friday’s gap down session to complete the evening star pattern, as Friday opened just above the 10 day moving average’s support before breaking down through it & testing lower than Monday’s opening price for QQQ.
While it managed to close above Monday’s closing price, there was a big warning sign flashed last week, which will bring all attention to QQQ’s price & the relationship between it & the 10 & 50 day moving averages.
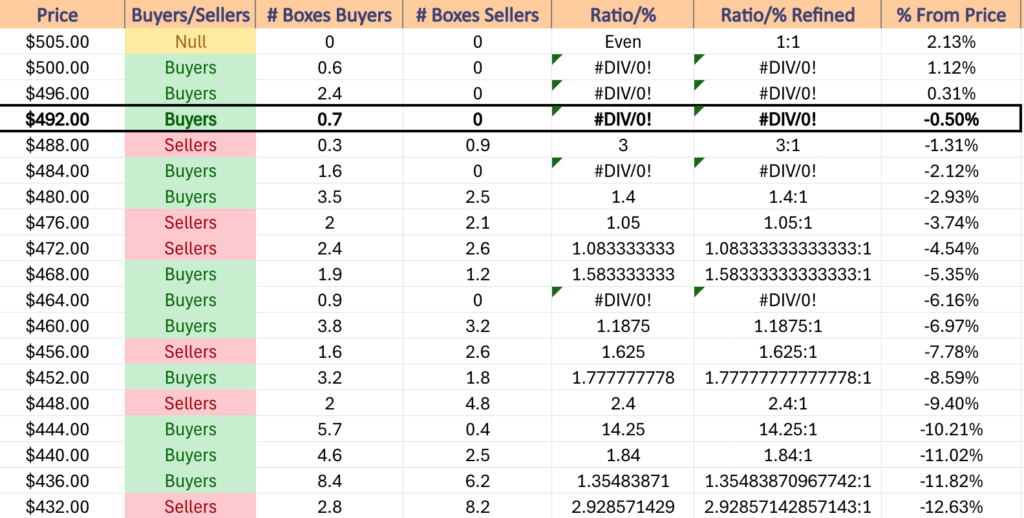
Should the support of the 50 DMA break down for QQQ, as per Friday’s closing price levels there was only a -7.11% spread between the two support levels, which should the top one break down may indicate trouble on the horizon.
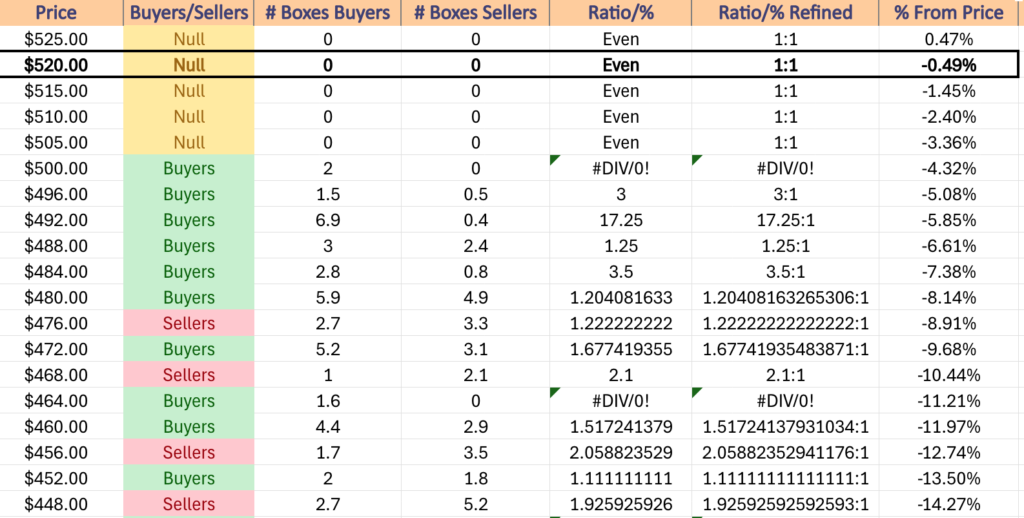
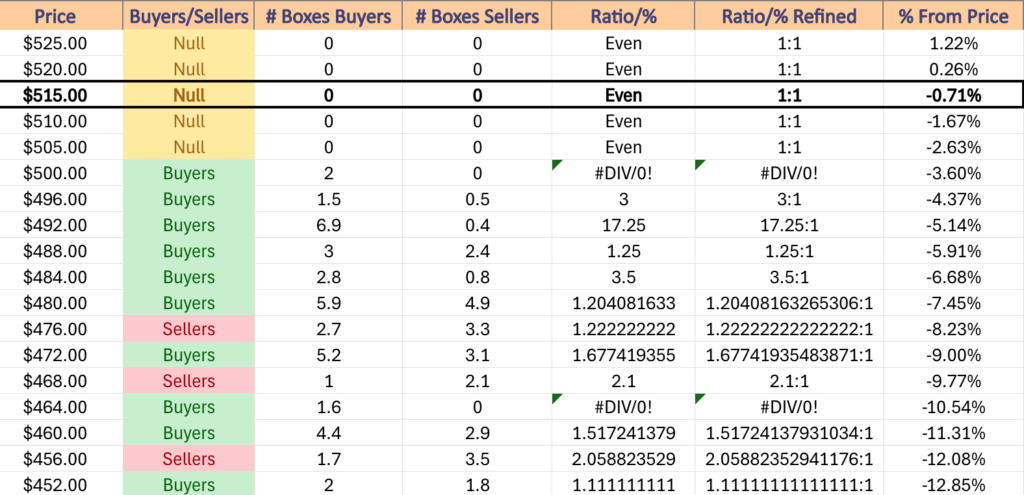
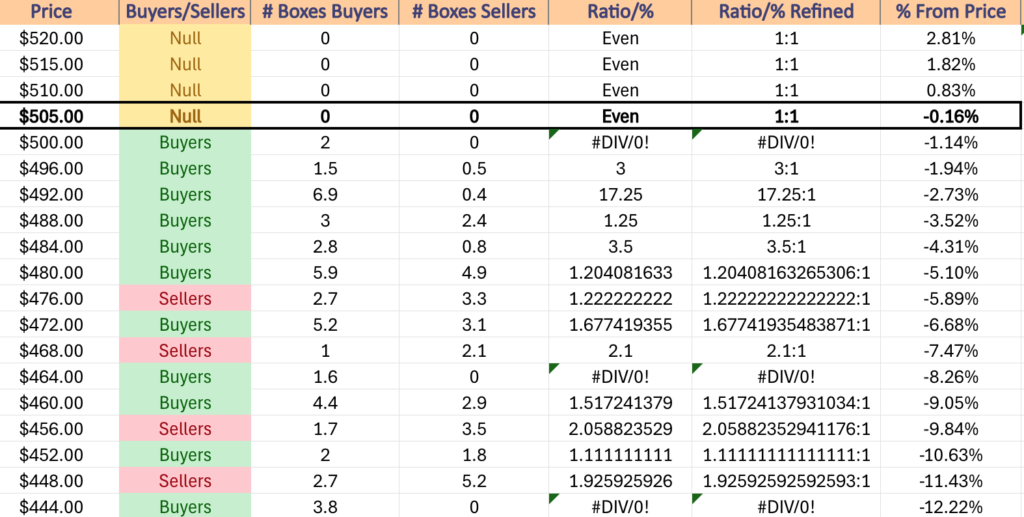
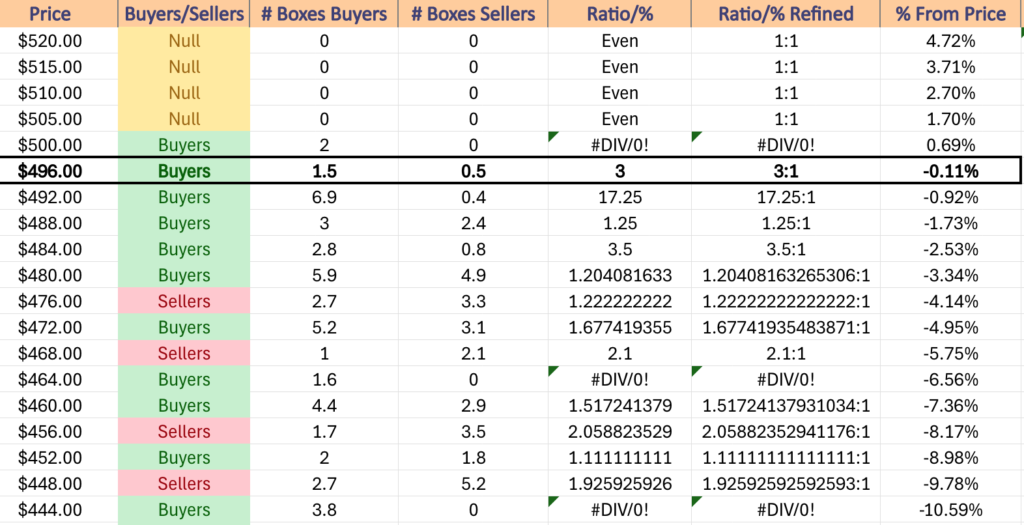
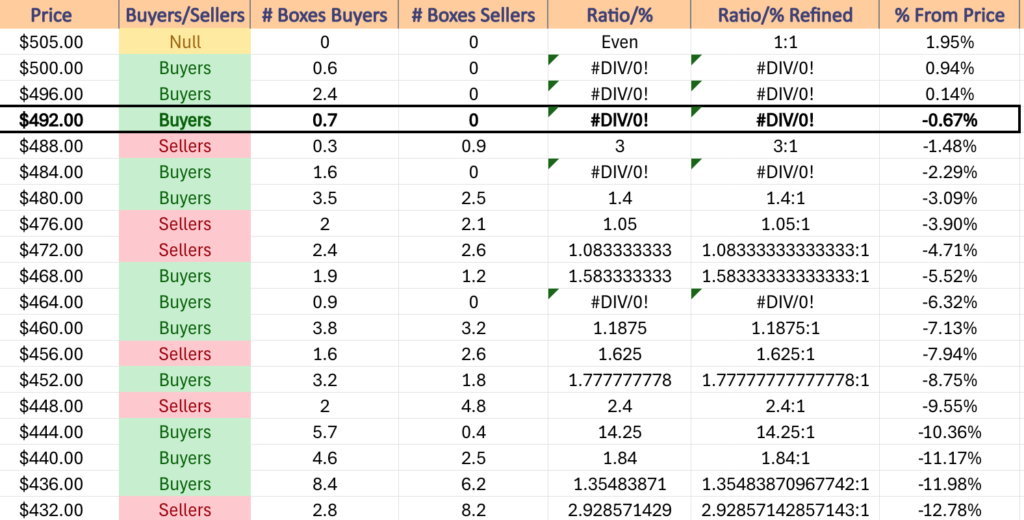
This is especially true if the $493.69/share support level breaks down, as it lies in the $492-495.99/share price zone which is the strongest Buyer:Seller zone for QQQ, where Buyers have historically exceeded Sellers 17.25:1.
If this breaks down then there is a severe reversal in sentiment, as most price action around this area has tended to result in gaps up or down around the zone, with limited trading activity within it (most of which is clearly advancing).
QQQ has support at the $514.75 (Volume Sentiment: NULL, 0:0*), $508.89 (50 Day Moving Average, Volume Sentiment: NULL, 0:0*), $508.47 (Volume Sentiment: NULL, 0:0*) & $502.00/share (Volume Sentiment: Buyers, 2:0*) price levels & resistance at the $525.37 (10 Day Moving Average, Volume Sentiment: NULL, 0:0*), $531.24 (Volume Sentiment: NULL, 0:0*) & $538.28/share (All-Time High, Volume Sentiment: NULL, 0:0*) price levels.
QQQ ETF’s Price Level:Volume Sentiment Over The Past ~2 Years
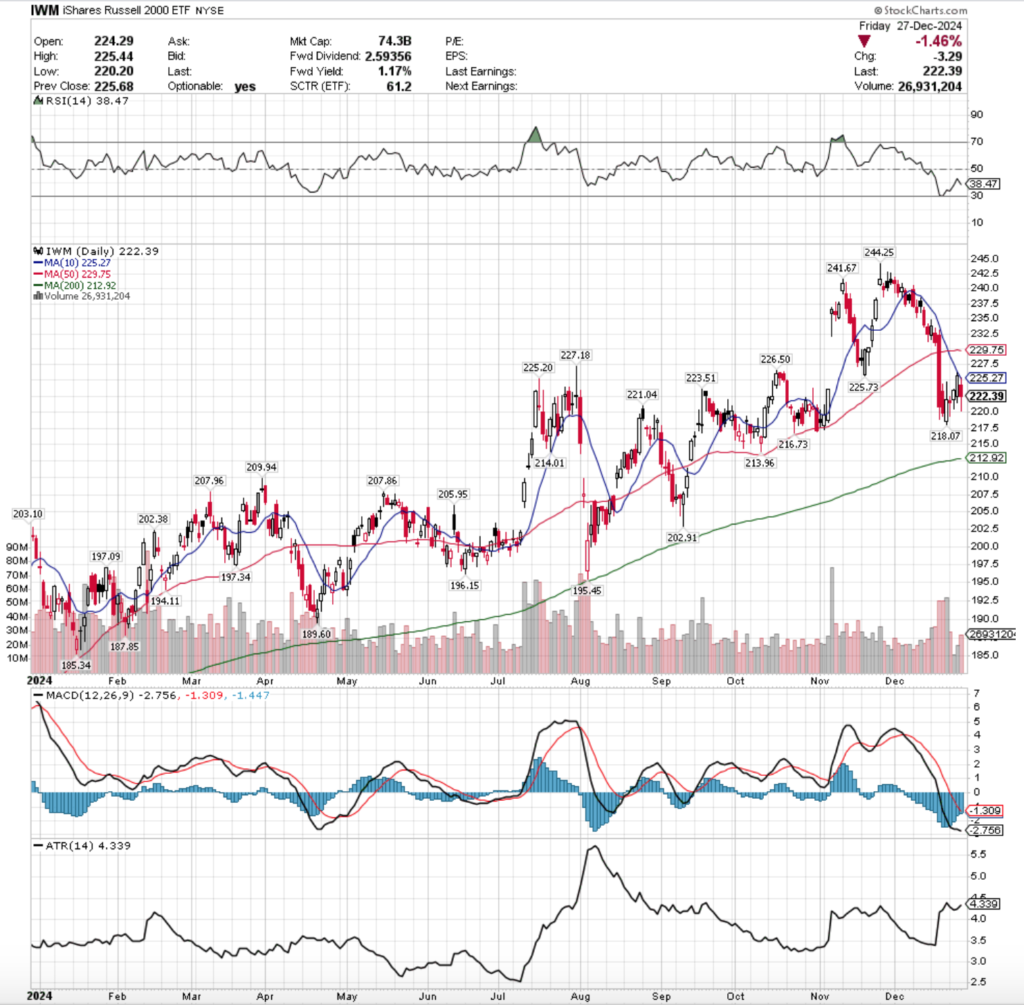
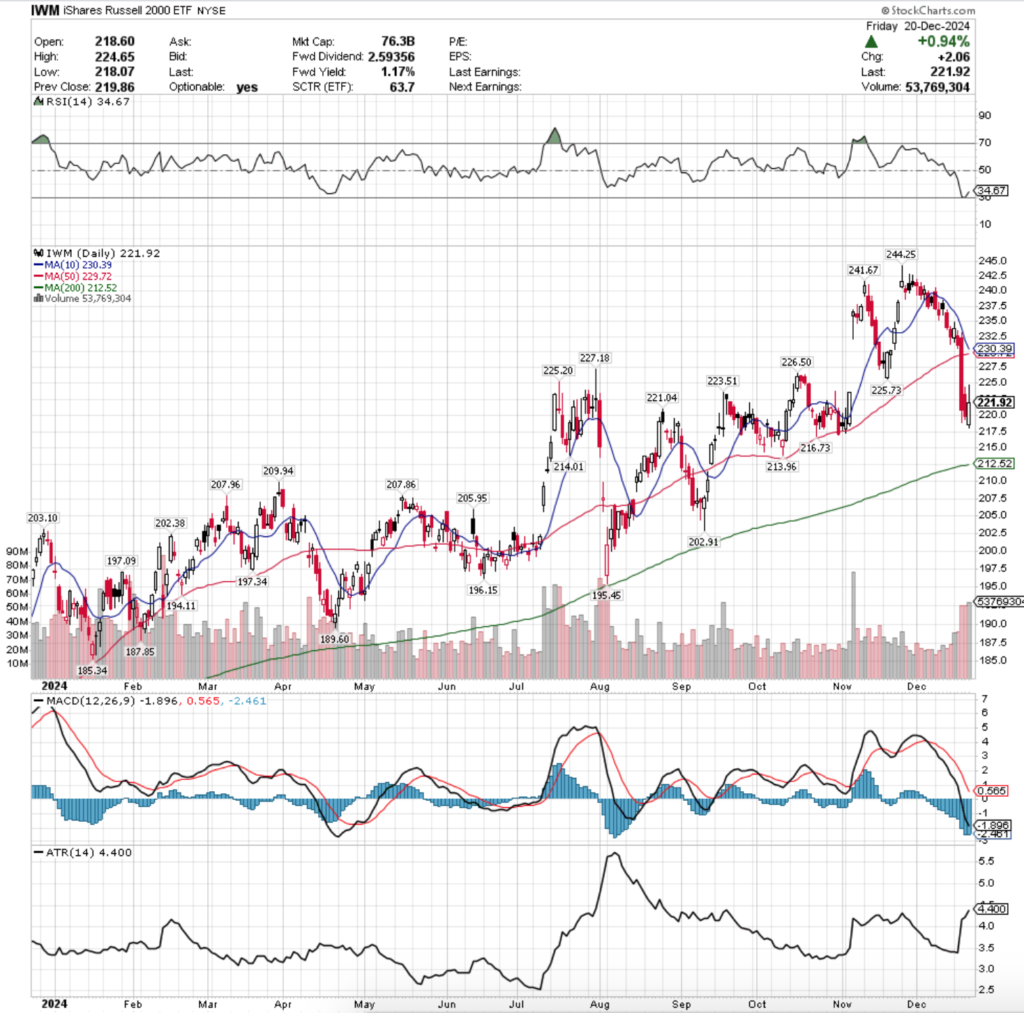
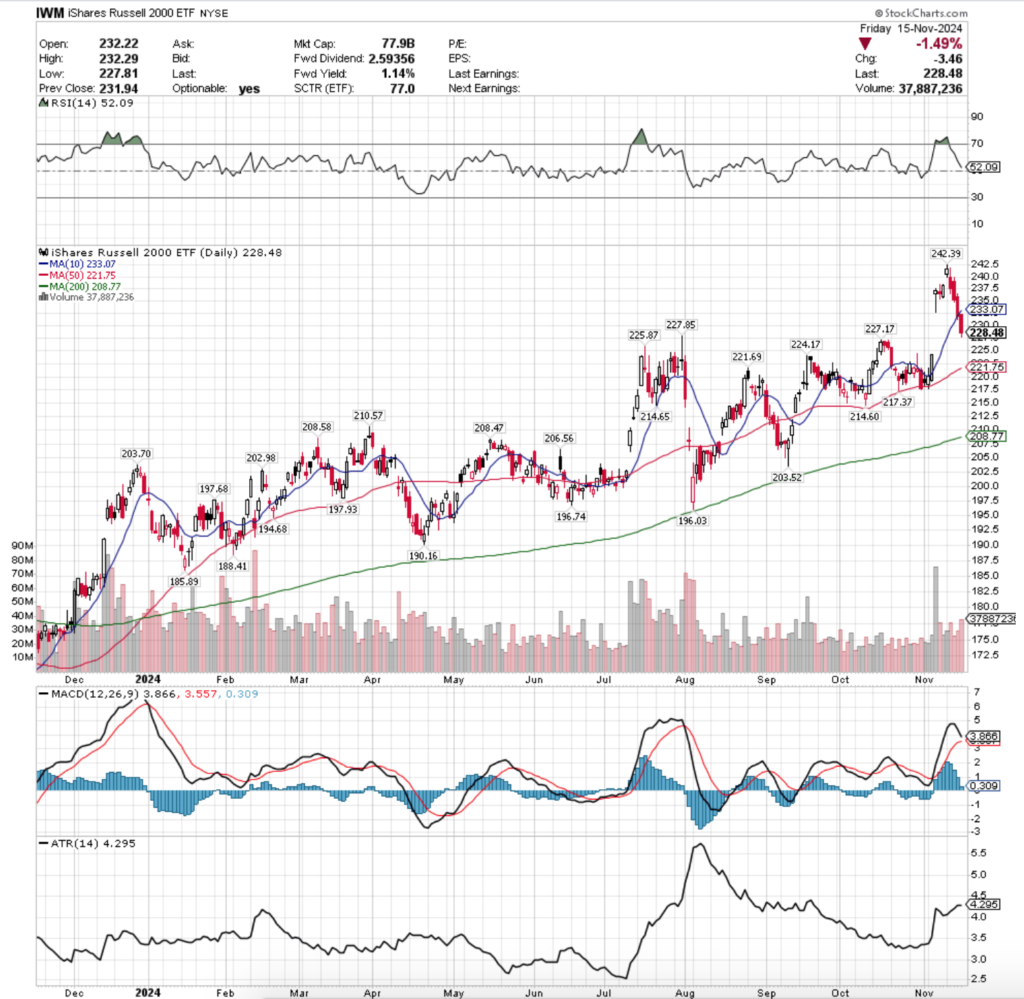
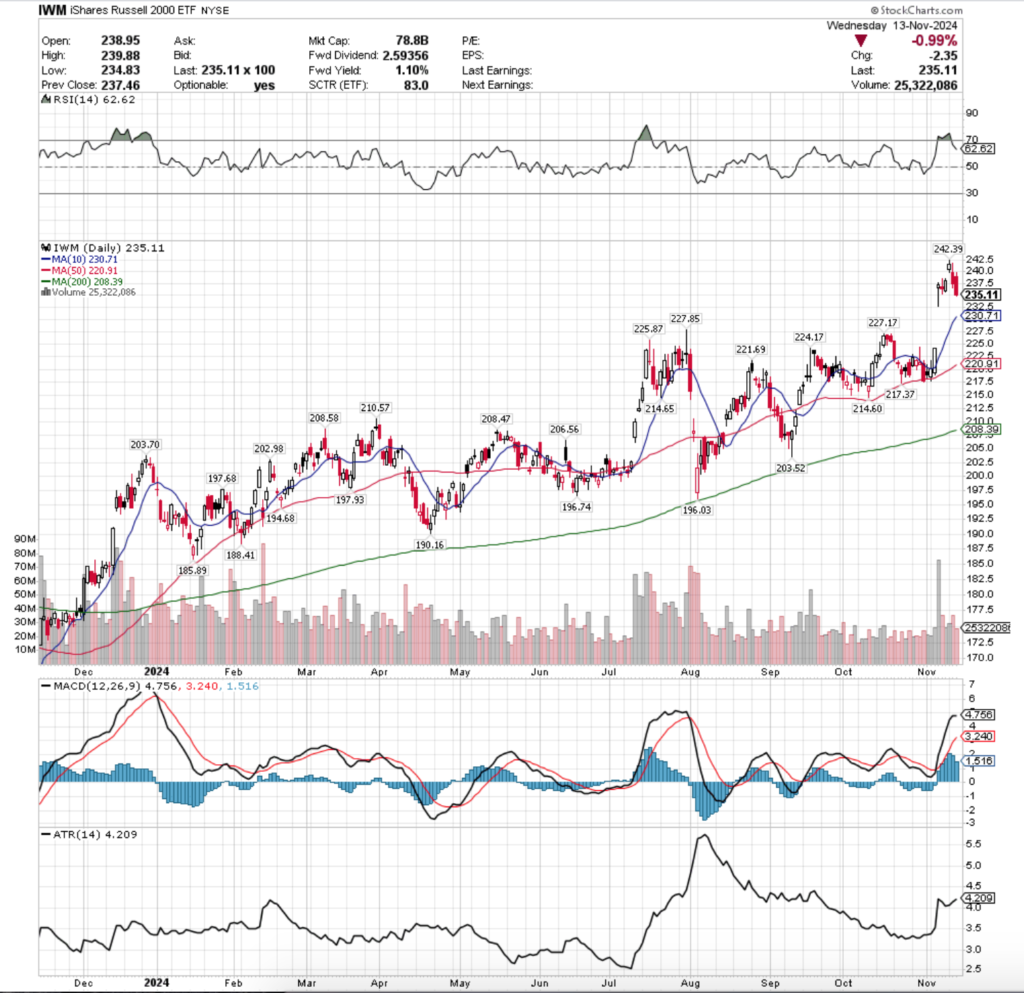
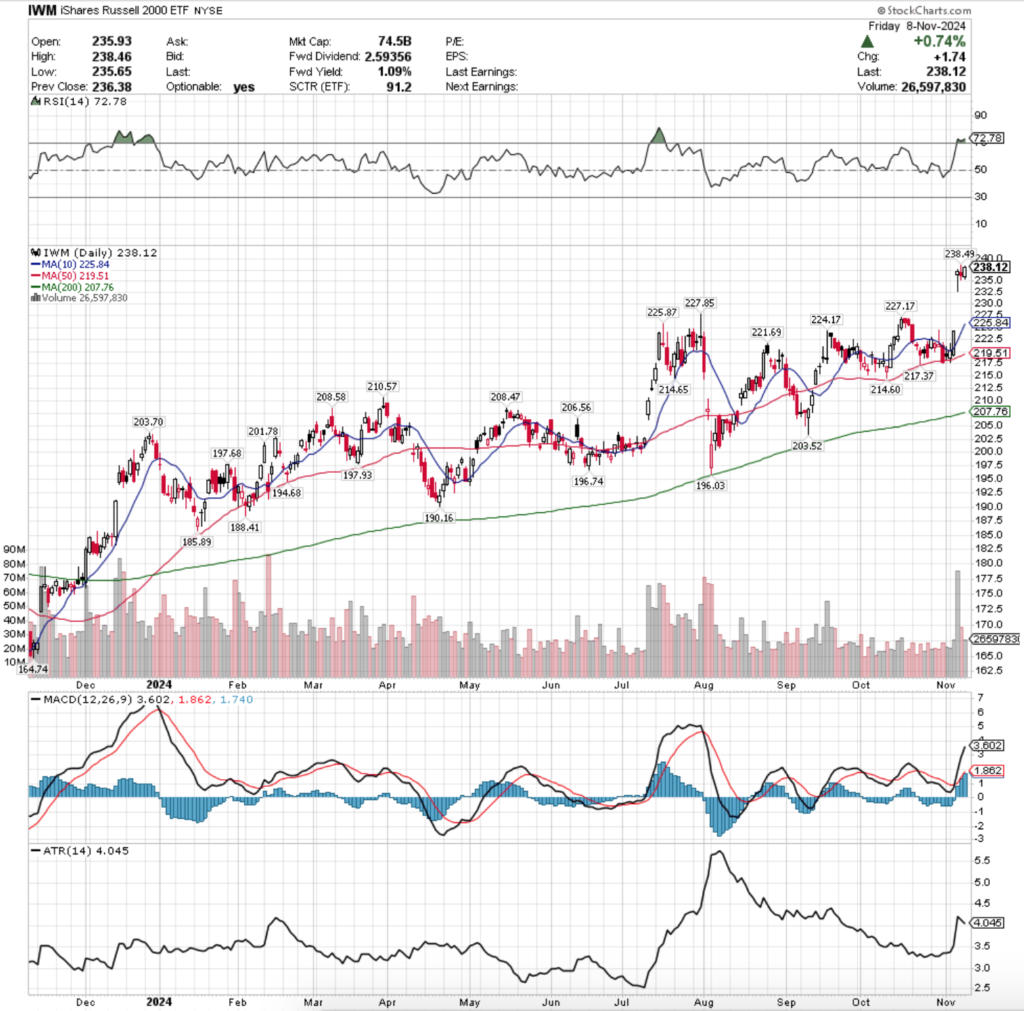
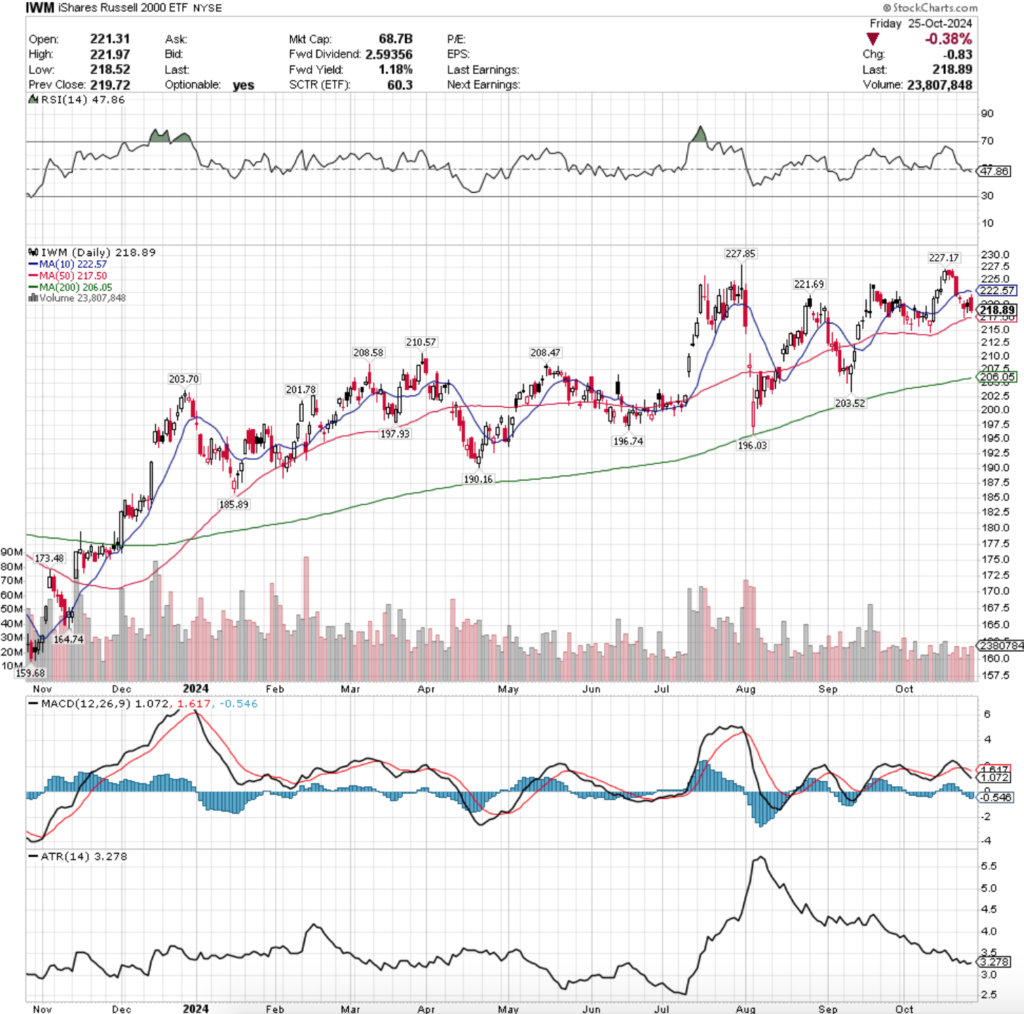
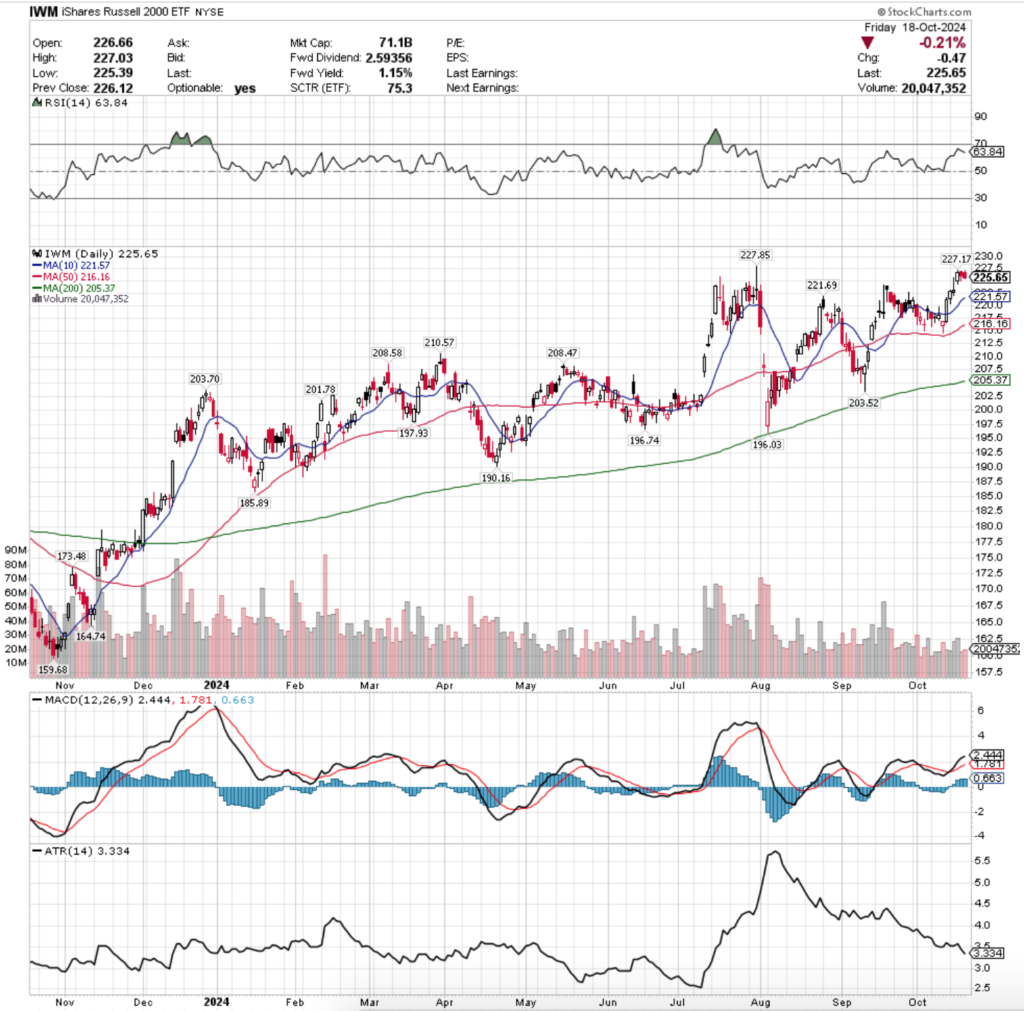
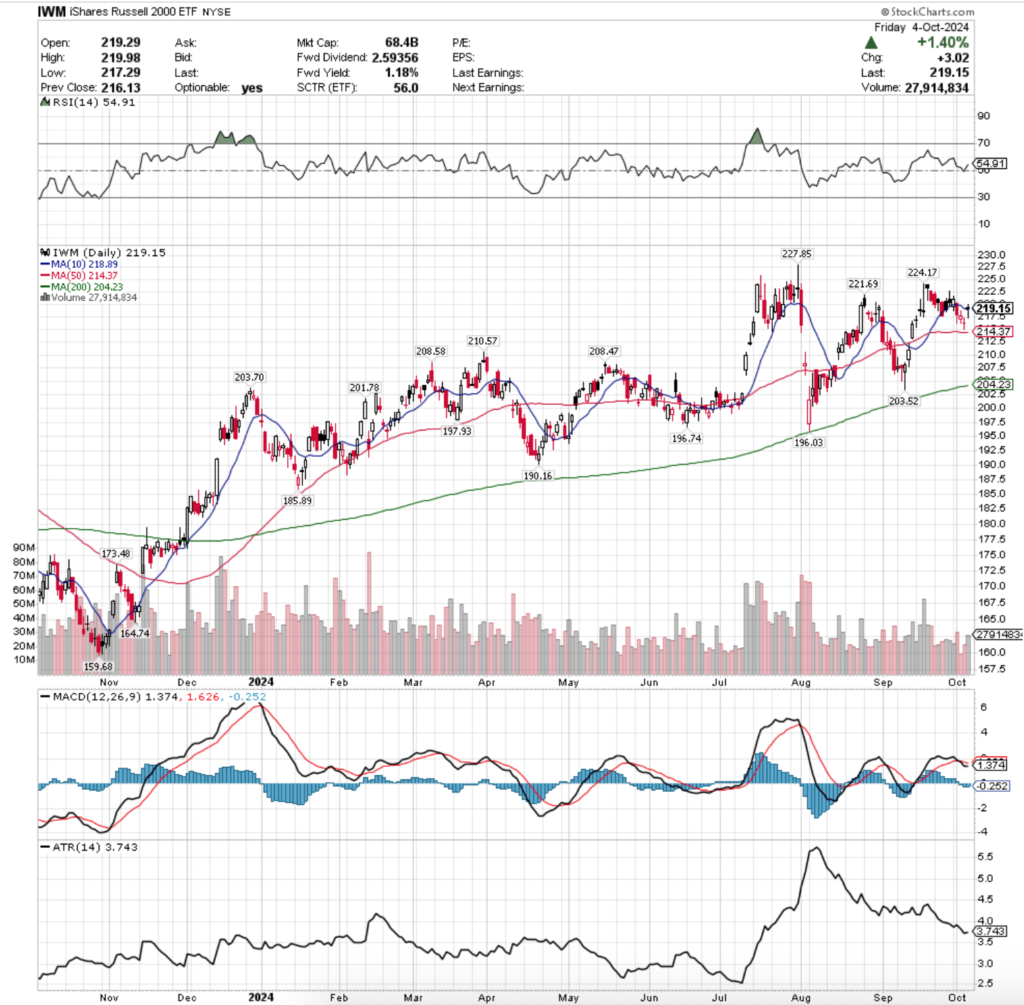
IWM ETF – iShares Russell 2000 ETF’s Technical Performance Over The Past Year
Their RSI is trending bearishly & currently sits at 38.47 & their MACD is still bearish, but the histogram is tapering off & it has begun to flatten out; next week will tell whether it continues lower or not.
Volumes were -28.63% lower than the previous year’s average level (22,515,000 vs. 31,547,937), as the hesitancy to buy stocks on the shortened holiday week also impacted the small cap index.
Monday opened slightly lower on the strongest volume of the week, but the upper & lower shadow signaled that there was a lot of appetite to both the upside & downside, but the real body being concentrated at the top of the candle indicates that there was short-term upside potential.
Tuesday opened on a gap up, tested to the downside, but managed to continue higher & closed for an advancing day, however this happened on the lowest volume of the year for IWM, signaling that there was not much strength & conviction behind the move.
Thursday confirmed that the weakness was setting in, as the session opened lower & tested lower, before rallying up to the 10 DMA’s resistance & closing just below it.
While the volume on Thursday was the second highest of the week, it was still not much to write home about & the uncertainty remained in the air.
Friday opened midway between Thursday’s range, made a run at the 10 DMA’s resistance, got rejected & the floodgates opened with IWM briefly dipping below Monday’s opening price, but recovering to still end the session lower on the day.
Small caps look to be in a bit of trouble, as Friday’s closing price would hit the 200 DMA if it declined -4.3%.
In the near-term IWM looks like an area to tread carefully around, given that their medium term trend is above the short-term trend (50 & 10 DMAs), which are both above their current price level.
While there are many support levels near their current price, they’ve also dipped below a resistance zone, which will require an uptick in volume to break through.
For the rest of the week it would be wise to watch to gain clues & insight into market participant sentiment towards IWM & the small cap names to see how things may kick off in the first month of the new year.
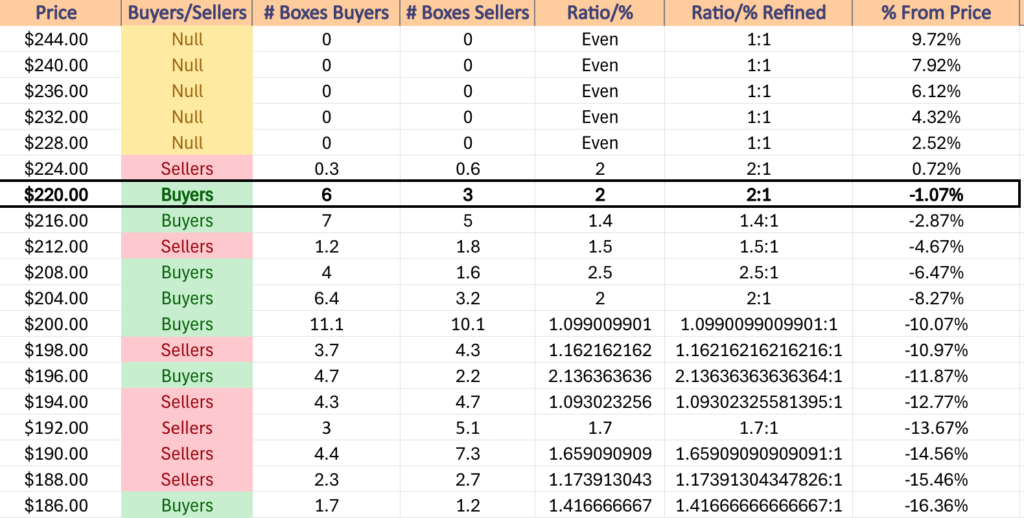
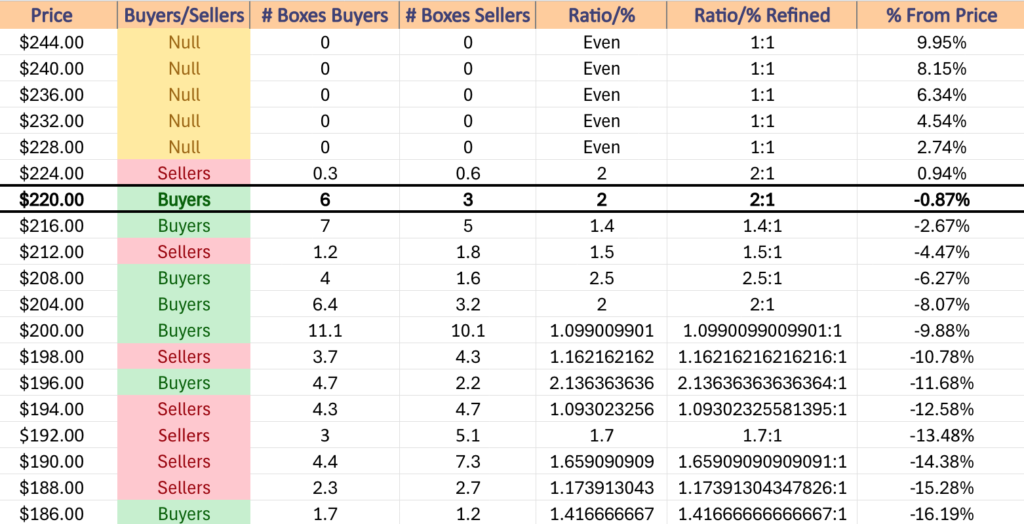
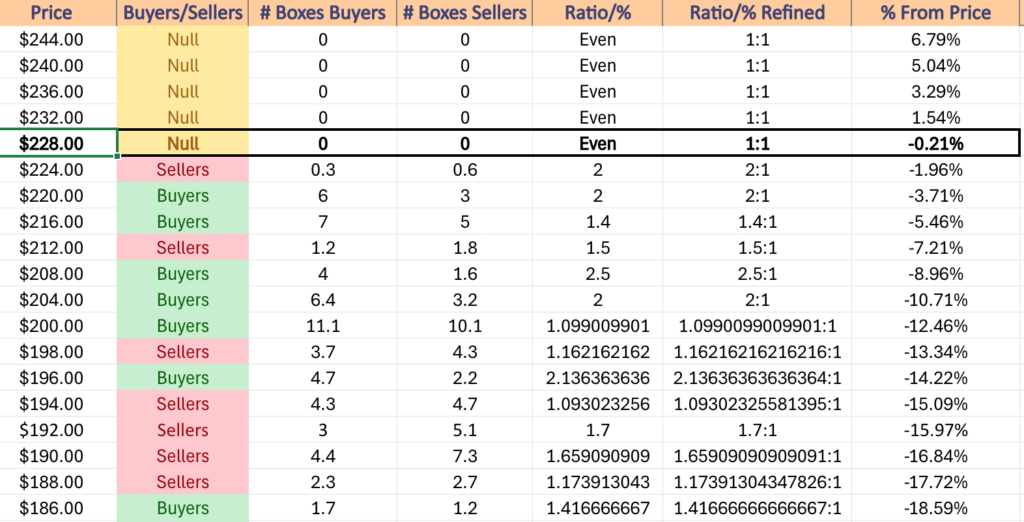
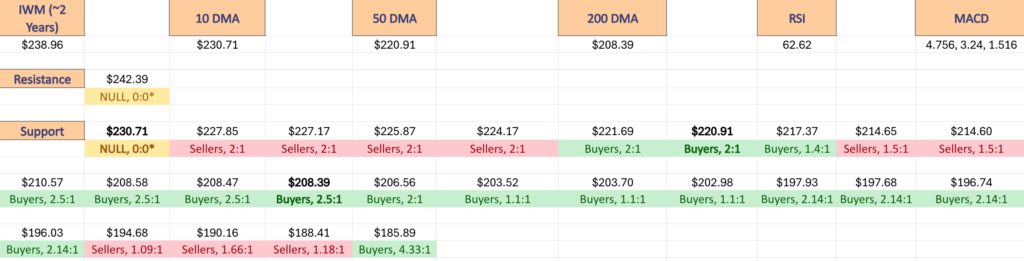
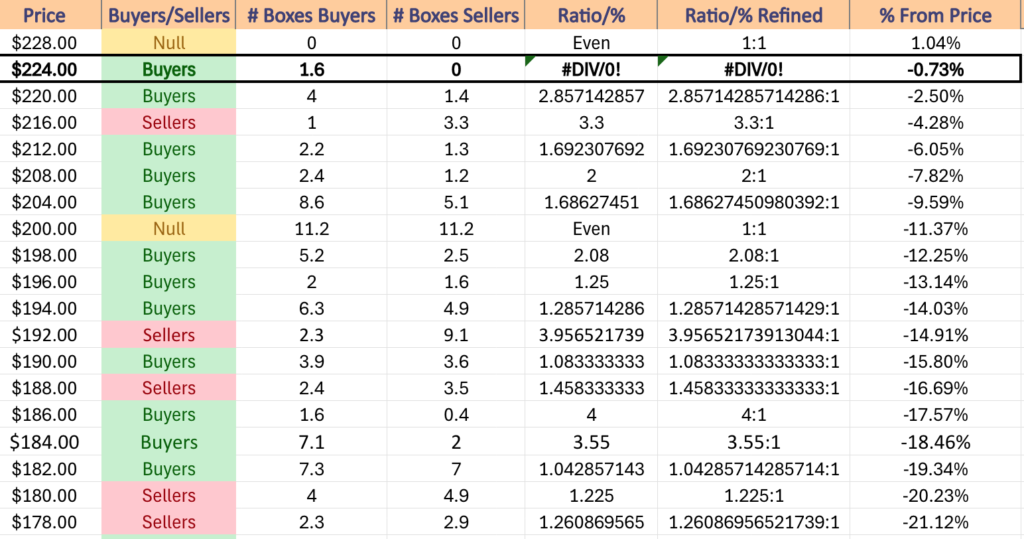
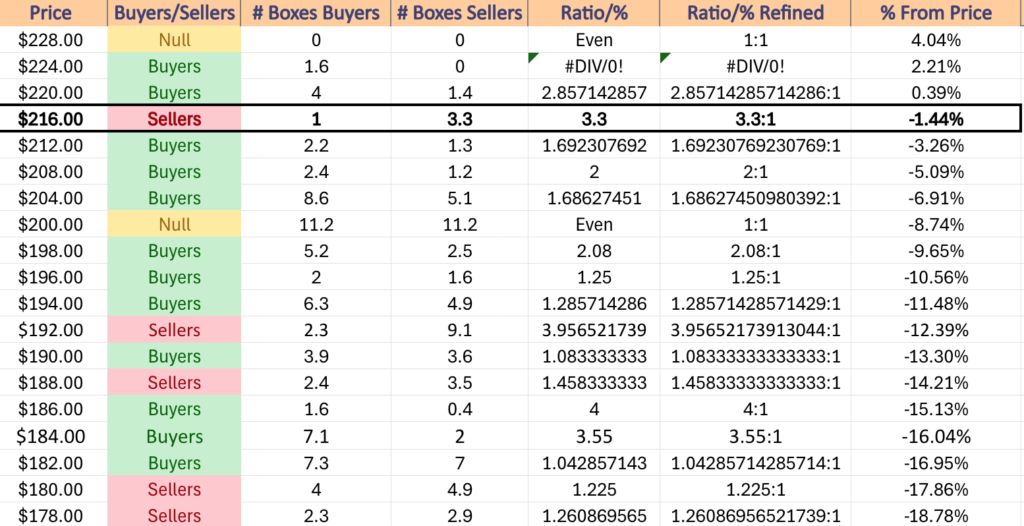
IWM has support at the $221.04 (Volume Sentiment: Buyers, 2:1), $218.07 (Volume Sentiment: Buyers, 1.4:1), $216.73 (Volume Sentiment: Buyers, 1.4:1) & $214.01/share (Volume Sentiment: Sellers, 1.5:1) price levels & resistance at the $223.51 (Volume Sentiment: Buyers, 2:1), $225.20 (Volume Sentiment: Sellers, 2:1), $225.27 (10 Day Moving Average, Volume Sentiment: Sellers, 2:1) & $225.73/share (Volume Sentiment: Sellers, 2:1) price levels.
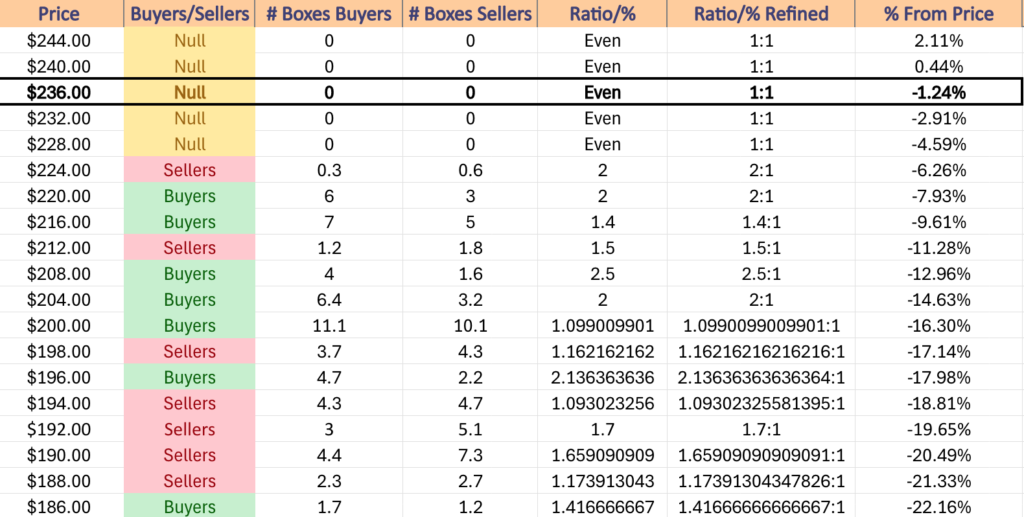
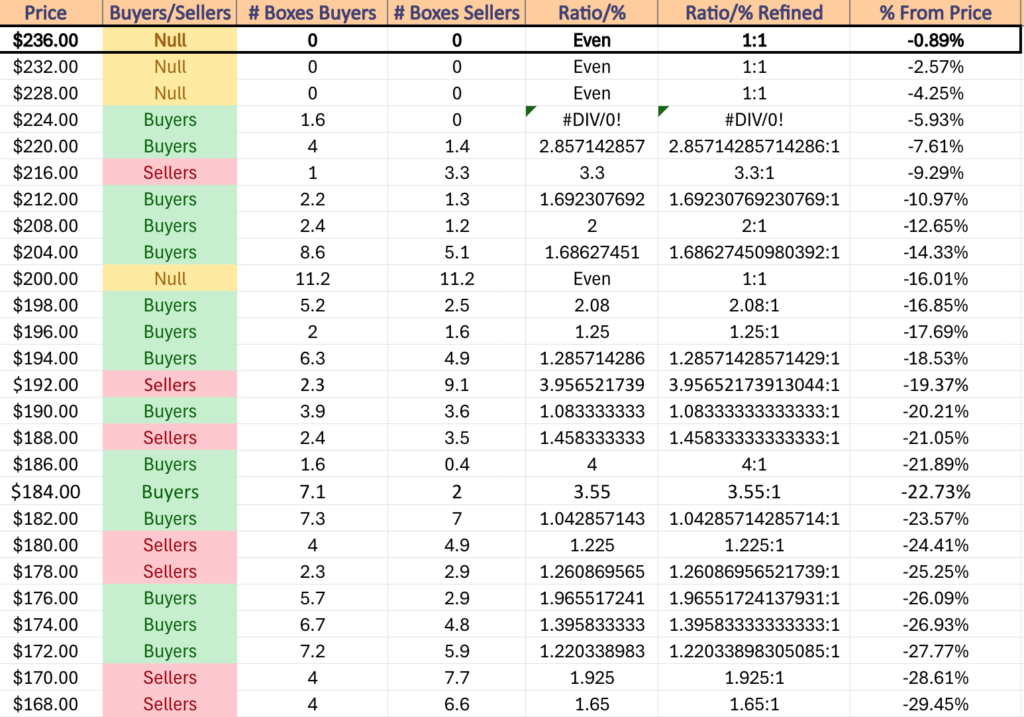
IWM ETF’s Price Level:Volume Sentiment Over The Past ~2 Years
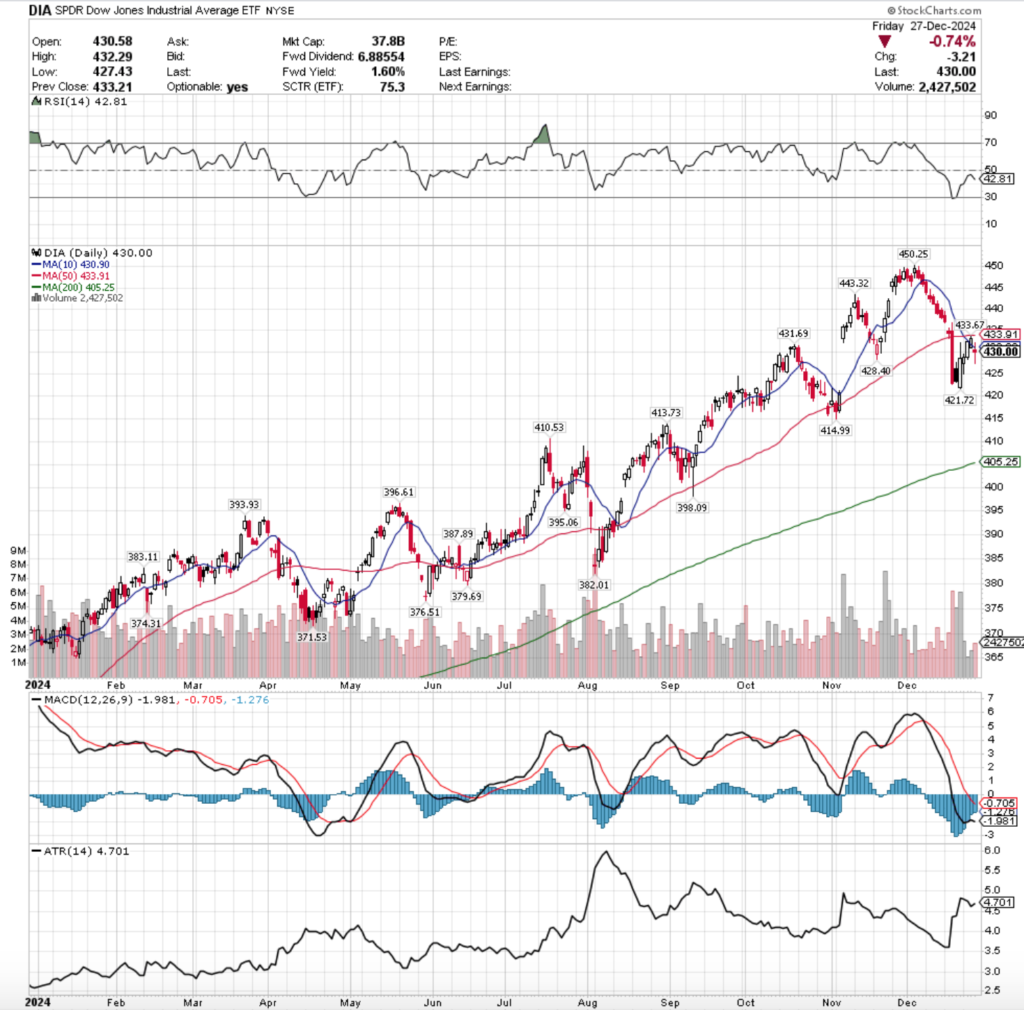
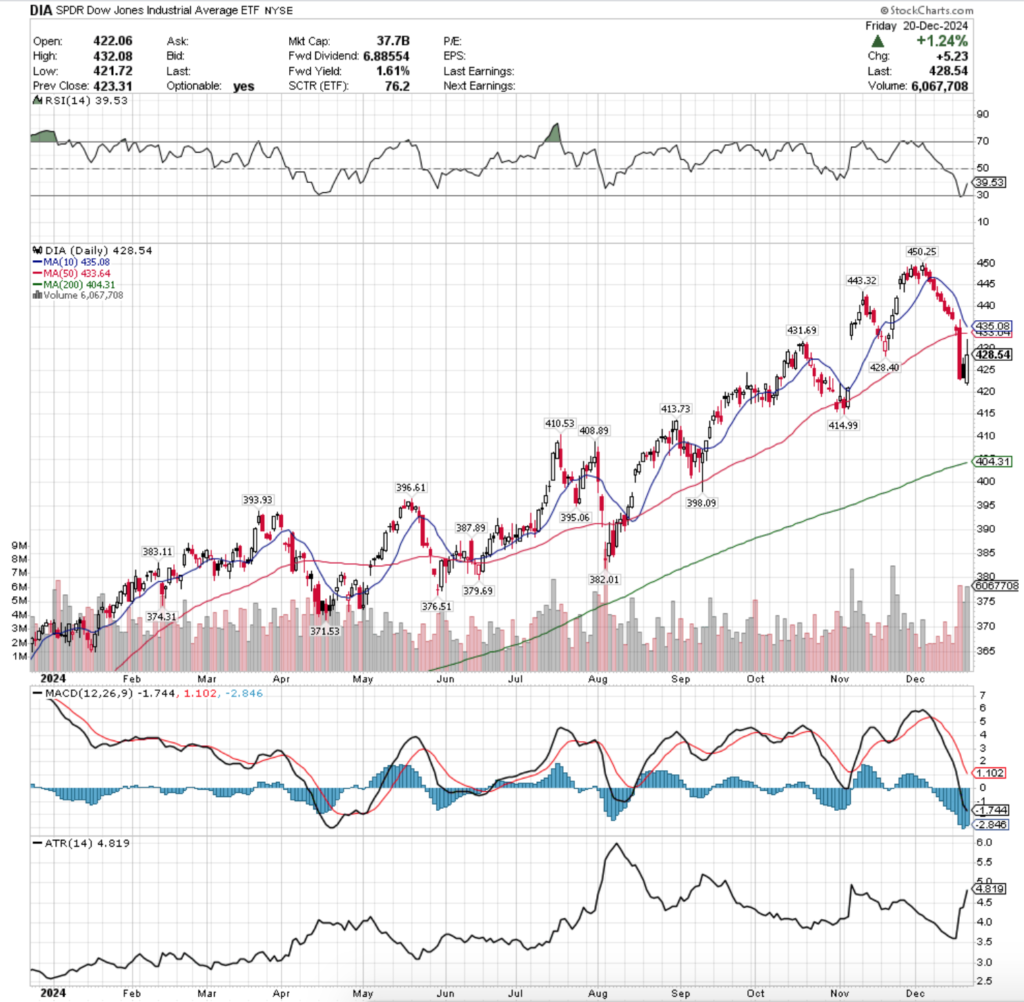
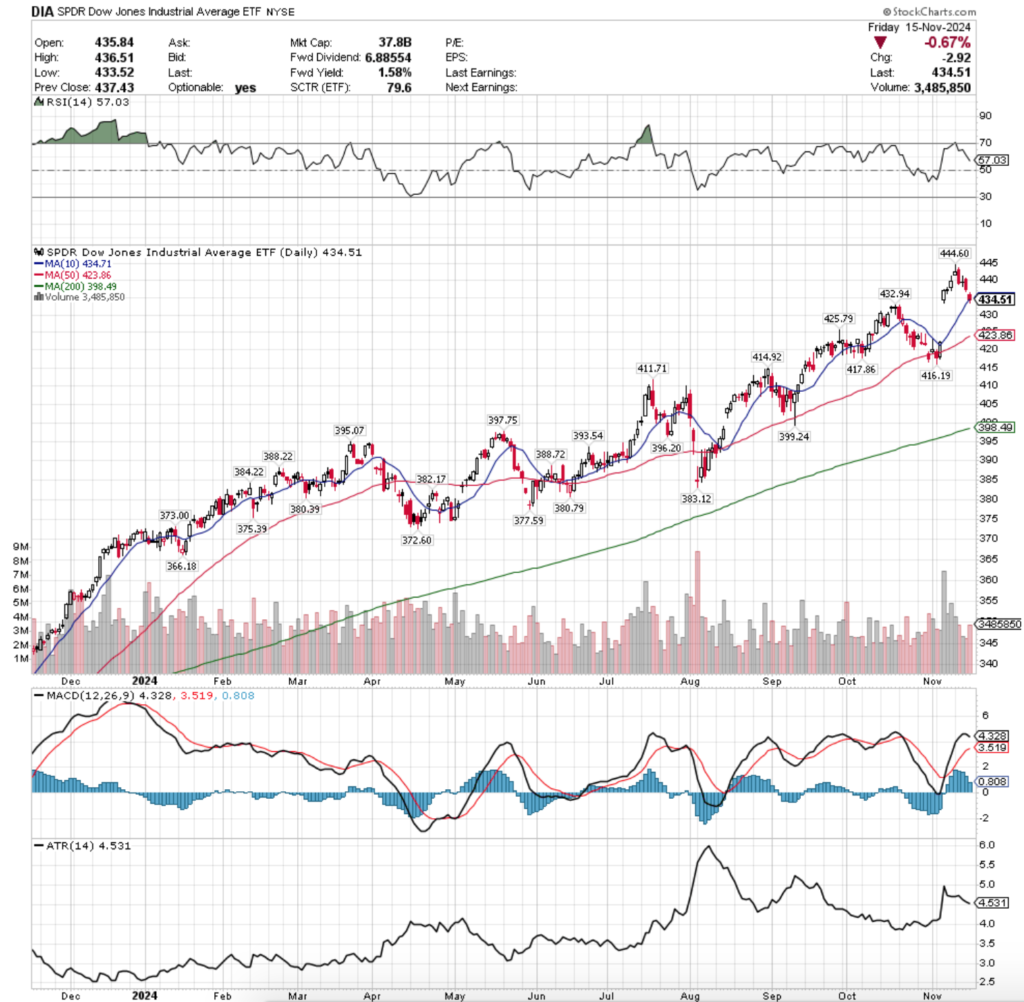
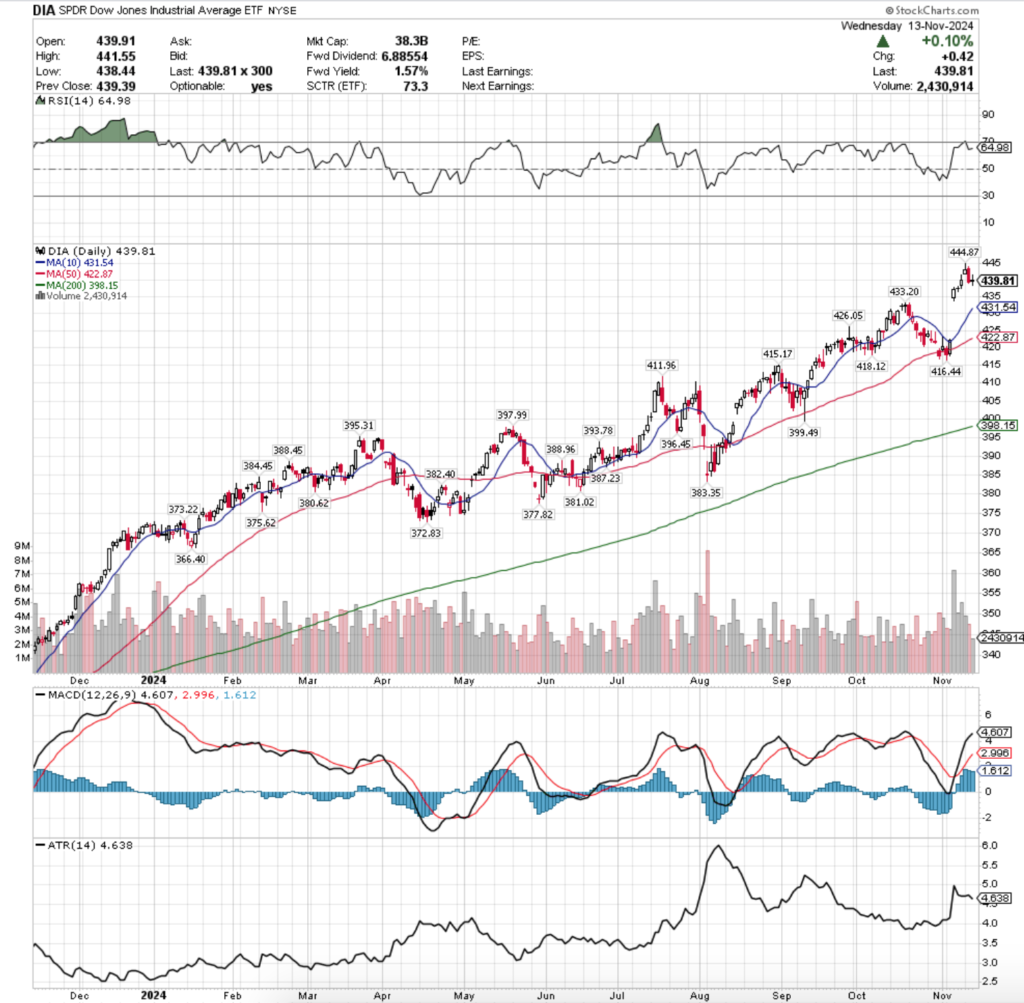
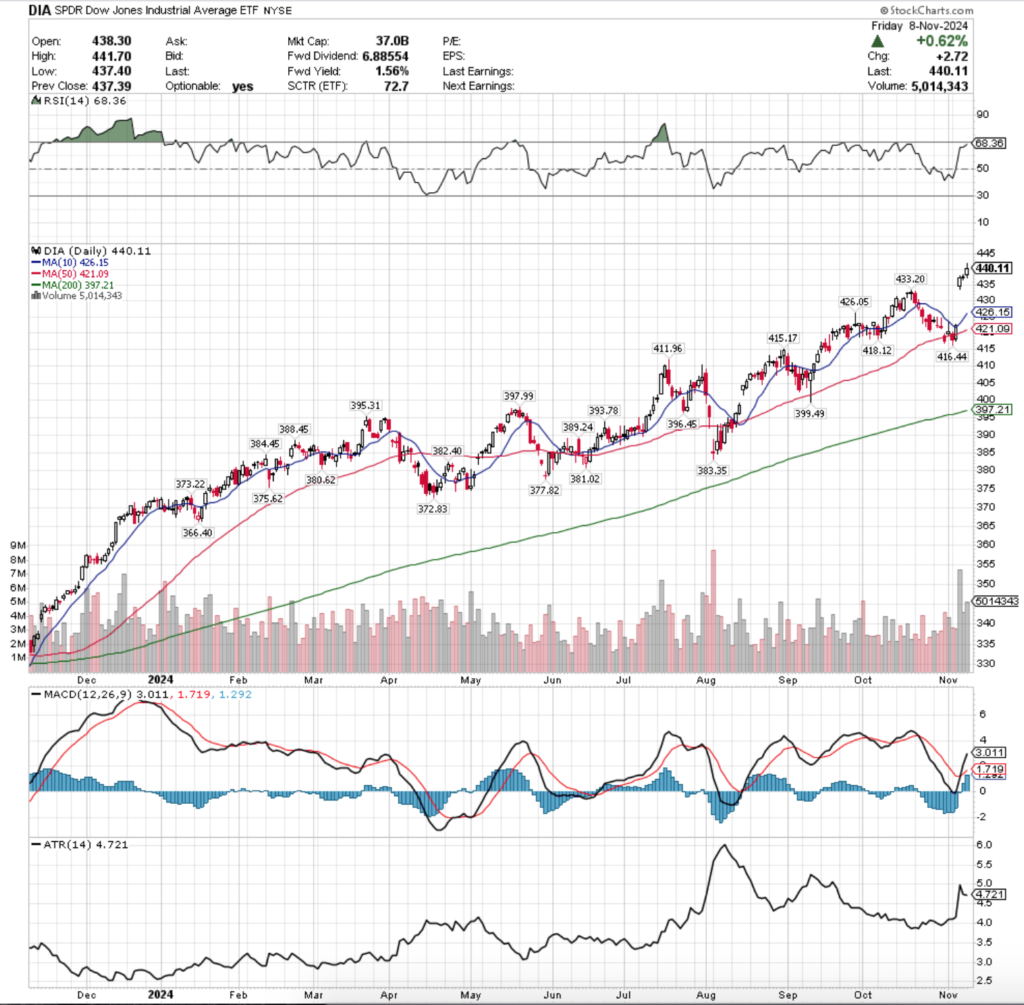
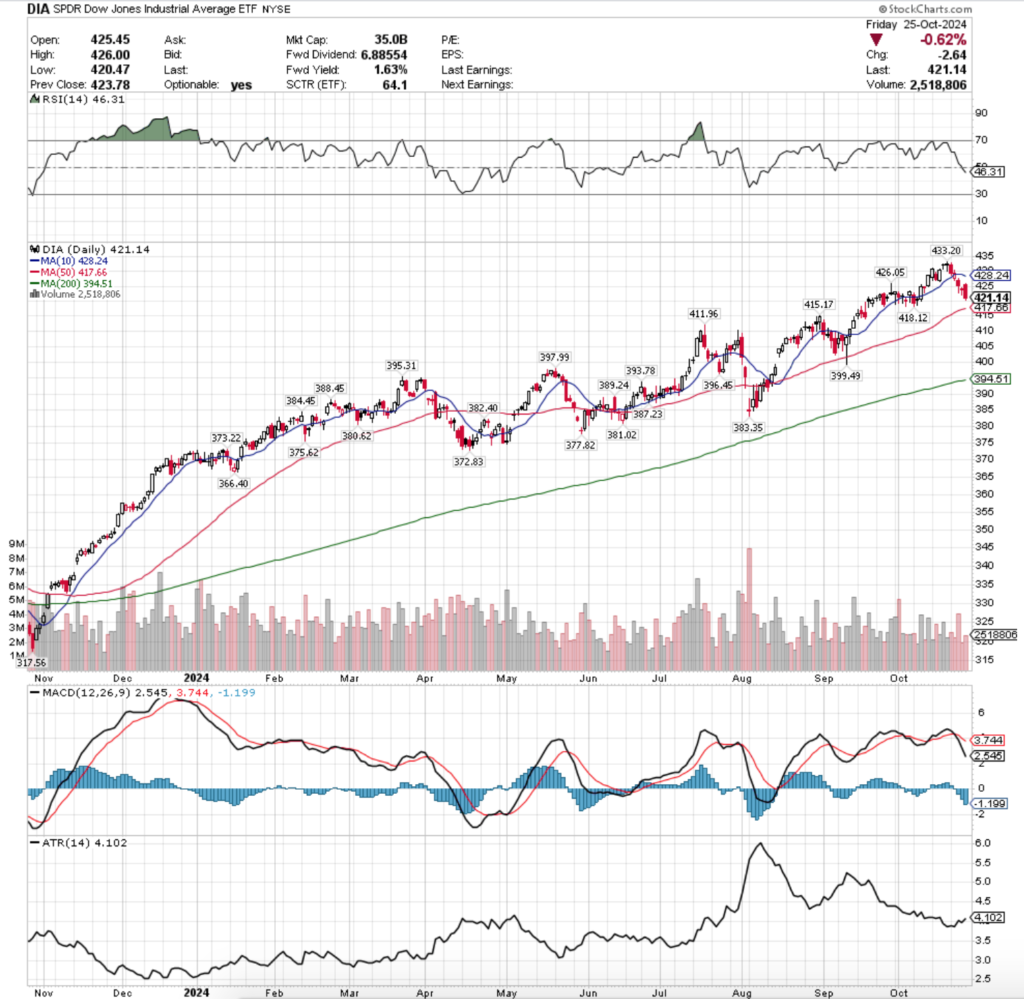
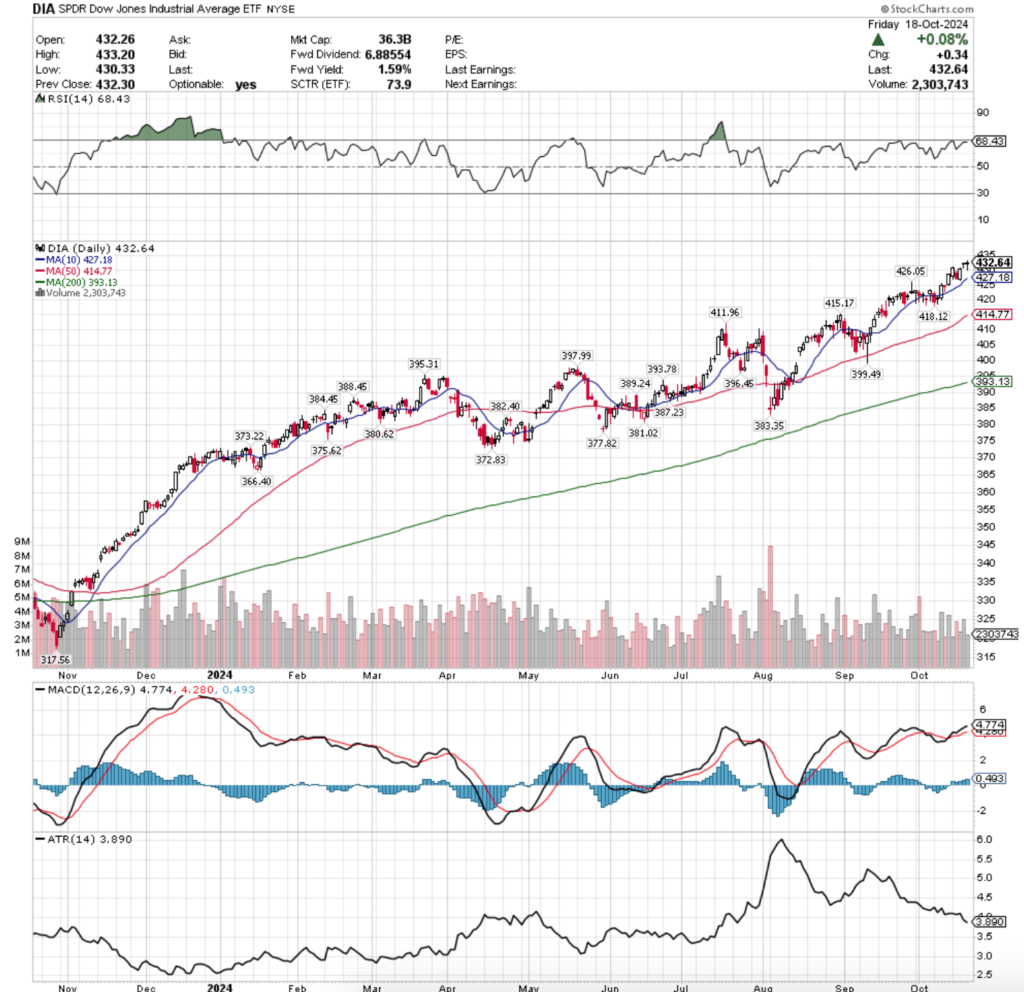
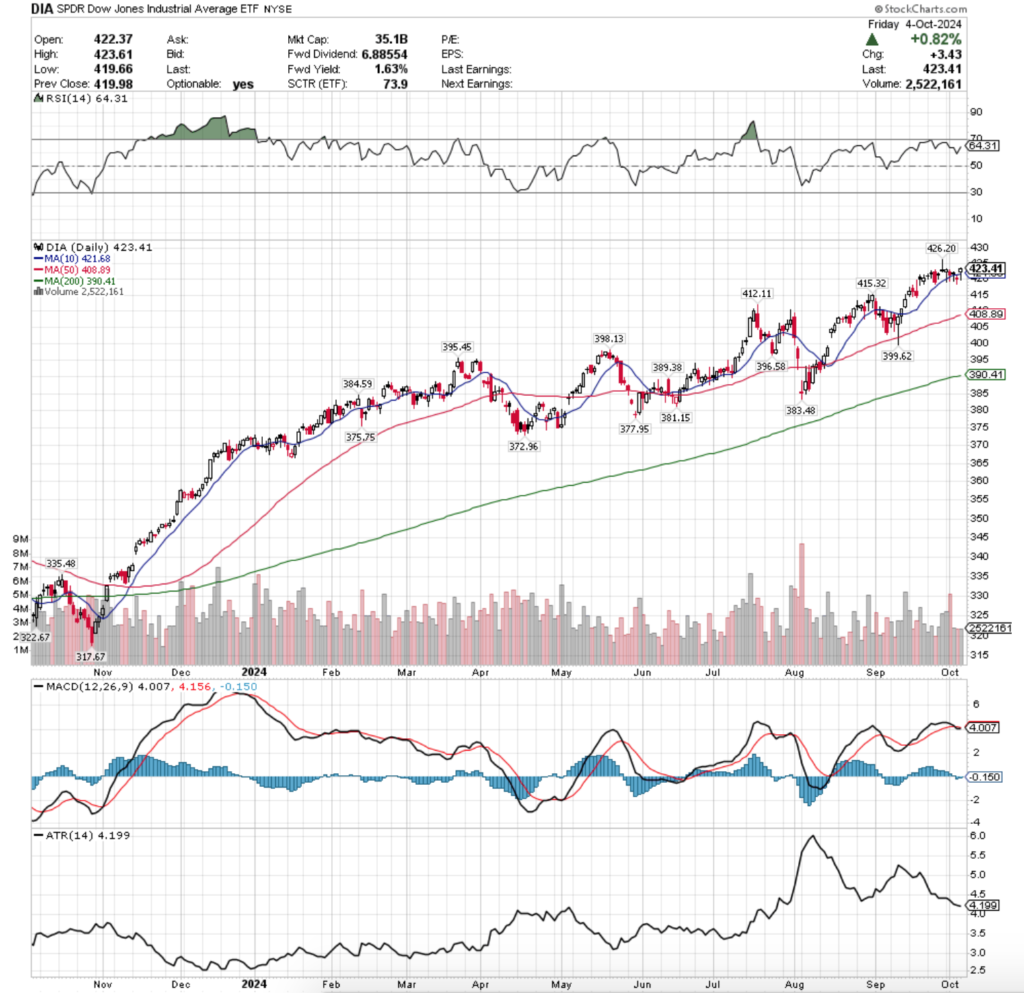
DIA ETF – SPDR Dow Jones Industrial Average ETF’s Technical Performance Over The Past Year
Their RSI is trending bearishly further, sitting currently at 42.81, while their MACD remains bearish, but has flattened out over the past week <FINISH THIS LATER>
Volumes were -38.92% lower than the prior year’s average level (2,082,500 vs. 3,409,683), as there was a very low participation rate during the holiday week.
Monday the week kicked off on a bullish note, advancing for the day on the week’s highest volume.
Tuesday also saw gains for DIA, but on very low volume that was unable to break above the 10 DMA & the session closed in-line with it.
Thursday opened lower, before powering through the 10 DMA to test & get rejected by the 50 DMA’s resistance, but prices managed to close just beneath it.
Friday showed a rush to the exits & profits were taken after the gains of the short week, as the session opened on a gap down, tested higher to briefly break above the resistance of the 10 DMA, but ultimately closed lower on the day as a high wave spinning top candle.
Friday featured the second highest volume of the week as well, indicating that there was a great deal of bearish sentiment out there for DIA.
Heading into this week keep an eye out for any volume shifts, as that will provide clues into whether or not there will be pains or gains heading into the new year.
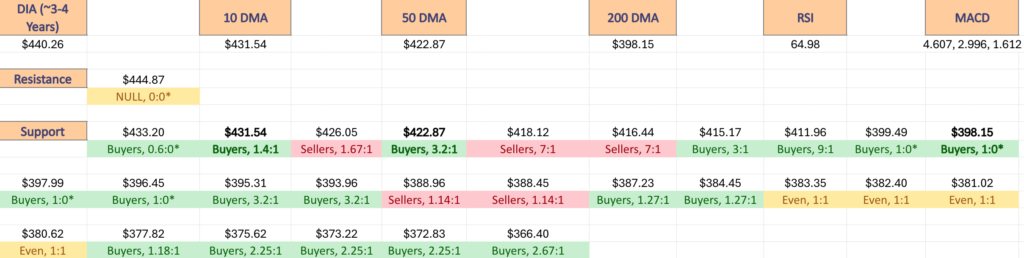
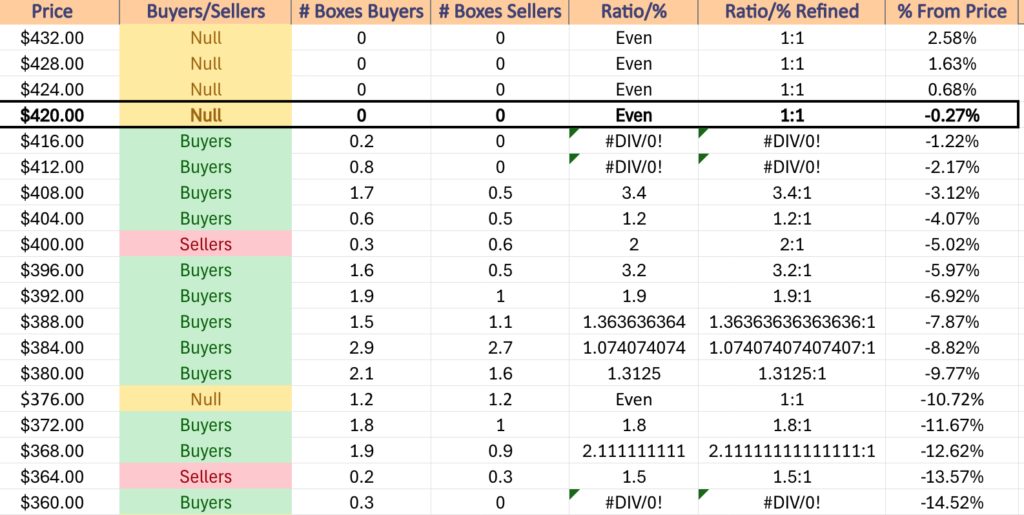
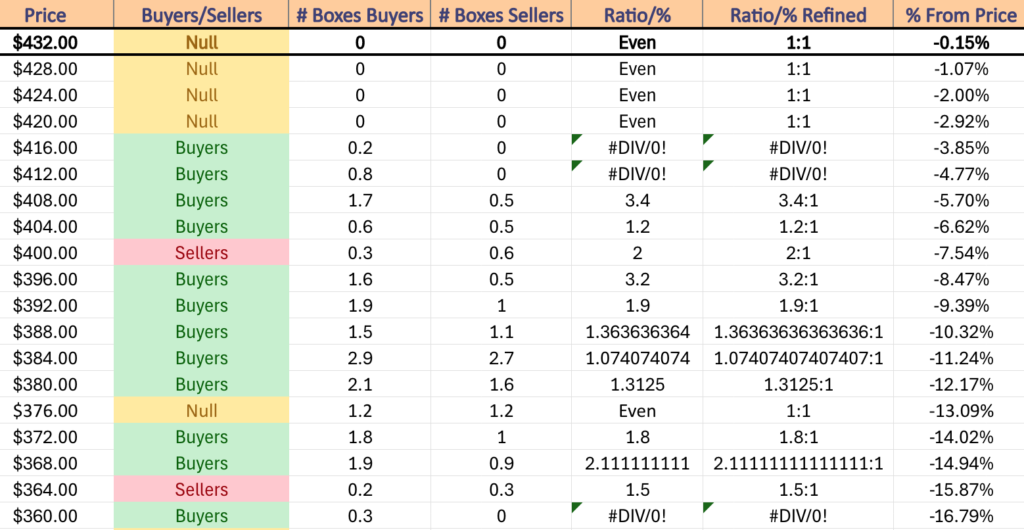
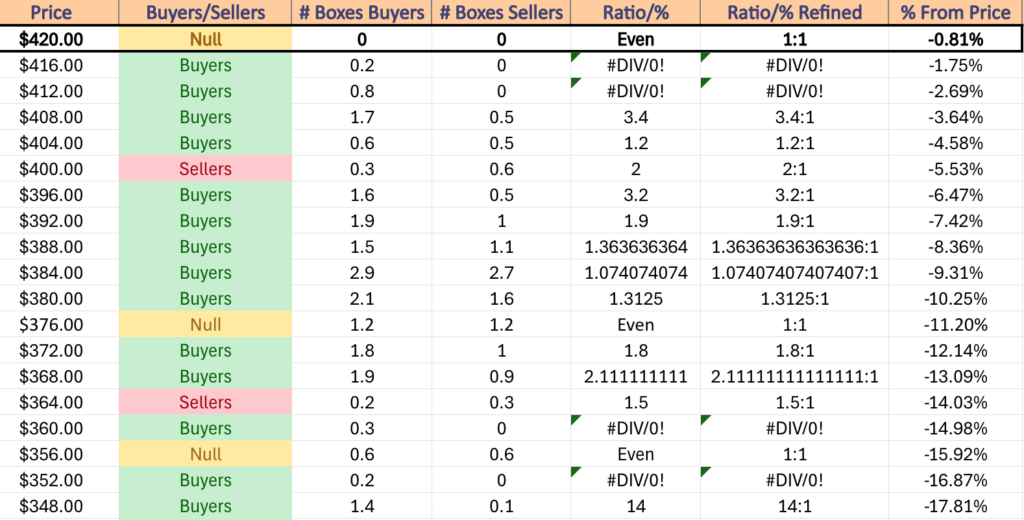
The chart below outlines DIA’s support & resistance levels with their volume sentiments over the past 3-4 years.
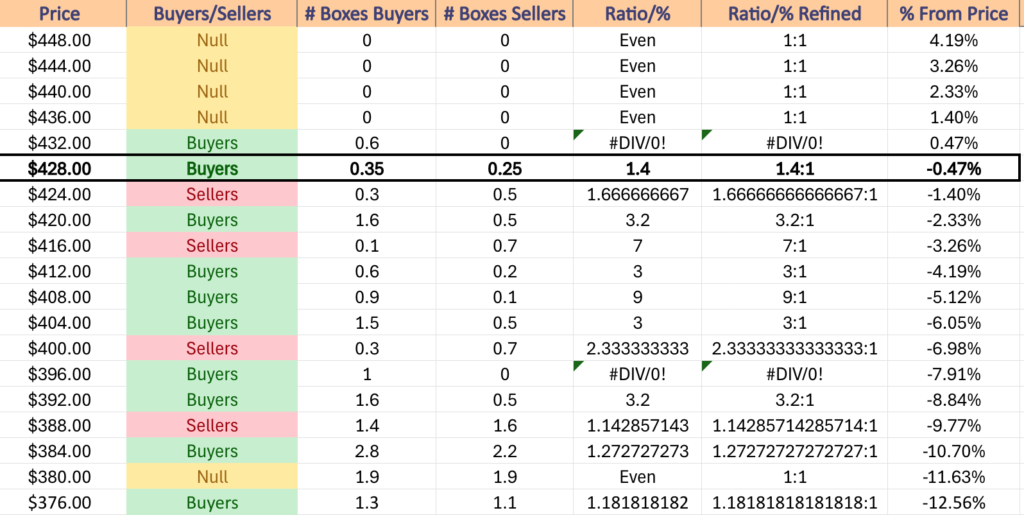
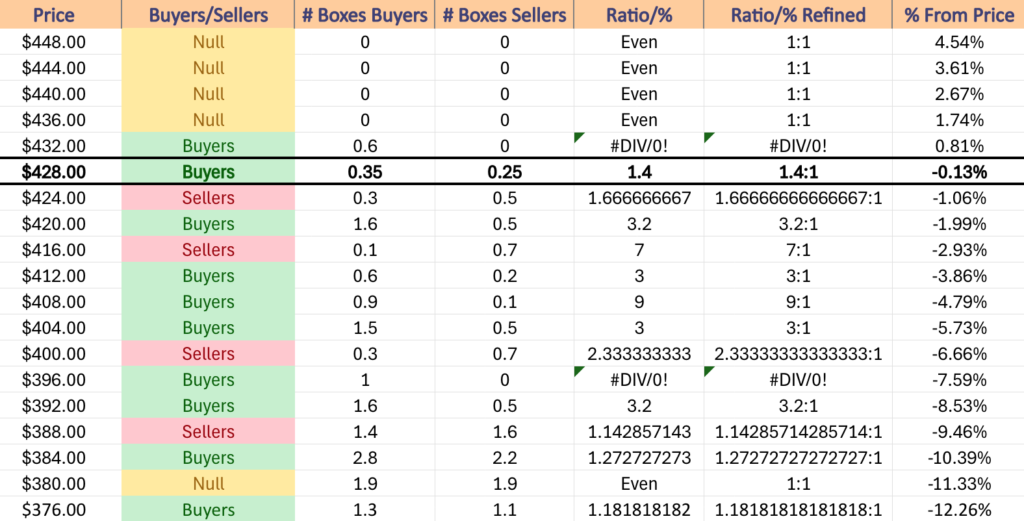
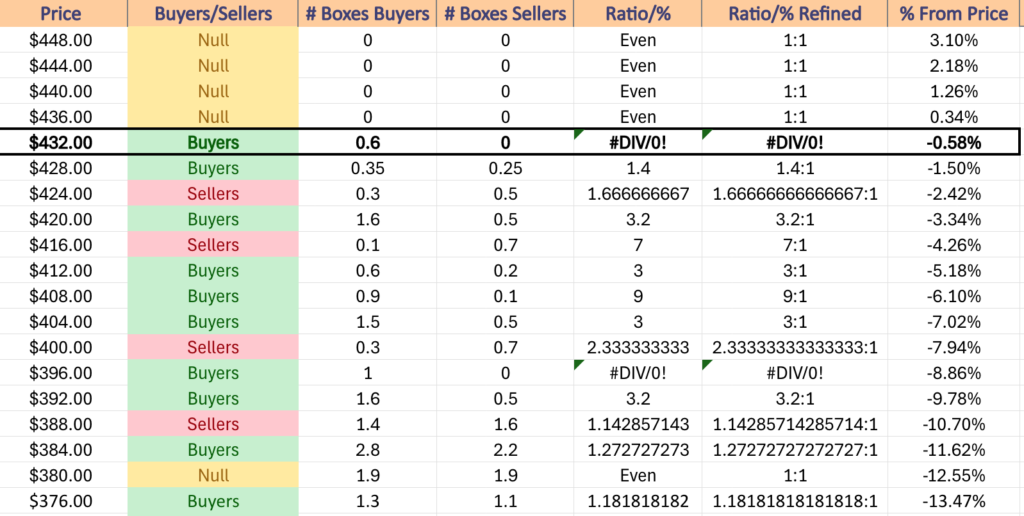
DIA has support at the $428.40 (Volume Sentiment: Buyers, 1.4:1), $421.72 (Volume Sentiment: Buyers, 3.2:1), $414.99 (Volume Sentiment: Buyers, 3:1) & $413.73/share (Volume Sentiment: Buyers, 3:1) price levels & resistance at the $430.90 (10 Day Moving Average, Volume Sentiment: Buyers, 1.4:1), $431.69 (Volume Sentiment: Buyers, 1.4:1), $433.67 (Volume Sentiment: Buyers, 0.6:0*) & $433.91/share (50 Day Moving Average, Volume Sentiment: Buyers, 0.6:0*) price levels.
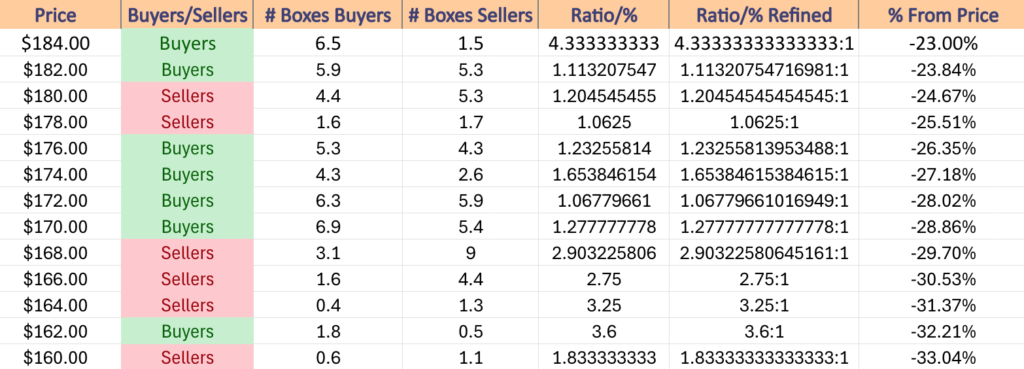
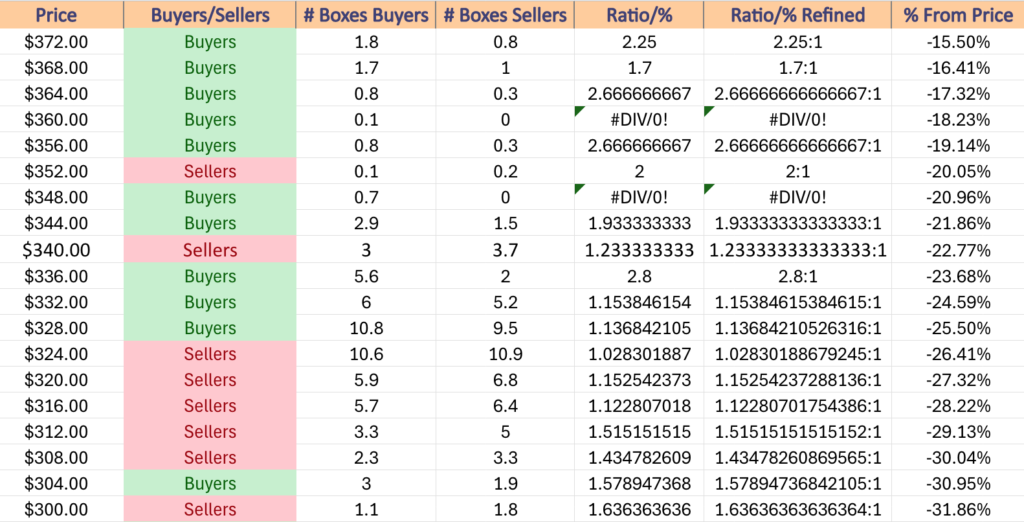
DIA ETF’s Price Level:Volume Sentiment Over The Past 3-4 Years
The Week Ahead
The week kicks off Monday with Chicago Business Barometer (PMI) data at 9:45 am, followed by Pending Home Sales data at 10 am & there are no major earnings announcements scheduled.
Tuesday the year winds down with S&P Case-Shiller Home Price Index (20 Cities) data at 9 am & there are no earnings reports scheduled for release.
Wednesday is New Year’s Day & there is no economic data or earning’s announcements.
Thursday the year kicks off with Initial Jobless Claims Data at 8:30 am, followed by Construction Spending data at 10 am & Resources Connection reports earnings to kick the new year off after the session’s close.
Friday the week winds down with ISM Manufacturing data at 10 am & there are no earnings reports scheduled for the day.
See you back here next week!
*** I DO NOT OWN SHARES OR OPTIONS CONTRACT POSITIONS IN SPY, QQQ, IWM OR DIA AT THE TIME OF PUBLISHING THIS ARTICLE ***
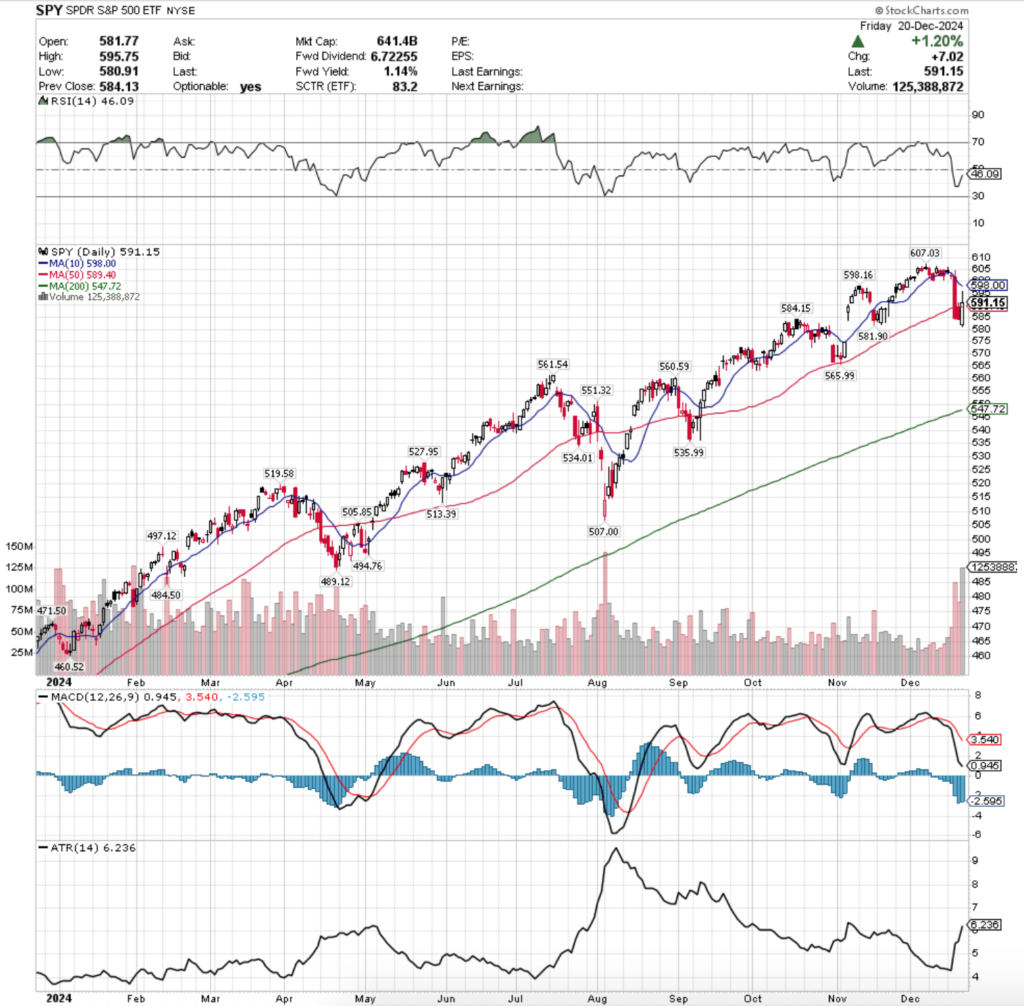
SPY, the SPDR S&P 500 ETF slipped -2.16% last week, while the VIX closed the week at 18.36, indicating an implied one day move of +/-1.16% & a one month implied move of +/-5.31% for SPY.
SPY ETF – SPDR S&P 500 ETF’S Technical Performance Over The Past Year
Their RSI is trending back towards the neutral mark of 50 & currently sits at 46.09 following Friday’s advancing session, while their MACD is still bearish, but the histogram is declining less rapidly than earlier in the week.
Volumes were +44.71% above the prior year’s average (83,872,000 vs. 57,959,641), as market participants began jumping out of the pool following Wednesday’s FOMC interest rate decision & Fed Chair Powell’s press conference.
Monday kicked the week off on an ominous note, as the session opened higher, tested a little bit above Friday’s opening price, before heading lower on low volume to close below the open straddling the 10 day moving average’s support.
The session also resulted in a spinning top, which indicates there was a bit of indecision in the air on the part of market participants.
Tuesday the theme continued, as the session opened lower & was unable to fight higher to cross the 10 DMA’s resistance, closing the day as a doji on slightly higher volume than Monday, indicating that uncertainty & caution were still in the air, but there was brief equilibrium.
Wednesday is where things really began to unravel, as the session opened lower with the 10 Day Moving Average, briefly tested higher, before crumbling on a wide range decline on the week’s second highest volume following Chair Powell’s remarks.
What’s more alarming is how easily it broke down the support of the 50 day moving average & managed to close beneath it, which will cause the 50 DMA to curl over bearishly like the 10 DMA already has.
Thursday the pain continued, as the session opened higher & in line with the 50 DMA & briefly tested higher, before unraveling & closing just below Wednesday’s close.
While the slightly lower close means that it was not a bearish harami, it was hardly a vote of confidence & a sign that profit taking may be morphing into a more serious downwards movement in the near-to-mid term when you consider that the session’s volume had only narrowly lower volume than the prior day.
Friday’s price action also continued the skeptical view of the strength behind SPY’s recent moves.
The day opened on a lower note from Thursday, but managed to draw in the most market participants of the week, powering it above the 50 DMA’s resistance & almost reaching the 10 DMA intraday, before profits were taken & the price closed just above the 50 DMA’s support.
While Friday formed a bullish engulfing pattern with Thursday’s candle & the volume & +1.2% advance are all nice, it is still wise to approach this short week & next week with caution.
Particularly as while the volume spike & wide daily range can indicate a reversal is on the horizon, that doesn’t seem likely beyond a brief movement following the squeeze/covering Friday session.
Especially given that there’s likely not going to be much volume this week which will likely continue into next week due to the holidays creating shorter weeks.
Without some type of volume catalyst it doesn’t seem there would be any near-term rallies, particularly when you factor in the limited earnings calls & market data reports that are due for release.
Watching the relationship between Price, the 10 DMA & the 50 DMA will be a key area of focus, particularly as the window created in early November following the US Presidential Election has yet to fully fill & SPY’s oscillators are not signaling strength at the moment.
It will also be worth watching how SPY interacts with its support levels, especially given that the first one has been relatively untested & the following two are slightly more sturdy but close enough to the current price that based on the price action of last week can easily break down, leading to the fourth level, which has been Seller dominated 2:1 over the past 2-3 years.
This will also open SPY up to being ~3% from its 200 day moving average’s support, which is an important long-term trend mark.
SPY has support at the $589.40 (50 Day Moving Average, Volume Sentiment: Buyers, 0.4:0*), $584.15 (Volume Sentiment: Buyers, 1.86:1), $581.90 (Volume Sentiment: Buyers, 1.86:1) & $565.99/share (Volume Sentiment: Sellers, 2:1) price levels, with resistance at the $598.00 (10 Day Moving Average, Volume Sentiment: NULL, 0:0*), $598.16 (Volume Sentiment: NULL, 0:0*) & $607.03/share (All-Time High, Volume Sentiment: NULL, 0:0*) price levels.
Price Level:Volume Sentiment For SPY ETF Over The Past 2-3 Years
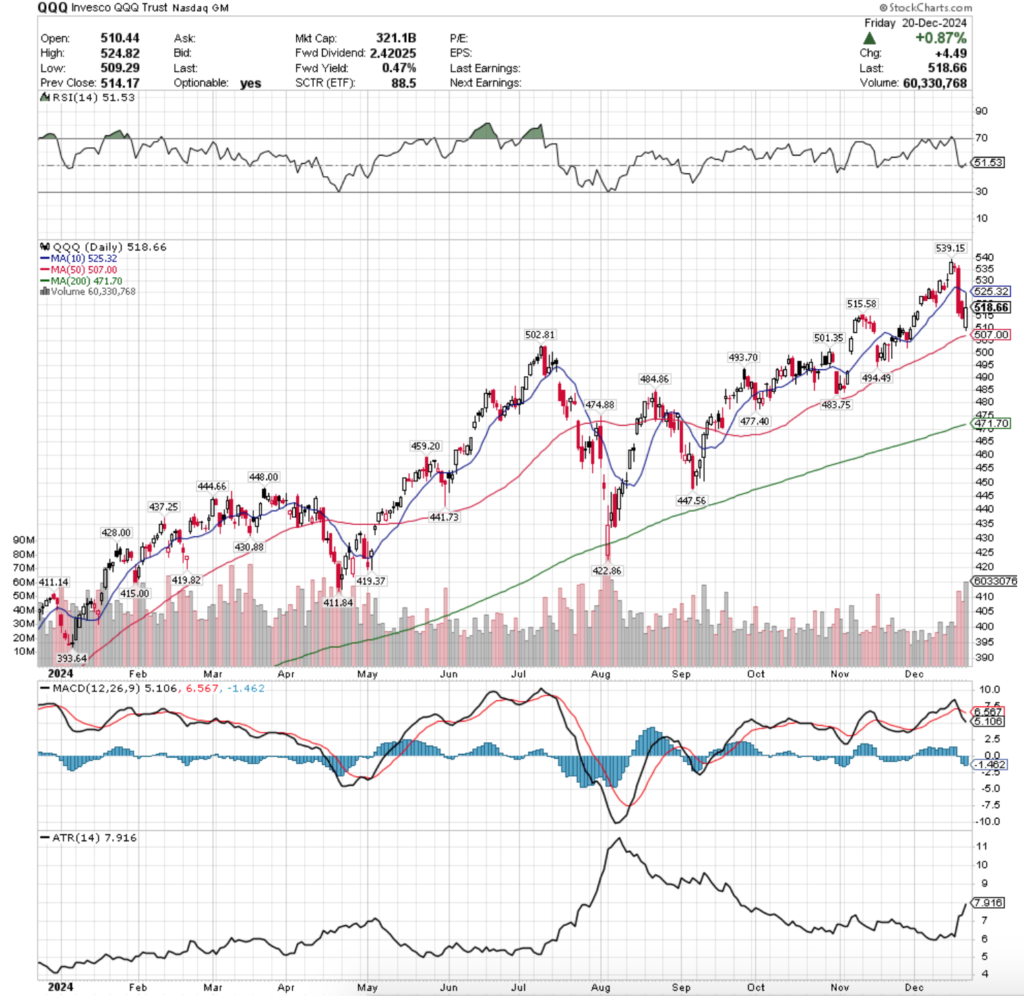
QQQ ETF – Invesco QQQ Trust ETF’s Technical Performance Over The Past Year
Their RSI is trending higher & sits at 51.53, while their MACD is bearish.
Volumes were +19.35% last week vs. the previous year’s average (44,446,000 vs. 37,240,478), as market participants were eager to get out of the pool on Wednesday & Thursday, but covering activity squeezed prices higher heading into the weekend.
QQQ opened the week on a more optimistic note than SPY, but it wasn’t without some caution signals.
Particularly of note was the low volume on Monday that helped QQQ hit a fresh all-time high despite it being a more solid advancing session than SPY’s.
Tuesday’s spinning top candle arrived on low volume as well & formed a bearish harami pattern with the prior day’s candle, which is when folks began heading to the door.
Wednesday opened slightly lower, but also on the second highest volume of the week ripped down straight through the support of the 10 day moving average.
Confirmation came on Thursday when on similar volume (slightly lower) the session opened briefly higher, before continuing to decline lower than Wednesday’s lower & price broke down below the $515/share mark.
Like SPY, QQQ’s Friday morning coffee came with a side order of lower, but it was able to briefly rally intraday to test the 10 DMA’s resistance, got rejected & closed in the middle of Thursday’s range.
This week it will be worth watching how the relatively untested $515.58/share support level holds up, as it’s recently broken down & prices are only above it due to Friday’s session, which while it may normal constitute a reversal opportunity, seems unlikely given that it occurred heading into tumbleweed volume week(s).
The next area of focus will be on the 50 DMA, not just as it is the next support level, but because once that support breaks down QQQ will be on unstable footing.
While QQQ has more local support touch-points than SPY, at the price levels we see now if the 50 DMA breaks down they may not be as resilient of support levels as originally thought if the moving mid-term trend has broken (as we’ve seen three times already in 2024).
QQQ has support at the $515.58 (Volume Sentiment: NULL, 0:0*), $507 (50 Day Moving Average, Volume Sentiment: NULL, 0:0*), $502.81 (Volume Sentiment: Buyers, 2:0*) & $501.35/share (Volume Sentiment: Buyers, 2:0*) price levels, with resistance at the $525.32 (10 Day Moving Average, Volume Sentiment: NULL, 0:0*) & $539.15/share (All-Time High, Volume Sentiment: NULL, 0:0*) price levels.
Price Level:Volume Sentiment For QQQ ETF Over The Past 2-3 Years
IWM, the iShares Russell 2000 ETF declined -4.78% last week, as investors were eager to jump out of the components of the small cap index.
IWM ETF – iShares Russell 2000 ETF’s Technical Performance Over The Past Year
Their RSI is rebounding from the oversold 30 mark & sits currently at 34.67, while their MACD is still bearish & near the lowest levels on its histogram.
Volumes were +40.84% above the prior year’s average last week (44,674,000 vs. 31,720,637), which is alarming given that two of the top three highest volume days were declining sessions & IWM had already been in decline for three weeks before this.
Looking at their MACD you can observe that they’ve been falling since around Thanksgiving time, so that much outflow is reason for concern.
IWM’s chart for the week closely resembles SPY & QQQ’s in terms of intraday action, so in the spirit of the holidays we’ll give the gift of brevity here.
Monday’s weak volumes on an advancing day that did not reach high enough to test the resistance of the 10 day moving average set the stage for the declines of the prior few weeks to continue, and they did on Tuesday, on volume that was slightly higher than Monday’s.
Wednesday put the nails in IWM’s coffin, as the day did manage to test the 10 DMA’s resistance, but proceeded to decline through the 50 DMA & showed more weakness than SPY & QQQ in relation to the price:moving averages relationship.
Thursday & Friday also mimicked SPY & QQQ, but more damage was done in the days leading up to them.
This coming week keep an eye on the 10 & 50 day moving averages, anticipating a bearish crossover by Christmas.
From there broader market sentiment will become more important, as while IWM’s steady oscillating around an average price to slowly climb higher gives them more support levels than other indexes, if the larger cap names are showing severe weakness the small cap names won’t be spared from pain as well.
It should also be noted that IWM is only 4.24% above its 200 DMA’s support, which if that longer term trend breaks down may lead to further declines, particularly as it currently sits in a price zone that is historically Seller dominated 1.5:1 which may cause more of a further breakdown based on how the other indexes behave.
IWM has support at the $221.04 (Volume Sentiment: Buyers, 2:1), $216.73 (Volume Sentiment: Buyers, 1.4:1), $214.01 (Volume Sentiment: Sellers, 1.5:1) & $213.96/share (Volume Sentiment: Sellers, 1.5:1) price levels, with resistance at the $223.51 (Volume Sentiment: Buyers, 2:1), $225.20 (Volume Sentiment: Sellers, 2:1), $225.73 (Volume Sentiment: Sellers, 2:1) & $226.50/share (Volume Sentiment: Sellers, 2:1) price levels.
Price Level:Volume Sentiment For IWM ETF Over The Past 2-3 Years
DIA ETF – SPDR Dow Jones Industrial Average ETF’s Technical Performance Over The Past Year
Their RSI is climbing higher after bouncing off of the oversold 30 level last week & sits at 39.53 due to the last two sessions of the week, while their MACD is bearish & near the lower end of its histogram.
Volumes were +30.13% above the previous year’s average (4,456,000 vs. 3,424,382), which is a bearish signal given that there was only one actual bullish session on the week.
The primary difference between DIA’s week & IWM’s vs. SPY/QQQ’s is that Tuesday’s session that was supported by the 50 day moving average was on a gap down & that Thursday’s session was advancing, but that it opened higher than it closed, forming what appears as a bullish harami, but that is bearish when you consider the price action of the day.
For the sake of brevity, this week watch for the impending 10 & 50 day moving average bearish crossover, which will likely push prices lower to close the window created by the US election’s gap up.
Should this happen & oscillators get stretched out lower, keep an eye out for an emerging head & shoulders pattern with the $431.69/share from October being the left shoulder.
There isn’t as much support nearby for DIA vs. IWM, but given that DIA is the blue chip index it may not matter much, given that the component stocks are names that are most likely to be bought & held over the long-term anyways.
In the event of declines, it is worthwhile assessing the strength of their support levels using the table below & the ratios contained in it in order to gauge when market participants may step in to stop losses.
DIA has support at the $428.40 (Volume Sentiment: Buyers, 1.4:1), $414.99 (Volume Sentiment: Buyers, 3:1), $413.73 (Volume Sentiment: Buyers, 3:1) & $410.53/share (Volume Sentiment: Buyers, 9:1) price levels, with resistance at the $431.69 (Volume Sentiment: Buyers, 1.4:1), $433.64 (50 Day Moving Average, Volume Sentiment: Buyers, 0.6:0*), $435.08 (10 Day Moving Average, Volume Sentiment: NULL, 0:0*) & $443.32/share (Volume Sentiment: NULL, 0:0*) price levels.
Price Level:Volume Sentiment For DIA ETF Over The Past 3-4 Years
The Week Ahead
It looks to be a quiet holiday week ahead!
Monday the week kicks off with Consumer Confidence, Durable-Goods Orders & Durable-Goods minus transportation data at 8:30 am, followed by New Home Sales at 10 am.
There are no earnings reports scheduled for Monday, Tuesday or Wednesday & Tuesday the market closes at 1pm.
Tuesday & Wednesday have no major data announcements as it is the Christmas Holiday.
Initial Jobless Claims data are released Thursday morning at 8:30 am.
Friday winds the week down with Advanced U.S. Trade Balance in Goods, Advanced Retail Inventories & Advanced Wholesale Inventories data at 8:30 am.
There are no earnings reports on Thursday or Friday this week either.
See you back here next week!
*** I DO NOT OWN SHARES OR OPTIONS CONTRACT POSITIONS IN SPY, QQQ, IWM OR DIA AT THE TIME OF PUBLISHING THIS ARTICLE ***
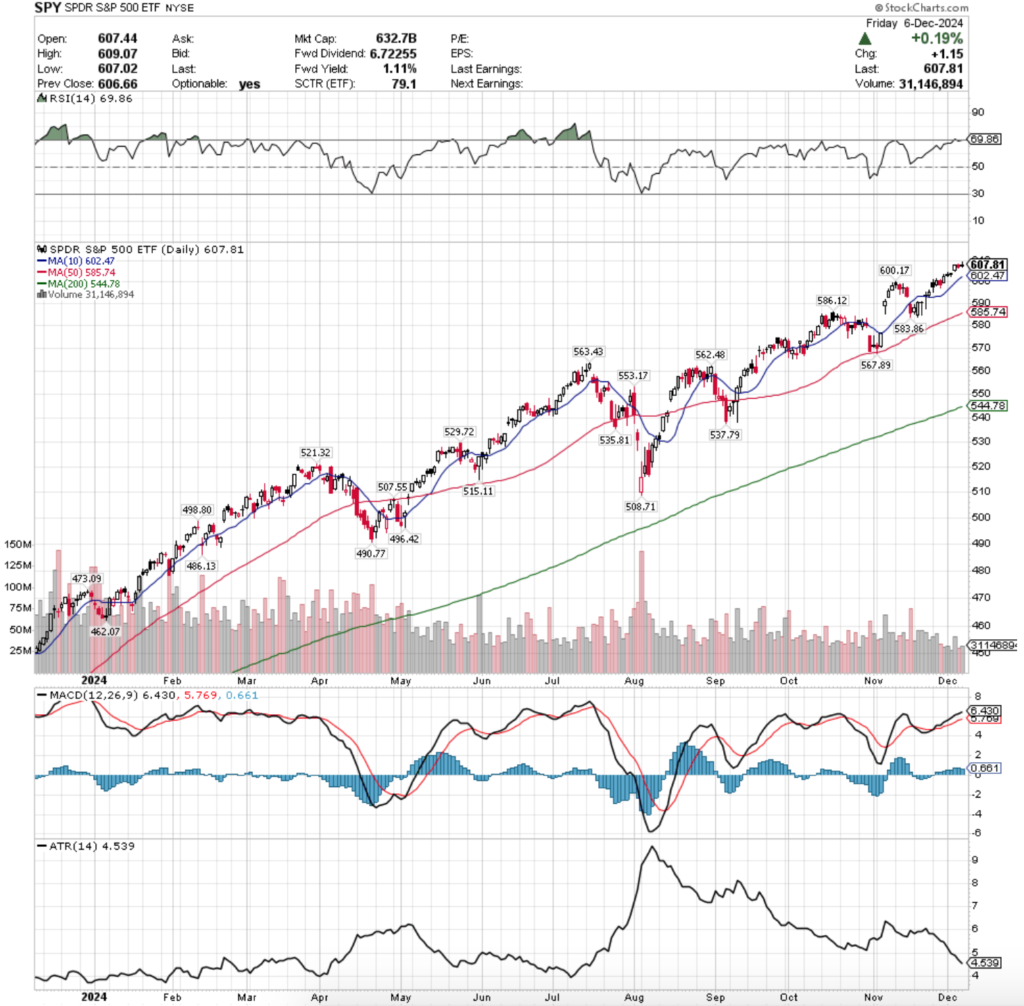
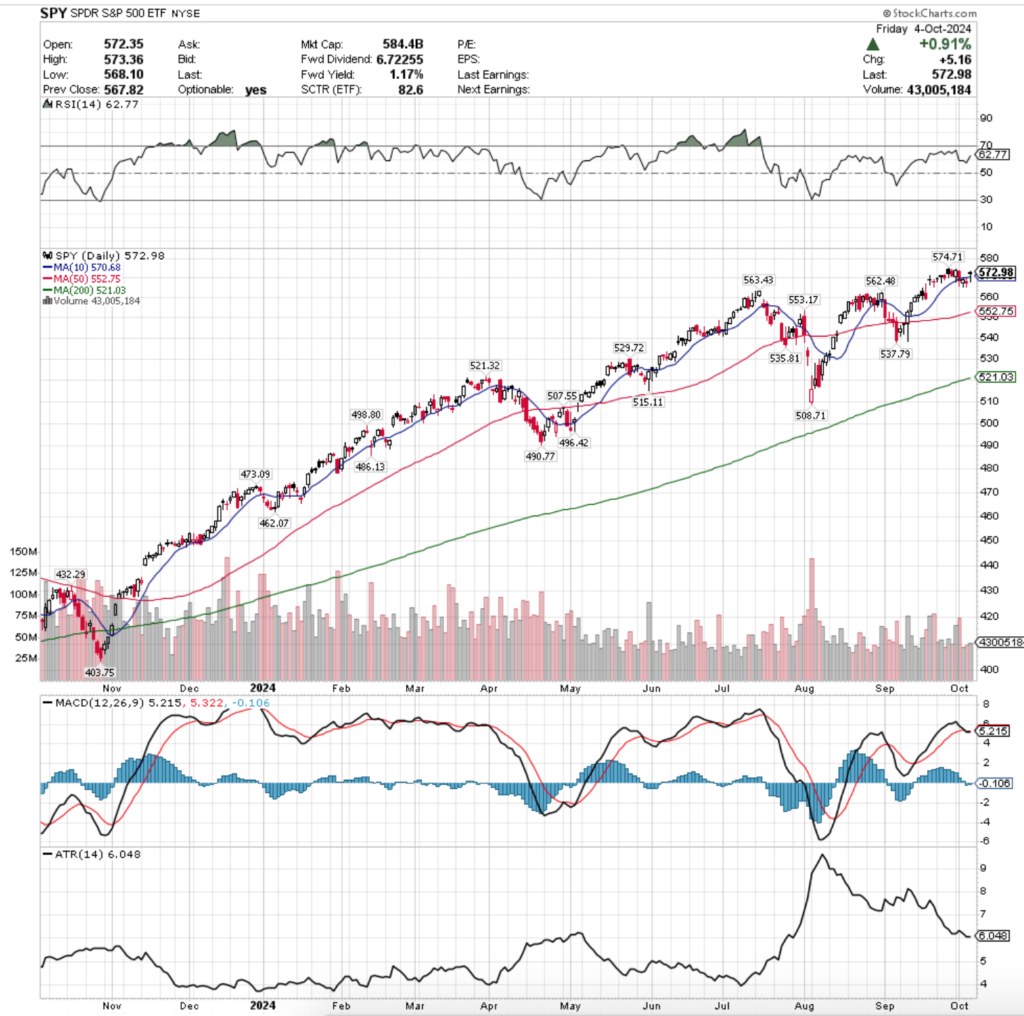
SPY, the SPDR S&P 500 ETF gained +0.87% last week, while the VIX closed at 12.77, indicating an implied one day move of +/-0.81% & an implied one month move of +/-3.69%.
SPY ETF – SPDR S&P 500 ETF’s Technical Performance Over The Past Year
Their RSI is approaching the overbought mark & currently sits at 69.86, while their MACD is bullish, but the histogram is beginning to wane
Volumes were -45.47% lower than the previous year’s average (32,290,000 vs. 59,219,960), as market participants continue to tread cautiously so close to all-time high prices for SPY.
Things are beginning to look like the latter portion of a Jenga game with the low volumes & tight daily ranges that we have been seeing over the past few weeks.
Monday the week began on a quiet note, resulting in a low volume session that ended as a doji, indicating that there was uncertainty, but temporary equilibrium for SPY’s price, with the day’s upper shadow indicating that there was small appetite for the upside.
Tuesday featured more of the same, when the day closed as another doji candle that had a tight range for the session on even less volume than Monday.
Wednesday is where most of the week’s advancing price action came from, on account of the gap up open that came on the strongest volume of the week.
Sentiments returned to cautious on Thursday though & some profits from the gap’s jump were taken, as the session ended in a bearish harami pattern with Wednesday’s candle, indicating that there was fear on the horizon.
This carried into Friday, whose candle resembled that of the ones from earlier in the week & the week ended with a gravestone doji on a +0.19% gain for the day.
This week all eyes will be on Wednesday & Thursday for CPI & PPI data as it will lend clues as to what direction interest rates will move in (or stay the same) in the coming month.
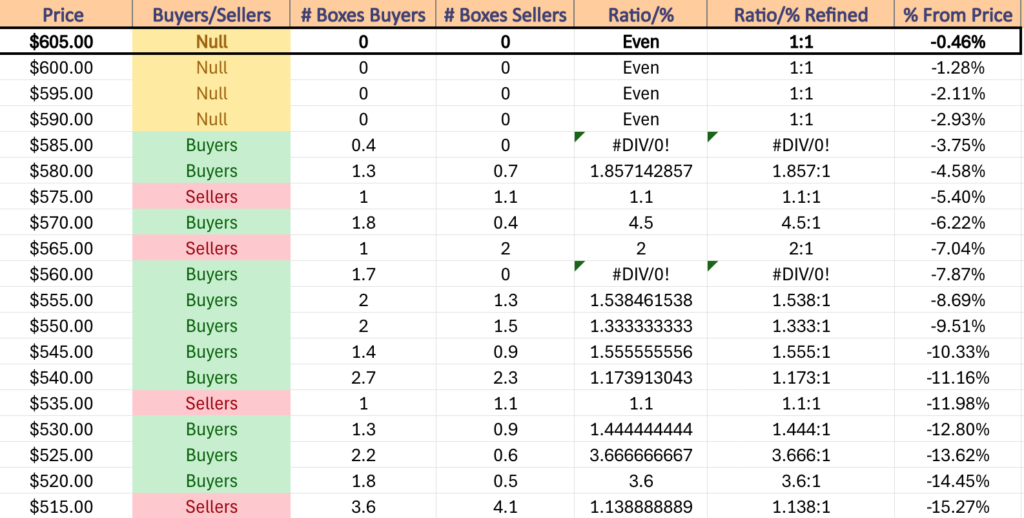
A key thing to watch will be should there be a 1% decline for SPY whether or not the $600.17/share support level holds up, as otherwise the next support level is not until $586.12, which is another -2.34% (totaling ~3.4%).
Another reason that this is important is because in the event that that level does not hold up, prices would likely pass bearishly through the 50 day moving average as well, which would open SPY up to test the window that was created in early November when prices gapped up over the 10 day moving average.
Despite the low volume the market was able to continue on & set a new all-time high last week, but that waning volume sentiment is indicating that there is a lack of confidence at the moment in SPY & it is difficult to see it climbing much higher without more volume & participation.
Due to the nature of SPY’s low volume while near all-time highs there is not much point in examining upside potential from where they sit currently & it is more important to understand how SPY may fall in the event of a decline/profit taking.
SPY has support at the $602.47 (10 Day Moving Average, Volume Sentiment: NULL, 0:0*), $600.17 (Volume Sentiment: NULL, 0:0*), $586.12 (Volume Sentiment: Buyers, 0.4:0*) & $585.74/share (50 Day Moving Average, Volume Sentiment: Buyers, 0.4:0*) price levels, with resistance at the $609.07/share (All-Time High, Volume Sentiment: NULL, 0:0*) price level.
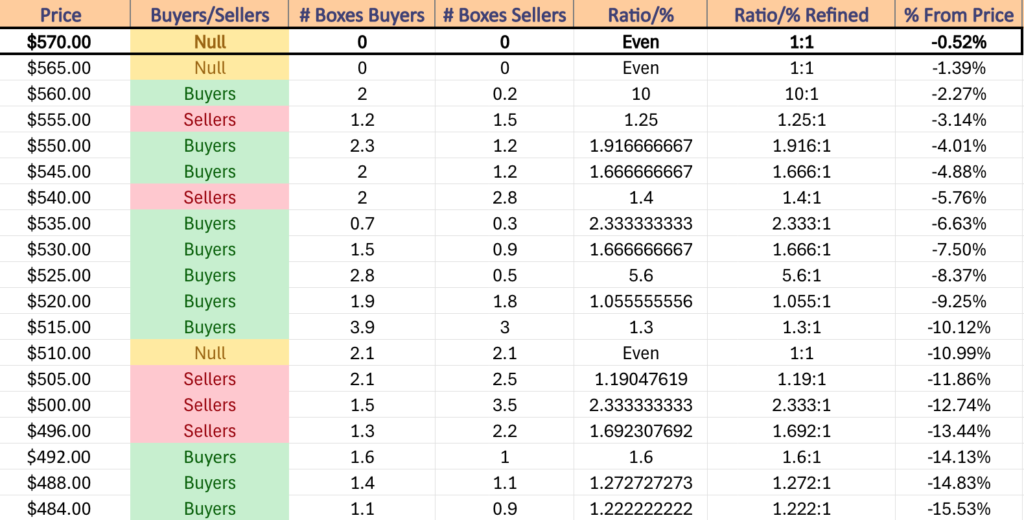
SPY ETF’s Price Level:Volume Sentiment Over The Past ~2 Years
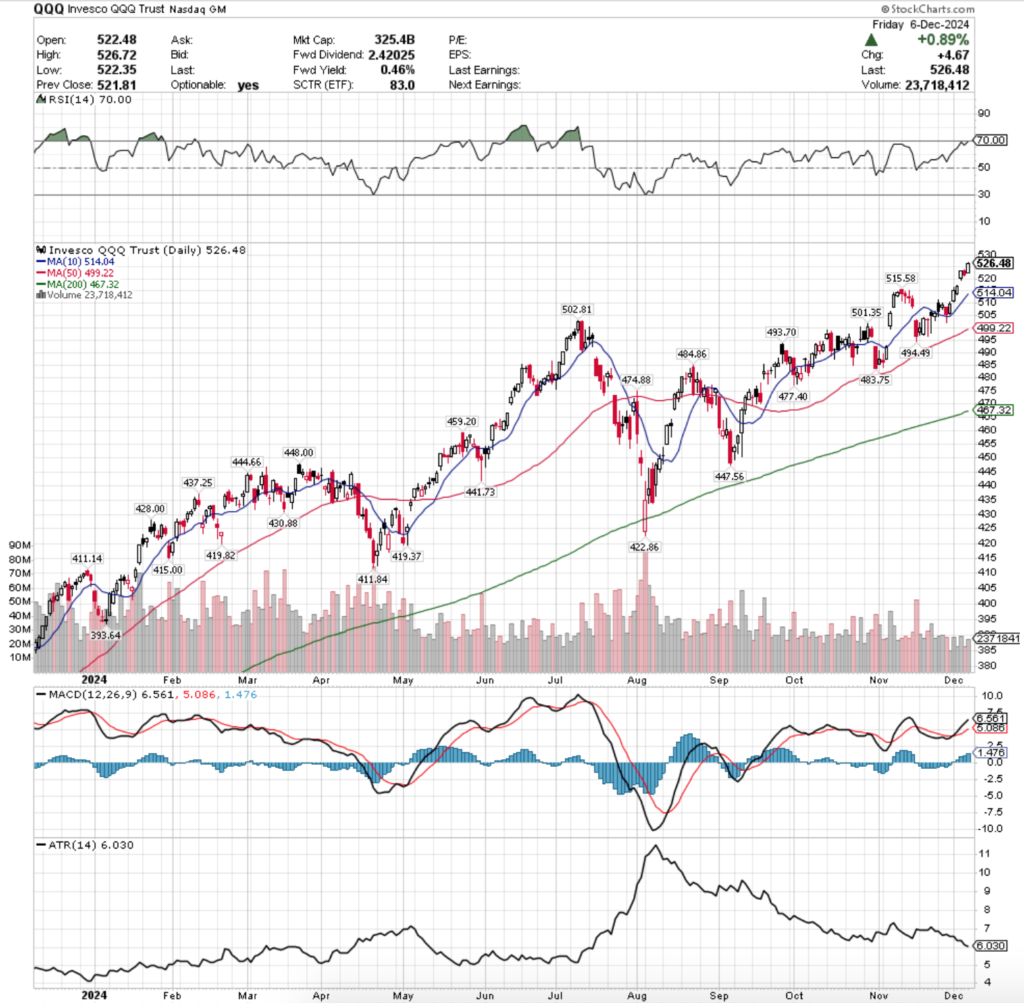
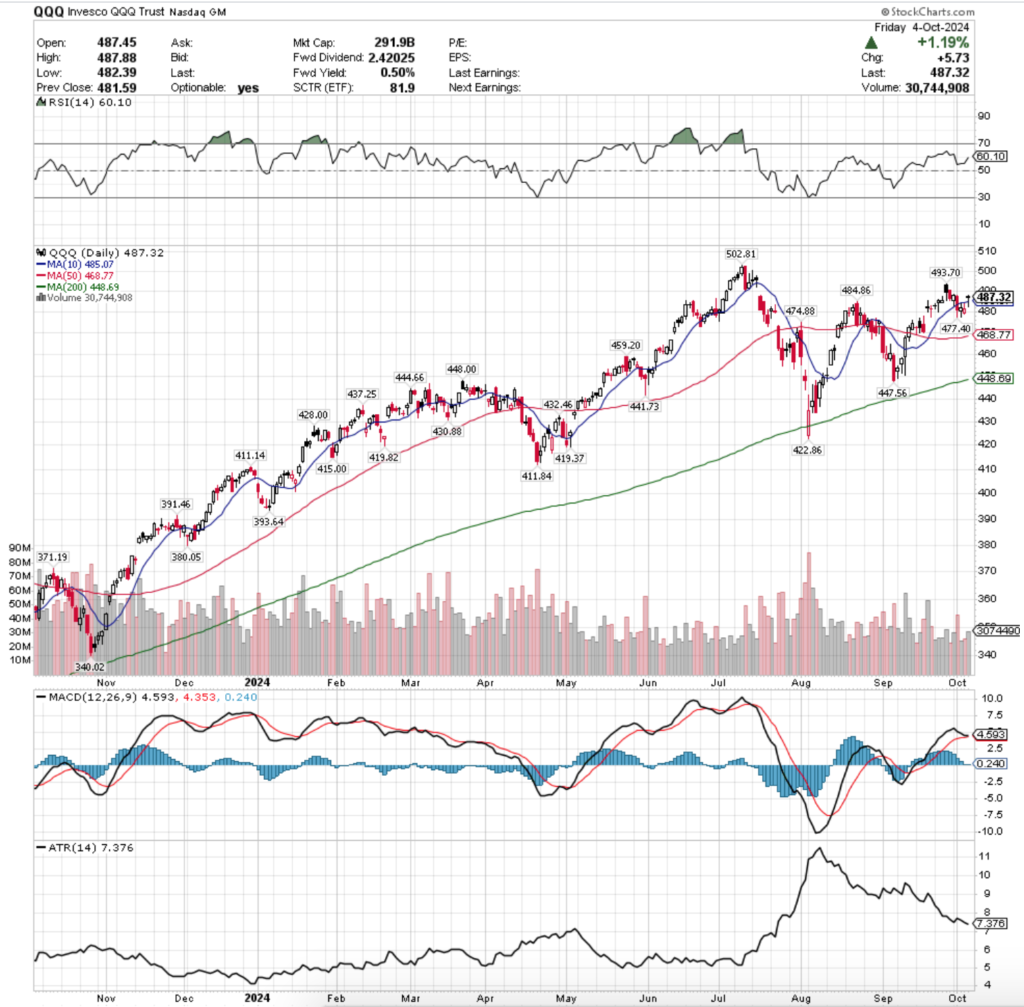
QQQ, the Invesco QQQ Trust ETF advanced +3.28%, as investors favored the tech-heavy index the most out of the major four index ETFs.
QQQ ETF – Invesco QQQ Trust ETF’s Technical Performance Over The Past Year
Their RSI closed at the overbought level of 70 on Friday, while their MACD remains bullish in the wake of Wednesday’s gap up session.
Volumes were -40.9% lower than the prior year’s average (22,354,000 vs. 37,825,929), as market participants were just as wary of QQQ as they were of jumping into SPY.
This should be noted, as SPY’s week featured weak volume but smaller daily ranges covered by their candlesticks compared to the broader sessions of QQQ’s week.
Monday kicked the week off on a gap up open for QQQ, which continued rising on the week’s second highest volume.
Tuesday volumes decreased but the advances continued for QQQ as prices were able to break back above the $515/share price level.
Wednesday opened on a gap up for QQQ much like it did for SPY on the week’s strongest volume, before profit taking commenced on Thursday & QQQ declined.
Friday the week closed on a high note with a new all-time high being set.
This coming week will hope to see higher volumes for QQQ, as it is difficult to continue climbing with such weak participation at all-time highs.
Even if QQQ’s price can manage to notch another all-time high this week, the current environment’s sentiment is running on fumes & is not sustainable for much longer.
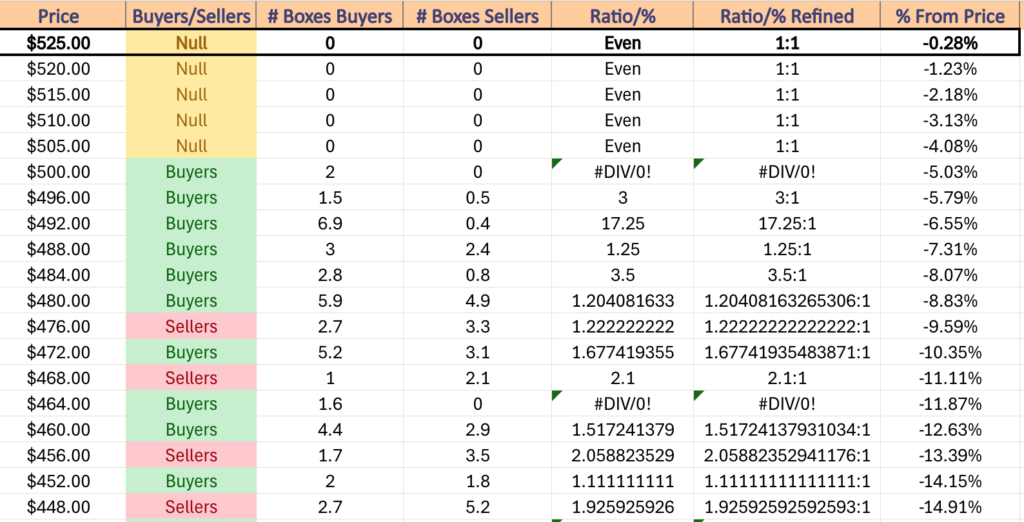
QQQ’s next support level is currently -2% below Friday’s closing price, which is just above their 10 day moving average.
Should those break down there aren’t any support levels for an additional -2.5%, at which point price would be wedged between the resistance of the 10 day moving average & the support of the 50 DMA.
It should be noted that most of the support levels for the first ~8-9% of declines from QQQ’s closing price on Friday have not faced significant seller pressure over the past ~2 years, which will be something to be mindful of in the event of retests in the near-future.
QQQ has support at the $515.58 (Volume Sentiment: NULL, 0:0*), $514.04 (10 Day Moving Average, Volume Sentiment: NULL, 0:0*), $502.81 (Volume Sentiment: Buyers, 2:0*) & $501.35/share (Volume Sentiment: Buyers, 2:0*) price levels, with resistance at the $526.72/share (All-Time High, Volume Sentiment: NULL, 0:0*) price levels.
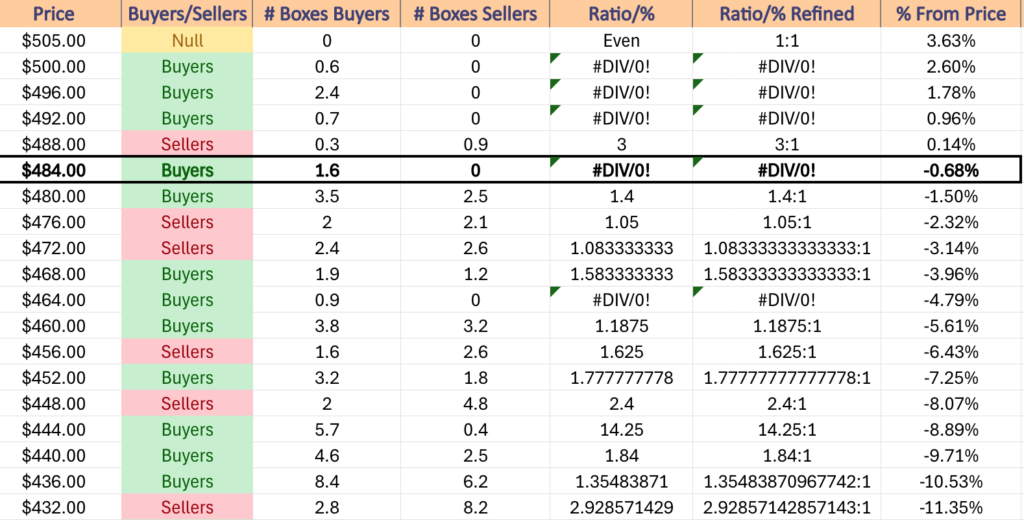
QQQ ETF’s Price Level:Volume Sentiment Over The Past ~2 Years
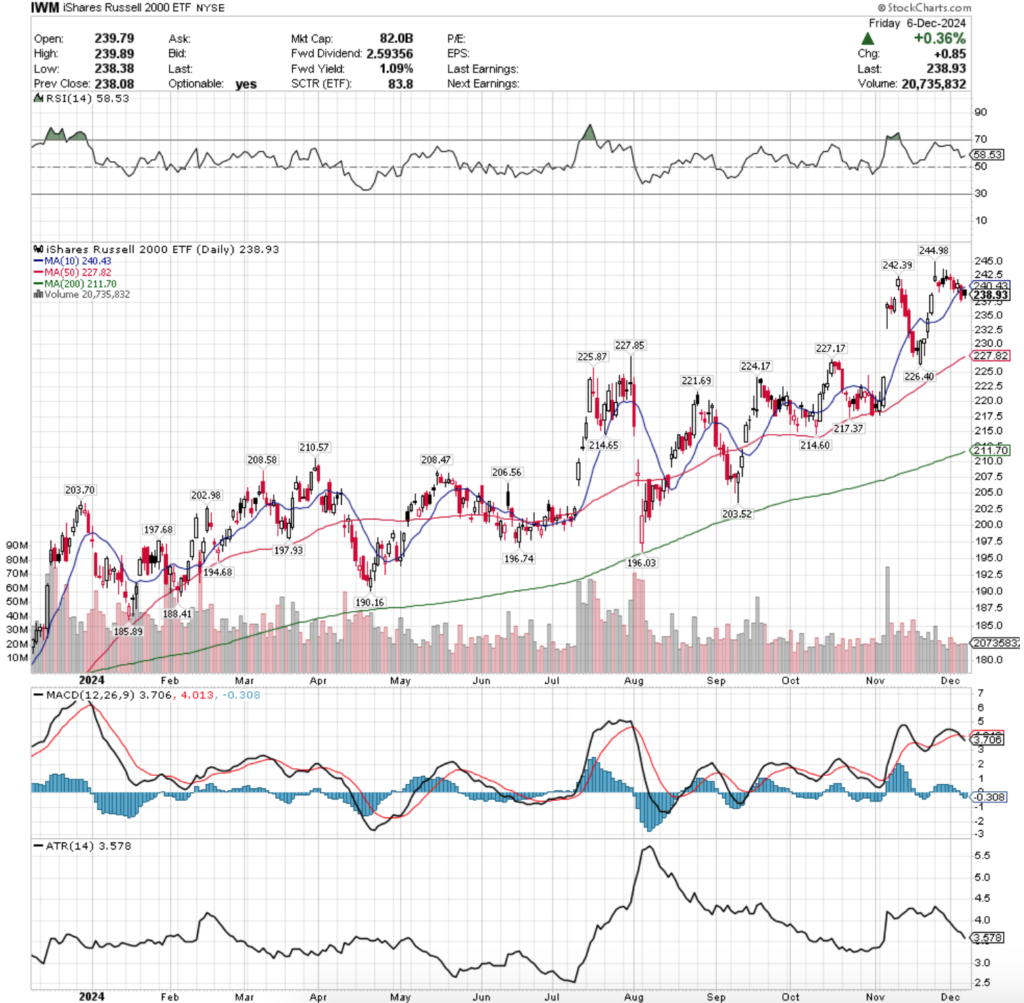
IWM ETF – iShares Russell 2000 ETF’s Technical Performance Over The Past Year
Their RSI is currently at 58.53, while their MACD crossed over the signal line bearishly on Thursday.
Volumes were -33.9% lower than the prior year’s average (21,508,000 vs. 32,537,075), as market participants were even unenthusiastic about the small cap index.
Given that IWM declined on low volume it is not as bad of a sentiment reading than QQQ who advanced on even lower volume, but it is still a signal to take caution.
Monday set the stage for the week of declines, as the highest volume of the week came on a session that resulted in a hanging man candle whose lower shadow extended all the way down to the $240/share level.
Tuesday IWM’s slide continued as the session opened lower, attempted to reach the open of Monday’s session but was unable to & the rest of the session was spent in decline.
Wednesday the bleeding was temporarily halted, but there was a lot of uncertainty in the air given the week’s lowest volume session also resulted in a spinning top candle whose lower shadow was perched atop of the support of the 10 day moving average.
Thursday that support gave way shortly after the session’s open & the $237.50/share level was briefly touched, but IWM was able to close just above it, leading into Friday’s gap up open that proceeded to decline as the day wore on.
Friday’s session formed a bearish harami pattern with Thursday’s, which is troubling entering a new week when the nearest support level for IWM is -4.64% below their closing price on Friday.
The good news for IWM is that the 50 day moving average and another support level reside in the $227-228/share price range, but the bad news is that over the past ~2 years there has been 2 Sellers for every Buyer at this price level.
This is particularly bad for IWM here as this price level upon being reached has often resulted in further declines, which will be something to be mindful of in the event of a retest.
The good news in the event of a retest is that there are lots of support touch points below it, but to reach those levels the price would have to pass below the 50 day moving average’s support, placing it then below both the 10 & 50 DMAs.
IWM has support at the $227.85 (Volume Sentiment: Sellers, 2:1), $227.82 (50 Day Moving Average, Volume Sentiment: Sellers, 2:1), $227.17 (Volume Sentiment: Sellers, 2:1) & $225.87/share (Volume Sentiment: Sellers, 2:1) price levels, with resistance at the $240.43 (10 Day Moving Average, Volume Sentiment: NULL, 0:0*), $242.39 (Volume Sentiment: NULL, 0:0*) & $244.98/share (All-Time High, Volume Sentiment: NULL, 0:0*) price levels.
IWM ETF’s Price Level:Volume Sentiment Over The Past ~2 Years
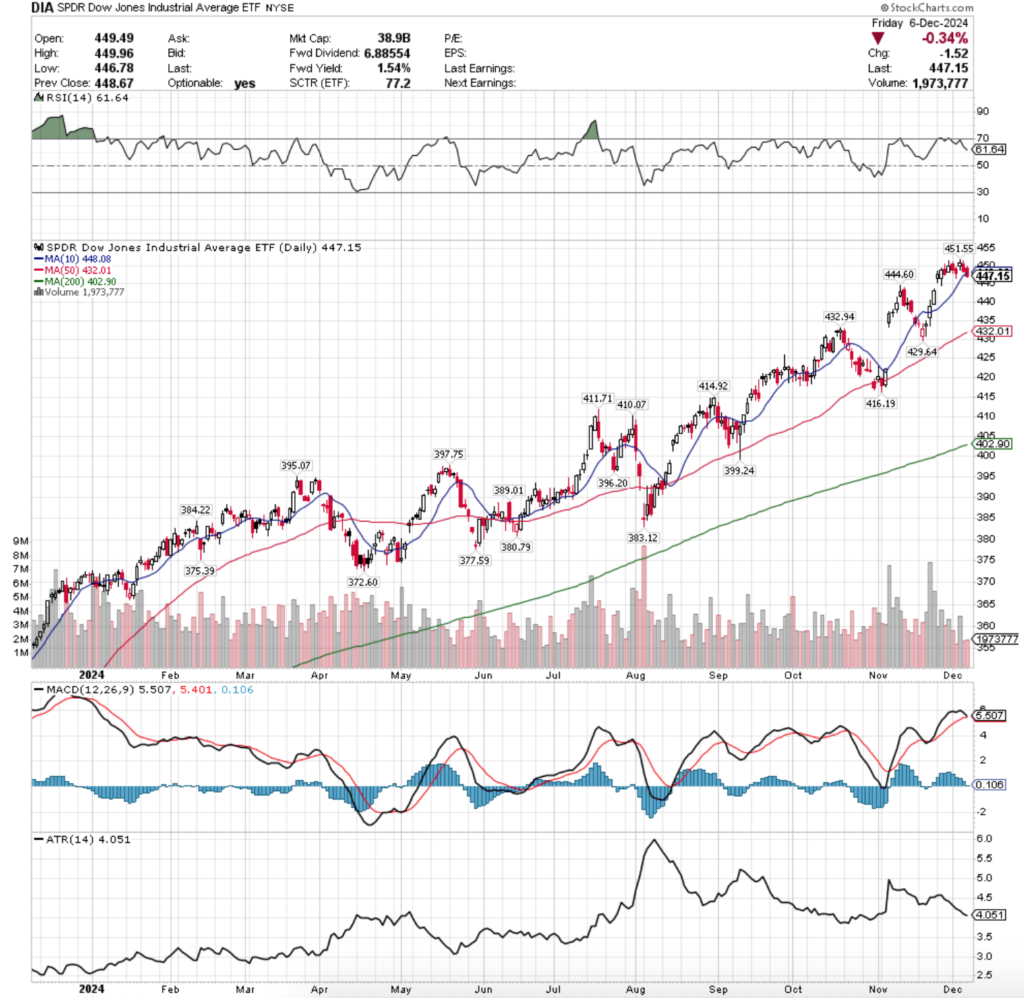
DIA ETF – SPDR Dow Jones Industrial Average ETF’s Technical Performance Over The Past Year
Their RSI is trending back towards neutral & sits currently at 61.64, while their MACD is set to cross over the signal line bearishly on Monday.
Volumes were -31% lower than the previous year’s average (2,388,000 vs. 3,460,000) & market participants were even not diving into the safety of blue chip names near these all-time highs across the major four indexes.
One thing that jumps out immediately when looking at DIA’s chart is that Friday’s close occurred below the support of the 10 day moving average while the price still sits on the island that formed two weeks ago.
Much like IWM, DIA started the week off on a foreboding note with a session that opened higher than Friday’s close, tested slightly higher briefly, before ultimately declining.
Tuesday followed suit & DIA continued lower, but managed to close down only midway through the day’s total range.
Wednesday showed some brief optimism by opening on a gap up, but uncertainty was the story coming into the close as the session ended as a spinning top candle on the highest volume of the week & a new all-time high was hit for DIA.
Thursday the declines continued, although there was an attempt made to reach the high of Wednesday & set another all-time high, but market participants did not want to assume more risk.
Risk-off sentiment continued into the weekend, as the third highest volume of the week came on Friday’s declining session that broke through the support of the 10 DMA.
This week will be important to keep an eye on the window that created the island that DIA’s been trading on for the past two weeks or so, as now that it has broken through the support of the 10 DMA it looks set to potentially fill the gap.
Another area of interest to observe is that if the $444.60/share support level is broken through in the coming days, the next support level doesn’t occur for another -2.6% (-3.6% total from Friday’s closing price).
If that breaks down then price will enter into a range where there have historically been some strong Sellers:Buyers until the $414.92/share support level is reached.
As with all of the others above, when this close to all-time highs & on such weak volumes there is not much point to describing potential upside activity.
DIA has support at the $444.60 (Volume Sentiment: NULL, 0:0*), $432.94 (Volume Sentiment: Buyers, 0.6:0*), $432.01 (50 Day Moving Average, Volume Sentiment: Buyers, 0.6:0*) & $429.64/share (Volume Sentiment: Buyers, 1.4:1) price levels, with resistance at the $448.08 (10 Day Moving Average, Volume Sentiment: ) & $451.55/share (All-Time High, Volume Sentiment: NULL, 0:0*) price levels.
DIA ETF’s Price Level:Volume Sentiment Over The Past ~4 Years
The Week Ahead
Monday kicks the week off with Wholesale Inventories data at 10 am.
Hello Group reports earnings before Monday’s opening bell, followed by Toll Brothers, Braze, C3.ai, Casey’s General, MongoDB, Oracle, Phreesia, Vail Resorts & Yext after the session’s close.
NFIB Optimism Index data is released Tuesday at 6 am, followed by U.S. Productivity (revision) data at 8:30 am.
Tuesday morning features earnings reports from Academy Sports + Outdoors, AutoZone, Designer Brands, Ferguson, G-III Apparel, Ollie’s Bargain Outlet & United Natural Foods, with Dave & Buster’s, GameStop & Stitch Fix reporting after the closing bell.
Wednesday brings us Consumer Price Index, CPI Year-over-Year, Core CPI & Core CPI Year-over-Year data at 8:30 am, followed by Month U.S. Federal Budget data at 2pm.
Cognyte Software, Photronics & REV Group report earnings on Wednesday morning, with Adobe, Nordson & Oxford Industries reporting after the session closes.
Initial Jobless Claims, Producer Price Index, Core PPI, PPI Year-over-Year & Core PPI Year-over-Year data are all scheduled to be released Thursday morning at 8:30 am.
Thursday morning’s earnings report comes from Ciena, with Broadcom, Costco Wholesale & RH reporting after the closing bell.
Friday winds the week down with Import Price Index & Import Price Index minus Fuel data at 8:30 am & there are no noteworthy earnings reports scheduled for the day.
See you back here next week!
*** I DO NOT OWN SHARES OR OPTIONS CONTRACT POSITIONS IN SPY, QQQ, IWM OR DIA AT THE TIME OF PUBLISHING THIS ARTICLE ***
SPY, the SPDR S&P 500 ETF added +1.67% this past week, while the VIX closed at 15.24 indicating an implied one day move of +/-0.96% & an implied one month move of +/-4.41%.
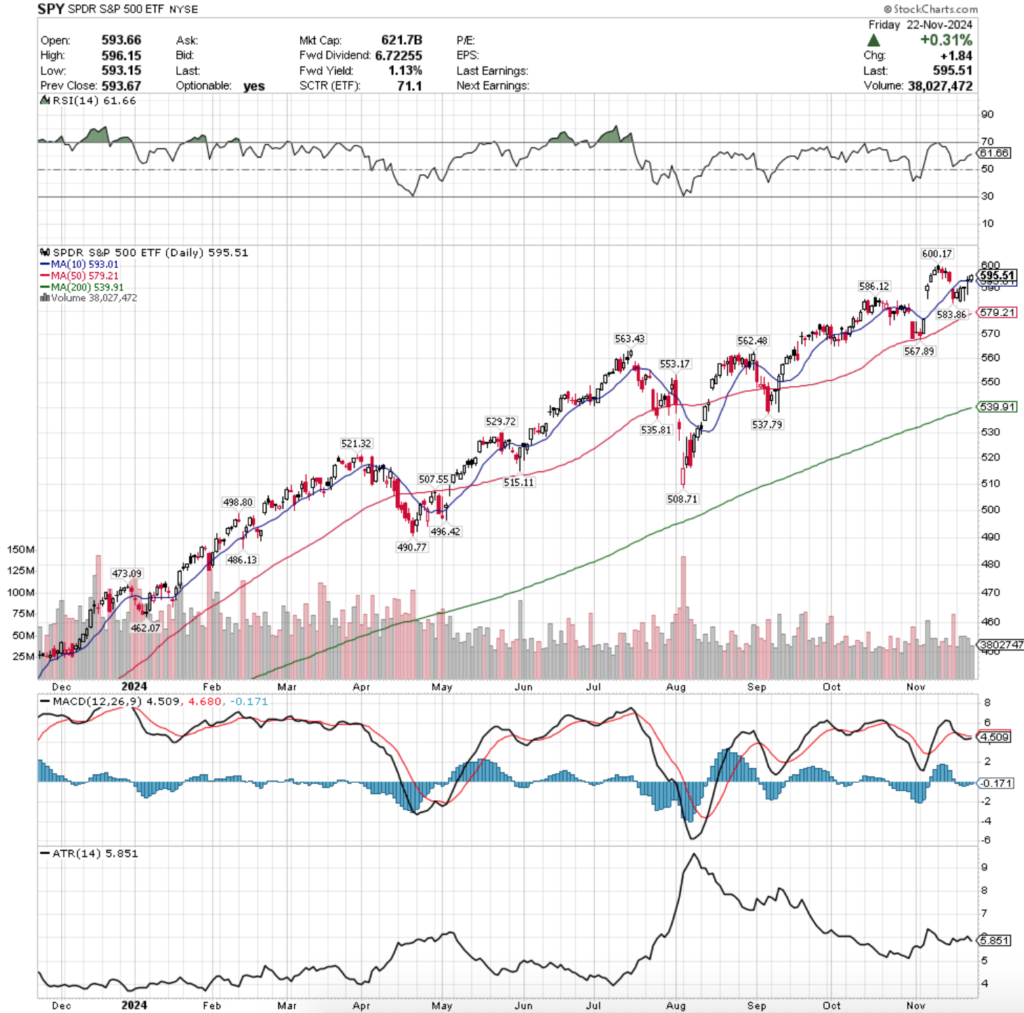
SPY ETF – SPDR S&P 500 ETF’s Technical Performance Over The Past Year
Their RSI is trending upward towards the overbought level again, currently sitting at 61.66, while their MACD is signaling that it’s poised for an early week bullish crossover before the Thanksgiving holiday.
Volumes were still weak, coming in -26.49% below the prior year’s average level (44,300,000 vs. 60,260,437), as market participants are still feeling a bit uneasy near these all-time high price levels.
The week started off on a optimistic, but uncertain note, as Monday’s session resulted in a spinning top that formed a bullish harami pattern with Friday’s candle on very light volume.
Tuesday opened lower but powered higher to form a bullish engulfing pattern with Monday’s candle & the volume was a bit higher, but still not the level of enthusiasm that is needed to continue to a new all-time high.
Wednesday’s session resulted in a dragonfly doji, indicating uncertainty given that it retraced the entire range of the prior day’s candle, but ultimately the day was able to close higher at the top of the session’s candle by the open.
Thursday opened on a gap up in line with the 10 day moving average’s resistance, tried higher but ultimately retraced below the close of Wednesday’s session before rallying back to close as a doji candle by the 10 DMA.
Friday opened in line with Thursday’s close but was able to close slightly higher, although indicating hesitancy & uncertainty as the low volume session closed as a spinning top candle.
This week it should be kept in mind that there are only 3.5 trading days, as Thursday is Thanksgiving & the market is closed & Friday is a half day.
Wednesday has a lot of data announcements & there are some earnings calls scheduled for early in the week that may impact SPY’s performance.
With that in mind, SPY looks primed to straddle the 10 DMA & trade around it on light, holiday week volume.
It is unlikely to get the volume needed to force a retest of the all-time high that sits ~1% above Friday’s close & if it was unable to be reached last week it seems less likely to happen on a short week when folks are traveling.
To the downside it will be interesting to see how the $590/share level holds up, given Tuesday’s close there & Wednesday’s doji candle resting right above it, but should it test any lower the chart below lists SPYs price level:volume sentiment over the past ~2 years.
SPY has support at the $593.01 (10 Day Moving Average, Volume Sentiment: NULL, 0:0*), $586.12 (Volume Sentiment: Buyers, 0.4:0*), $583.86 (Volume Sentiment: Buyers, 1.86:1) & $579.21/share (50 Day Moving Average, Volume Sentiment: Sellers, 1.1:1) price levels, with resistance at the $600.17/share (All-Time High, Volume Sentiment: NULL, 0:0*) price level.
SPY ETF’s Price Level:Volume Sentiment Over The Past ~2 Years
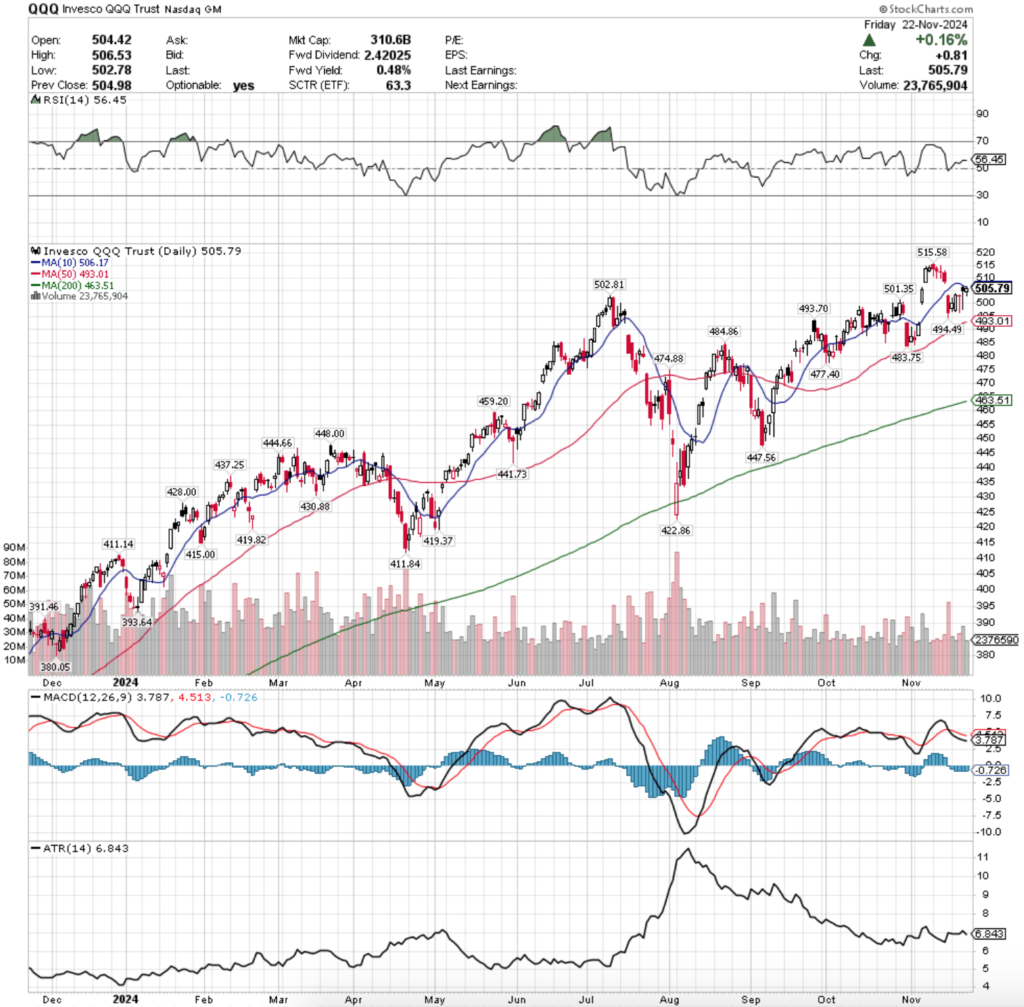
QQQ, the Invesco QQQ Trust ETF that tracks the NASDAQ 100 gained +1.86% last week, as investors were slightly more eager to pile into the tech heavy index than the S&P 500 components.
QQQ ETF – Invesco QQQ Trust ETF’s Technical Performance Over The Past Year
Their RSI is trending above the neutral level of 50 & sits at 56.45 but has flattened out recently, while their MACD is bearish but showing signs of a potential bullish crossover before the end of the week if the histogram shows weakness on Monday or Tuesday.
Volumes were the weakest of the major index ETFs, coming in -27.27% below the previous year’s average level (27.928,000 vs. 38,399,048), as investors are still not feeling confident about hopping back into the pool so close to all-time highs.
QQQ’s week began on a similar note to SPY’s with Monday’s candle forming a bullish harami with Friday’s & closing as a spinning top on low volume, indicating that there was a bit of uncertainty in the air.
Tuesday opened lower but was able to close higher, ending the day forming a bullish engulfing pattern with Monday’s candle, but again on weak volume.
Wednesday opened lower & tested lower than Tuesday’s lows, but was able to close in line with the open as a dragonfly doji, indicating that there was still a little upside appetite, but that people were taking profits throughout the day too.
Thursday opened on a gap higher to just beneath the resistance of the 10 day moving average, tested almost as low as Wednesday’s session’s low, but was able to rally higher to form a hanging man candle that closed lower than it opened on the highest volume session of the week.
It appears that a lot of market participants were taking profits those two days based on how low they tested, but bulls managed to push their closing prices back to the high end of the days’ ranges.
Friday left the week off on a note of bearish uncertainty for QQQ, as while the session advanced +0.16%, it resulted in a spinning top candle that was unable to break above the resistance of the 10 DMA, which has now curled over & is moving downward towards the price.
Much like SPY, QQQ is unlikely to make a run at their all-time high this week due to the short week & anticipated low volume that accompanies a holiday.
They’re likely to trade around the 10 DMA on light volume all week, pending no major news or bad data releases occur.
In the event of decline, QQQ has more local support levels than SPY which may control the rate of descent, but should that happen investors should begin watching for a bearish head & shoulders pattern, particularly given their 10 DMA is even looking like one.
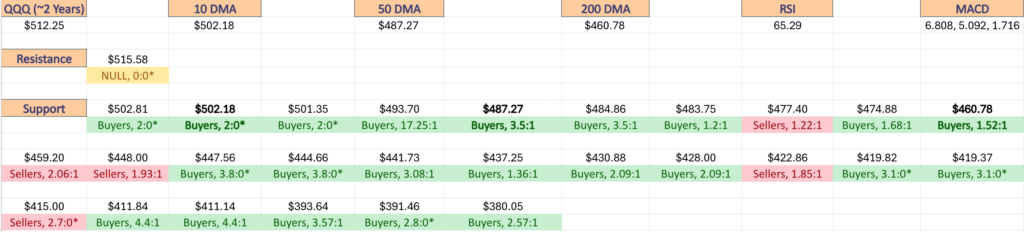
QQQ has support at the $502.81 (Volume Sentiment: Buyers, 2:0*), $501.35 (Volume Sentiment: Buyers, 2:0*), $494.49 (Volume Sentiment: Buyers, 17.25:1) & $493.70/share (Volume Sentiment: Buyers, 17.25:1) price levels, with resistance at the $506.17 (10 Day Moving Average, Volume Sentiment: NULL, 0:0*) $515.58/share (All-Time High, Volume Sentiment: NULL, 0:0*) price levels.
QQQ ETF’s Price Level:Volume Sentiment Over The Past ~2 Years
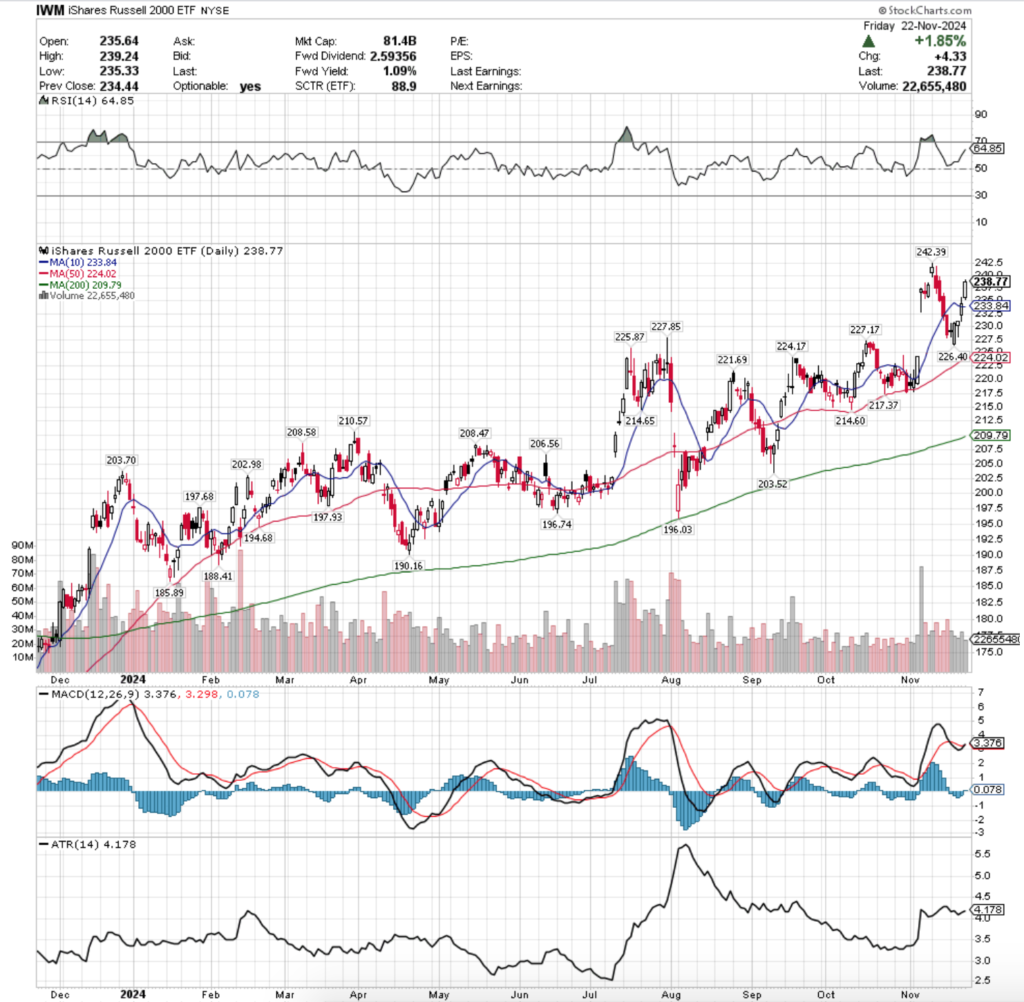
IWM, the iShares Russell 2000 ETF advanced +4.5% last week, as investors were eager to pile into the small cap index compared to the other three major index ETFs.
IWM ETF – iShares Russell 2000 ETF’s Technical Performance Over The Past Year
Their RSI is trending towards the overbought 70 level & currently sits at 64.85, while their MACD crossed over bullishly on Friday, but the histogram level is quite low which leaves room for skepticism on the strength of the crossover.
Volumes were also weak, coming in -20.59% below the prior year’s average level (26,200,000 vs. 32,994,484), as even small cap investors are feeling nervous near their all-time high.
Monday kicked the week off with bullish uncertainty, as the session created a bullish harami cross with Friday’s candle on some of the week’s highest volume.
Bullish engulfing Tuesday also hit IWM, as despite opening on a gap down the bulls came back & force the session to close above the high of Monday’s session.
Wednesday’s candle would be described as a hanging man if it occurred in an actual uptrend & not in the wake of a two day reversal, but market participants showed that there was still plenty of negative sentiment in the air, given the size of the lower shadow.
Thursday opened higher, signaled that there was some downside sentiment (or near-term profit taking) on the lower shadow, but was able to power through the 10 day moving average & close above it as there was a lot of advancing volume relative to every day that week but Monday.
Friday opened on a gap higher, briefly tested lower but the $235/share mark held strong & propelled IWM to close higher for a +1.85% gain on the day.
This week will be focused on whether or not the support of the 10 day moving avera
IWM has support at the $233.84 (10 Day Moving Average, Volume Sentiment: NULL, 0:0*), $227.85 (Volume Sentiment: Sellers, 2:1), $227.17 (Volume Sentiment: Sellers, 2:1) & $226.40/share (Volume Sentiment: Sellers, 2:1) price levels, with resistance at the $242.39/share (All-Time High, Volume Sentiment: NULL, 0:0*) price levels.
IWM ETF’s Price Level:Volume Sentiment Over The Past ~2 Years
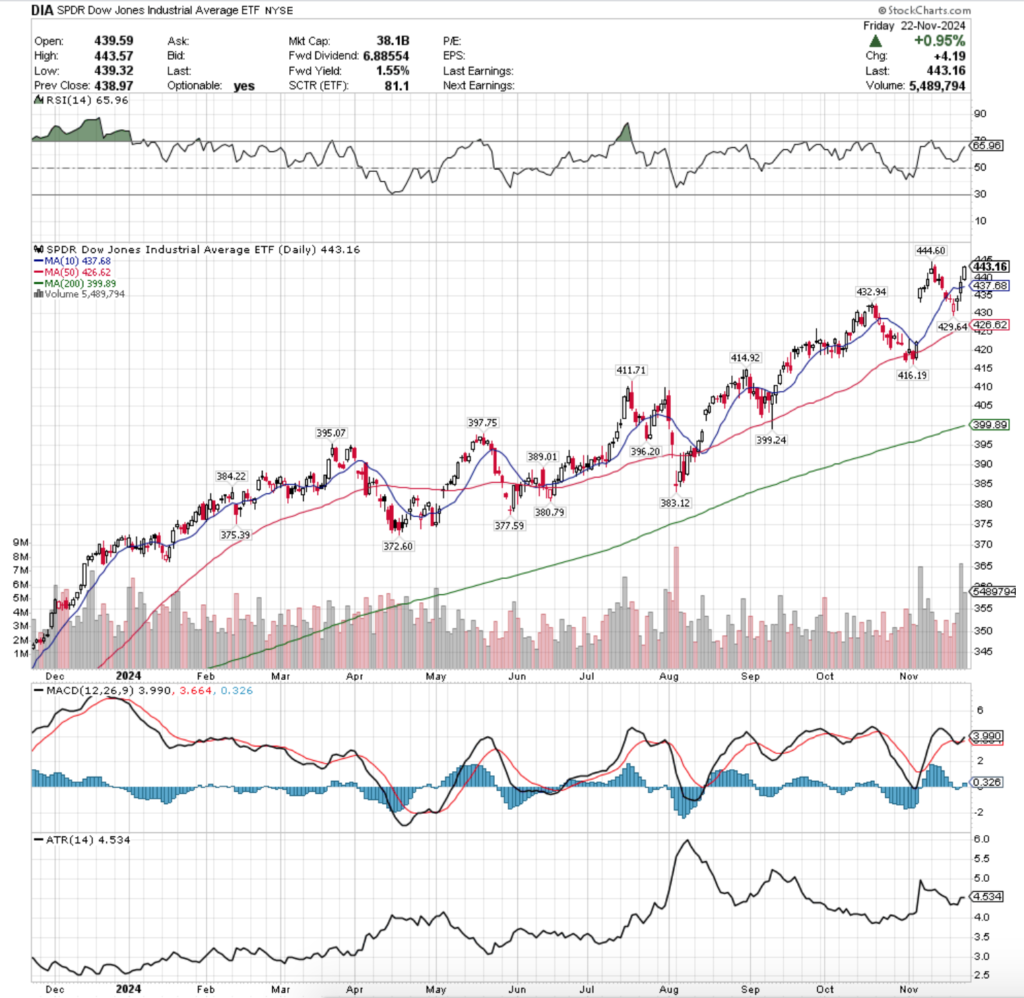
DIA ETF – SPDR Dow Jones Industrial Average ETF’s Technical Performance Over The Past Year
Their RSI is trending towards overbought & currently sits at 65.96, while their MACD crossed over bullishly on Friday, but the histogram level is rather muted, calling to question the strength of the signal.
Volumes were +28.8% above the previous year’s average (4,492,000 vs. 3,487,619), as investors were still feeling eager to get into the component names of the blue chip index.
Monday began the week on a note of muted uncertainty, as the day resulted in a doji candle for a slight decline on very weak volume.
Tuesday opened on a major gap down, but throughout the session bulls came in & were able to force the closing price above the open, but still for a declining session.
Wednesday was a tug of war between bulls & bears after opening on a gap up, as there was still plenty of bearish sentiment out there based on the size of the candle’s lower shadow, but the day managed to rally higher.
This set up the highest volume session of the week on Thursday, where the day opened on a gap up, there was some profit taking based on the lower shadow before powering through the 10 DMAs resistance to close above it.
The upper shadow on the day’s candle also indicated that there were market participants interested in seeing DIA continue its climb, which is what happened on Friday as another gap up session left DIA within $1.44 of its all-time high.
Based on the high volume heading into the weekend & the recent MACD bullish crossover it appears that DIA will at least break above its all-time high this week.
This brings with it a set of problems though, as once the oscillators overheat there will be profit taking from that batch of high volume we saw on Thursday & Friday & there are not that many nearby support levels for DIA.
In the event of a new ATH there would be support at $444.60 & at where ever the 10 day moving average winds up by then, as it will continue marching higher along with the price.
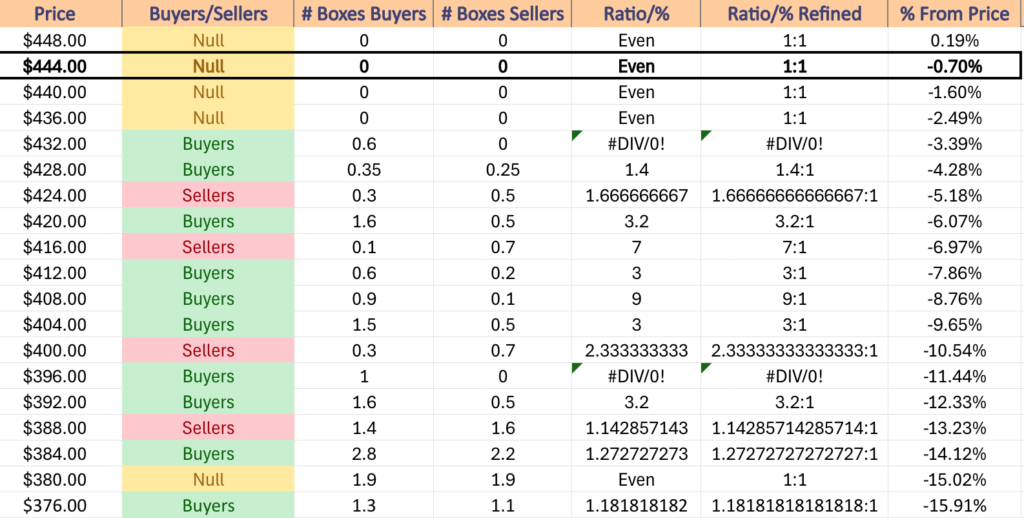
Another key area to keep an eye on in the event of a decline is that window that was created by the post-election gap up, as if the $429.64/share support level breaks down that will likely begin to fill, especially if prices enter the $424-427.99/share zone where Sellers have outpaced Buyers at a rate of 1.67:1 over the past 3-4 years.
DIA has support at the $437.68 (10 Day Moving Average, Volume Sentiment: NULL, 0:0*), $432.94 (Volume Sentiment: Buyers, 0.6:0*), $429.64 (Volume Sentiment: Buyers, 1.4:1) & $426.62/share (50 Day Moving Average, Volume Sentiment: Sellers, 1.67:1) price levels, with resistance at the $444.60/share (All-Time High, Volume Sentiment: NULL, 0:0*) price levels.
DIA ETF’s Price Level:Volume Sentiment Over The Past ~2 Years
The Week Ahead
Monday has no major economic announcements scheduled.
Bath & Body Works & Diana Shipping report earnings Monday morning before the opening bell, with Agilent Technologies, Central Garden, Enanta Pharmaceuticals, Fluence, Leslie’s, NJ Resources, Semtech, Woodward & Zoom Video Communications reporting after the closing bell.
S&P Case-Shiller Home Price Index (20 Cities) is released Tuesday at 9 am, Consumer Confidence & New Home Sales data comes out at 10 am & the Minutes of he Fed’s FOMC meeting are due out at 2pm.
Tuesday’ morning’s earnings kick off with Abercrombie & Fitch, American Woodmark, Analog Devices, Bank of Nova Scotia, Best Buy, Burlington Stores, Dick’s Sporting Goods, Embecta, J.M. Smucker, Kohl’s, Macy’s & Titan Machinery, followed by Dell Technologies, Ambarella, Arrowhead Pharmaceuticals, Autodesk, CrowdStrike, Guess?, HP Inc., Mitek Systems, Nordstrom, Nutanix, Urban Outfitters & Workday after the closing bell.
Wednesday is going to be a busy one on the data-front, starting with Initial Jobless Claims, Durable-Goods Orders, Durable-Goods minus Transportation, Advanced U.S. Trade Balance In Goods, Advanced Retail Inventories, Advanced Wholesale Inventories & GDP (first revision) are all due out at 8:30 am, followed by Personal Income (nominal), Personal Spending (nominal), PCE Index, PCE (year-over-year), Core PCE Index, Core PCE (year-over-year) & Pending Home Sales at 10 am.
Patterson Companies reports earnings before Wednesday’s opening bell, with Kroger & Zumiez set the report after the session’s close.
Thursday is Thanksgiving so there is no data to be released.
Friday brings us the Chicago Business Barometer (PMI) report at 9:45 am & there will be no earnings reports released.
*** I DO NOT OWN SHARES OR OPTIONS CONTRACT POSITIONS IN SPY, QQQ, IWM OR DIA AT THE TIME OF PUBLISHING THIS ARTICLE ***
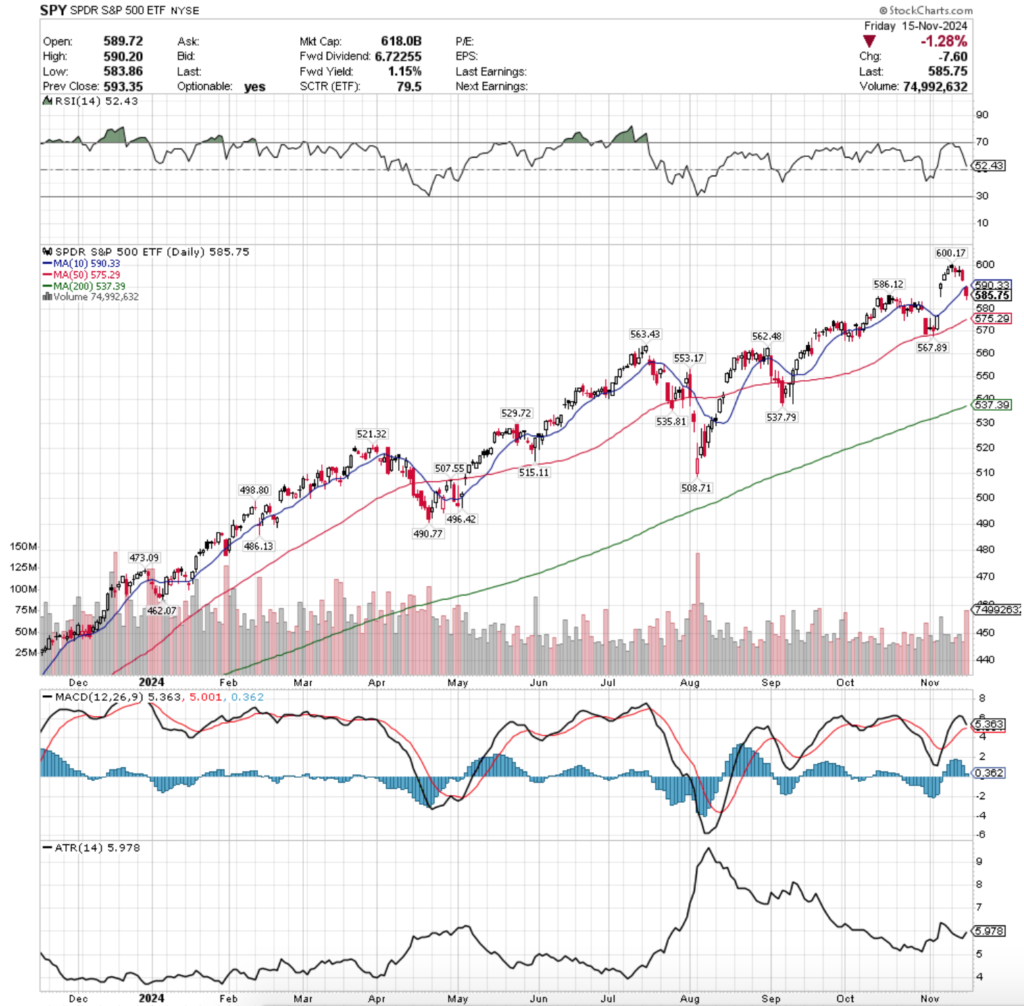
SPY, the SPDR S&P 500 ETF slid -2.08% this week, while the VIX closed at 16.14, indicating an implied one day move of +/-1.02% & an implied one month move of +/-4.67% for the S&P 500.
SPY ETF – SPDR S&P 500 ETF’s Technical Performance Over The Past Year
Their RSI is trending back down toward the neutral level & currently sits at 52.43, while their MACD has curled over bearishly & will likely cross the signal line within the first day or two of the week.
Volumes were -23.98% lower than the prior year’s average level (46,144,000 vs. 60,703,202), as investors are still timid near all-time highs for SPY.
For over seven months now volumes have been drastically lower than they had been in the years prior, which brings up questions regarding is it hesitancy due to the high price levels & valuations, or is there something else out there that is keep money on the sidelines.
Last Monday SPY kicked the week off on a foreboding note, as despite an advancing session that hit their current all-time high, the day resulted in a hanging man candle that closed lower than it opened (bearish).
It should also be noted that this was the lowest volume session of the day, which makes the move even more alarming.
Tuesday the bad times continued, as the day opened lower, tested slightly higher, only to decline & reinforce the negative sentiment that Monday began the week with.
Wednesday the market temporarily found equilibrium as the day resulted in a doji candle that closed slightly higher than the day prior’s on the second highest volume of the week.
Things resumed heading south on Thursday with a declining session that began filling in the window created by the previous Thursday’s gap up session.
Friday was a risk off into the weekend type of day, opening on a gap down near the 10 day moving average & blowing through the support level to close lower on the day on the highest volume of the week.
This coming week should be interesting (this note is late as I was OOO Monday) as there are a handful of Fed speakers & NVDIA’s earnings report is due out Wednesday.
The Fed speakers aren’t likely to tell us anything we don’t already know & it seems that SPY is consolidating within Friday’s candle’s range while waiting to see what comes from that report.
In the event it moves us to the upside the $600.17/share mark will be where all eyes focus to see if the resistance level can be broken.
In the event it’s a downside surprise the window that is at the $580/share level from October will be in focus, as it was gapped both below & over & because the $575-579.99 level is a seller dominated price zone which will likely cause further declines.
This will be problematic as there are not many local support levels for SPY from its current price & may mean it struggles to find footing until after a loss of 3-5%.
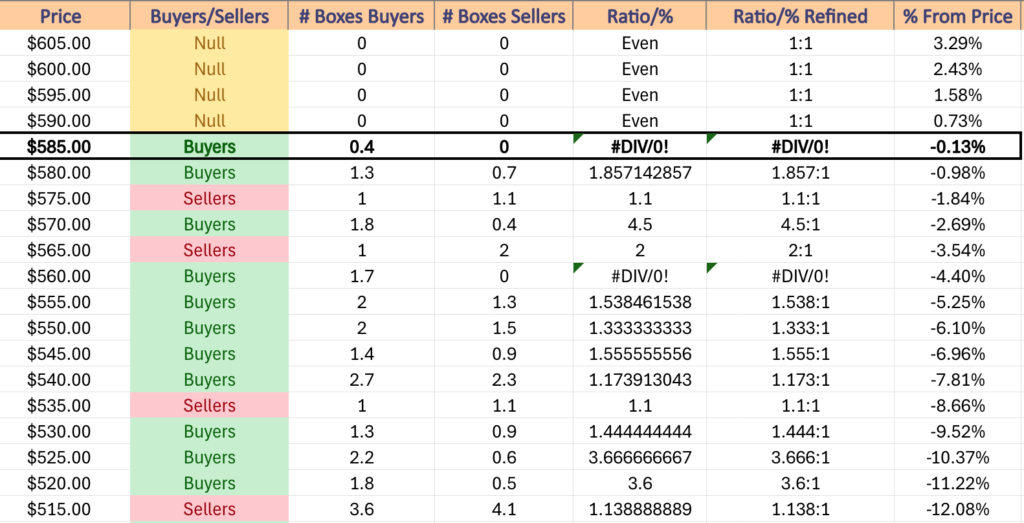
SPY has support at the $586.12 (Volume Sentiment: Buyers, 0.4:0*), $575.29 (50 Day Moving Average, Volume Sentiment: Sellers, 1.1:1), $567.89 (Volume Sentiment: Sellers, 2:1) & $563.43/share (Volume Sentiment: Buyers, 1.7:0*) price levels, with resistance at the $590.33 (10 Day Moving Average, Volume Sentiment: NULL, 0:0*) & $600.17/share (All-Time High, Volume Sentiment: NULL, 0:0*) price levels.
SPY ETF’s Price Level:Volume Sentiment Over The Past ~2 Years
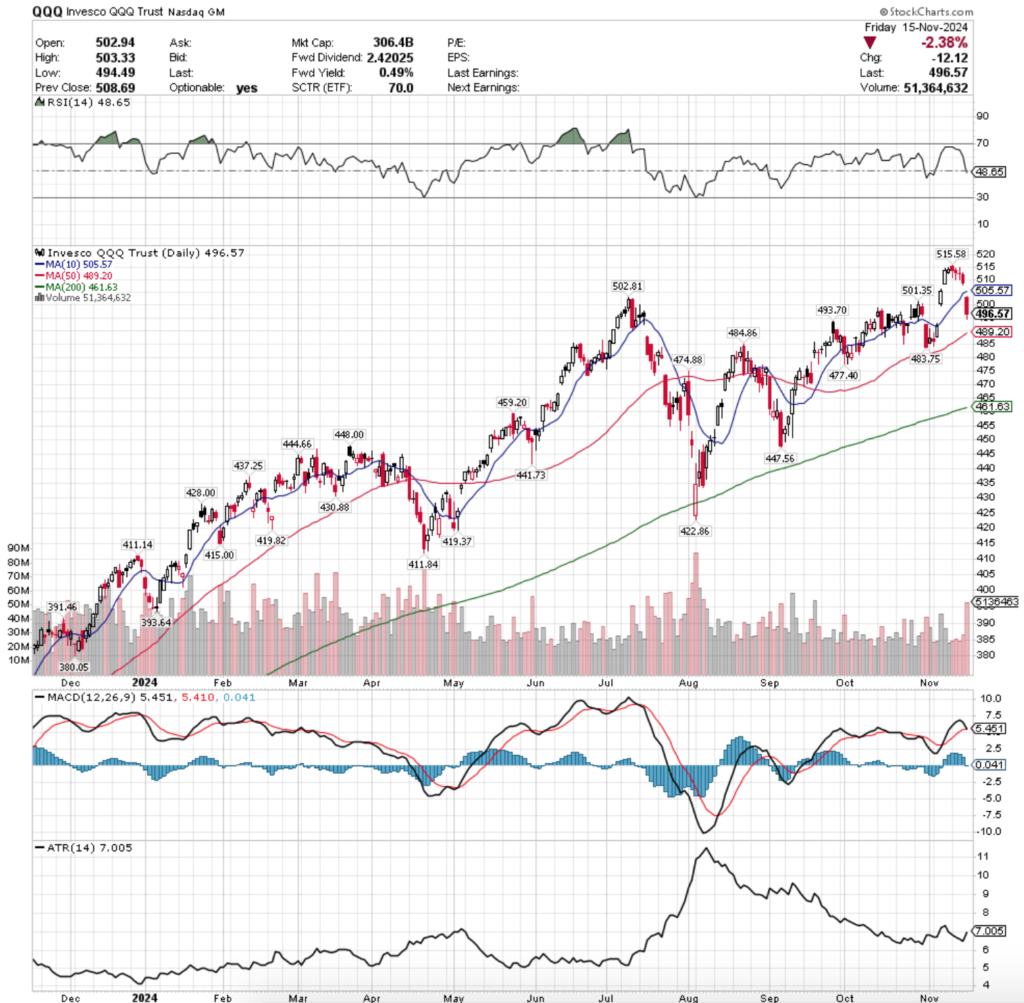
QQQ, the Invesco QQQ Trust ETF dropped -3.42% last week, as market participants were taking some profits after the prior week’s gap up sessions.
QQQ ETF – Invesco QQQ Trust ETF’s Technical Performance Over The Past Year
Their RSI is has just passed bearishly through the neutral level of 50 & sits currently at 48.65, while their MACD is set to cross the signal line bearishly during Monday’s session.
Volumes were -21.76% below the previous year’s average level (30,342,000 vs. 38,782,885), which like SPY means that they were dramatically lower than the prior year’s average from seven months ago, begging the question of where this money is & why.
QQQ’s week looks awfully similar to SPY’s, except that all of QQQ’s candles are red, while SPY had some that were filled black as they closed lower than they opened but advanced on the open.
Monday resulted in a new all-time high for QQQ on low volume that also was a hanging man candle, predicting the bearishness the rest of the week followed with.
Tuesday continued lower, but the $510/share level was not broken through as investors seemed to think that was a fair valuation again on Wednesday when prices approached it, but did not break down through it.
Wednesday closed in a doji, indicating that there was temporary equilibrium in the eyes of market participants, before Thursday finally broke down the $510/share level to close beneath it.
Friday everything fell apart as QQQ gapped down to open below the 10 day moving average’s support & only continued lower throughout the day on the week’s highest volume.
Profits from the prior week’s gaps were taken 0ff of the table as investors await NVDA’s earnings report on Wednesday, as it will lend clues into the state of technology names.
In the event of a good report, QQQ has a few resistance levels to break through before they reach their all-time high, as like SPY so far this week they’ve just consolidated into the range set by Friday’s candle’s real body.
In the event they break out above the $502.81 mark the 10 DMA’s resistance will be interesting, given how hard they fell through it on Friday as a support level.
On the downside the 50 DMA is the second nearest support level, with the $493.70 one occurring in a price level that has been overwhelming strong for the buyers historically.
While Friday’s high volume may be viewed as some as ammunition getting ready to be reemployed in the market, based on how low volumes have been in the past seven months & how high Friday’s bearish session’s volume was we may be looking at more declining behavior in the near-term.
QQQ has support at the $493.70 (Volume Sentiment: Buyers, 17.25), $489.20 (50 Day Moving Average, Volume Sentiment: Buyers, 1.25:1), $484.86 (Volume Sentiment: Buyers, 3.5:1) & $483.75/share (Volume Sentiment: Buyers, 1.2:1) price levels, with resistance at the $501.35 (Volume Sentiment: Buyers, 2:0*), $502.81 (Volume Sentiment: Buyers, 2:0*), $505.57 (10 Day Moving Average, Volume Sentiment: NULL, 0:0*) & $515.58/share (All-Time High, Volume Sentiment: NULL, 0:0*) price levels.
QQQ ETF’s Price Level:Volume Sentiment Over The Past ~2 Years
IWM, the iShares Russell 2000 ETF had the worst week of the major four index ETFs, declining -4.05% as investors took profits on the heels of their outperformance from last week.
IWM ETF – iShares Russell 2000 ETF’s Technical Performance Over The Past Year
Their RSI is near the neutral 50 mark & sits at 52.09, while their MACD is bearishly approaching the signal line & looks set to cross over it early this week.
Volumes were -7.19% below the previous year’s average level (30,872,000 vs. 33,265,375), which is rare to see these days, as IWM has been trading at higher volume levels than it had been seven months ago (unlike SPY & QQQ).
Unlike SPY & QQQ, WM’s week kicked off on an advancing session that reached a new all-time high, but it was on low volume & resulted in a spinning top candle which means that there was a bit of uncertainty among market participants.
This led to the avalanche of tall red candles that came throughout the rest of the week, as investors took their profits from the previous week & went running.
Thursday’s session saw a temporary breakdown of the 10 DMA’s support, which led to Friday’s open below it & continued move downward towards near the $227.50/share level ($227.81).
IWM’s closing level on Friday sits right atop the $227/share support zone, but the window created by last Wednesday is still sitting open & the past couple of weeks have shown both the tops & bottoms of IWM’s trading begin to close up & narrow, indicating that there is an added degree of uncertainty in the market right now.
Should the window continue to close, the 50 Day Moving Average will become the place of focus as it continues moving higher & will likely be near the bottom of the window by the time a test comes.
The first four support levels from Friday’s close have been seller dominated 2:1 over the past 3-4 years.
As for the upside, if IWM breaks above its 10 DMA the only resistance level above it is the all-time high, which it will need some strong volume to break above.
This may prove difficult, given that IWM’s current average prior year’s volume is already higher than it was seven months ago, which is not the case for SPY or QQQ.
IWM has support at the $227.85 (Volume Sentiment: Sellers, 2:1), $227.17 (Volume Sentiment: Sellers, 2:1), $225.87 (Volume Sentiment: Sellers, 2:1) & $224.17/share (Volume Sentiment: Sellers, 2:1) price levels, with resistance at the $233.07 (10 Day Moving Average, Volume Sentiment: NULL, 0:0*) & $243.39/share (All-Time High, Volume Sentiment: NULL, 0:0*) price levels.
IWM ETF’s Price Level:Volume Sentiment Over The Past ~2 Years
DIA ETF – SPDR Dow Jones Industrial Average ETF’s Technical Performance Over The Past Year
Their RSI is trending back down towards neutral & sits currently at 57.03, while their MACD has curled over bearishly & looks primed to cross through the signal line by mid-week.
Volumes were -8.4% below the prior year’s average (3,162,000 vs. 3,451,937), as investors are skittish, but still wetting their beaks on the blue chip index’s components.
Monday kicked off the week with a shooting star candle (bearish) with a new all-time high for DIA.
Tuesday set the stage for some hard times to come, when a bearish engulfing candle sent DIA below the $440/share level before Wednesday’s doji candle that finished relatively in line with Tuesday’s close.
Wednesday the pain continued, as DIA opened higher before another wide-range bearish engulfing candle came from the day’s session, which led to the pain DIA felt Friday when prices gapped down & continued lower after the open to close just below the resistance of the 10 day moving average.
Tomorrow will be an interesting day, as NVDA’s earnings do not directly impact DIA or IWM as they are not a component of those indexes, which will be something for folks to keep in mind over the coming two days of trading.
DIA has a large window from the previous week to fill in on the downside, with their all-time high being the only resistance level, but one that will be a formidable level to break above.
DIA has support at the $432.94 (Volume Sentiment: Buyers, 0.6:0*), $425.79 (Volume Sentiment: Sellers, 1.67:1), $423.86 (50 Day Moving Average, Volume Sentiment: Buyers, 3.2:1) & $417.86/share (Volume Sentiment: Sellers, 7:1) price levels, with resistance at the $434.71 (10 Day Moving Average, Volume Sentiment: Buyers, 0.6:0*) & $444.60/share (All-Time High, Volume Sentiment: NULL, 0:0*) price levels.
DIA ETF’s Price Level:Volume Sentiment Over The Past 3-4 Years
The Week Ahead
Home Builder Confidence Index data & Fed President Goolsbee speaking are Monday morning’s big market data, each coming in at 10 am.
Monday morning kicks off with reports from Brady (BRC) & Twist Bioscience, followed by AECOM, BellRing Brands & Symbiotic after the session’s close.
Tuesday morning features Housing Starts & Building Permits data at 8:30 am, followed by Fed President Goolsbee speaking again at 12:25 pm.
Walmart, Amer Sports, Energizer, Jacobs Solutions, Lowe’s, Medtronic, Oaktree Specialty Lending Corp, Viking Holdings, Vipshop & Weibo report earnings before the opening bell on Tuesday, with Alcon, AZEK, Dolby Labs, Golub Capital, Keysight, La-Z-Boy, Powell Industries, Varex Imaging & ZTO Express set to report after the closing bell.
Wednesday is another Fed speaker day, with Governor Cooks speaking at 11 am & Governor Bowman speaking at 12:15 pm.
Wednesday morning’s earnings reports include Berry Global, Dycom, Global-E Online, Nio, Spire, Target, TJX Companies & Wix.com, followed by NVDA, Copa Holdings, Jack In The Box, Maximus, Palo Alto Networks, Snowflake & Sociedad Quimica y Minera after the session’s closing bell.
Thursday begins with Initial Jobless Claims & Philadelphia Fed Manufacturing Survey Data at 8:30 am, Fed President Hammack speaking at 8:45 am, Existing Home Sales & Leading Economic Index data reported at 10 am, Fed President Schmid speaking at 1:10 pm & Fed Vice Chair For Supervision Barr speaking at 4:40 pm.
Deere & Company, Atkore International, BJ’s Wholesale, KE Holdings, Shoe Carnival, Vestis & Warner Music Group report earnings on Thursday morning before the session’s open, with Copart, Elastic, Gap, Intuit, Ross Stores & UGI Group reporting after the close.
S&P Flash U.S. Services PMI & S&P Flash U.S. Manufacturing PMI data come out Friday morning at 9:45 am, followed by Consumer Sentiment (final) data at 10 am & Fed Governor Bowman speaking at 6:15 pm.
Friday’s primary earnings report is Buckle before the session’s open.
See you back here next week!
*** I DO NOT OWN SHARES OR OPTIONS CONTRACT POSITIONS IN SPY, QQQ, IWM OR DIA AT THE TIME OF PUBLISHING THIS ARTICLE ***
Markets have continued to grind higher though in the face of the US Presidential Election, bad weather events causing widespread damage & today’s PPI print coming in hotter than expected after two straight consecutive rate cuts & all of the major index ETFs sit near their all-time highs.
The VIX is currently at 14.13 after remaining elevated for the month of October & now shows an implied one day move of +/-0.89% & an implied one month move of +/-4.08%.
With the election results seeming to have calmed the market’s nerves quite a bit it is time to run through the Buyer:Seller sentiment at each price level that the major indexes have traded at over the past few years.
This may shed light into how market participants will behave if the same price levels are entered/re-tested again in the near future.
As noted in the last note, due to the markets being near all-time highs there are many price levels that lack enough information to make a reading on, but that have been traded at, which will be denoted as “NULL”, most of which occur near the extreme highs & lows of the listed ranges below.
Each section below contains a view of each index ETF’s chart (for a technical breakdown of each ETF’s chart please see this past weekend’s market review note), as well as a list of their current one year support & resistance levels with the volume sentiment noted beneath it on the table.
There is an additional table beneath this table with each price level’s sentiment, as well as a typed text version below that is able to be copied & pasted.
Note that “NULL, 0:0*” values denote areas that each name has traded at but with limited volume data to work with from a comparison standpoint in terms of creating a ratio of buyers:sellers (or vice versa).
Also, prices that do have a ratio of Buyers:Sellers (Sellers:Buyers) where the denominator is 0 are denoted with an asterisk “*” as well.
In the written lists of the price levels & volume sentiments the price levels that contain support & resistance levels are marked in BOLD.
Recall that at price extremes such as the highs that we have recently hit there will tend to be skewed data due to the small sample size & factor that into how you interpret each price level’s reported sentiment.
This is intended to serve as an additional tool, similar to a barometer to use during your due diligence process & is not meant to replace doing your own research & is not financial advice.
Price Level:Volume Sentiment Analysis For SPY, The SPDR S&P 500 ETF
SPY ETF – SPDR S&P 500 ETF’s Technical Performance Over The Past Year
SPY, the SPDR S&P 500 ETF enjoyed a massive gap up following the election after spending most of October straddling its 10 day moving average.
Since Tuesday it has shown that folks are beginning to take profits following the move upward, which has all eyes looking at the window created by the post-election gap up.
There are two support levels near the lower end of the gap, one of which being the 10 day moving average which continues higher on a daily basis.
While this may help slow any declines, should the support & the $586-level be broken the next stop is the 50 DMA’s support.
With this in mind, it is worth looking at how investors have behaved over the past few years at each price level to see if it lends clues into how they may choose to behave again in the near-future.
Below is a list of the volume sentiments at each price level SPY has traded at over the past 2-3 years.
SPY ETF’s Price Level:Volume Sentiment Over The Past ~2 Years At One Year Support/Resistance Levels
SPY ETF’s Price Level:Volume Sentiment Over The Past ~2 Years
Price Level:Volume Sentiment For SPY ETF Over The Past ~2 Years
Price Level:Volume Sentiment For SPY ETF Over The Past ~2 Years
SPY ETF’s Price Level:Volume Sentiment Over The Past ~2 Years
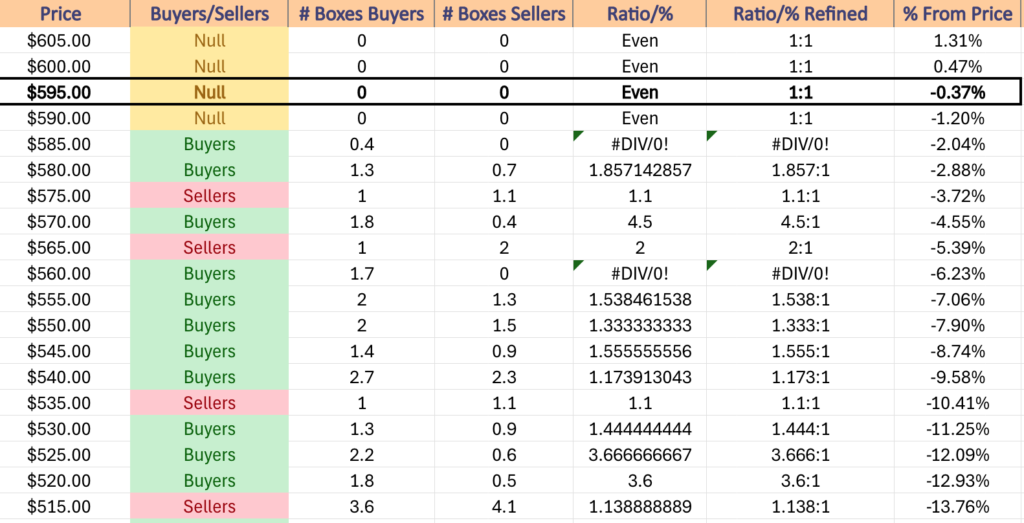
$605 -NULL – 0:0*, +1.31% From Current Price Level
$600 – NULL – 0:0*, +0.47% From Current Price Level – All-Time High*
$595 – NULL – 0:0*, -0.37% From Current Price Level – Current Price Level*
$590 – NULL – 0:0*, -1.2% From Current Price Level
$585 – Buyers – 0.4:0*, -2.04% From Current Price Level – 10 Day Moving Average*
$580 – Buyers – 1.86:1, -2.88% From Current Price Level
$575 – Sellers – 1.1:1, -3.72% From Current Price Level
$570 – Buyers – 4.5:1, -4.55% From Current Price Level – 50 Day Moving Average*
$565 – Sellers – 2:1, -5.39% From Current Price Level
$560 – Buyers – 1.7:0*, -6.23% From Current Price Level
$555 – Buyers – 1.54:1, -7.06% From Current Price Level
$550 – Buyers – 1.33:1, -7.9% From Current Price Level
$545 – Buyers – 1.56:1, -8.74% From Current Price Level
$540 – Buyers – 1.17:1, -9.58% From Current Price Level
$535 – Sellers – 1.1:1, -10.41% From Current Price Level – 200 Day Moving Average*
$530 – Buyers – 1.44:1, -11.25% From Current Price Level
$525 – Buyers – 3.67:1, -12.09% From Current Price Level
$520 – Buyers – 3.6:1, -12.93% From Current Price Level
$515 – Sellers – 1.14:1, -13.76% From Current Price Level
$510 – Buyers – 1.67:1, -14.6% From Current Price Level
$505 – Sellers – 1.43:1, -15.44% From Current Price Level
$500 – Buyers – 1.04:1, -16.27% From Current Price Level
$496 – Sellers – 1.75:1, -16.94% From Current Price Level
$492 – Buyers – 1.14:1, -17.61% From Current Price Level
$488 – Buyers – 1.43:1, -18.28% From Current Price Level
$484 – Buyers – 1.25:1, -18.95% From Current Price Level
$480 -Buyers – 2.17:1, -19.62% From Current Price Level
$476 – Buyers – 1.5:1, -20.29% From Current Price Level
$472 – Buyers – 2.2:0*, -20.96% From Current Price Level
$468 – Sellers – 1.38:1, -21.63% From Current Price Level
$464 – Even – 1:1, -22.3% From Current Price Level
$460 – Sellers – 1.83:1, -22.97% From Current Price Level
$456 – Buyers – 0.4:0*, -23.64% From Current Price Level
$452 – Buyers – 2.9:0*, -24.31% From Current Price Level
$448 – Buyers – 1.22:1, -24.98% From Current Price Level
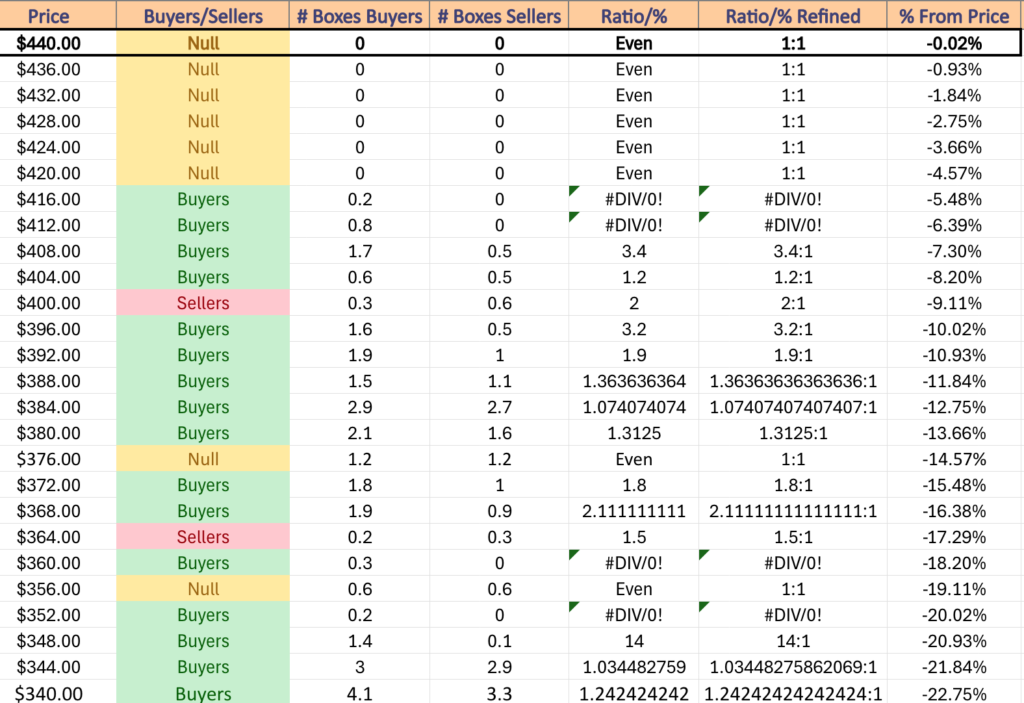
$444 – Buyers – 3.25:1, -25.65% From Current Price Level
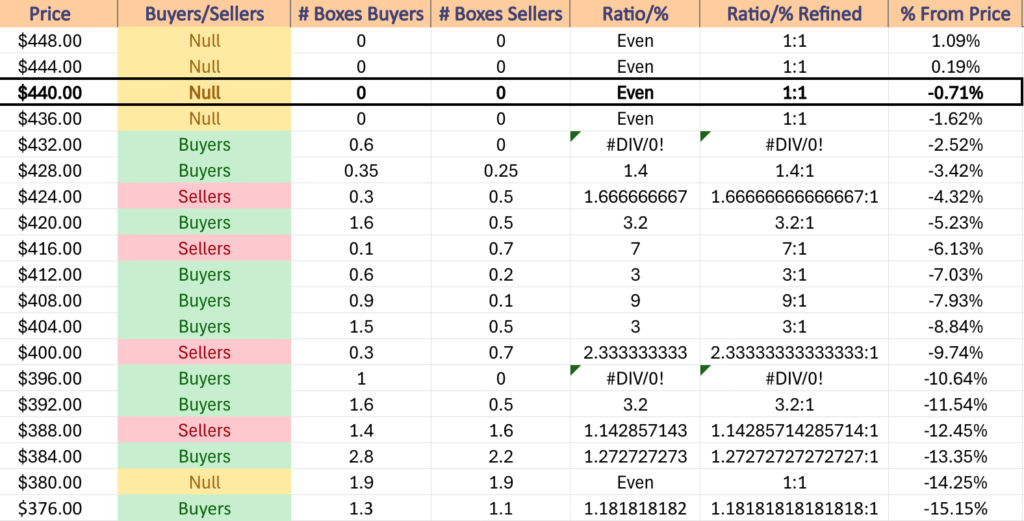
$440 – Buyers – 1.7:1, -26.32% From Current Price Level
$436 – Buyers 1.03:1, -26.99% From Current Price Level
$432 – Buyers – 1.22:1, -27.66% From Current Price Level
$428 – Buyers – 1.38:1, -28.33% From Current Price Level% From Current Price Level
$424 – Sellers – 1.63:1, -29% From Current Price Level
$420 – Sellers – 1.23:1, -29.67% From Current Price Level
$416 – Buyers – 2.5:1, -30.34% From Current Price Level
$412 – Buyers – 2.18:1, -31.01% From Current Price Level
$408 – Buyers – 1.03:1, -31.68% From Current Price Level
$404 – Buyers – 2.42:1, -32.35% From Current Price Level
$400 – Buyers – 1.15:1, -33.02% From Current Price Level
$396 – Sellers – 2.31:1, -33.69% From Current Price Level
$392 – Buyers – 1.4:1, -34.36% From Current Price Level
$388 – Buyers – 1.72:1, -35.03% From Current Price Level
$384 – Buyers – 1.73:1, -35.7% From Current Price Level
$380 – Sellers – 1.53:1, -36.37% From Current Price Level
$376 – Sellers – 2.68:1, -37.04% From Current Price Level
$372 – Sellers – 1.97:1, -37.71% From Current Price Level
$368 – Sellers – 1.41:1, -38.38% From Current Price Level
$364 – Sellers – 1.73:1, -39.05% From Current Price Level
$360 – Sellers – 2.1:1, -39.72% From Current Price Level
$356 – Buyers – 1.73:1, -40.39% From Current Price Level
$352 – Sellers – 2.35:1, -41.06% From Current Price Level
$348 – Sellers – 0.6:0*, -41.73% From Current Price Level
$344 – Sellers – 0.8:0*, -42.4% From Current Price Level
$340 – NULL – 0:0*, -43.07% From Current Price Level
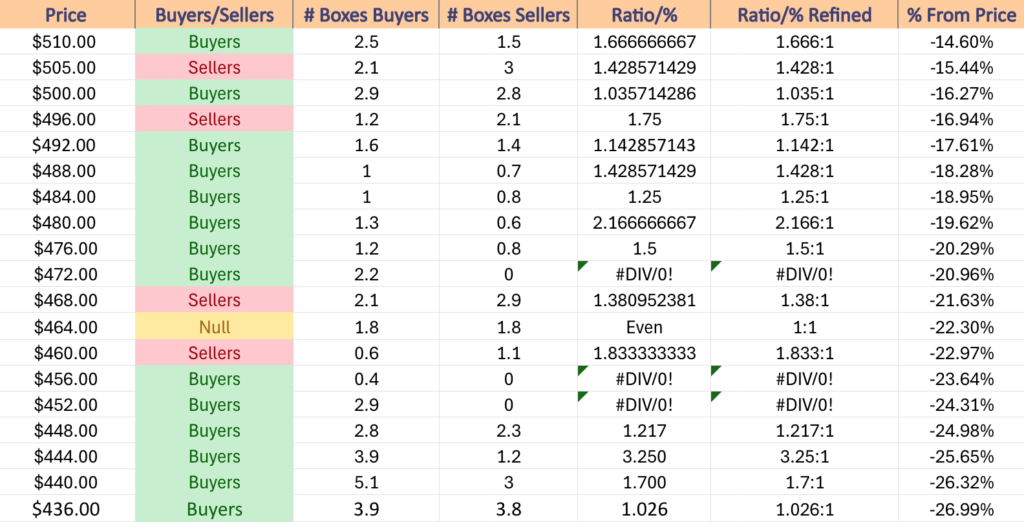
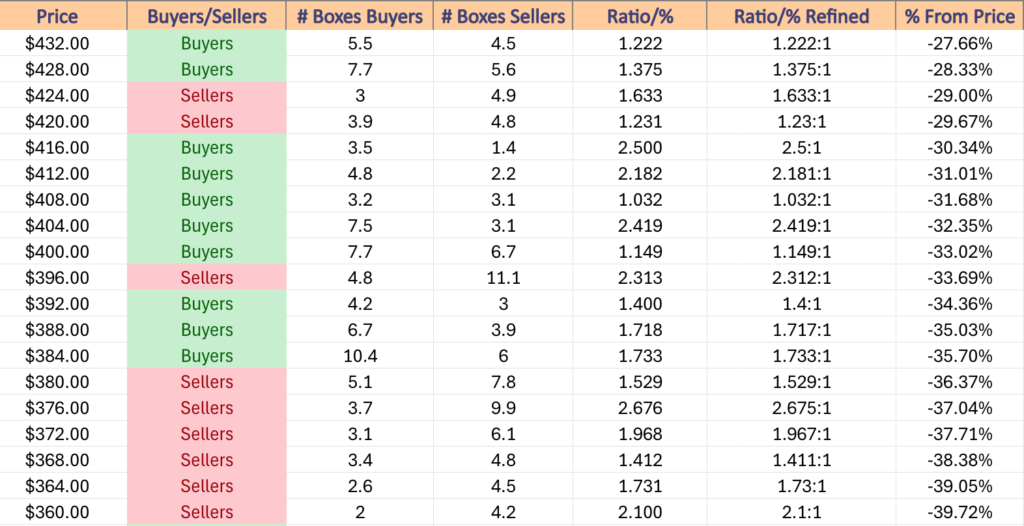
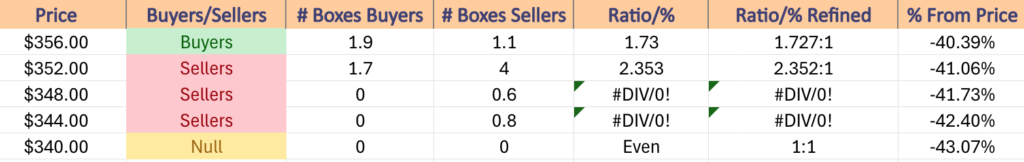
Price Level:Volume Sentiment Analysis For QQQ, The Invesco QQQ Trust ETF
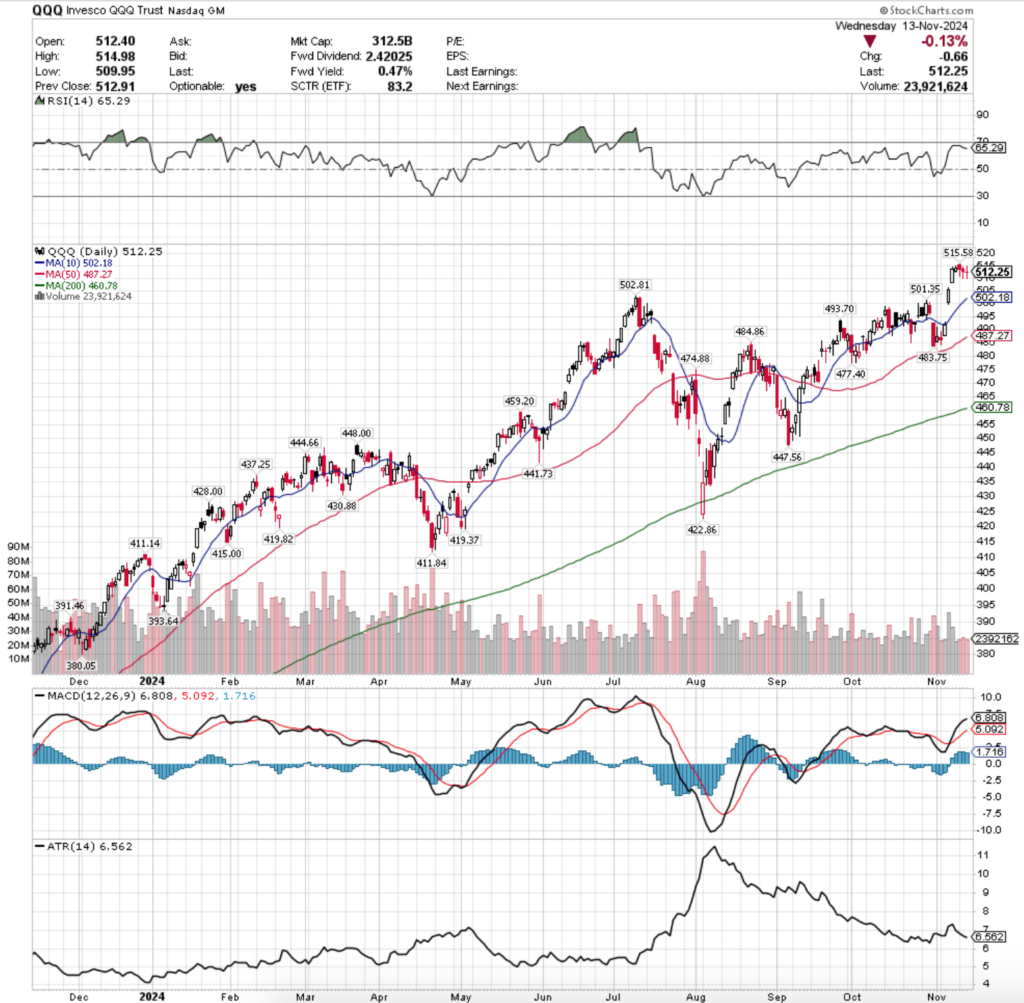
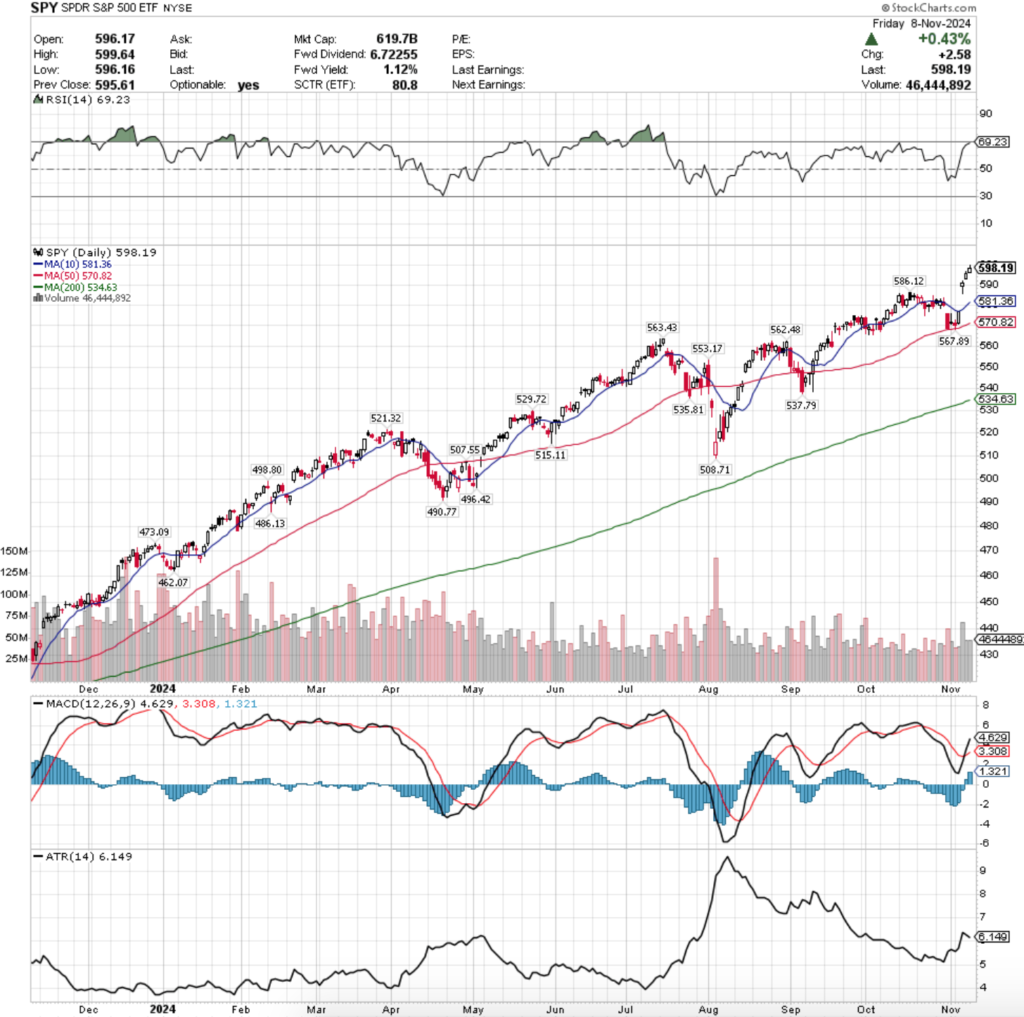
QQQ ETF – Invesco QQQ ETF’s Technical Performance Over The Past Year
QQQ, the Invesco QQQ Trust ETF that tracks the NASDAQ 100 has enjoyed a similar post-election jump to SPY & also sits just off of all-time highs that were set on Monday.
Much like SPY they have also traded on weak volume recently, as there is indeed a bit of hesitancy among market participants to dive into the pool near such high price levels.
QQQ has more local support levels than SPY after the declines of July forced a slower recovery & consolidations that created more support/resistance touch-points.
Still, it is important to understand how they’ve traded historically at the price levels of the past few years, especially given the two gap ups that created two windows last week.
Below is QQQ’s volume sentiment at each price level it has traded at for the past 2-3 years, as well as their support & resistance levels with the sentiments noted.
QQQ ETF’s Price Level:Volume Sentiment Over The Past ~2 Years At One Year Support/Resistance Levels
QQQ ETF’s Price Level:Volume Sentiment Over The Past ~2 Years
Price Level:Volume Sentiment For QQQ ETF Over The Past ~2 Years
Price Level:Volume Sentiment For QQQ ETF Over The Past ~2 Years
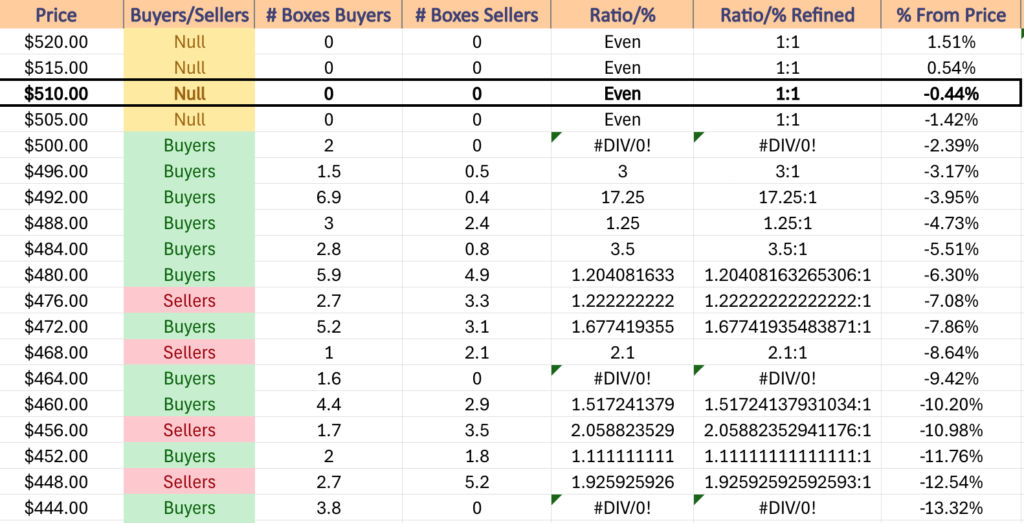
QQQ ETF’s Price Level:Volume Sentiment Over The Past ~2 Years
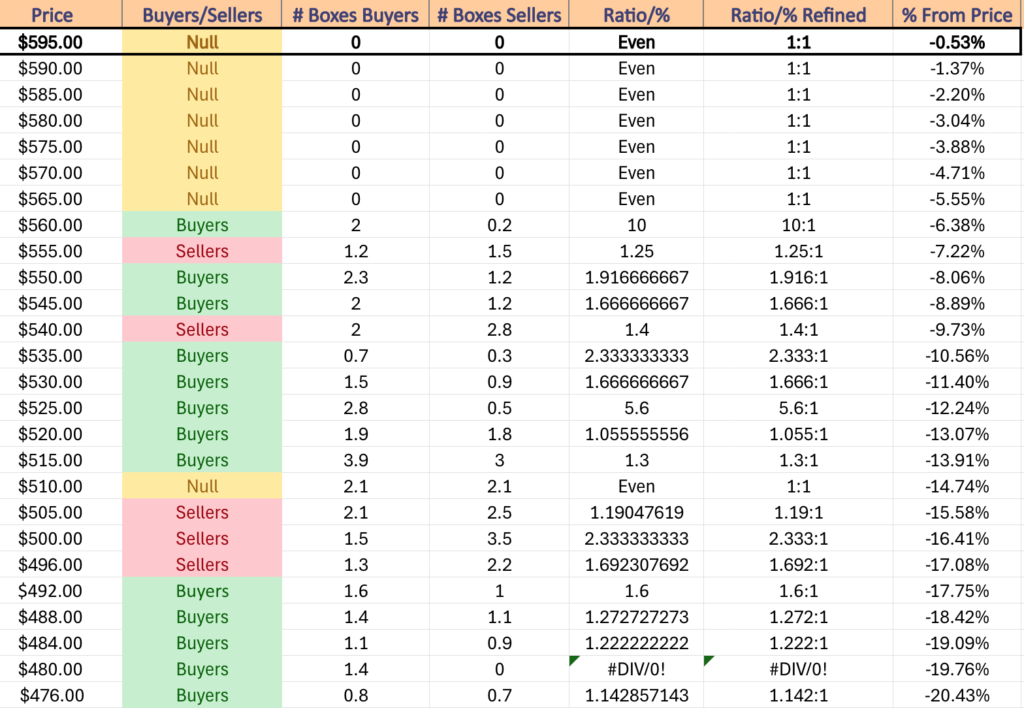
$520 – NULL – 0:0*, +1.51% From Current Price Level
$515 – NULL – 0:0*, +0.54% From Current Price Level – All-Time High*
$510 – NULL – 0:0*, -0.44% From Current Price Level – Current Price Level*
$505 – NULL – 0:0*, -1.42% From Current Price Level
$500 – Buyers – 2:0*, -2.39% From Current Price Level – 10 Day Moving Average*
$496 – Buyers – 3:1, -3.17% From Current Price Level
$492 – Buyers – 17.25:1, -3.95% From Current Price Level
$488 – Buyers – 1.25:1, -4.73% From Current Price Level
$484 – Buyers – 3.5:1, -5.51% From Current Price Level – 50 Day Moving Average*
$480 – Buyers – 1.2:1, -6.3% From Current Price Level
$476 – Sellers – 1.22:1, -7.08% From Current Price Level
$472 – Buyers – 1.68:1, -7.86% From Current Price Level
$468 – Sellers – 2.1:1, -8.64% From Current Price Level
$464 – Buyers – 1.6:0*, -9.42% From Current Price Level
$460 – Buyers – 1.52:1, -10.2% From Current Price Level – 200 Day Moving Average*
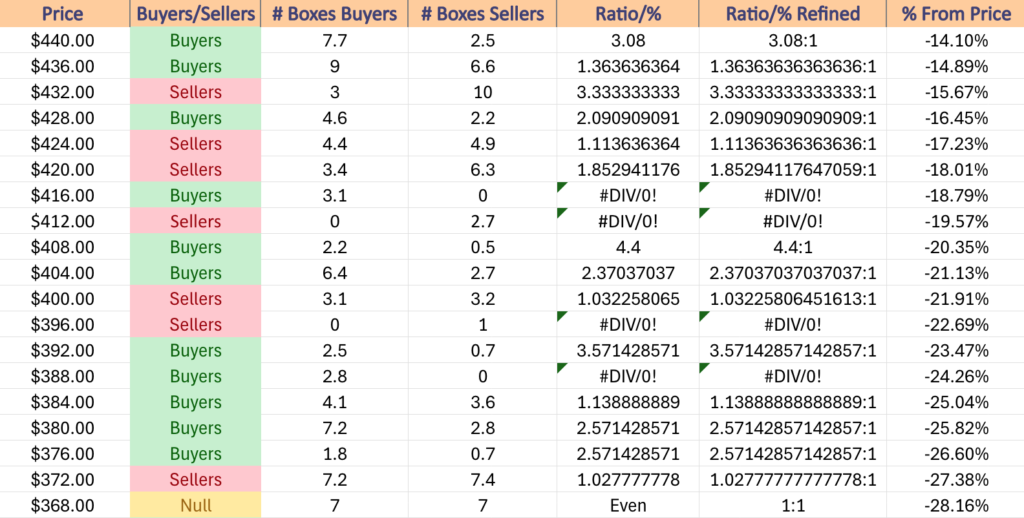
$456 – Sellers – 2.06:1, -10.98% From Current Price Level
$452 – Buyers – 1.11:1, -11.76% From Current Price Level
$448 – Sellers – 1.93:1, -12.54% From Current Price Level
$444 – Buyers – 3.8:0*, -13.32% From Current Price Level
$440 – Buyers – 3.08:1, -14.1% From Current Price Level
$436 – Buyers – 1.36:1, -14.89% From Current Price Level
$432 – Sellers – 3.33:1, -15.67% From Current Price Level
$428 – Buyers – 2.09:1, -16.45% From Current Price Level
$424 – Sellers – 1.11:1, -17.23% From Current Price Level
$420 – Sellers – 1.85:1, -18.01% From Current Price Level
$416 – Buyers – 3.1:0*, -18.79% From Current Price Level
$412 – Sellers – 2.7:0*, -19.57% From Current Price Level
$408 – Buyers – 4.4:1, -20.35% From Current Price Level
$404 – Buyers – 2.37:1, -21.13% From Current Price Level
$400 – Sellers – 1.03:1, -21.91% From Current Price Level
$396 – Sellers – 1:0*, -22.69% From Current Price Level
$392 – Buyers – 3.57:1, -23.47% From Current Price Level
$388 – Buyers – 2.8:0*, -24.26% From Current Price Level
$384 – Buyers – 1.14:1, -25.04% From Current Price Level
$380 – Buyers – 2.57:1, -25.82% From Current Price Level
$376 – Buyers – 2.57:1, -26.6% From Current Price Level
$372 – Sellers – 1.03:1, -27.38% From Current Price Level
$368 – Even – 1:1, -28.16% From Current Price Level
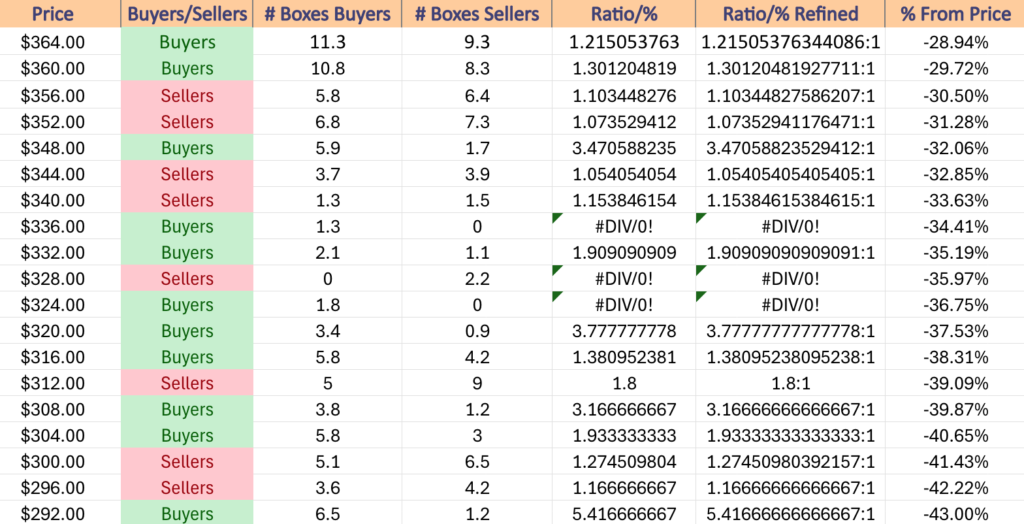
$364 – Buyers – 1.22:1, -28.94% From Current Price Level
$360 – Buyers – 1.3:1, -29.72% From Current Price Level
$356 – Sellers – 1.1:1, -30.5% From Current Price Level
$352 – Sellers – 1.07:1, -31.28% From Current Price Level
$348 – Buyers – 3.47:1, -32.06% From Current Price Level
$344 – Sellers – 1.05:1, -32.85% From Current Price Level
$340 – Sellers – 1.15:1, -33.63% From Current Price Level
$336 – Buyers – 1.3:0*, -34.41% From Current Price Level
$332 – Buyers – 1.91:1, -35.19% From Current Price Level
$328 – Sellers – 2.2:0*, -35.97% From Current Price Level
$324 – Buyers – 1.8:0*, -36.75% From Current Price Level
$320 – Buyers – 3.78:1, -37.53% From Current Price Level
$316 – Buyers – 1.38:1, -38.31% From Current Price Level
$312 – Sellers – 1.8:1, -39.09% From Current Price Level
$308 – Buyers – 3.17:1, -39.87% From Current Price Level
$304 – Buyers – 1.93:1, -40.65% From Current Price Level
$300 – Sellers – 1.28:1, -41.43% From Current Price Level
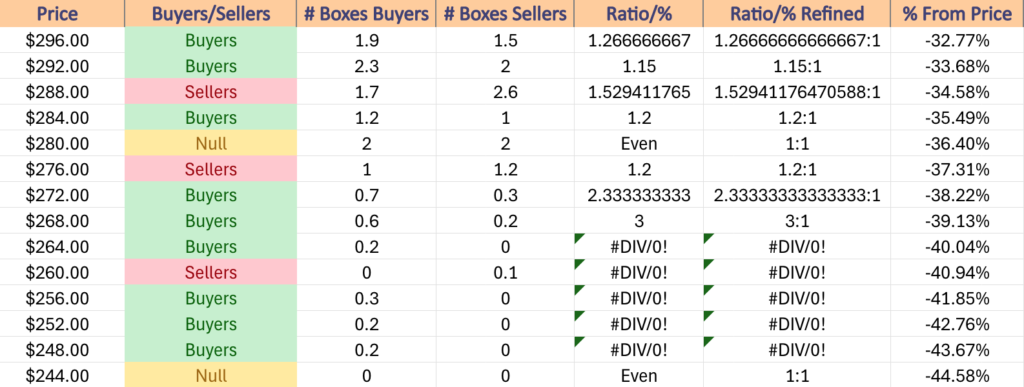
$296 – Sellers – 1.17:1, -42.22% From Current Price Level
$292 – Buyers – 5.42:1, -43% From Current Price Level
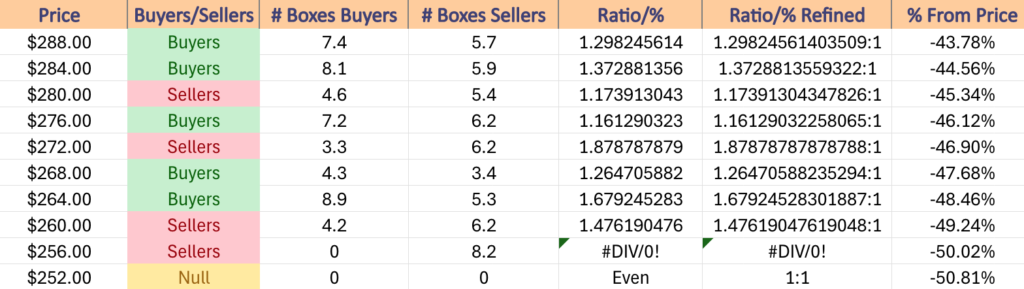
$288 – Buyers – 1.3:1, -43.78% From Current Price Level
$284 – Buyers – 1.37:1, -44.56% From Current Price Level
$280 – Sellers – 1.17:1, -45.34% From Current Price Level
$276 – Buyers – 1.16:1, -46.12% From Current Price Level
$272 – Sellers – 1.88:1, -46.9% From Current Price Level
$268 – Buyers – 1.27:1, -47.68% From Current Price Level
$264 – Buyers – 1.68:1, -48.46% From Current Price Level
$260 – Sellers – 1.48:1, -49.24% From Current Price Level
$256 – Sellers – 8.2:0*, -50.02% From Current Price Level
$252 – NULL – 0:0*, -50.81% From Current Price Level
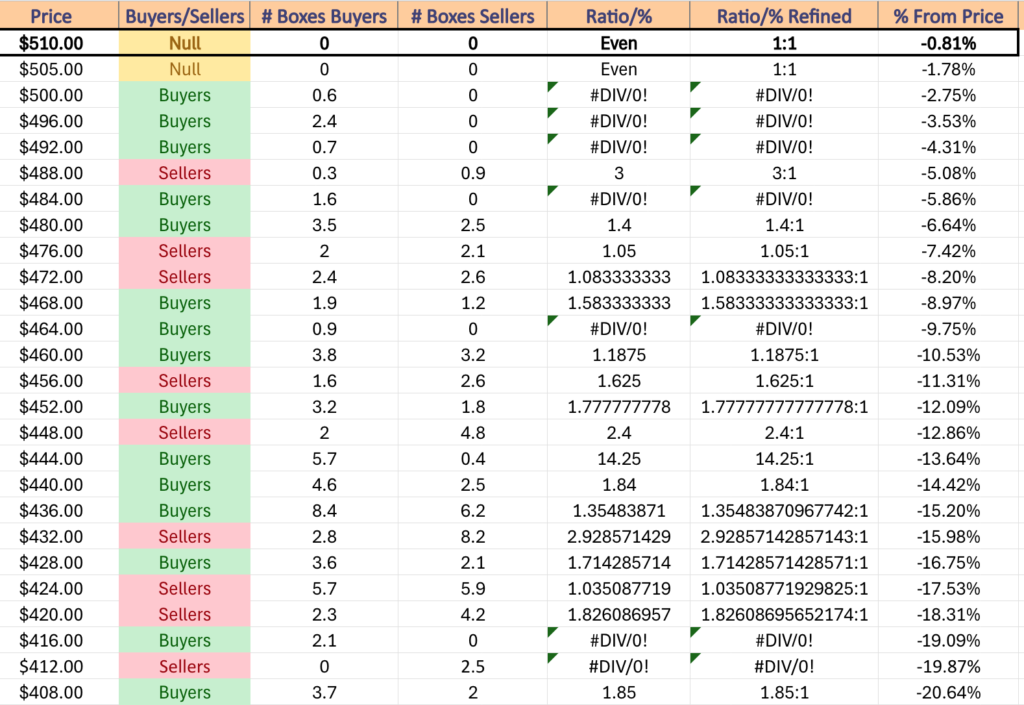
Price Level:Volume Sentiment Analysis For IWM, The iShares Russell 2000 ETF
IWM ETF – iShares Russell 2000 ETF’s Technical Performance Over The Past Year
IWM, the iShares Russell 2000 ETF was the biggest winner of the major four index ETFs over the past week in terms of their post-election gap up.
They enjoy a number of support levels just below the window that was created by that gap which will benefit them in the face of a decline.
Unlike the prior two ETFs, IWM’s recently weekly volumes have been higher when compared to their prior year’s average volume vs. seven months ago when the same comparison was made, indicating that there has been a rotation towards smaller cap names vs. SPY & QQQ components.
Still, this doesn’t make them immune to any drawdowns & it is worth reviewing the tables below to understand how market participants have felt at the price levels they’ve traded at.
This index trades in a much more consolidated range-bound fashion & slowly advances while oscillating around a price range compared to how SPY & QQQ trade, so their list of price levels for the past 2-3 years is shorter than the previous two ETFs.
IWM ETF’s Price Level:Volume Sentiment Over The Past ~2 Years At One Year Support/Resistance Levels
IWM ETF’s Price Level:Volume Sentiment Over The Past ~2 Years
Price Level:Volume Sentiment For IWM ETF Over The Past ~2 Years
$244 – NULL – 0:0*, +2.11% From Current Price Level
$240 – NULL – 0:0*, +0.44% From Current Price Level – All Time High*
$236 – NULL – 0:0*, -1.24% From Current Price Level – Current Price Level*
$232 – NULL – 0:0*, -2.91% From Current Price Level
$228 – NULL – 0:0*, -4.59% From Current Price Level – 10 Day Moving Average*
$224 – Sellers – 2:1, -6.26% From Current Price Level
$220 – Buyers – 2:1,-7.93% From Current Price Level – 50 Day Moving Average*
$216 – Buyers – 1.4:1, -9.61% From Current Price Level
$212 – Sellers – 1.5:1, -11.28% From Current Price Level
$208 – Buyers – 2.5:1, -12.96% From Current Price Level – 200 Day Moving Average*
$204 – Buyers – 2:1, -14.63% From Current Price Level
$200 – Buyers – 1.1:1, -16.3% From Current Price Level
$198 – Sellers – 1.16:1, -17.14% From Current Price Level
$196 – Buyers – 2.14:1, -17.98% From Current Price Level
$194 – Sellers – 1.09:1, -18.81% From Current Price Level
$192 – Sellers – 1.7:1, -19.65% From Current Price Level
$190 – Sellers – 1.66:1, -20.49% From Current Price Level
$188 – Sellers – 1.17:1, -21.33% From Current Price Level
$186 – Buyers – 1.42:1, -22.16% From Current Price Level
$184 – Buyers – 4.33:1, -23% From Current Price Level
$182 – Buyers – 1.11:1, -23.84% From Current Price Level
$180 – Sellers – 1.2:1, -24.67% From Current Price Level
$178 – Sellers – 1.06:1, -25.51% From Current Price Level
$176 – Buyers – 1.23:1, -26.35% From Current Price Level
$174 – Buyers – 1.65:1, -27.18% From Current Price Level
$172 – Buyers – 1.07:1, -28.02% From Current Price Level
$170 – Buyers – 1.28:1, -28.86% From Current Price Level
$168 – Sellers – 2.9:1, -29.7% From Current Price Level
$166 – Sellers – 2.75:1, -30.53% From Current Price Level
$164 – Sellers – 3.25:1, -31.37% From Current Price Level
$162 – Buyers – 3.6:1, -32.21% From Current Price Level
$160 – Sellers – 1.83:1, -33.04% From Current Price Level
Price Level:Volume Sentiment Analysis For DIA, The SPDR Dow Jones Industrial Average ETF
DIA ETF – SPDR Dow Jones Industrial Average ETF’s Technical Performance Over The Past Year
For much of the past year DIA, the SPDR Dow Jones Industrial Average ETF has traded in a more similar, oscillating with steady growth upwards manner than IWM, vs. the more rapid ascents of SPY & QQQ.
While they do not share as many local support levels as IWM, the resiliency of the blue chip DIA index shows that there are plenty of places for it to find footing in the face of a decline.
Investors have continued to buy into the blue chip names forcing DIA higher, which will be interesting to see the reactions to in the event of some type of sell-off in the near-future.
For now though, it is important to understand where the Buyers have met the Sellers over the past few years & in what capacity in order to formulate how strong support levels may be in the event of declines.
DIA ETF’s Price Level:Volume Sentiment Over The Past 3-4 Years At One Year Support/Resistance Levels
DIA ETF’s Price Level:Volume Sentiment Over The Past 3-4 Years
Price Level:Volume Sentiment For DIA ETF Over The Past 3-4 Years
Price Level:Volume Sentiment For DIA ETF Over The Past 3-4 Years
$448 – NULL – 0:0*, +1.76% From Current Price Level
$444 – NULL – 0:0*, +0.85% From Current Price Level – All-Time High*
$440 – NULL – 0:0*, +0.85% From Current Price Level – Current Price Level*
$436 – NUL – 0:0*, -0.06% From Current Price Level
$432 – Buyers – 0.6:0*, -0.97% From Current Price Level
$428 – Buyers – 1.4:1, -1.88% From Current Price Level – 10 Day Moving Average*
$424 – Sellers – 1.67:1, -2.78% From Current Price Level
$420 – Buyers – 3.2:1, -3.69% From Current Price Level – 50 Day Moving Average*
$416 – Sellers – 7:1, -4.6% From Current Price Level
$412 – Buyers – 3:1, -5.51% From Current Price Level
$408 – Buyers – 9:1, -6.42% From Current Price Level
$404 – Buyers – 3:1, -7.33% From Current Price Level
$400 – Sellers – 2.33:1, -9.14% From Current Price Level
$396 – Buyers – 1:0*, -10.05% From Current Price Level – 200 Day Moving Average*
$392 – Buyers – 3.2:1, -10.96% From Current Price Level
$388 – Sellers – 1.14:1, -11.87% From Current Price Level
$384 – Buyers – 1.27:1, -12.78% From Current Price Level
$380 – Even – 1:1, -13.69% From Current Price Level
$376 – Buyers – 1.18:1, -14.6% From Current Price Level
$372 – Buyers – 2.25:1, -15.5% From Current Price Level
$368 – Buyers – 1.7:1, -16.41% From Current Price Level
$364 – Buyers – 2.67:1, -17.32% From Current Price Level
$360 – Buyers – 0.1:0*, -18.23% From Current Price Level
$356 – Buyers – 2.67:1, -19.14% From Current Price Level
$352 – Sellers – 2:1, -20.05% From Current Price Level
$348 – Buyers – 0.7:0*, -20.96% From Current Price Level
$344 – Buyers – 1.93:1, -21.86% From Current Price Level
$340 – Sellers – 1.23:1, -22.77% From Current Price Level
$336 – Buyers – 2.8:1, -23.68% From Current Price Level
$332 – Buyers – 1.15:1, -24.59% From Current Price Level
$328 – Buyers – 1.14:1, -25.5% From Current Price Level
$324 – Sellers – 1.03:1, -26.41% From Current Price Level
$320 – Sellers – 1.15:1, -27.32% From Current Price Level
$316 – Sellers – 1.12:1, -28.22% From Current Price Level
$312 – Sellers – 1.52:1, -29.13% From Current Price Level
$308 – Sellers – 1.44:1, -30.04% From Current Price Level
$304 – Buyers – 1.58:1, -30.95% From Current Price Level
$300 – Sellers – 1.64:1, -31.86% From Current Price Level
$296 – Buyers – 1.27:1, -32.77% From Current Price Level
$292 – Buyers – 1.15:1, -33.68% From Current Price Level
$288 – Sellers – 1.53:1, -34.58% From Current Price Level
$284 – Buyers – 1.2:1, -35.49% From Current Price Level
$280 – Even – 1:1, -36.4% From Current Price Level
$276 – Sellers – 1.2:1, -37.31% From Current Price Level
$272 – Buyers – 2.33:1, -38.22% From Current Price Level
$268 – Buyers – 3:1, -39.13% From Current Price Level
$264 – Buyers – 0.2:0*, -40.04% From Current Price Level
$260 – Sellers – 0.1:0*, -40.94% From Current Price Level
$256 – Buyers – 0.3:0*, -41.85% From Current Price Level
$252 – Buyers – 0.2:0*, -42.76% From Current Price Level
$248 – Buyers – 0.2:0*, -43.67% From Current Price Level
$244 – NULL – 0:0*, -44.58% From Current Price Level
*** I DO NOT OWN SHARES OR OPTIONS CONTRACT POSITIONS IN SPY, QQQ, IWM OR DIA AT THE TIME OF PUBLISHING THIS ARTICLE ***
SPY, the SPDR S&P 500 ETF gained +4.75% last week, while the VIX closed the week at 14.94, indicating an implied one day move of +/-0.94% & an implied one month move of +/-4.32% for the S&P 500.
SPY ETF – SPDR S&P 500 ETF’s Technical Performance Over The Past Year
Their RSI is trending into overbought territory in the wake of last week’s performance & currently sits just below it at 69.23, while their MACD crossed over bullishly on Thursday morning.
Volumes were still extremely light though, coming in -21.85% below the prior year’s average (47,910,000 vs. 61,308,656), which as we’ve highlighted in prior weeks’ notes is down drastically from even just seven month’s ago’s prior year’s average volume.
While there was some enthusiasm as a result of the US Presidential election & the FOMC Interest Rate decision the participation rate is still low following mid-April.
Last week opened on a note of uncertainty, as the session’s candle stayed within the range of the previous Thursday’s candle & the support of the 50 day moving average held up, although volumes were light.
Tuesday the low volume continued, but the session resulted in an advance that closed in line with the resistance of the 10 day moving average as folks anxiously awaited the results of the US election.
Wednesday saw enthusiasm rush through the markets, as the highest volume of the week led to a 2.5% gap up for SPY that opened well above the 10 day moving average’s resistance, but it came with a note of caution.
The day’s candle resulted in a hanging man, which has bearish implications & signals that there was a bit of downside appetite despite the day’s higher close.
The good times rolled on into the weekend when Thursday opened on another gap up session higher & Friday produced a +0.43% gain.
Friday’s candle offered another glimmer of caution as well, as while the upper shadow on the day’s candle is not long enough for the candle to be a shooting star, the day’s open & close were concentrated on the lower end of the candle.
Heading into the new week it will be interesting to see if there is enough momentum to continue SPY’s climb higher, or if there will be a cool off period.
Their MACD suggests that there may still be some fuel in the tank to the upside, but their RSI is nearing the overbought level, which is something investors should be mindful of in the days to come.
Another key area of interest will be how price behaves in regards to the window that was created by Wednesday’s gap up.
Due to the fact that we’re near all-time highs there is not enough volume sentiment data to assess the strength of the nearby support levels for SPY, as the $586.12 & 10 day moving average at $581.36 both fall within the window.
In the event it begins to fill then the strength of the 50 DMA’s support will be something else to keep an eye on to see if it can provide stable enough footing for SPY to consolidate & broaden.
SPY has support at the $586.12 (Volume Sentiment: NULL, 0:0*), $581.36 (10 Day Moving Average, Volume Sentiment: NULL, 0:0*), $570.82 (50 Day Moving Average, Volume Sentiment: NULL, 0:0*) & $567.89/share (Volume Sentiment: NULL, 0:0*) price levels, with resistance at the $599.64/share (All-Time High, Volume Sentiment: NULL, 0:0*) price levels.
SPY ETF’s Price Level:Volume Sentiment Over The Past ~2 Years
QQQ, the Invesco QQQ Trust ETF that tracks the NASDAQ 100 climbed +5.48% last week, as investors were eager to get into the tech focused index.
QQQ ETF – Invesco QQQ Trust ETF’s Technical Performance Over The Past Year
Their RSI has flattened out after advancing towards the overbought level & currently sits at 67.6, while their MACD crossed over bullishly on Thursday.
Volumes were -25.25% below the previous year’s average volume (29,298,000 vs. 39,196,719), indicating that there is still a severe lack of participation much like SPY.
SPY & QQQ have both benefitted dramatically from the AI/Data Center/Semiconductor trades of the past couple of years & it now appears as though investors are pivoting away in favor of the small cap names in IWM & the blue chip index of DIA.
Accordingly, QQQ’s week went very similar to SPY’s, starting off on an uncertain note Monday when the session resulted in a slight decline & a high wave spinning top candle that formed a bearish harami pattern with the day prior’s candle on low volume.
The next day opened in a gap up & ran up to test the resistance of the 10 day moving average, which was briefly broken but was unable to close above it.
Wednesday opened on a large gap up & the session continued higher, setting a new all-time high & closing above the $505/share price level on the highest volume of the week as investors were excited about the results of the election.
Thursday followed suit with another gap up day & all-time high as market participants were still pleased by Wednesday’s news.
Friday the week wound down on another high note, but the day’s candle did flash signal for caution ahead.
Friday’s candle opened lower than Thursday’s close but was able to push slightly higher, adding +0.12% for the day & setting a new all-time high, but it appears that the $514.92/share level is where investors lost enthusiasm & may signal the top in the near-term.
Entering this week it will be interesting to see if there are some profits taken which would push prices down to begin filling in the gaps of last week.
QQQ has more local support than SPY did that may help keep prices propped up & from declining too low below the window, but that will be heavily dependent on how much volume we see on declining days.
The $502.81 & $501.35/share points will be interesting to follow, as they were only broken through on account of gaps, which could make for a false breakout based on the low volume levels.
Any decline will be worth keeping an eye on as well to see if the 10 & 50 DMAs hold up, especially now that the 200 DMA sits just -7.64% below the 10 DMA & -5.16% below the 50 DMA.
Prices tested against the 200 DMA in August & were able to rebound & climb higher, but the appetite to dip below it has already been shown once in the past year & can’t be ruled out again.
QQQ has support at the $502.81 (Volume Sentiment: Buyers, 0.6:0*), $501.35 (Volume Sentiment: Buyers, 0.6:0*), $497.47 (Volume Sentiment: Buyers, 2.4:0*) & $493.70/share (Volume Sentiment: Buyers, 0.7:0*) price levels, with resistance at the $514.92/share (Volume Sentiment: NULL, 0:0*) price levels.
QQQ ETF’s Price Level:Volume Sentiment Over The Past ~2 Years
IWM ETF – iShares Russell 2000 ETF’s Technical Performance Over The Past Year
Their RSI has also flattened out, but in overbought territory & sits at 72.78, while their MACD crossed over bullishly on Wednesday.
Volumes were +9.69% above the previous year’s average levels (36,796,000 vs. 33,544,150), as investors were eager to get into small cap names following the US election & FOMC Interest Rate decision.
IWM’s week began on an interesting note, opening lower than Friday’s close, testing to below the support of the 50 DMA before breaking out upwards & crossing the resistance of the 10 DMA briefly before closing in-line with it.
Tuesday opened slightly lower before taking off running through the resistance of the 10 DMA & closing firmly above it.
IWM had a phenomenal Wednesday which accounted for +5.8% of the week’s gains as IWM gapped up, tested down to near the $232.50/share level before roaring back on high volume to close the session higher.
It should be noted that the day resulted in a hanging man candle which carries bearish implications with it, as despite the day’s gain there showed to be plenty of appetite for prices to head to the downside as well.
Despite most of it likely coming from profit taking after the gap, it is still something to consider moving forward, particularly if IWM is unable to continue higher as it will then give a rough idea as to the near-term range it may trade in.
Thursday flashed more warning signs for IWM though, as the session opened lower, tested higher to hit a new all-time high, before collapsing down to near the $235/share mark & settling down for the day.
While Friday’s +0.74% gain created a bullish engulfing candle, the volume sentiment behind it was severely lackluster & does not show much strength & conviction behind the move.
This coming week will be important to track the direction of volume to assess whether or not the current island that was set up last week will be sustainable & if not, how far the declines may be.
The $227-227.85/share level will be the first line of defense for IWM in terms of support, unless the 10 DMA moves higher in the meantime before those levels are tested.
In the event of a breakdown, IWM has many more local support levels than SPY or QQQ due to the rangebound oscillations it advances in vs. the latter two indexes more steep ascents & rapid growth.
IWM has support at the $227.85 (Volume Sentiment: Buyers, 1.6:0*), $227.17 (Volume Sentiment: Buyers, 1.6:0*), $225.87 (Volume Sentiment: Buyers, 1.6:0*) & $225.84/share (10 Day Moving Average, Volume Sentiment: Buyers, 1.6:0*) price levels, with resistance at the $238.49/share (All-Time High, Volume Sentiment: NULL, 0:0*) price levels.
IWM ETF’s Price Level:Volume Sentiment Over The Past ~2 Years
DIA ETF – SPDR Dow Jones Industrial Average ETF’s Technical Performance Over The Past Year
Their RSI is trending towards overbought levels & is currently at 68.36, while their MACD crossed over bullishly on Thursday.
Volumes were +31.68% above the previous year’s average (4,554,000 vs. 3,458,379), as investors showed that they clearly were seeking the protection of the blue chip names while at all-time highs.
Monday opened the week up the same as SPY & QQQ with a declining day where DIA opened lower, briefly tested higher before plunging through its 50 DMA’s support & recovered to close just below it.
Volumes were weak, a trend that continued into Tuesday when the session opened higher & powered above both the 50 & 10 DMA’s resistance levels to close above each, but again, on weak volume.
Wednesday saw a +3.5% advance on the heaviest volume of the week as DIA opened on a gap up & little profit taking took place based on the size of the lower shadow of the session’s candle.
Thursday’s price action began to show some doubt in the strength of the new all-time high set on Wednesday, as though the session advanced on solid volume, it closed lower than it opened & had a very narrow range (between a spinning top & a doji, but not entirely one or the other) between the day’s open & close.
This indicates that there was enough fuel to keep active participation going, but that there was not much appetite to take things higher & that market participants felt like they were at equilibrium.
Friday the gains continued with DIA advancing +0.62% on the day on the second highest volume of the week, but the size of the upper shadow on the day’s candle is cause for concern.
Bears clearly took the reigns back at $441.70 & forced the price back down to $440.11 & following the message of the prior day’s candle it appears that investors might be nearing the end of their rope on the near-term upside for DIA.
Much like the prior three index ETFs, this week all eyes will be on the window created Wednesday & whether or not it gets filled in the near-term.
Whether the above average volume continues for DIA will also be something to be aware of this coming week, as should it begin to falter there will likely be some risk-off movements by market participants that would force a test of the support of the 10 & possibly 50 DMAs.
Otherwise, in the event of decline the $426-426.50 level will be a zone to keep an eye on for support, as there is currently not much volume data about these price levels to gauge historic sentiment yet.
DIA has support at the $443.20 (Volume Sentiment: NULL, 0:0*), $426.15 (10 Day Moving Average, Volume Sentiment: NULL, 0:0*), $426.05 (Volume Sentiment: NULL, 0:0*) & $421.09/share (50 Day Moving Average, Volume Sentiment: NULL, 0:0*) price levels, with resistance at the $441.70/share (All-Time High, Volume Sentiment: NULL, 0:0*) price levels.
DIA ETF’s Price Level:Volume Sentiment Over The Past 3-4 Years
The Week Ahead
Monday is Veteran’s Day & the bond market will be closed.
Aramark & Monday.com report earnings on Monday morning before the opening bell, followed by Archrock, Assured Guaranty, James River Group, Kyverna Therapuetics, Luminar Technologies, Nevro, Talos Energy & Zeta Global after the session’s close.
Tuesday brings us NFIB Optimism Index data at 6am.
Home Depot kicks off Tuesday morning’s earnings calls, along with Alight, Alumis, AstraZeneca, Avadel Pharmaceuticals, Camtek, Endava, EVgo Inc., First Advantage, Genius Sports, Hertz Global, Hudbay Minerals, HUYA, IAC Inc., IHS Holding Limited, International Game Technology, Legend Biotech, Live Nation, Mirum Pharmaceuticals, Mosaic, Neumora Therapeutics, Northwest Natural, Novavax, On Holding, Pactiv Evergreen, Pagaya, Piedmont Lithium, Plug Power, Repligen, Roivant Sciences, Scholar Rock, Schrodinger, Sea Limited, Shift4 Payments, Shoals Technologies, Smith Douglas Homes, Sphere Entertainment, SpringWorks Therapeutics, Sunstone Hotel, Surgery Partners, Sylvamo, Target Hospitality, Tencent Music, TreeHouse Foods, Triumph Group & Tyson Foods, followed by Amdocs, American Healthcare REIT, Azenta, CAE, Cannae Holdings, CAVA Group, Chegg, Crinetics Pharmaceuticals, DHT, EverCommerce, Grab, Hudson Pacific Properties, ICU Medical, Instacart, Integral Ad Science, Light & Wonder, MARA Holdings, Natera, NCR Atleos, NeuroPace, Occidental Petroleum, OUTFRONT Media, Paragon 28, Paymentus, Perdoceo Education, Progyny, Prothena, PubMatic, Rackspace Technology, Repay Holdings, Rocket Lab USA, Seadrill Ltd, Skyworks Solutions, SoundHound AI, Spotify, Suncor Energy, TechTarget, Topgolf Callaway Brands, Xenon Pharmaceuticals & ZoomInfo after the closing bell.
Consumer Price Index, CPI Year-over-Year, Core CPI & Core CPI Year-over-Year data is all due for release Wednesday at 8:30 am, followed by the Monthly U.S. Federal Budget data at 2pm.
Thursday brings us Initial Jobless Claims, Producer Price Index, PPI Year-over-Year, Core PPI & Core PPI Year-over-Year data at 8:30 am.
Walt Disney, Advance Auto Parts, Bilibili, JD.com, NetEase, NICE, Nomad Foods, Sally Beauty, Sally Beauty & ZEEKR Intelligent Technology Holding are all due to report earnings on Thursday morning before Applied Materials, ESCO Technologies, Globant, Mitek Systems & Post report after the session’s close.
Import Price Index, Import Price Index minus Fuel, Empire State Manufacturing Survey, U.S. Retail Sales & Retail Sales minus Autos data are all scheduled for release on Friday at 8:30 am, followed by Industrial Production, & Capacity Utilization data at 9:15 am & Business Inventories data at 10 am.
Friday morning’s major earnings call is Alibaba Group Holding.
See you back here next week!
*** I DO NOT OWN SHARES OR OPTIONS CONTRACT POSITIONS IN SPY, QQQ, IWM OR DIA AT THE TIME OF PUBLISHING THIS ARTICLE ***
SPY, the SPDR S&P 500 ETF dipped -0.95% this week, while the VIX closed at 20.33, indicating an implied one day move of +/-1.28% & an implied one month move of +/-5.88% for the S&P 500.
SPY ETF – SPDR S&P 500 ETF’s Technical Performance Over The Past Year
Their RSI has flattened out just above the neutral 50 level & sits at 56.86, while their MACD crossed over bearishly on Wednesday.
Volumes were -35.77% below the previous year’s average (40,436,000 vs. 62,957,183), as investors continue to sit on edge waiting to see what mega cap tech earnings & PCE/inflation data tell us this week.
Monday the week began on a sour note, as the session’s candle resulted in a dragonfly doji that tested the support of the 10 day moving average.
While support held up, volumes were even lower than last week’s, indicating that there was still a good deal of fear & uncertainty about SPY’s outlook for the week.
This continued into Tuesday, where on the lowest volume of the week SPY opened in line with the prior day’s close, only to continue lower throughout the day & settle rested atop the support of the 10 DMA.
Wednesday the 10 DMA’s support broke down, as the session opened below it, tested briefly above it only to fall & close lower, with a large lower shadow signaling that there was still more downside appetite among market participants, but that the bulls had temporarily forced a stronger close.
Thursday saw a glimmer of optimism, as another dragonfly doji candle occurred while SPY tried to claw back some of Wednesday’s losses, but note that the volume was extremely weak on Thursday, which does not indicate that there was much bullish sentiment behind they day’s move.
Thursday’s candle could be considered a bullish harami, but based on the low volume sentiment behind the session & the lower close than open it should be viewed bearishly.
One area of hope from Thursday’s session was that the low of the day was not as low as Wednesday’s, but this is nothing to hitch your wagon to just yet.
Friday managed to open higher, but still below the 10 DMA’s resistance, break temporarily above the resistance level, before ultimately closing near the low of they day -0.03% on the second highest volume of the week.
This “risk-off” into the weekend did not set the stage for an enthusiastic new week & indicates that there is still a bit of skepticism among market participants about the current strength of the S&P 500.
As we look to the coming week the 10 day moving average’s relationship to SPY’s share price remains one of the most important areas to keep an eye on this week.
Support gave out & resistance held strong in the latter half of the week, which will remain important in determining the direction SPY goes in heading into the latter portion of the week.
If the price stays below the 10 DMA’s resistance for too long market participants will become exhausted & impatient likely leading to some selling pressure forcing SPY’s price lower.
This is especially true if there is not a meaningful increase in volume, as the current tumbleweed low levels are unsustainable in the long run if SPY’s valuation is to remain justified near all-time highs.
The direction that volume increases in & the magnitude of the increase will also remain important to watch, as it will shed light into which way market participants are likely to continue moving in once a trend has been established.
Watching how investors are participating will help you to anticipate which direction things will move in in the short-to-medium term.
Something else of note for this week is that now that SPY’s price is below the 10 DMA, the first support level (S1) is their 50 DMA, which is continuing to rise.
Looking at their past year’s chart (above) you can see that more often than not in the past year when the price has gone between these two moving averages there has often been declines, many of which have been able to break down & test the 50 DMA’s support (and two in particular that broke down through it entirely).
This leads to something else that has begun emerging from SPY’s chart over the past week, the appearance of a potential bearish head & shoulders set up forming.
Look back to 9/19/2024’s gap up session & note that the left shoulder forming, with the recent all-time high as the head & the right shoulder yet to form.
Should the moving averages observation above hold true that will begin the formation of the right hand shoulder over a 5-6 week period (assuming a more rapid decline doesn’t take place instead).
The low volume of the past couple of weeks has made this become even more of a possibility as there is no fuel in SPYs tank & looking at their MACD & RSIs it begins to look even more strongly a possibility.
SPY has support at the $566.02 (50 Day Moving Average, Volume Sentiment: NULL, 0:0*), $563.43 (Volume Sentiment: Buyers, 10:1), $562.48 (Volume Sentiment: Buyers, 10:1) & $553.17/share (Volume Sentiment: Buyers, 1.92:1) price levels, with resistance at the $581.66 (10 Day Moving Average, Volume Sentiment: NULL, 0:0*) & $586.12/share (All-Time High, Volume Sentiment: NULL, 0:0*) price levels.
SPY ETF’s Price Level:Volume Sentiment Over The Past ~2 Years
QQQ ETF – Invesco QQQ Trust ETF’s Technical Performance Over The Past Year
Their RSI is trending towards the overbought level of 70 & currently sits at 58.85, while their MACD crossed over bearishly last week.
Volumes were -21.75% below the previous year’s average level (31,432,000 vs. 40,167,659), which as noted in last week’s market review note is severely low in relation to the volumes that QQQ (and the other index ETFs sans-IWM) had previously enjoyed in years past.
QQQ had a different week from SPY, but still did not have a strong performance as investors have begun to sour on the two indexes in favor of IWM & DIA recently.
QQQ opened the week on a quite uncertain note, where mediocre volume resulted in a bullish engulfing candle that resulted in a spinning top.
They briefly broke down through the 10 day moving average’s support during the day, but managed to power higher to close the day higher.
The weak volume & temporary support break down are cause for concern though, which QQQ showed on Tuesday.
While at first glance Tuesday was another bullish engulfing candle & it did not close with the same “indecision” surrounding it that Monday’s spinning top indicated, it should be noted that the volume was weak & that the session opened below the resistance of the 10 DMA.
The fact that the support level was feeble enough to be broken through before the market opened is not indicative of strength & conviction behind QQQ, which was proven with Wednesday’s declining session.
While prices were able to briefly break above the 10 DMA’s resistance, they spent most of the session below it & Wednesday’s volume was the strongest of the week, which is telling about the lack of investor confidence in QQQ as there has not been any major run up to trim profits from & volume hadn’t been that high since 10/1/2024 (also declining volume).
The session’s lower shadow also signals that there was more downside appetite.
Thursday showed the weakest volume of the week for QQQ on a session that closed in a dragonfly doji, indicating indecision, particularly as the 10 DMA was not crossed.
It created a harami cross pattern with Wednesday’s session, which led to Friday’s gap up open that skipped right over the 10 DMA’s resistance.
Friday’s move came on the second highest volume of the week, indicating that there was some support behind it from market participants, however it closed as a gravestone doji, indicating that the bears were still out in full force & likely signaling that there was some intra-day profit taking after the gap up, based on the height of the upper shadow.
QQQ’s week ahead will also be heavily dependent on how the price is in relation to their 10 DMA, which closed Friday as their second level of support (S2).
In the event that prices make a break lower & get pinned between the 10 & 50 DMAs there is additional local support to help prop prices up, but the curve of the 10 DMA should be cause for concern.
Once the 10 DMA curls over as much as it has recently it has led to lower prices in the coming sessions that come in the form of steeper declines vs. consolidation.
When referencing the volume sentiment by price level table below you’ll notice that this may well lead to a 5%+ decline based on the Buyer:Seller sentiment at these levels over the past ~2 years.
While this week’s earnings calls may be enough of a catalyst to forge higher for QQQ, they too are showing signs of a bearish head & shoulders pattern emerging over a similar time period as SPY’s.
Friday’s high would become the head (assuming nothing in the days to come is higher than it), giving it 4-6 weeks until the right shoulder is formed (in the event that it does not decline more rapidly).
In the event of an earnings catalyst this week, it will be imperative to see how the $502.81 resistance level holds up, as in the event that it is broken through the landscape for QQQ will change (pending on how their oscillators react to the jump).
While QQQ has shown higher peaks & higher troughs since the declines of July, the lackluster participation rate being signaled by their current volume levels raises cause for concern still moving into the week ahead & like SPY, watching their the direction & fluctuations that their volume goes in will lend tells into where they head next.
QQQ has support at the $493.70 (Volume Sentiment: Buyers, 0.7:0*), $493.24 (Volume Sentiment: Buyers, 0.7:0*), $484.86 (Volume Sentiment: Buyers, 1.6:0*) & $480.15/share (50 Day Moving Average, Volume Sentiment: Buyers, 1.4:1) price levels, with resistance at $493.70/share (All-Time High, Volume Sentiment: Buyers, 0.7:0*) price levels.
QQQ ETF’s Price Level:Volume Sentiment Over The Past ~2 Years
IWM ETF – iShares Russell 2000 ETF’s Technical Performance Over The Past Year
Their RSI recently crossed below the neutral mark of 50 & sits currently at 47.86, while their MACD has been bearish since Wednesday.
Volumes were -38.02% below the prior years average (21,100,000 vs. 34,043,929), which is peculiar, given that the Russell has fared the best of the major four indexes in terms of volume since 4/19/2024 & is something to consider in any analysis of the small cap index.
After rounding the prior week out with a couple of bad sessions the pain continued into the new week for IWM, as the session opened lower & proceeded to decline -1.74% & meeting the support of the 10 day moving average (briefly breaking down below it) on some of the highest volume of the week.
While some may attribute this to profit taking, it seems a bit lopsided compared to the volumes of the week & a half prior’s run up & should be viewed with a skeptical eye.
Tuesday the ship continued to sink, as the session opened on a gap down beneath the 10 day moving average’s support & closed as a hanging man candle (bearish).
Volume was noticeably weaker than the previous day’s, however the emphasis here should be placed on the fact that the session opened up with all faith in the 10 DMAs support level obliterated.
Wednesday followed suit, opening on a gap down again & despite showing some bulls had entered the chat (upper shadow) the bears were still in control, forcing the session to almost test the support of the 50 day moving average beneath it.
Bulls were able to rush in & force the close to be in the top ~33% of the day’s range though, and there was a lot of shares trading hands compared to most of the rest of October based on their “high” volume.
The dim outlook continued into Thursday, when the session opened higher, tested higher & then proceeded to retrace over 50% of the prior day’s range & ultimately closed below its opening price, indicating weakness & poor spirits among market participants given the low volume of the day.
Friday the bandaid was ton off, as a high volume for the week session resulted in a bearish engulfing candle that sat almost perfectly between the resistance of the 10 DMA & support of the 50 DMA.
Every part of Friday’s candle eclipsed Thursday’s, leading to the oscillator readings mentioned above & the curling over of their 10 day moving average’s resistance which looks set to apply downward pressure on IWM’s price.
While we’ve noted in past weeks that IWM’s volume has not taken as big of a hit as the other major three index ETFs, volume & the direction it occurs in will still be very telling about the next direction IWM takes in the coming weeks & should be paid close attention to.
Much like SPY & QQQ, the relationship between price & the 10 & 50 day moving averages will be important to note as well, especially as they’re both also signaling a potential near-term head & shoulders pattern whose left shoulder formed in mid-September.
Another thing of note regarding IWM’s 50 DMA’s support is that should it break down, there are no other touch-points until $210.57/share & the 50 DMA is in s Seller dominated price block (3.3:1).
While the $208 support zone has been dominated by the Buyers 2:1 in recent history & the $210.57/share point is contained in this price block, it may not be the sturdiest of support & should be viewed with caution.
IWM has support at the $217.50 (50 Day Moving Average, Volume Sentiment: Sellers, 3.3:1), $210.57 (Volume Sentiment: Buyers, 2:1), $208.58 (Volume Sentiment: Buyers, 2:1) & $208.47/share (Volume Sentiment: Buyers, 2:1) price levels, with resistance at the $221.69 (Volume Sentiment: Buyers, 2.86:1), $222.57 (10 Day Moving Average, Volume Sentiment: Buyers, 2.86:1), $222.17 (Volume Sentiment: Buyers, 2.86:1) & $227.85/share (Volume Sentiment: Buyers, 1.6:0*) price levels.
IWM ETF’s Price Level:Volume Sentiment Over The Past ~2 Years
DIA ETF – SPDR Dow Jones Industrial Average ETF’s Technical Performance Over The Past Year
Their RSI also just crossed through the neutral 50 mark & sits currently at 46.31, while their MACD has also been bearish since Wednesday.
Volumes were -22.17% below the previous year’s average (2,696,000 vs. 3,464,048), as investors are even skittish on buying into the blue chip index so close to all-time highs.
The week began & ended on a weak note for DIA following a new all-time high hit on Friday & a pair or dragonfly doji candles closing out the week before.
Monday’s bearish engulfing candle set the stage for a week of pain for DIA, as it started the week off with a test of the support of the 10 day moving average.
While it didn’t break down the support level on Monday, Tuesday gapped lower on the open before turning upwards & closing near in-line with the 10 DMA’s resistance, after briefly breaking through it (upper shadow).
Wednesday the pain got worse, when the week’s highest volume session began with a gap down that ultimately tested -0.96% lower than its opening price during the session, despite bulls managing to step in & for the close to be about midway between the day’s range.
Thursday the sad song continued for DIA, as it opened on a gap lower & closed as a hanging man candle (bearish).
Friday the trend remained alive & well, as the session declined -0.62% on a bearish engulfing candle, setting this week up for more bearish performance from the looks of things.
DIA also has the same head & shoulders pattern appearing from mid-September as SPY, QQQ & IWM have & their oscillators & moving averages are also beginning to show this forming.
Keep an eye on their volume in the coming weeks, particularly which direction it appears to be moving in as that will lead prices.
Like the three aforementioned ETFs, the coming week will also be marked by where DIA’s price winds up in relation to their 10 & 50 DMAs, which as you can see looking at their chart will likely be what causes the H&S pattern to form based on the current layout.
DIA has support at the $418.12 (Volume Sentiment: Buyers, 0.2:0*), $417.66 (Volume Sentiment: Buyers, 0.2:0*), $415.17 (Volume Sentiment: Buyers, 0.8:0*) & $411.96/share (Volume Sentiment: Buyers, 3.4:1) price levels, with resistance at the $426.05 (Volume Sentiment: NULL, 0:0*), $428.24 (10 Day Moving Average, Volume Sentiment: NULL, 0:0*) & $433.20/share (All-Time High, Volume Sentiment: NULL, 0:0*) price levels.
DIA ETF’s Price Level:Volume Sentiment Over The Past ~3 Years
The Week Ahead
Monday there are no major U.S. Economic Data Reports or Fed Speakers.
Acadia Realty Trust, Bank of Hawaii, CenterPoint Energy, Hope Bancorp, ON Semiconductor, PROCEPT BioRobotics & SJW all report earnings before Monday’s opening bell, followed by Agilysys, Amkor, Atlas Energy Solutions, Boot Barn Holdings, Brixmor Property, Brown & Brown, Cadence Design, Calix Networks, Camping World, Capital Southwest, CCC Intelligent Solutions, COPT Defense Properties, Crane, CVR Energy, Douglas Dynamics, Element Solutions, Encompass Health, F5 Networks, Flowserve, Ford Motor, Harmonic, Inari, Kforce, Kilroy Realty, Leggett & Platt, LTC Properties, NorthWestern, PotlatchDeltic, Rambus, Regency Centers, Safehold, SBA Communications, Skyline Champion, TransMedics Group, Trex, UFP Industries, Ultra Clean Holdings, V.F. Corp, Waste Management & Welltower after the session’s close.
S&P Case-Shiller Home Price Index (20 Cities) data comes out at 9 am on Tuesday, followed by Consumer Confidence & Job Openings Data at 10 am.
Tuesday kicks off with earnings from American Tower, Armstrong World Industries, Asbury Automotive, ATI Inc., CBIZ, CECO Environmental, Check Point Software, Comcast, Commvault Systems, Corning, CTS Corp, D.R. Horton, DT Midstream, Eagle Materials, Ecolab, Enterprise Products, ESAB Corp., Franklin Electric, Frontier Group Holdings, Graphic Packaging, H&E Equipment, Harmony Biosciences, Hayward Holdings, HNI, Hubbell, Incyte, IPG Photonics, ITT, Janus International Group, JetBlue Airways, Kiniksa Pharmaceuticals, Leidos, Masco, McDonald’s, MSCI, Northwest Bancshares, PayPal Holdings, Pfizer, Phillips 66, PJT Partners, Royal Caribbean, Scorpio Tankers, Shutterstock, SoFi Technologies, Stanley Black & Decker, Sysco, Tenet Healthcare, Xerox & Zebra Technologies, with 10x Genomics, Adtalem Global Education, Advanced Micro Devices, Alignment Healthcare, Allison Transmission, Alphabet, American Homes 4 Rent, Artisan Partners Asset Management, BioMarin Pharmaceutical, BXP, Caesars Entertainment, Cheesecake Factory, Chemed, Chipotle Mexican Grill, Chubb, DaVita, Edison International, Electronic Arts, Enovix, EQT Corp., Essex Property, Exelixis, ExlService, Expand Energy, Extra Space Storage, First Commonwealth, First Solar, FirstEnergy, FMC Corp, Huron Consulting, IDEX Corp, Ingevity, Landstar System, Littelfuse, Meritage Homes, Mirion Technologies, Modine Manufacturing, Mondelez International, NerdWallet, O-I Glass, ONEOK, Park Hotels & Resorts, PROS Holdings, Provident Financial Services, Qorvo, Reddit, Republic Services, SAGE Therapeutics, Skyward Specialty Insurance Group, Snap, STAG Industrial, Stryker, Udemy, UMB Financial Corp, Unisys, Unum Group, Varonis Systems, Visa, W.P. Carey, Werner Enterprises & Zurn Elkay Water Solutions scheduled to report after the closing bell.
Wednesday kicks off with ADP Employment data at 8:15 am, with GDP, Advanced U.S. Trade Balance in Goods, Advanced Retail Inventories & Advanced Wholesale Inventories data at 8:30 am.
AbbVie, AerCap, AFC Gamma, Allete, Ares Capital, Arvinas, Automatic Data Processing, Avanos Medical, Avnet, Axalta Coating Systems, Bausch + Lomb, Bausch Health, Biogen, Blackbaud, Brinker International, Bunge, Caterpillar, CDW, Chefs’ Warehouse, Clean Harbors, Clearway Energy, Columbus McKinnon, Curbline Properties, Dana, Eli Lilly, Exelon, Extreme Networks, Fiverr, Flex, Fortive, Garmin, Gates Industrial, GE HealthCare, Gentherm, Gibraltar Industries, GlaxoSmithKline, Global Payments, Group 1 Auto, Healthcare Realty, Hess, Hess Midstream Partners, Humana, Illinois Tool Works, IMAX, InMode, Intra-Cellular Therapies, JinkoSolar, Kirby, Kraft Heinz, Leonardo DRS, LivaNova, Martin Marietta, Materion, Monro Muffler, Navient, Neurocrine Biosciences, NiSource, NovoCure, Oil States, Omnicell, OneMain Holdings, OneSpaWorld, Option Care Health, Oshkosh, Otis Worldwide, Parsons, ProPetro, Reynolds Consumer Products, Shake Shack, Silgan Holdings, SiteOne Landscape Supply, Stepan, Terex, The Vita Coco Company, Tradeweb Markets, Trane, TTM Technologies, United Therapeutics, Verisk Analytics, Vulcan Materials, Wingstop, XPO & Zimmer Biomet are all scheduled to report earnings before Wednesday’s opening bell, followed by Meta Platforms, Acadia Healthcare, Advanced Energy, Aflac, Albany International, Alkami Technology, Allegiant Travel, Allstate, Alphatec, Altair Engineering, American Water Works, Amgen, Antero Midstream, Antero Resources, Arch Capital, Arcosa, AXIS Capital, Axos Financial, Beacon Roofing Supply, Benchmark Electronics, Bio-Rad Labs, Booking Holdings, C.H. Robinson, Cactus, Carvana, Casella Waste, CF Industries, Clorox, Cognex, Cognizant Technology Solutions, Coinbase Global, Columbia Sportswear, Compass Diversified, Comstock, Confluent, CONMED, Corcept Therapeutics, Credit Acceptance, Curtiss-Wright, Custom Truck One Source, DoorDash, eBay, Employers Holdings, Energy Recovery, Envista, EPR Properties, Equinix, Equity Residential, Ethan Allen, Etsy, Everest Group, Federal Realty, Floor & Decor, FormFactor, Four Corners Property Trust, FTAI Aviation, Gen Digital, GoDaddy, Green Brick Partners, Hanover Insurance, Herbalife Nutrition, Hercules Capital, Houlihan Lokey, Hub Group, Independence Realty Trust, Informatica, Invitation Homes, iRhythm, KLA Corporation, Lemonade, LPL Financial, Magnolia Oil & Gas, Manitowoc, Matson, MediaAlpha, Merit Medical, MetLife, MGM Resorts, Microsoft, MicroStrategy, Mid-America Apartment Communities, Mister Car Wash, Monolithic Power, Murphy USA, MYR Group, National Storage Affiliates, NETGEAR, New Mountain Finance, Nextracker, NV5 Global, Omega Health, Paramount Group, Paycom Software, Paylocity, Penumbra, Pilgrim’s Pride, PriceSmart, Procore Technologies, Prudential, Public Storage, Remitly Global, Riot Platforms, Robinhood Markets, Roku, Root, Inc., Rush Enterprises, Rush Street Interactive, Ryan Specialty Group, Silicon Motion, Sleep Number, Sprouts Farmers Market, SPX Technologies, STAAR Surgical, Starbucks, Stem, Sturm Ruger, Summit Materials, Sunnova Energy, Teekay Tankers, Teladoc, Tenable, Trupanion, Twilio, UDR, Universal Display, Ventas, Warrior Met Coal, Watts Water Technologies & WillScot Mobile Mini after the closing bell.
Personal Income, Personal Spending, PCE Index, PCE (Year-over-Year), Core PCE Index, Core PCE (Year-over-Year) & Initial Jobless Claims data are all released Thursday morning at 8:30 am, followed by Pending Home Sales data at 10 am.
Thursday morning’s earnings calls include 1-800-FLOWERS, Agios Pharmaceuticals, Allegro Microsystems, Alnylam Pharma, Altria, Alumis, Ametek, APi Group, Aptiv, Arrow Electronics, Avient, Ball Corp, Bandwidth, BCE Inc, Belden, BorgWarner, Bristol Myers Squibb, California Water Service, Canada Goose, Canadian Natural Resources, Cheniere Energy, Cinemark, CMS Energy, ConocoPhillips, Cullen/Frost, Donnelley Financial, Driven Brands, Dun & Bradstreet, Eaton, Ecovyst, EMCOR Group, Entergy, Enviri Corporation, Estee Lauder, Federal Signal, Ferrari, First Majestic Silver, Fresh Del Monte, Generac, Genesis Energy, Gildan Activewear, Grainger, Granite Construction, Green Plains, HF Sinclair, Huntington Ingalls, Hyatt Hotels, IdaCorp, IDEXX Labs, Inhibrx Biosciences, Insperity, International Paper, Intercontinental Exchange, InterDigital, IQVIA, Itron, Janus Henderson Group, Kellanova, Kimco Realty, Kontoor Brands, Kymera Therapeutics, Lancaster Colony, Laureate Education, Lazard, LendingTree, Li Auto, Lightspeed, Lincoln Electric, Lincoln National, Linde, Madrigal Pharmaceuticals, Malibu Boats, Mastercard, Merck, MGP Ingredients, Mobileye Global, Norwegian Cruise Line, Open Text, Organon, Patrick Industries, PBF Energy, Peabody Energy, Peloton Interactive, PHINIA, Quanta Services, Radware, Regeneron Pharmaceuticals, Roblox, SharkNinja, SolarWinds, Southern, STMicroelectronics, SunCoke Energy, TC Energy, Teleflex, The Cigna Group, Trinity Industries, Uber Technologies, Uniti Group, Upbound Group, Utz Brands, Vontier, WEC Energy Group, Wendy’s, Willis Towers Watson, Xcel Energy & Xylem, with Amazon.com, Apple, ACCO Brands, Agnico-Eagle Mines, Alliant Energy, Amcor, Ardelyx, Asure Software, Atlassian, BJ Restaurants, Camden Property, CNO Financial, Cohu, Concentra Group Holdings Parent, Coterra Energy, CubeSmart, Customers Bancorp, Dorman Products, Eastman Chemical, El Pollo Loco, Fox Factory Holding, Grid Dynamics, Halozyme Therapeutics, ICF International, Ingersoll-Rand, Intel, Juniper Networks, Lemaitre Vascular, MasTec, Mercer International, Onto Innovation, Quaker Chemical, Reinsurance Group of America, Sabra Health Care REIT, Select Medical, SkyWest, SM Energy, Sonoco Products, Tennant, U.S. Steel, Verra Mobility, Viavi, VICI Properties & Vir Biotechnology reporting after the closing bell.
Friday morning brings us U.S. Employment Report, U.S. Unemployment Rate, U.S. Hourly Wages & Hourly Wages Year-over-Year data at 8:30 am, followed by S&P final U.S. Manufacturing PMI data at 9:45 am, Construction Spending & ISM Manufacturing data at 10 am & Auto Sales data.
Alpha Metallurgical Resources, ArcBest, Ares Management, BrightSpring Health Services, Cardinal Health, Cboe Global Markets, Chart Industries, Charter Communications, Chevron, Church & Dwight, DigitalBridge, Dominion Energy, Enbridge, Essent Group, Exxon Mobil, fuboTV, Imperial Oil, Interface, LyondellBasell, Magna, Moog, nVent Electric, Pediatrix Medical Group, PPL Corp, Protolabs, RBC Bearings, Simon Properties, T. Rowe Price, Telus, TXNM Energy, TXNM Energy & Wayfair are all scheduled to report earnings before Friday’s opening bell.
See you back here next week!
*** I DO NOT OWN SHARES OR OPTIONS CONTRACT POSITIONS IN SPY, QQQ, IWM OR DIA AT THE TIME OF PUBLISHING THIS ARTICLE ***
SPY, the SPDR S&P 500 ETF added +0.86% last week, while the VIX closed at 18.03, indicating an implied one day move of +/-1.14% & an implied one month move of +/-5.21%.
SPY ETF – SPDR S&P 500 ETF’S Technical Performance Over The Past Year
Their RSI is advancing towards the overbought level of 70 & sits currently at 66.24, while their MACD is bullish, but its histogram is signaling that it is losing steam following last week’s relatively flat performance.
Volumes were -40.04% below the previous year’s average levels (38,592,000 vs. 64,338,465), as market participants have clearly begun to show signs of caution in regards to the U.S. election & international relations in October.
For comparison, using April 21, 2024’s Market Review Note‘s prior year’s average volume of 78,101,687 (last peak volume was 4/19/2024 before volumes began to significantly decline) the current prior year’s average volume is -17.62% lower & the past week’s volume was -50.59% lower.
Now let’s look at what happened last week.
Monday kicked the week off on a gap up session that continued to climb higher, closing with only a small upper shadow, but on less than stellar volume.
Profit taking & warning lights began flashing on Tuesday, when the day’s session resulted in a bearish engulfing candle on a declining session on volume that eclipsed the rest of the month, minus 10/1/2024’s declining session’s volume.
Wednesday opened in-line with Tuesday’s close & saw more selling temporarily as more investors took profits following Monday’s gap up & the week before’s advances (there was no market note last week as I was on vacation).
The session also had the lowest volume of the week, and given the week was weak, it may be the start of investors becoming extremely cautious as we run up to the U.S. Presidential Election.
The cautious attitude continued into Thursday, as while the session advanced on the day to set a new all-time high for SPY, it opened on a gap up, nudged higher (minuscule upper shadow), before tumbling to close just above the prior day’s close, closing lower than it opened (bearish).
Thursday’s volume was also the second lowest of the week, adding confirmation to the already bearish looking set up.
Friday’s session opened midway through Thursday’s candle’s real body range & resulted in a hanging man candle that closed lower than it opened, with limited test to the upside (small upper shadow) & the day’s low was slightly higher than Thursday’s low.
What is even more interesting about Friday’s session is that the candle formed a harami pattern with Thursday’s.
Typically an advancing session (+0.38% intraday) is considered bullish, which would mark this a bullish harami.
However, given the fact that it closed below its open & resulted in a filled candle, there is plenty of bearish sentiment & reason to interpret it as a bearish harami, which when paired with the low volume & other bearish elements of the week reason for caution moving into the week ahead.
Aside from the previously mentioned potential market moving news, there is a plethora of earnings reports due out this week that are all outlined in “The Week Ahead” at the bottom of this article which may be a catalyst for more volatility in the coming week, along with the Fed’s Beige Book being released on Wednesday.
Those earnings calls will be something to keep an eye on in the coming week, as will the volume levels of the week, as if Wednesday’s volume stands as a spike it will likely down the road be viewed as a reversal point, especially with how bearish the rest of the week was (even if it did advance slightly higher).
The next order of business will be to watch how the 10 day moving average holds up as a support level in the event of a leg down, as it is currently at a level where there is not much historic volume data to based how investor sentiment may be should that test come.
While there is a light support zone between $561.89 & $563.43, that begins -3.62% from Friday’s closing price.
It’s worth noting that $561.89 is the 50 day moving average & it will continue rising as time progresses, pinching the zone smaller & smaller as days pass.
While the touch-points in this zone are all historically dominated by Buyers at a rate of 10:1 by volume (see “Volume Sentiment” link below), this range has seen limited testing & sits near price extremes, so it has not seen much in terms of testing.
This can be seen when you consider the gap downs & wide-range declining sessions that took place at these levels, making any retest of these levels dilute the historic Buyer sentiment.
It would also be prudent to watch SPY’s RSI, as the last time it approached the overbought 70 mark it retreated rather than crossing over it like we’ve seen happen a majority of the other times it’s approached it this year.
If there is not an increase in volume as it approaches that level again it is a signal to take caution.
Also, referring to the 10 DMA point above, should price drop below it & it becomes a resistance level, look at the prior year’s examples of what’s happened when this occurs.
Given they’re at all-time highs there is little to review regarding their upside.
The table below breaks down volume sentiment at each price level SPY has traded at over the past ~2 years & can be referenced to see how strong or weak SPY’s support or resistance levels may be (the link explains how to read the table).
SPY has support at the $578.72 (10 Day Moving Average, Volume Sentiment: NULL, 0:0*), $563.43 (Volume Sentiment: Buyers, 10:1), $562.48 (Volume Sentiment: Buyers, 10:1) & $561.89/share (50 Day Moving Average, Volume Sentiment: Buyers, 10:1) price levels, with resistance at the $586.12/share (All-Time High, Volume Sentiment: NULL, 0:0*) price levels.
SPY ETF’s Price Level:Volume Sentiment Over The Past ~2 Years
QQQ ETF – Invesco QQQ Trust ETF’s Technical Performance Over The Past Year
Their RSI is rising towards overbought levels & currently sits at 60.85, while their MACD is has flattened out but it bullish after dipping below the signal line for a couple of sessions.
Volumes were -33.43% lower than the prior year’s average volume (27,278,000 vs. 40,977,632), which as we just outlined in SPY is a reason to consider taking caution in the near-term.
Using the same 4/21/2024 market data as SPY’s comparison (49,155,742 was the average annual volume), the current average past year’s volume for QQQ is -16.64% lower, while last week’s average volume was -44.51% lower than that benchmark.
Now that the A.I. & Semiconductor trade has begun to wane in popularity we’ve witnessed a big shift in volumes between SPY & QQQ vs. IWM & DIA.
As noted, SPY & QQQ have moved in a much more similar manner to one another than the latter two index ETFs.
QQQ’s week also began on a gap up session where the day’s high marked a recent resistance level on volumes that were nothing to write home about.
Tuesday saw a -1.34% decline on the week’s highest volume, which is second highest for October minus 10/1/2024’s declining volume & formed a very large bearish engulfing candle.
Much of this was likely profit taking in the wake of the previous week’s run up & it should be noted that the 10 day moving average’s support managed to hold up, despite the day’s low testing it.
Bearishness & cautious sentiment carried on Wednesday, when QQQ opened opened just above the 10 day moving average’s support, briefly broke through it but managed to close the day as a dragonfly doji.
Dragonfly dojis tend to signal that there may be a price reversal move coming up, but given that there is no trend to reverse from & the low volume.
Thursday opened with a glimmer of optimism on a gap up, only to drag lower throughout the day & close in-line with the 10 DMA lower than it opened, another sign of caution.
Friday continued to theme of risk-off/take caution ahead as the session opened midway between Thursday’s real body range & closed as a harami cross.
Typically this would indicate that the current trend may be winding down & setting up to reverse, but the recent trading activity has been relatively choppy & not strongly trending in one way or another.
With this in mind, the week ahead will be time to watch the price of QQQ in relation to the 10 day moving average.
We’ll likely see a retest of it based on Fed speakers & earnings calls at some point in the week & how strong that support level holds up will be a key determinant of QQQ’s near-term performance.
This is going to be especially important given that the price range it sits in now is Seller dominated 3:1 over the past 2-3 years & the next two zones beneath it (table below) are Buyer dominated, but not by much.
If those zones are passed through we may see 5%+ declines from Friday’s closing price as the two zones beneath it favor the Sellers.
There is also only one support level that falls into those two aforementioned Buyer zones, which will make it difficult for QQQ to find footing without sliding into those Seller zones.
In terms of the upside potential, the $498.83 mark is going to be an area to keep an eye on, as if volumes improve & prices are driven up above it there may be a possible run at the recent all-time high of $502.81.
QQQ has support at the $493.70 (Volume Sentiment: Buyers, 0.7:0*), $491.55 (10 Day Moving Average, Volume Sentiment: Sellers, 3:1), $484.86 (Volume Sentiment: Buyers, 1.6:0*) & $477.40/share (Volume Sentiment: Sellers, 1.05:1) price levels, with resistance at the $498.83 (Volume Sentiment: ) & $502.81/share (All-Time High, Volume Sentiment: Buyers, 0.6:0*) price levels.
QQQ ETF’s Price Level:Volume Sentiment Over The Past ~2 Years
IWM ETF – iShares Russell 2000 ETF’s Technical Performance Over The Past Year
Their RSI is trending down towards neutral but still sits closer to overbought levels at 63.84, while their MACD is bullish, but beginning to show signs of a bearish rollover in the near-term.
Volumes were -35.74% below the previous year’s average (22,194,000 vs. 34,538,583), which is bad given that IWM currently has a higher past year’s average volume than it did in April.
Compared to the 4/21/2024 market data where IWM’s prior year’s average volume was 34,864,840, IWM’s current prior year’s average volume is +0.94% higher, while last week’s volume was -35.74% lower.
Monday IWM started off on a sleepy note, when the week began with a very low volume session that opened just above Friday’s close, tested lower before trudging up to close the day out as an advancing session, but with lackluster participation.
Tuesday is when things began to get murky for IWM, as the session opened slightly higher, tested briefly into Monday’s range, before rocketing higher to break above the $225/share mark, when folks began taking profits & forced the price down so low that the day ended as a high wave candle & spinning top.
This is troubling as the real body of the candle is concentrated at the bottom of the day’s range & the upper shadow is much higher than the lower, indicating that there was not enough bullish sentiment to keep climbing higher.
This makes Wednesday’s candle even more interesting, as the day began on a gap up, briefly tested lower before powering higher on the week’s highest volume.
It set the stage for the range that the rest of the week would trade in for IWM, as Thursday opened slightly higher, only to test down to the bottom of Wednesday’s candle’s real body & find bullish support around the $225/share mark & closed as a hanging man candle (bearish).
Bearish sentiment carried on into Friday as investors were not willing to carry small cap risk into the weekend & continued taking profits from the run-up of the past week.
While the last two sessions of the week were bearish, the volumes behind the movements was not particularly strong.
This week will be important to watch how the window created by Wednesday’s gap up holds up or if it becomes filled, as Wednesday’s session’s high was unable to reach the 52-week high set in July.
Should that window be filled there will be a pair of support touch-points in the $221.57-221.69 (first number may increase as it is the 10 DMA) which will prove to be vital for IWM’s price, as should they break down there are no other support levels until it enters a Seller dominated price zone where they’ve outnumbered Buyers 3.3:1.
The good news is that this support level is the 50 day moving average, which will continue higher, but if IWM declines below that & both the 10 & 50 DMAs are applying resistance & downward pressure on the price there are no support levels again until $210.57.
Volume will be imperative to watch as well, as it may lend clues into which way IWM will break out as the current volume levels are lackluster & reflect cautious sentiment.
IWM has support at the $221.69 (Volume Sentiment: Buyers, 2.86:1), $221.57 (10 Day Moving Average, Volume Sentiment: Buyers, 2.86:1), $216.16 (50 Day Moving Average, Volume Sentiment: Sellers, 3.3:1) & $210.57/share (Volume Sentiment: Buyers, 2:1) price levels, with resistance at the $227.17 (Volume Sentiment: Buyers, 1.6:0*) & $227.85/share (52-Week High, Volume Sentiment: Buyers, 1.6:0*) price levels.
IWM ETF’s Price Level:Volume Sentiment Over The Past ~2 Years
DIA ETF – SPDR Dow Jones Industrial Average ETF’s Technical Performance Over The Past Year
Their RSI has flattened just beneath the overbought level & currently sits at 68.43, while their MACD is still bullish, but may be losing steam if they do not advance early in the next week following the past two days’ relatively flat performance.
Volumes were -20.98% below the previous year’s average volume (2,762,000 vs. 3,495,512), as investors have even grown cautious around the blue chip index names.
Compared to the 4/21/2024 market data when DIA’s average prior year’s volume was 3,508,088, DIA’s current prior year’s average volume is -0.36% lower & their past week’s volume was -21.27% lower.
DIA’s week began on a bullish note, although their RSI was nudging up against the overbought level, which helped pave the way for the more cautious approach the rest of the week took.
They opened just below Friday’s close before powering higher, but it should be noted it was on the week’s weakest volume.
Tuesday opened lower & was unable to find any footing as profit taking pushed DIA’s price down into the close on the week’s second highest volume, which indicated that in addition to the desire to capture profits, there was also a bit of uneasiness gripping into DIA’s pricing.
Wednesday’s session produced a bullish engulfing candle, but again, on light volume which did not indicate that there was a potential breakout at-hand.
Thursday gapped up, but the day resulted in a dragonfly doji with the week’s highest volume.
This would normally be something of more interest & perhaps carry more bullish implications, but given it set a new all-time high & tested down almost to Wednesday’s high it appears that market participants were not overly eager to continue pushing higher.
This was confirmed Friday when the session resulted in another dragonfly doji, on lower volumes, that also saw a bit of bearish selling pressure as market participants were ready to take some chips down from the table heading into the weekend.
Friday was also the second lowest volume of the week, which makes Thursday’s price movement look even less remarkable.
Heading into this week it will be interesting to watch if DIA is able to trudge any higher, given that they hit the all-time high so late in the week (Friday).
The window created by Thursday’s open will also be an area to watch in to see if it becomes filled, as well as DIA’s RSI, as it has flattened out just below the overbought mark of 70 & will need to split one way or the other in the near-term.
While the table below is one month old & may need to be refreshed, the low volume environment DIA has traded in has caused a set up where for the next -2.92% from Friday’s closing price there is limited Buyer:Seller information to gauge sentiment.
With that in mind, keep an eye on the volumes that you see coming in during the week to get an idea as to how market participants may be slanted in terms of their near-term outlook.
Also, should the 10 Day Moving Average’s support break down, there is support at the $426.05/share level (-1.52%), before nothing for an additional -1.86%, which is when DIA returns to Buyer dominated price levels for another ~3%.
One thing of note though is that with the exception of $408-411.99, these Buyer zones are relatively untested so far by Sellers, and it would be wise to keep that in mind should these price levels be tested.
DIA has support at the $427.18 (10 Day Moving Average, Volume Sentiment: NULL, 0:0*), $426.05 (Volume Sentiment: NULL, 0:0*), $418.12 (Volume Sentiment: Buyers, 02.:0*) & $415.17/share (Volume Sentiment: Buyers, 0.8:0*) price levels, with resistance at the $433.20/share (All-Time High, Volume Sentiment: NULL, 0:0*) price levels.
DIA ETF’s Price Level:Volume Sentiment Over The Past ~3 Years
The Week Ahead
Monday kicks off with Fed President Logan speaking at 8:55 am, followed by U.S. Leading Economic Indicators data at 10 am.
Sandy Spring Banc reports earnings Monday morning before the opening bell before AGNC Investment, Alexandria RE, BOK Financial, Cadence Bank, Cathay Bancorp, Equity Lifestyle Properties, HealthStream, Hexcel, Medpace Holdings, Nucor, Simpson Manufacturing, W.R. Berkley & Zions Bancorp report after the session’s close.
Fed President Harker speaks Tuesday morning at 10 am.
Tuesday morning’s earnings calls include GE Aerospace, Verizon, 3M, A.O. Smith, Atlantic Union Bankshares, Banc of California, Comcast, Community Financial System, Danaher, Denny’s, Fiserv, Freeport-McMoRan, GATX, General Motors, Genuine Parts, Herc Holdings, Interpublic, Invesco, Kimberly-Clark, Lockheed Martin, Moody’s, Old National Bancorp, PACCAR, Pentair, Philip Morris International, Polaris Industries, PulteGroup, Quest Diagnostics, RTX & Sherwin-Williams, with Agree Realty, Baker Hughes, Brandywine Realty, Canadian National Railway, CoStar Group, East West Bancorp, Enova International, Enphase Energy, Highwoods Properties, JBT Corp, Manhattan Associates, Matador Resources, Nabors Industries, National Bank, Packaging Corp of America, PennyMac, Range Resources, Retail Opportunity Investments, Robert Half, Seagate Technology, Stride, Texas Instruments, Trustmark, Valmont Industries, Veritex Holdings & Vicor all reporting after the closing bell.
Wednesday brings us Existing Home Sales data at 10 am & the Fed’s Beige Book at 2pm.
Amphenol, AT&T, Avery Dennison, Boeing, CME Group, Coca-Cola, Constellium, Evercore, GE Vernova, General Dynamics, Healthcare Services Group, Hilton, KBR, Lennox International, Lithia Motors, Mr. Cooper Group, New Oriental Education & Technology, NextEra Energy, NextEra Energy Partners, Northern Trust, Old Dominion, PROG Holdings, Prosperity Bancshares, Roper, Stifel Financial, Taylor Morrison Home, Teledyne Technologies, Thermo Fisher Scientifi, TransUnion, Travel + Leisure Co, UniFirst, United Community Banks, Vertiv Holdings, Westinghouse Air Brake Technologies, Watsco & Winnebago are all due to report earnings before Wednesday’s opening bell, with Tesla, Align Technology, Ameriprise Financial, ASGN Incorporated, CACI International, Canadian Pacific Kansas City, Celestica, Century Communities, Churchill Downs, Community Health, Core Labs, EastGroup, Equity Commonwealth, Essential Properties Realty Trust, Globe Life, Goosehead Insurance, Graco, Greenbrier, International Business Machines, ICON, Impinj, Kaiser Aluminum, Knight-Swift Transportation Holdings, Lam Research, Las Vegas Sands, Lending Club, Mattel, MaxLinear, Moelis, Molina Healthcare, MSA Safety, Newmont, O’Reilly Automotive, Oceaneering International, Pathward Financial, Patterson-UTI, Pegasystems, Plexus, QuantumScape, Raymond James, Rollins, Sallie Mae, SEI Investments, ServiceNow, Simulations Plus, South State, Stewart Info, T-Mobile US, Teradyne, Tyler Technologies, United Rentals, Veralto, Viking Therapeutics, Waste Connections, WesBanco, Western Union, Whirlpool & Wyndham Hotels & Resorts reporting after the session’s close.
Initial Jobless Claims data comes out Thursday morning at 8:30 am, followed by S&P Flash U.S. Services PMI & S&P Flash U.S. Manufacturing PMI data at 9:45 am & New Homes Sales data at 10 am.
Thursday morning’s earnings calls include ADT, Alkermes, Allegion, AllianceBernstein, American Airlines, Applied Industrial, Berkshire Hills Bancorp, Bread Financial, Brunswick, Carpenter Technology, Carrier Global, CBRE Group, Columbia Banking, Dover, Dow, DTE Energy, Euronet, Expro Group, First Merchants, FirstService, FTI Consulting, Harley-Davidson, Hasbro, Honeywell, Integer Holdings, Keurig Dr Pepper, KKR, Labcorp Holdings, Lear, Life Time, Lindsay Corp, LKQ, MSC Industrial, NASDAQ, NetScout Systems, Northrop Grumman, OSI Systems, Pacific Premier, Pool, Radius Recycling, Reliance, Rogers Communications, RPC, Ryder System, S&P Global, Simply Good Foods, Sonic Automotive, Southside Banc, Southwest Air, TechnipFMC, Teck Resources, Textron, Tractor Supply, TRI Pointe Homes, Union Pacific, United Parcel Service, Valero Energy, Valley National, Virtu Financial, Visteon, Wabash National, West Pharmaceutical Services & WEX, followed by Ameris Bancorp, AppFolio, AptarGroup, Arthur J. Gallagher, Associated Banc-Corp, Beyond, Boston Beer, Boyd Gaming, Capital One, Carlisle Cos, Cincinnati Financial, Coursera, Cousins Properties, Deckers Outdoor, Dexcom, Digital Realty Trust, Edwards Lifesciences, Exponent, Federated Hermes, First Financial Bancorp, First Interstate Bancsystem, Gaming and Leisure Properties, Glacier Bancorp, Hartford Financial, Healthpeak Properties, Kinsale Capital, Knowles, L3Harris, McGrath RentCorp, Minerals Technologies, Mohawk Industries, NOV Inc., Olin, Phillips Edison & Company, Piedmont Office Realty Trust, Principal Financial Group, ResMed, Seacoast Banking, Skechers USA, SPS Commerce, SS&C Technologies, Texas Roadhouse, Tronox, Universal Health, VeriSign, Western Digital, Weyerhaeuser & WSFS Financial after the closing bell.
Friday the week winds down with Durable-Goods Orders & Durable-Goods Minus Transportation data at 8:30 am, followed by Consumer Sentiment (final) data at 10 am.
The week winds down with Aon, AutoNation, Avantor, Balchem, Barnes Group, Booz Allen Hamilton, Centene, Colgate-Palmolive, First Hawaiian, Gentex, HCA, Lakeland Financial, New York Community, Newell Brands, Piper Sandler, Portland General Electric, Saia, Sanofi, Sensient, Stellar Bank, TriNet Group & WisdomTree reporting earnings before the session’s opening bell.
See you back here next week!
*** I DO NOT OWN SHARES OR OPTIONS CONTRACT POSITIONS IN SPY, QQQ, IWM OR DIA AT THE TIME OF PUBLISHING THIS ARTICLE ***
SPY, the SPDR S&P 500 ETF advanced +0.26% last week, having the best week of the major four index ETFs, while the VIX closed the week out at 19.21, indicating an implied one day move of +/-1.21% & a one month implied move of +/-5.55% for the S&P 500.
SPY ETF – SPDR S&P 500 ETF’s Technical Performance Over The Past Year
Their RSI is trending towards overbought levels after Friday’s gap up session & currently sits at 62.77, while their MACD is lightly bearish & sitting relatively flat with the signal line; again, as a result of Friday’s moves after crossing bearish a couple of days prior.
Volumes were still notably low, coming in -21.65% below the past year’s average volume (51,658,000 vs. 65,934,287), which as we highlighted last week marks a steep decline from where the prior year’s average volume readings were coming in at 5-6 months ago ( that market note here).
Monday began the week on a moderately upbeat note, there was the second highest volume of the week on a bullish session that despite dipping low enough to test the 10 day moving average’s support was able to find legs & close higher for the day.
It was not able to test the all-time high set the previous Thursday though, a clear sign that market participants have become exhausted & are not overly eager to chase SPY or its component stocks much higher.
Tuesday this uneasiness was confirmed when markets opened lower, and despite temporarily testing higher (shown by candle’s upper shadow), the session was largely bearish, with the week’s highest volume coming as bears pushed the price to break beneath the 10 DMA’s support temporarily, before rising back up to close the day just beneath it; clearly showing some cracks have formed.
Wednesday added more fuel to the fire, when SPY opened lower, tested lower, but ultimately rallied to end the day as an advancing session, but was unable to break above the resistance of the 10 DMA.
Things continued on this track into Thursday, when the session opened lower & floundered around all day to prove unable to break above the 10 DMA’s resistance, but to also show that there was not enough bearish sentiment among market participants to force prices to the low levels of the prior day.
Ultimately, Thursday ended in a spinning top candle in a declining session, indicating that there was a lot of uneasiness in the market & uncertainty regarding SPY.
This made Friday’s price action look like a squeeze, as the volume was the third highest of the week, but far below that of the top two days, prices opened on a gap up above the 10 DMA’s resistance, but intraday crossed below it’s support, only to rally higher but still close lower than the session opened as a hanging man candle.
While the MACD & RSI temporarily benefitted from this movement, it does not come across as being something with a solid foundation that is built to last & indicates that there is reason to be cautious in the coming week regarding SPY (And the other major indexes, for that matter).
Prices have similarly shown weakness in days leading up to days that manage to pop above the 10 DMA’s support only to fall in the coming sessions in May & August & given the existing weakness that we are seeing for SPY this looks to be the case coming into tomorrow.
Heading into the coming week the 10 DMA will continue to be an area of focus for SPY, as well as any volume clues that may come along with the price action, as despite overall volumes being lower than usual, there are still subtle clues that can be taken from the behavior of market participants about their current sentiment & next moves.
Last week’s support level notes will also be relevant this week (apologies for keeping this note brief, but I am on vacation & preparing for an all-day charity event tomorrow, as well as a hurricane the next day).
Those notes regarding the support for SPY all remain true, especially given the way the RSI & MACD moved over the past five days.
This week will feature a lot of Federal Reserve speakers, as well as the FOMC Minutes from the September meeting (released Wednesdays at 2pm) & big bank earnings kick off the next earnings season beginning on Friday.
Aside from that, there is also CPI, PPI & earnings from Domino’s Pizza & PepsiCo during the week, all of which will shed more light into the state of the average consumer & how they’re coping with inflation.
SPY has support at the $570.68 (10 Day Moving Average, Volume Sentiment: NULL, 0:0*), $563.43 (Volume Sentiment: Buyers, 10:1), $562.48 (Volume Sentiment: Buyers, 10:1) & $553.17/share (Volume Sentiment: Buyers, 1.92:1) price levels, with resistance at the $574.71/share (All-Time High, Volume Sentiment: NULL, 0:0*) price levels.
SPY ETF’s Price Level:Volume Sentiment Over The Past ~2 Years
QQQ, the Invesco QQQ Trust ETF that tracks the NASDAQ 100 added +0.12% last week, having the second strongest showing of the major four index ETFs.
QQQ ETF – Invesco QQQ Trust ETF’s Technical Performance Over The Past Year
Their RSI is also trending higher towards overbought after Friday’s session & currently sits at 60.1, while their MACD remains bullish, but the MACD line is flat just above the signal line, which can lead to a bearish crossover in the coming days given how close together they are.
Volumes were -26.92% below the prior year’s average (30,578,000 vs. 41,840,661), as market participants are still not showing confidence or enthusiasm for the tech-heavy index.
Monday began on a similar shaky note as SPY, as while prices advanced for the session, they did test down to the 10 day moving average’s support during the sessions, indicating that there was downside appetite & blood in the water.
Bears came out in full force Tuesday, forcing prices to decline through the 10 DMA’s support on the week’s highest volume as investors began to show that QQQ is not on stable footing in the near-term & despite clawing back from the lows of the day’s candle’s lower shadow it was unable to close above the 10 DMA.
Wednesday the weakness & indecision theme continued, with QQQ opening lower, testing lower throughout the day & ultimately closing as a spinning top candle, indicating indecisiveness.
The 10 DMA’s resistance held up strength & it was the lowest volumes of the week, showing that there was not much conviction or enthusiasm for market participants to see QQQ go higher.
Thursday opened on a gap down & the bulls came back out to play, forcing QQQ higher, but still not being able to rally enough to force the close above the 10 DMA’s resistance, and the session closed out midway between the real body of Wednesday’s candle.
Friday reflected similar price movement that SPY saw, where a gap up day closed as a hanging man candle that closed lower than it opened while having crossed below the 10 DMA’s support, but managing to close above it.
This week keep an eye on the 10 DMA’s strength of support, as once it becomes a resistance level the recent tests have proven that it is likely to remain one for a while, as investors have not been keen to pick up risk much near it this past week.
The other primary concerns of last week are all still in play this week & can be found here: 9/29/2024’s Market Review Note.
QQQ has support at the $485.07 (10 Day Moving Average, Volume Sentiment: Buyers, 1.6:0*), $484.86 (Volume Sentiment: Buyers, 1.6:0*), $477.40 (Volume Sentiment: Sellers, 1.05:1) & $474.88/share (Volume Sentiment: Sellers, 1.08:1) price levels, with resistance at the $493.70 (Volume Sentiment: Buyers, 0.7:0*) & $502.81/share (All-Time High, Volume Sentiment: Buyers, 0.6:0*) price levels.
QQQ ETF’s Price Level:Volume Sentiment Over The Past ~2 Years
IWM, the iShares Russell 2000 ETF declined -0.54% last week, as the small cap index was the least favored among market participants.
IWM ETF – iShares Russell 2000 ETF’s Technical Performance Over The Past Year
Their RSI just bounced off of the neutral 50 mark & is moving higher towards overbought territory following Friday’s gap up session, while their MACD has crossed over bearishly last week.
Despite this bearish crossover the MACD line has flattened out, but it still sits beneath the signal line & is not likely to break above it this week, unless there is some major revelation that comes from the FOMC Minutes that not one has priced in, or a surprise in inflation data from CPI/PPI.
Volumes were also the lowest of all index ETFs, coming in -34.03% lower than the previous year’s average volume (23,138,000 vs. 35,072,964), as market participants have been less eager to get into small cap names over the past couple of weeks, after a rally in the index in the two weeks before that.
Monday started off IWM’s week on an ominous note, as IWM opened below the 10 day moving average, tested further lower, before rallying higher on volume that was average for the week (3rd highest), which was not a clear sign of strength & bullish conviction.
Tuesday the weakness really began to show, as the session opened about midway between the real body of Monday’s candle, but sellers drove the price down to below the $217.50/share mark & despite bull’s best efforts, the day closed out as a declining session.
Needless to say, this also happened to have been the highest volume session of the week, signaling that there was a lot of folks ready to hop out of the IWM pool at the price levels tested, and that while there was some appetite to push prices higher, the day’s close was still below the midway mark of the day’s range.
Wednesday the declines continued & indecision remained king as the session ended in a spinning top, but the close was higher than the opening gap down, signaling that there were muted signs of optimism for the small caps, and volumes were the lowest of the week.
Thursday’s long legged doji candle showed a lot of indecision & uncertainty in the small cap world for IWM, as prices covered the $217.23-215.08 range throughout the day, only to close slightly lower than they opened.
Friday’s +1.4% gap higher session was able to close above the 10 day moving average’s resistance, however the majority of the day’s price action took place below the 10 DMA’s resistance & the close was lower than the open, indicating weakness.
Friday did have the second highest volume of the week, which would be expected based on the wide range of prices that were tested that day, particularly to the downside.
Last week’s thoughts about the week ahead for IWM are all still also largely in play, as ultimately the week took a decline but only lost -0.54% W-o-W.
IWM has support at the $218.89 (10 Day Moving Average, Volume Sentiment: Sellers, 3.3:1), $214.37 (50 Day Moving Average, Volume Sentiment: Buyers, 1.69:1), $210.57 (Volume Sentiment: Buyers, 2:1) & $208.58/share (Volume Sentiment: Buyers, 2:1) price levels, with resistance at the $221.69 (Volume Sentiment: Buyers, 2.86:1), $224.17 (Volume Sentiment: Buyers, 1.6:0*) & $227.85/share (52-Week High, Volume Sentiment: Buyers, 1.6:0*) price levels.
IWM ETF’s Price Level:Volume Sentiment Over The Past ~2 Years
DIA ETF – SPDR Dow Jones Industrial Average ETF’s Technical Performance Over The Past Year
Their RSI is trending towards overbought levels & sits at 64.31 following Friday’s performance, while their MACD crossed over bearishly last week & remains below the signal line.
Volumes were -6.32% below the previous year’s average (3,314,000 vs. 3,537,391), and one thing of note is how the largest volume spike of the week was for a declining session.
Monday set the stage with a hanging man candle with “long legs” based on the lower shadow & appetite for downside DIA price movement it showed, as prices broke through the support of the 10 DMA before rallying back to close for an advancing session.
Tuesday opened lower, tested in the real body of Monday’s candle, before dunking below the 10 DMA & returning to close lower for the day straddling the waterline of the 10 DMA.
Again, the volume of Tuesday’s downside action speaks volumes about how market participants feel right now, as profit takers were met by enough buyers to still force prices back up to the 10 DMA.
Wednesday the negative sentiment continued, as prices opened in the middle of Tuesday’s real body, did not get much higher & ultimately dipped below the 10 DMA’s support again.
Bulls rushed in & were able to force the price to just back above the 10 DMA’s support level, but the session closed lower than it opened & the volumes for the day reflect low participation levels, meaning that despite the “positive” close, there was quite a bit to be negative about.
Thursday confirmed this when prices gapped lower, test higher towards the 10 DMA’s resistance but were rejected, only to test far lower & still close as a decline.
While there were enough buyers to force a large lower shadow, volumes were still meager; hardly a vote of confidence.
Friday DIA saw the same good fortunes as every index ETF above, a gap up open that was above the 10 DMA’s support, but they broke below it for a while before rallying to close higher & end the day with a hanging man candle on low volume.
This is reflecting bearish sentiment for the blue chip index, and all of last week’s observations for the week ahead items to watch are still in play.
Thank you for referring back to last week for these observations while I am working on this with limited time compared to usual.
DIA has support at the $421.68 (10 Day Moving Average, Volume Sentiment: NULL, 0:0*), $415.32 (Volume Sentiment: Buyers, 0.8:0*), $412.11 (Volume Sentiment: Buyers, 0.8:0*) & $408.89/share (50 Day Moving Average, Volume Sentiment: Buyers, 3.4:1) price levels, with resistance at the $426.20/share (All-Time High, Volume Sentiment: NULL, 0:0*) price levels.
DIA ETF’s Price Level:Volume Sentiment Over The Past ~3-4 Years
The Week Ahead
Monday the week kicks off with Fed Governor Bowman speaking at 1pm, Consumer Credit data at 3pm & Fed President Musalem speaking at 6:30 pm.
Fed Governor Kugler speaks at 3 am Tuesday, followed by NFIB Optimism Index data at 6 am, U.S. Trade Deficit data at 8:30 am, Fed President Bostic speaking at 12:45 pm & Fed Vice Chair Jefferson speaking at 7:30 pm.
Helen of Troy reports earnings Wednesday before the opening bell, with AZZ due to report following the closing bell.
Wednesday features Fed President Bostic speaking at 8 am, Fed President Logan speaking at 9:15 am, Wholesale Inventories data & Fed President Goolsbee speaking at 10:30 am, FOMC Minutes From The Fed’s September Meeting at 2pm & Fed President Daly speaking at 6 pm.
Initial Jobless Claims, Consumer Price Index, Core CPI & Core CPI Year-over-Year data are all released at 8:30 am Thursday, before Fed Governor Cook speaks at 9:15 am, Fed President Barkin speaks at 10:30 am & Fed President Williams speaks at 11 am.
JP Morgan Chase, BlackRock, BNY Mellon, Fastenal & Wells Fargo are all due to report earnings before Friday’s opening bell.
Friday morning starts off with Producer Price Index, Core PPI, PPI Year-over-Year & Core PPI Year-over-Year at 8:30 am, Fed President Goolsbee speaks at 9:45 am, Consumer Sentiment (prelim) comes in at 10 am, Fed President Logan speaks at 10:45 am & Fed Governor Bowman speaks at 1:10 pm to wind down the week.
See you back here next week!
*** I DO NOT OWN SHARES OR OPTIONS CONTRACT POSITIONS IN SPY, QQQ, IWM OR DIA AT THE TIME OF PUBLISHING THIS ARTICLE ***