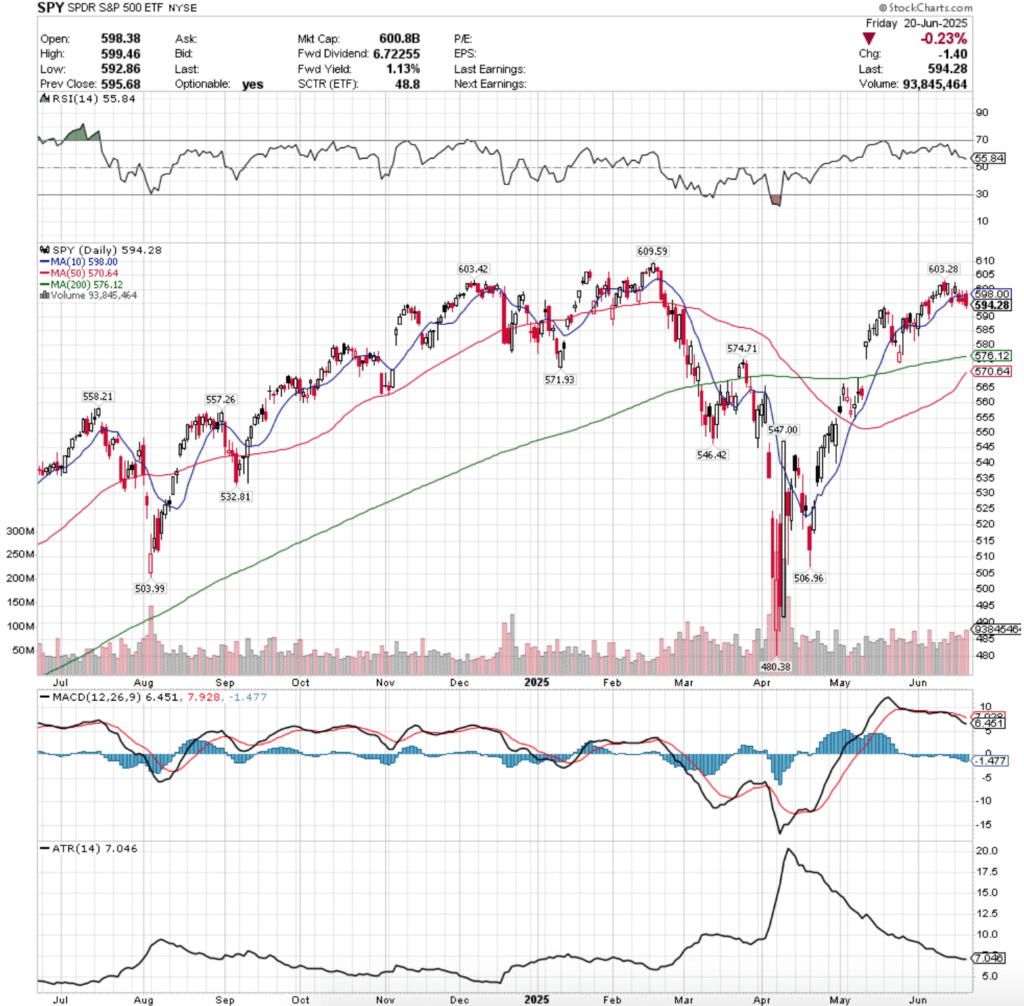
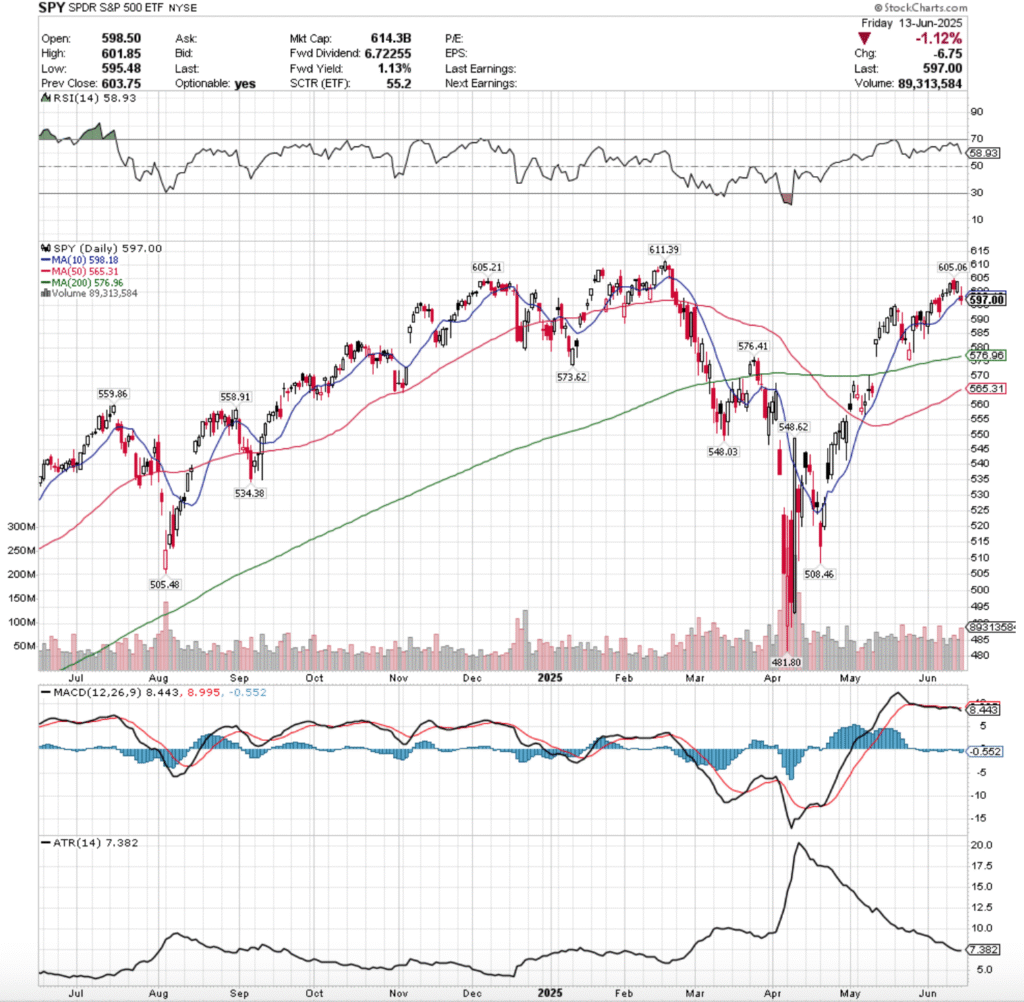
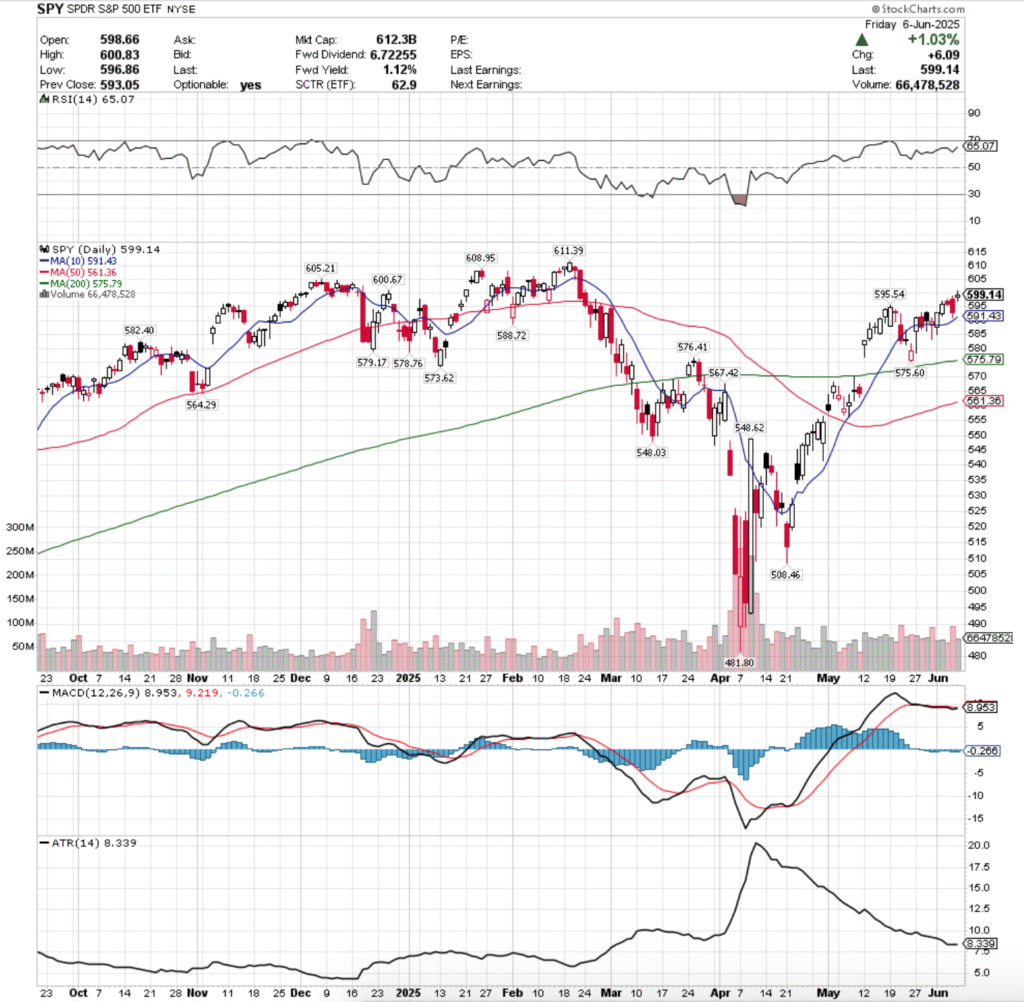
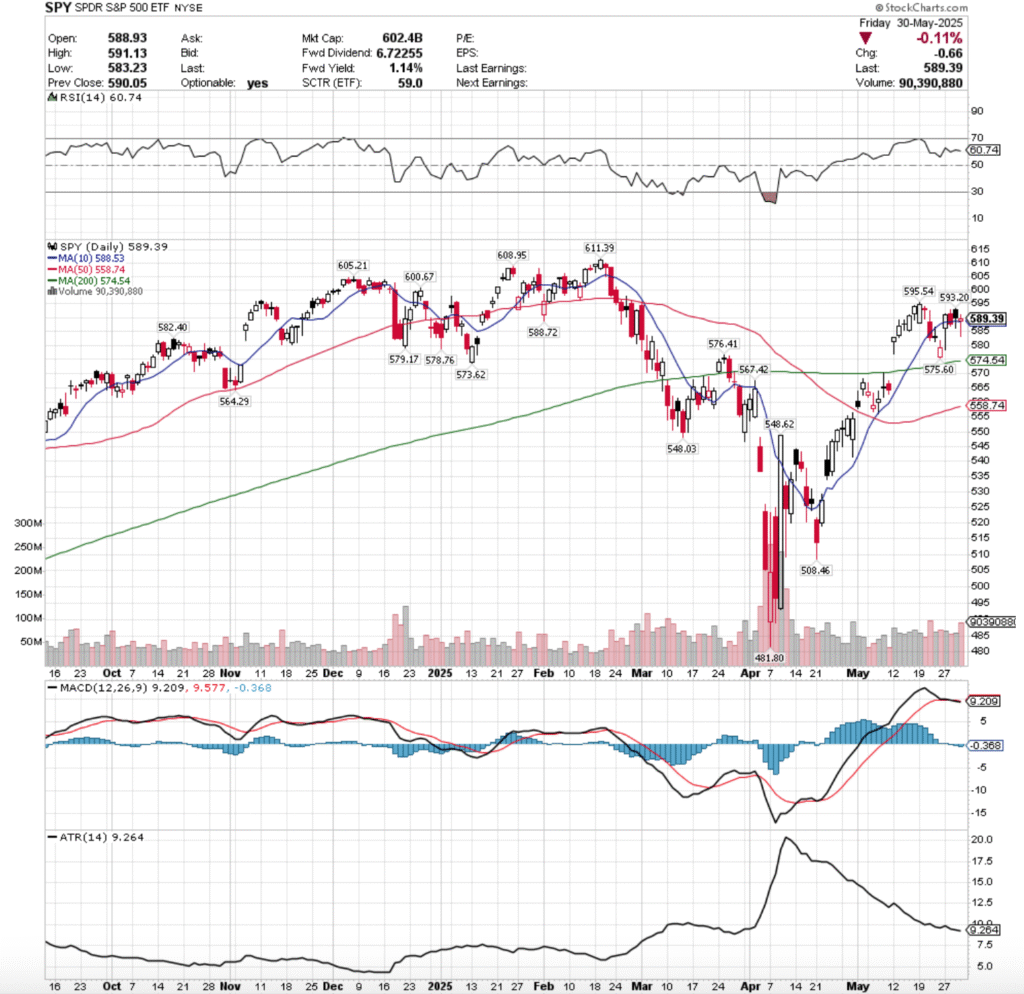
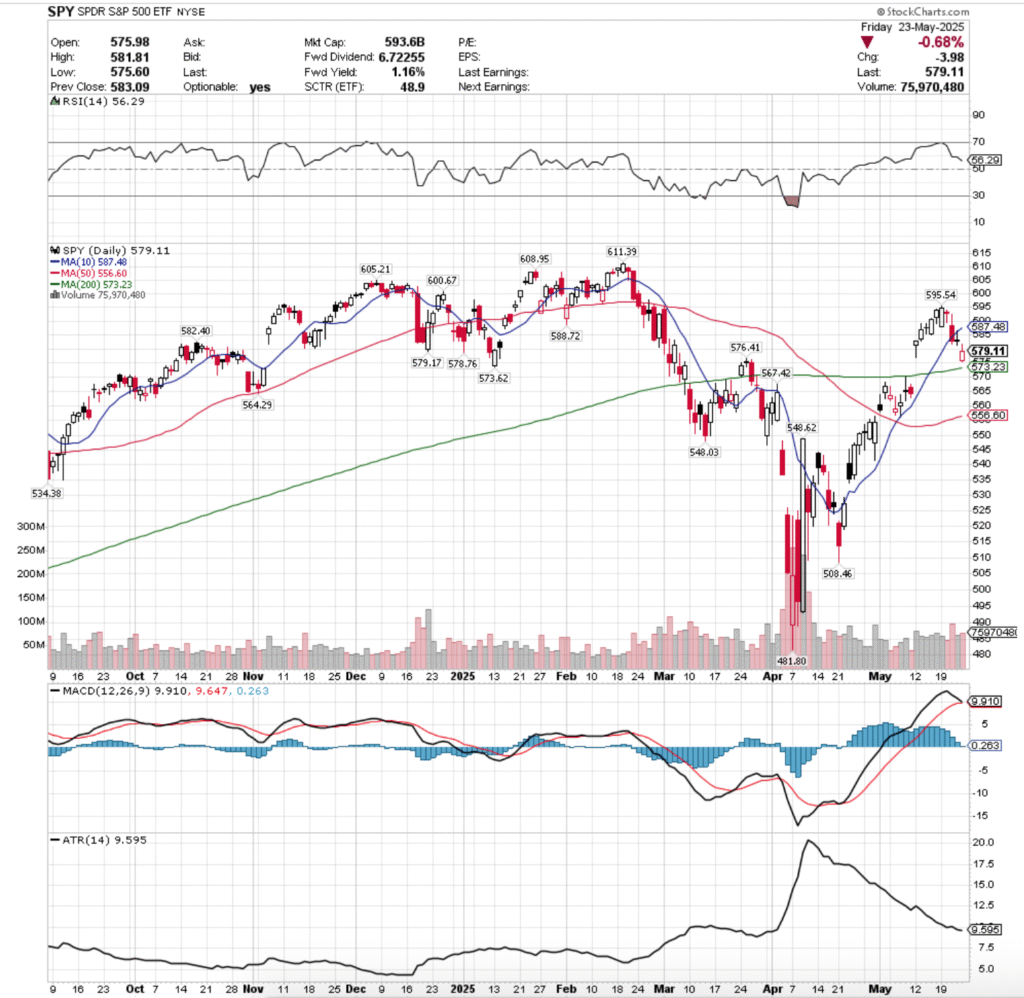
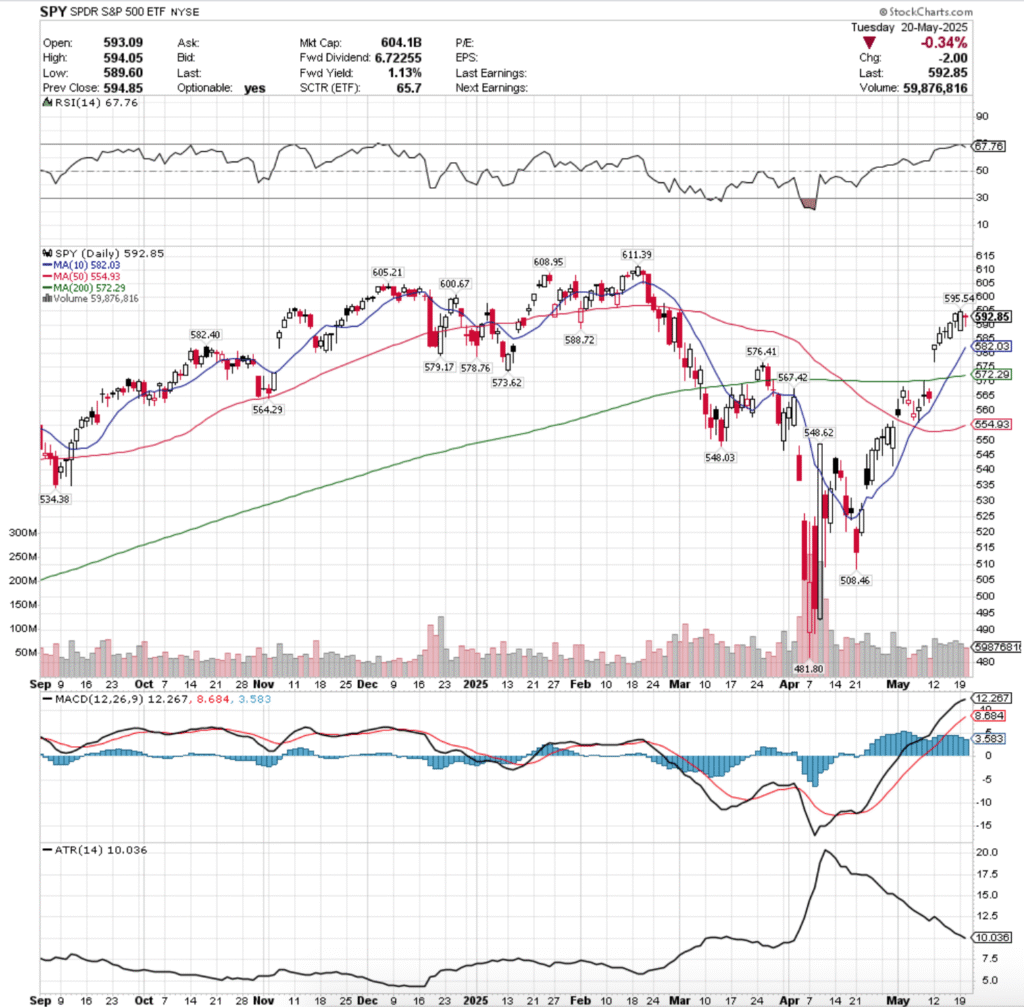
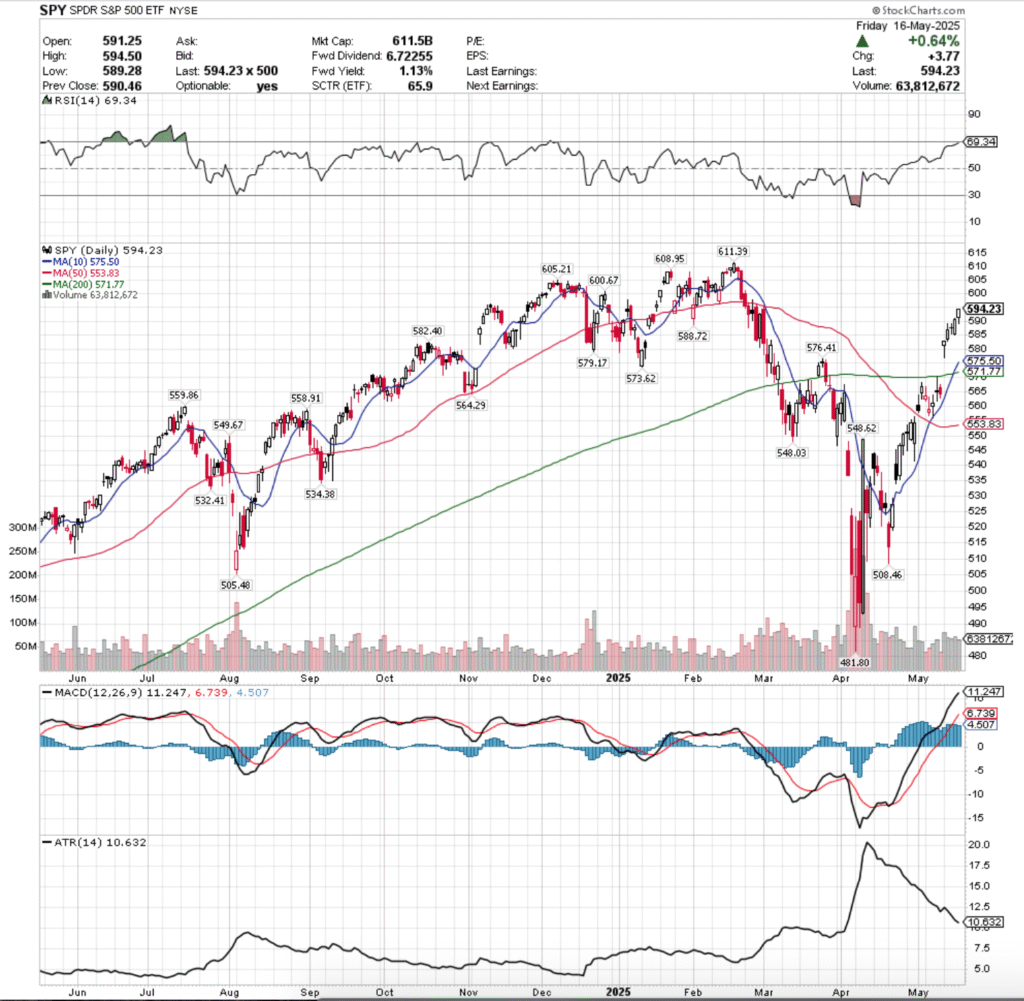
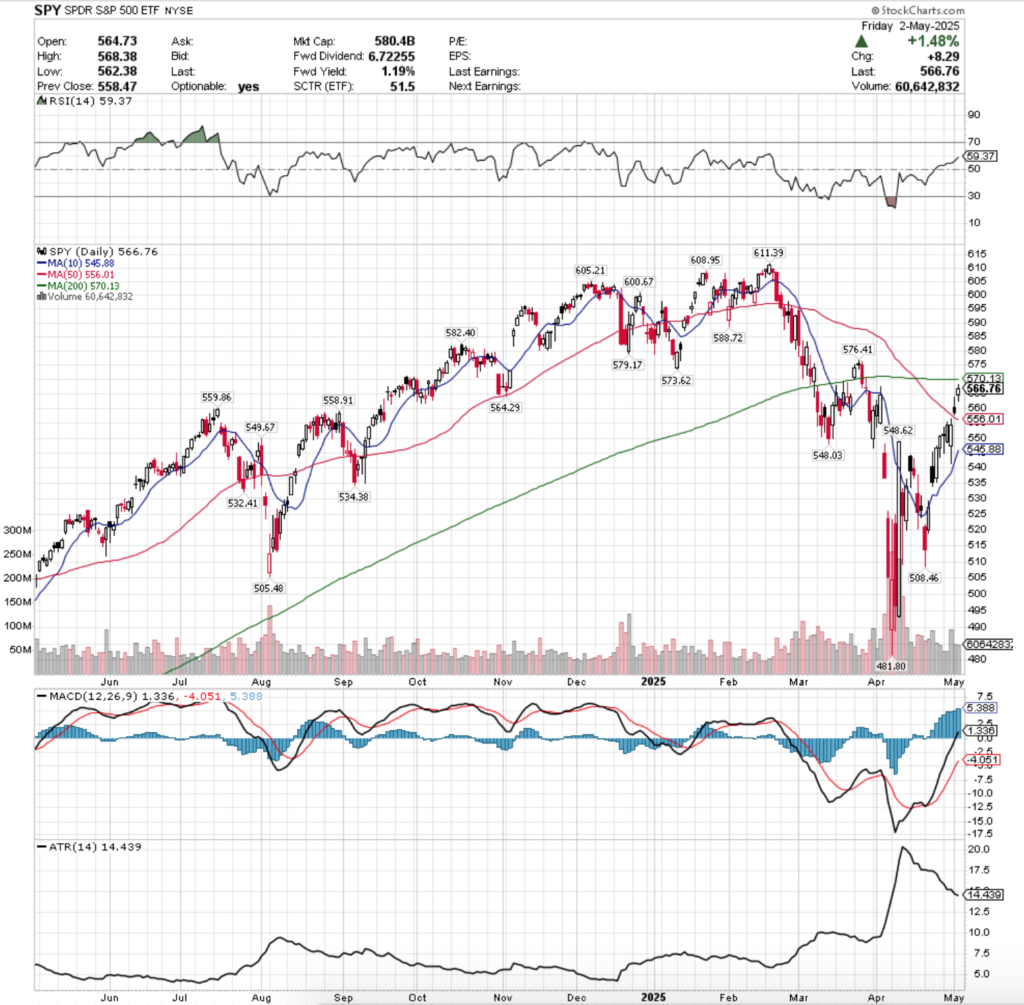
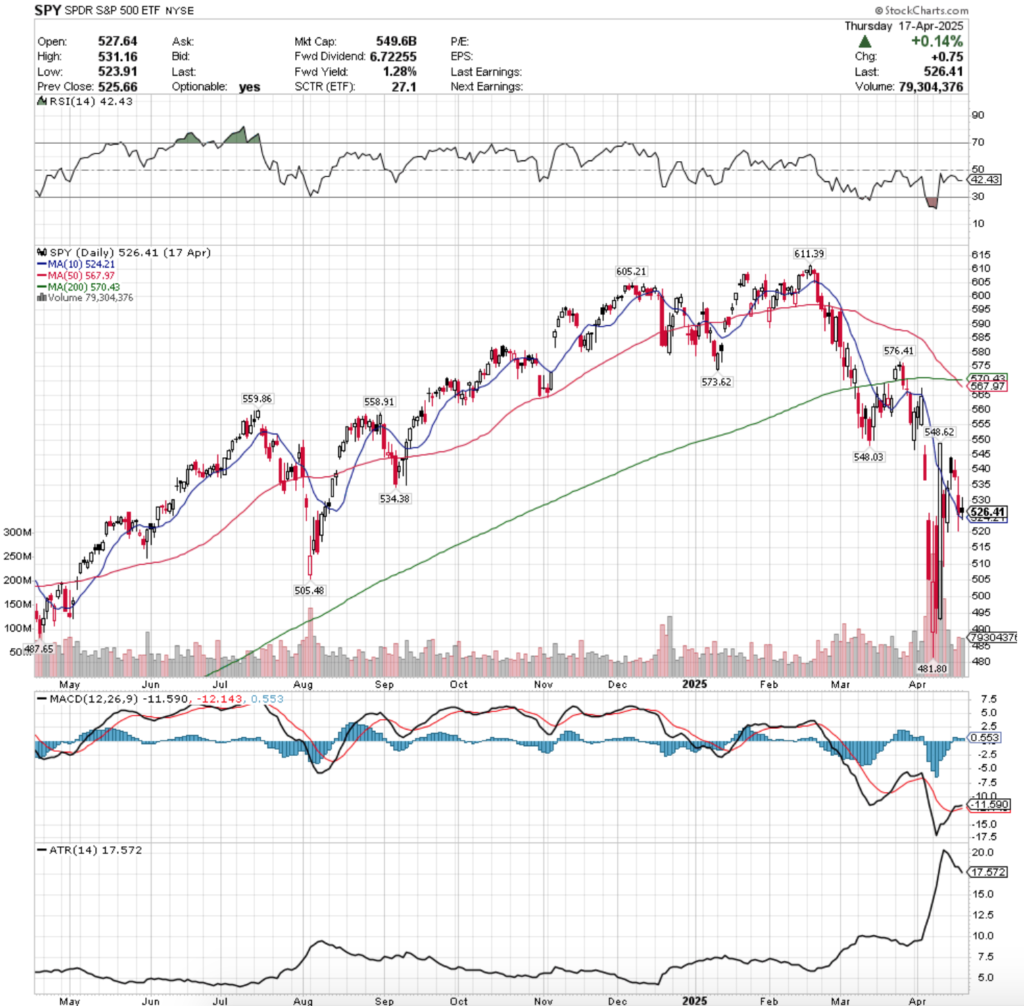
SPY, the SPDR S&P 500 ETF gained +3.47% last week, while the VIX closed at 16.32, indicating an implied one day move of +/-1.03% & an implied one month move of +/-4.72%.
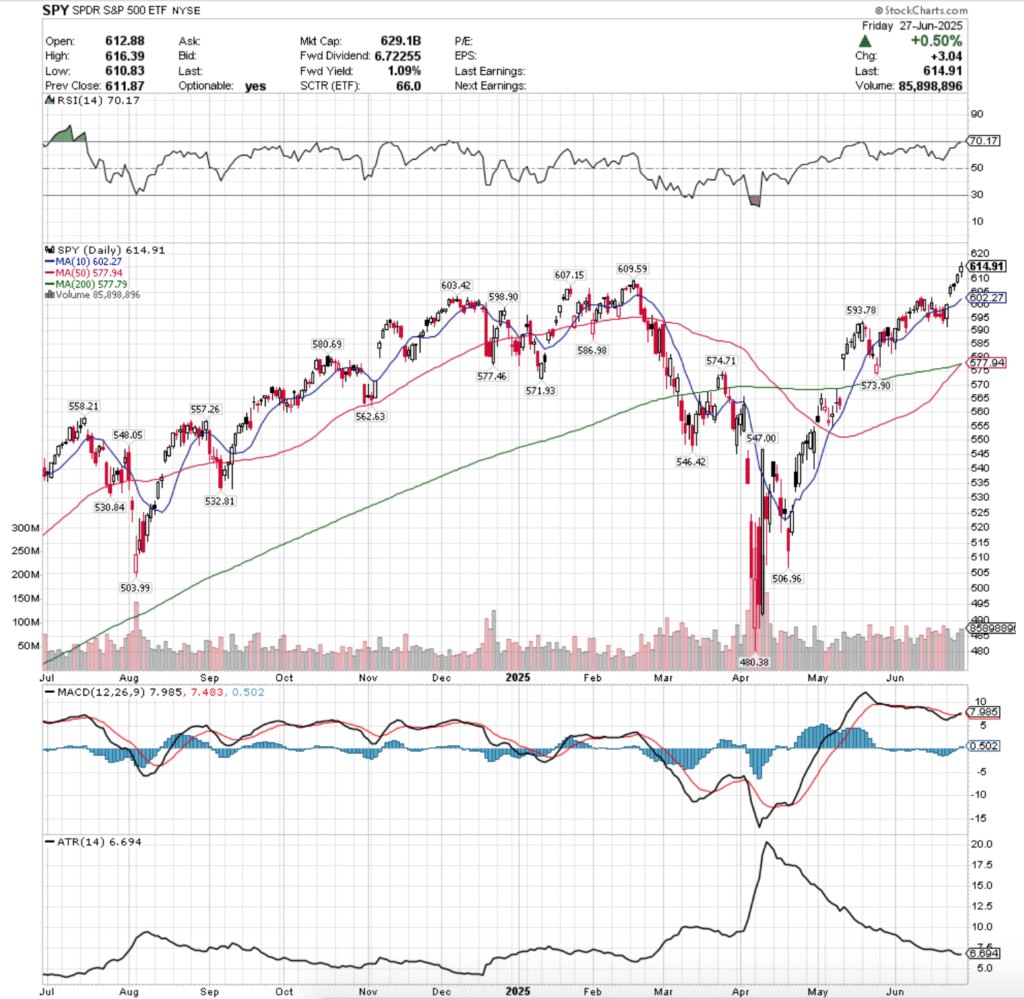
Their RSI is in overbought territory at 70.17, while their MACD crossed over bullishly on Friday, but its histogram looks muted & like this will become overstretched within the coming week.
Volumes were +28.38% higher than the prior year’s average (75,486,000 vs. 58,800,317.5), which paints an interesting picture given their distribution & the gappiness of the week.
Monday kicked the week off on what appeared to be a strong session, where the week’s highest volume fueled a high open that retreated as low as $591.89, before roaring higher to break out & close above the resistance of the 10 day moving average.
Tuesday is where things began to get fishy, as the session opened on a ~1% gap up, tested below the $605/share level briefly, before climbing higher on the second lowest volume of the week.
Warning signs began flashing on Wednesday, when the week’s lowest volume session produced another gap up open, but went on to decline & closed below the opening price, but for a day-over-day gain.
The candle also had the shape of a hanging man, indicating bearish sentiment creeping in as SPY’s all-time high was closed in on.
Thursday also opened on a gap up, but this time the day continued higher to close as an advancing session.
Friday too was interesting, as the golden cross of the 50 & 200 day moving averages occurred & SPY’s MACD broke bullishly above the signal line on the highest volume of the week, a new all-time high was set & you guessed it, it all occurred on a gap up open.
However, uncertainty began to creep into the market, as the session closed as a spinning top candle, indicating that there was less exuberance and a bit of prudence entering the picture.
This sets the stage for an interesting upcoming week, as any moves higher set a new all-time high & there is limited economic data & earnings reports on this four day holiday week.
While there certainly was more volume than the previous year’s average levels, it mostly occurred on the bookends of the week & the jumpy nature of the gains attributed to gap up opens does not paint the picture of a sturdy market.
In the event of more advances on SPY’s horizon the volume patterns will be essential to keep a pulse on & understand.
The consolidation case becomes a bit dicey at these levels, and will also require attention to intraday volume, as last week’s gaps will all need to be filled & this will inspire profit taking from folks who otherwise may not have been willing to sell so quickly.
This makes the consolidation case potential kindling for declines even moreso than usual.
Should there be signs of some weakness in manufacturing, construction or employment data or in the case of profit taking or international relations flare ups then the downside case becomes rather interesting.
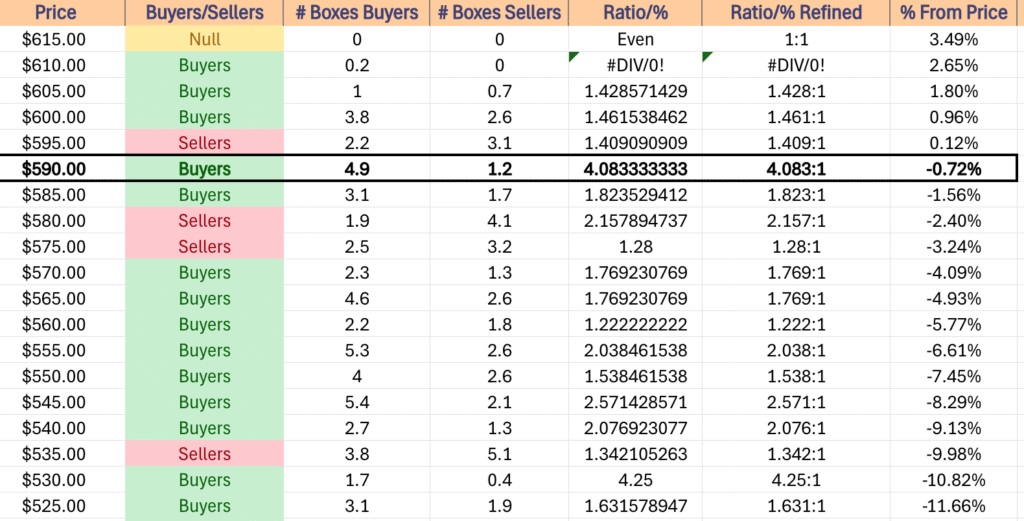
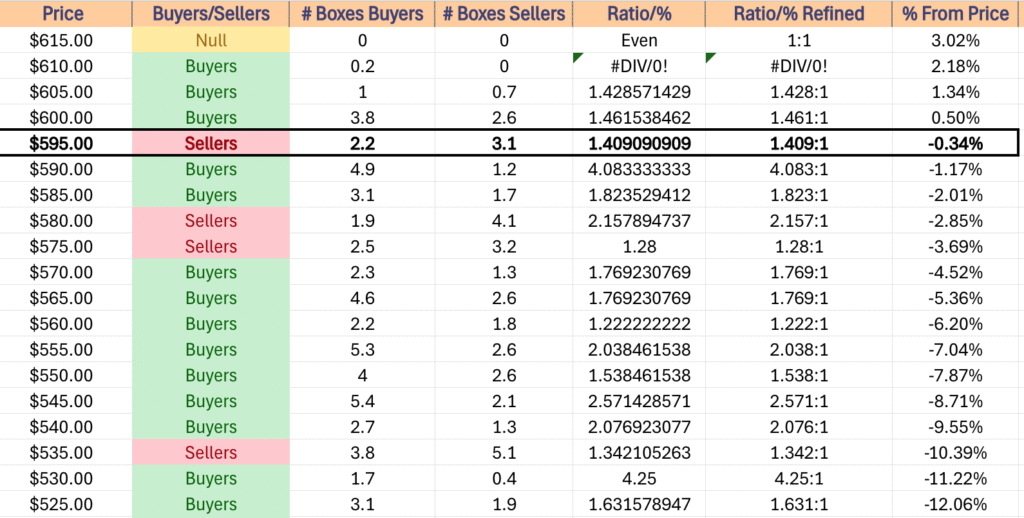
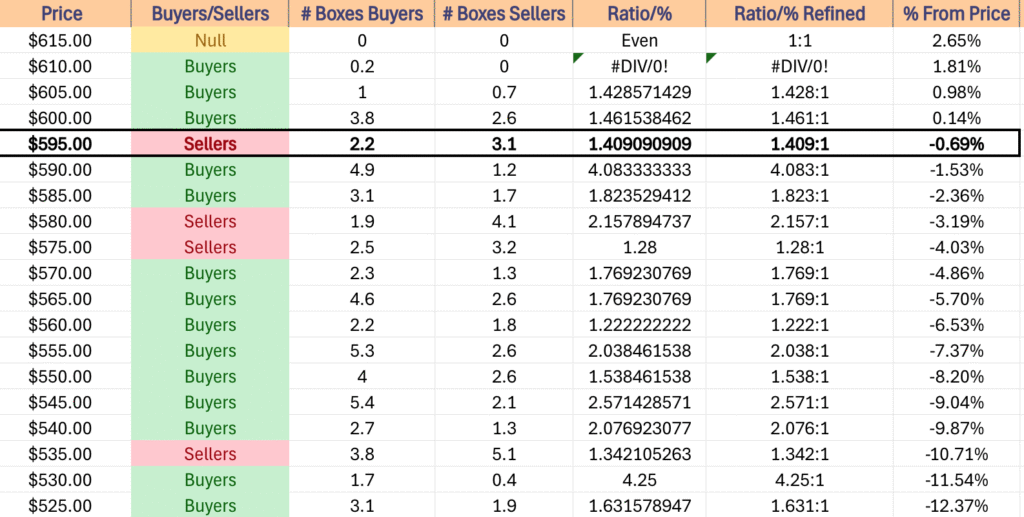
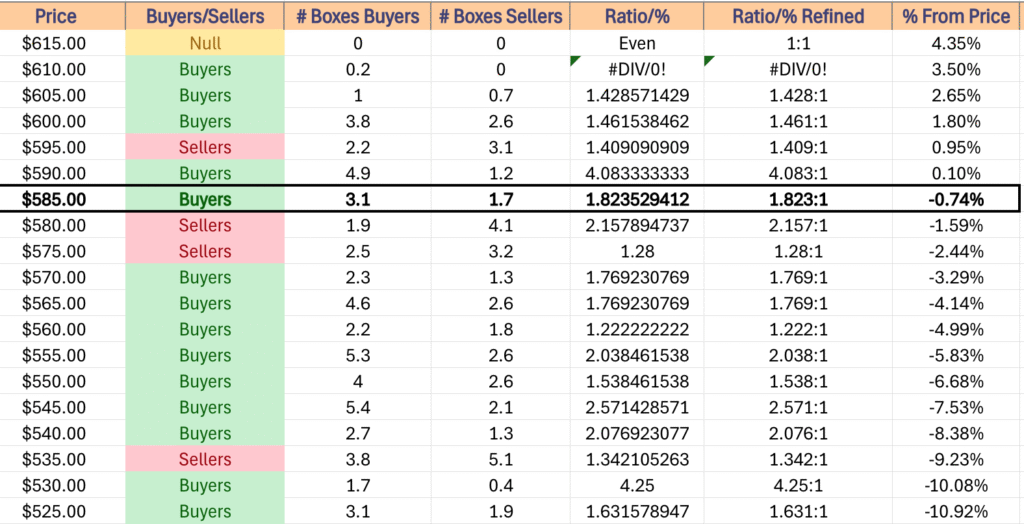
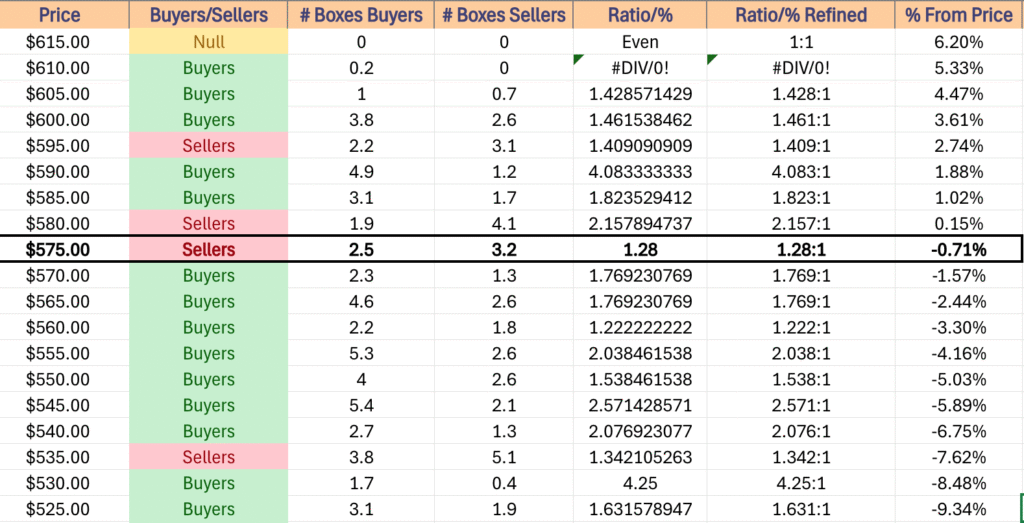
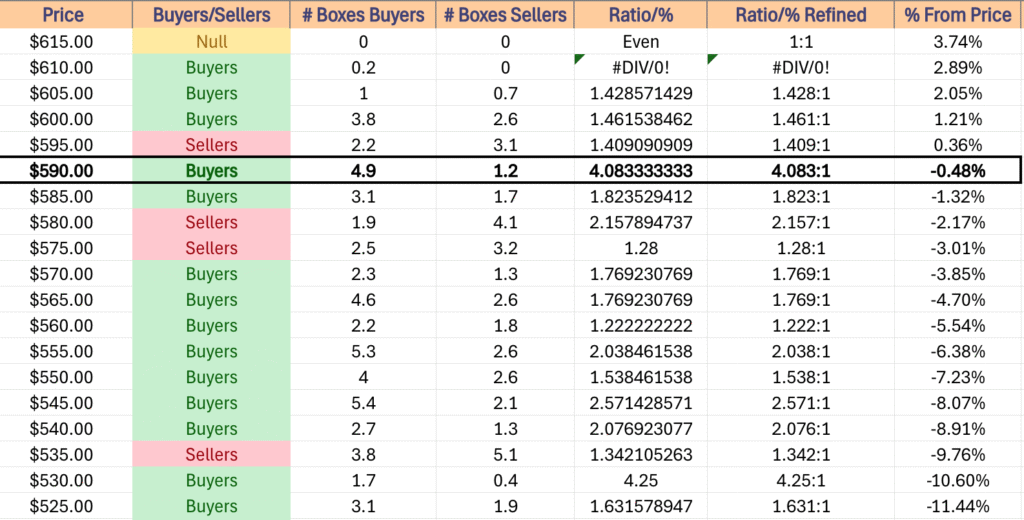
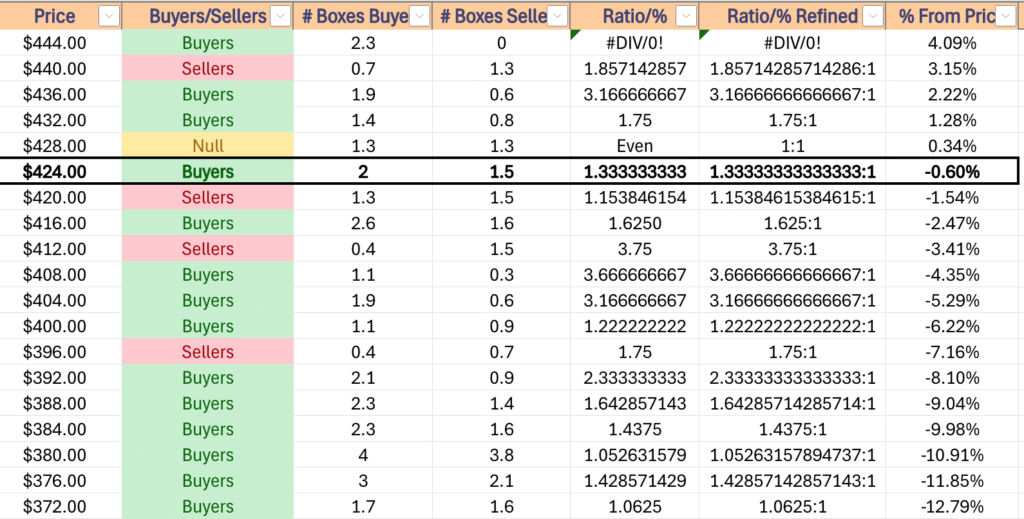
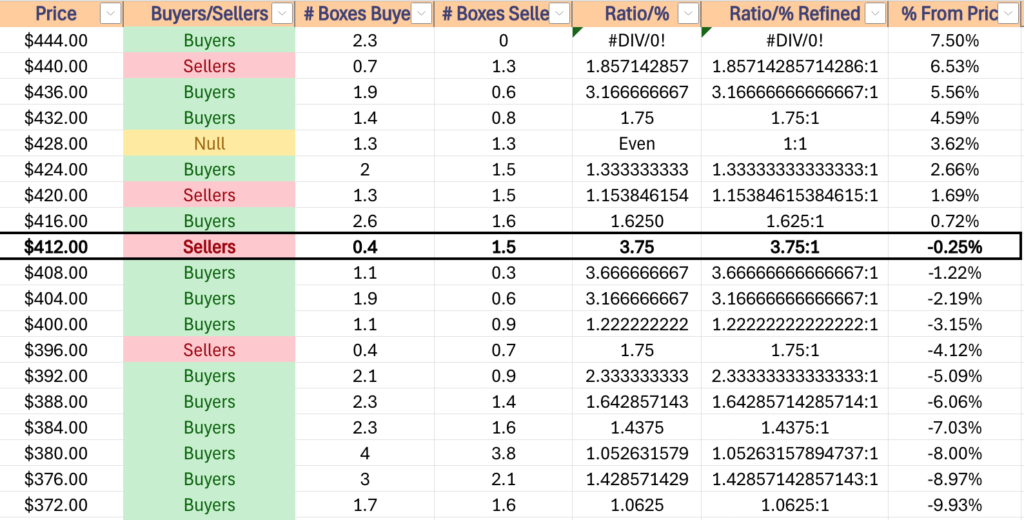
This is particularly true because all of the support levels beneath SPY’s closing price on Friday are at former all-time highs, which means that they have a Buyer oriented skew on their volume sentiment.
With this in mind, to the downside the 10 day moving average will be an interesting place to keep an eye on to see if it provides support or if it breaks down.
Should it break down SPY enters a Seller dominated price zone, which may see more market participants heading towards the exits, forcing prices lower.
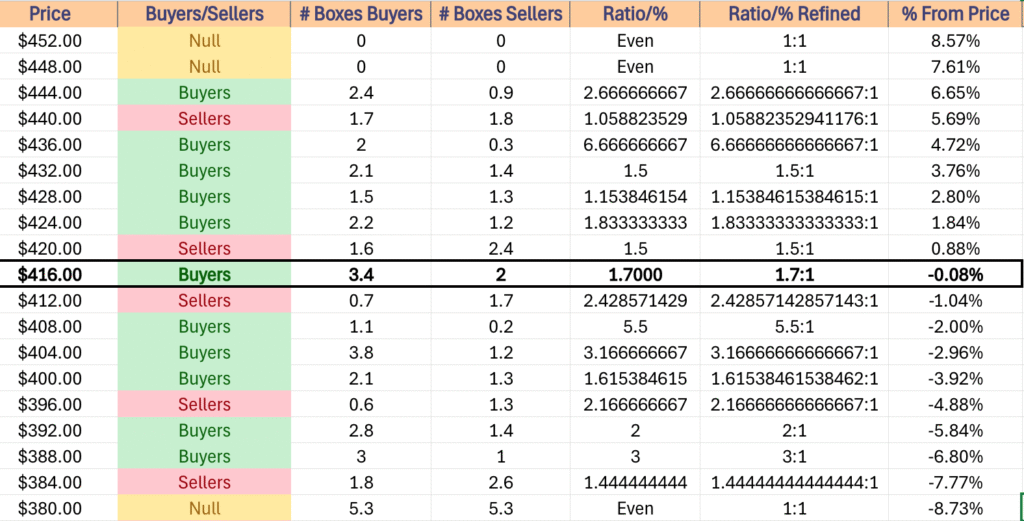
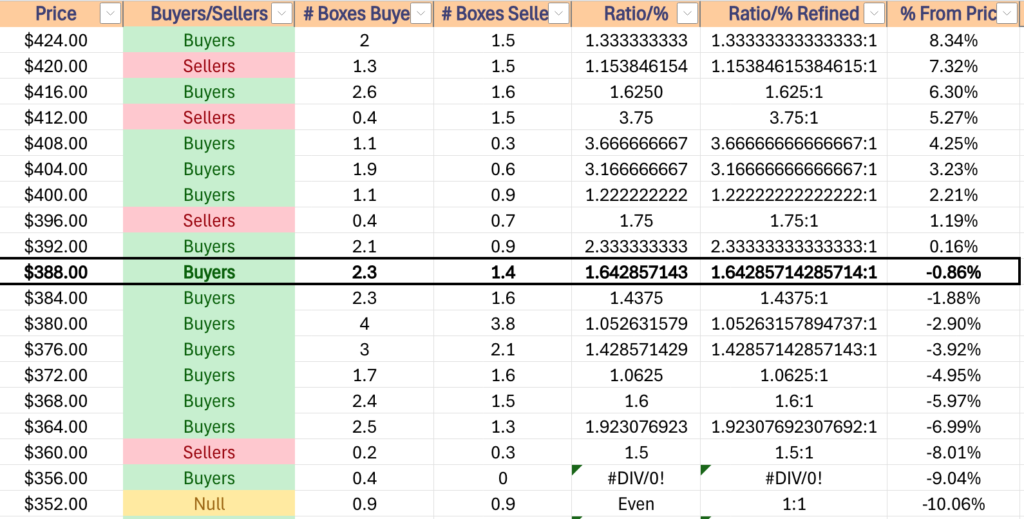
SPY has support at the $609.59 (Volume Sentiment: Buyers, 1.43:1), $607.15 (Volume Sentiment: Buyers, 1.43:1), $603.42 (Volume Sentiment: Buyers, 1.46:1) & $602.27/share (10 Day Moving Average, Volume Sentiment: Buyers, 1.46:1) price levels, with resistance at the $616.39/share (All-Time High, Volume Sentiment: NULL, 0:0*) price levels.
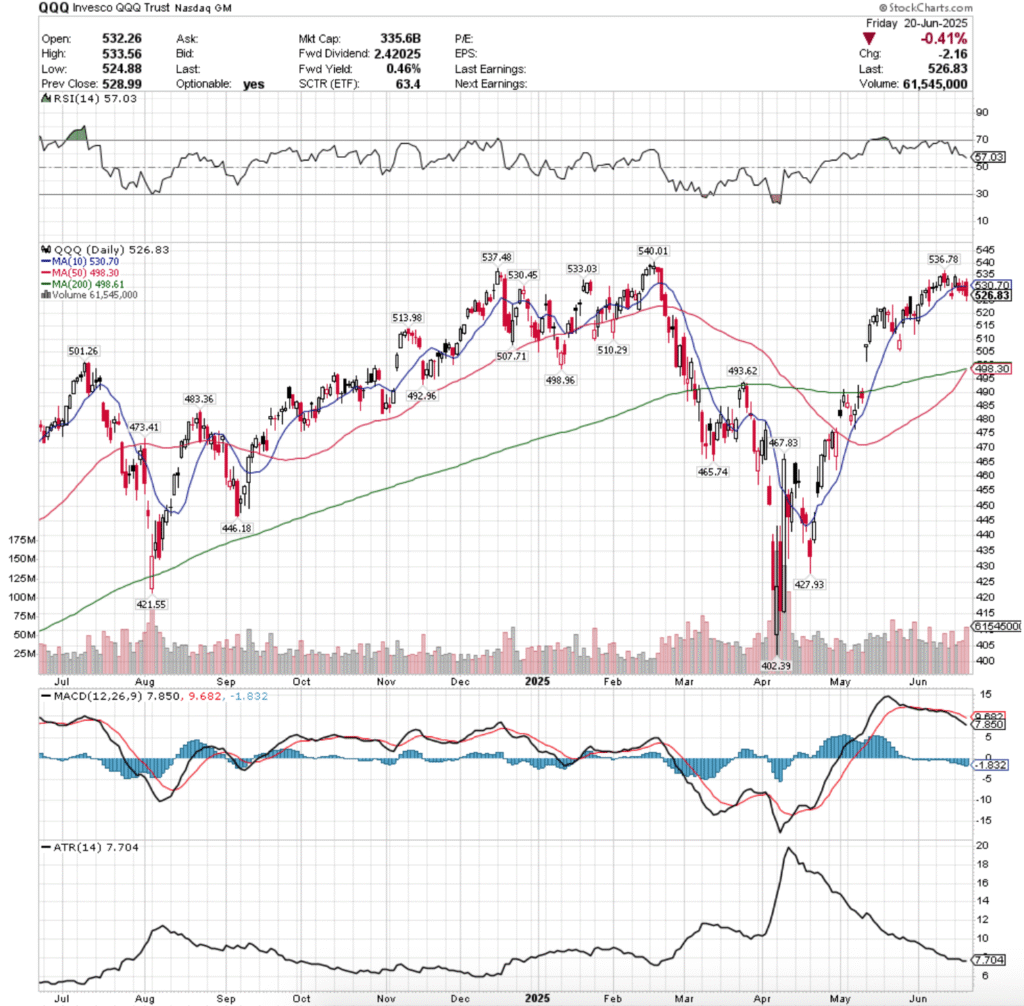
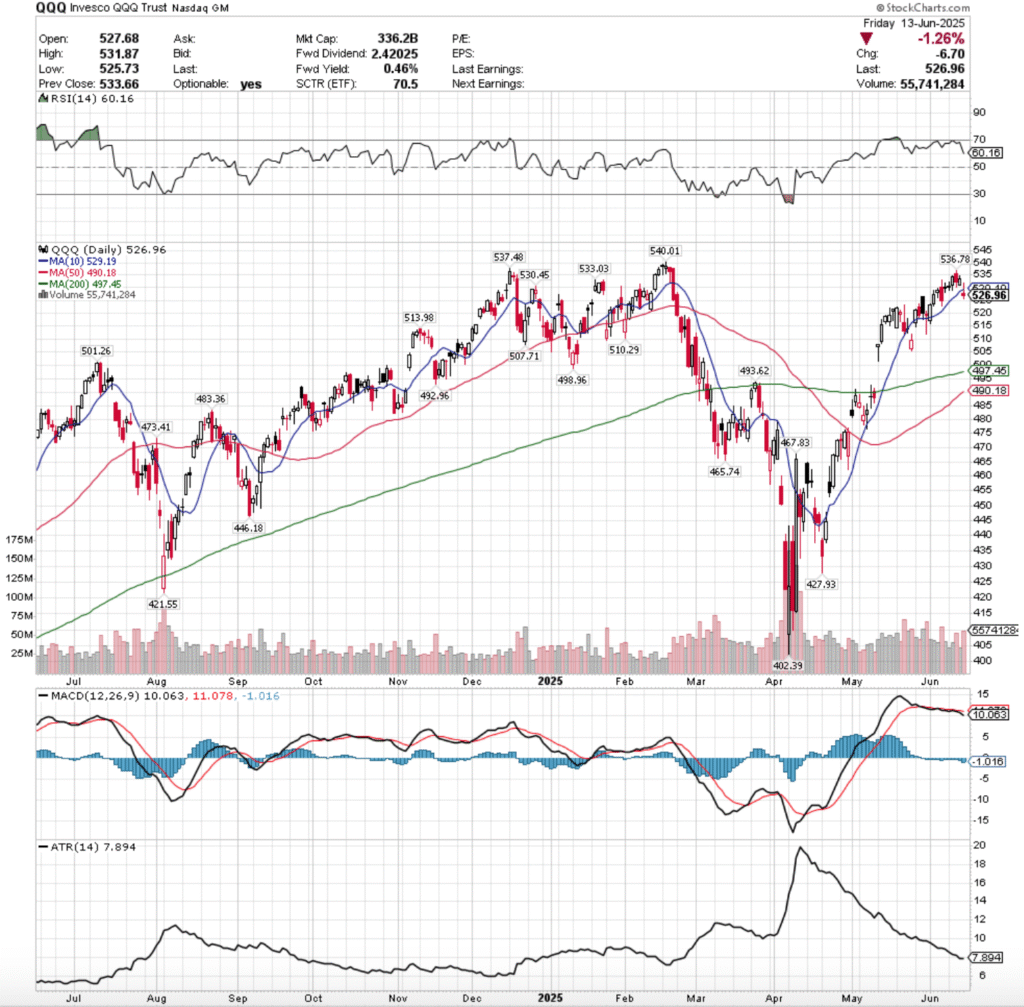
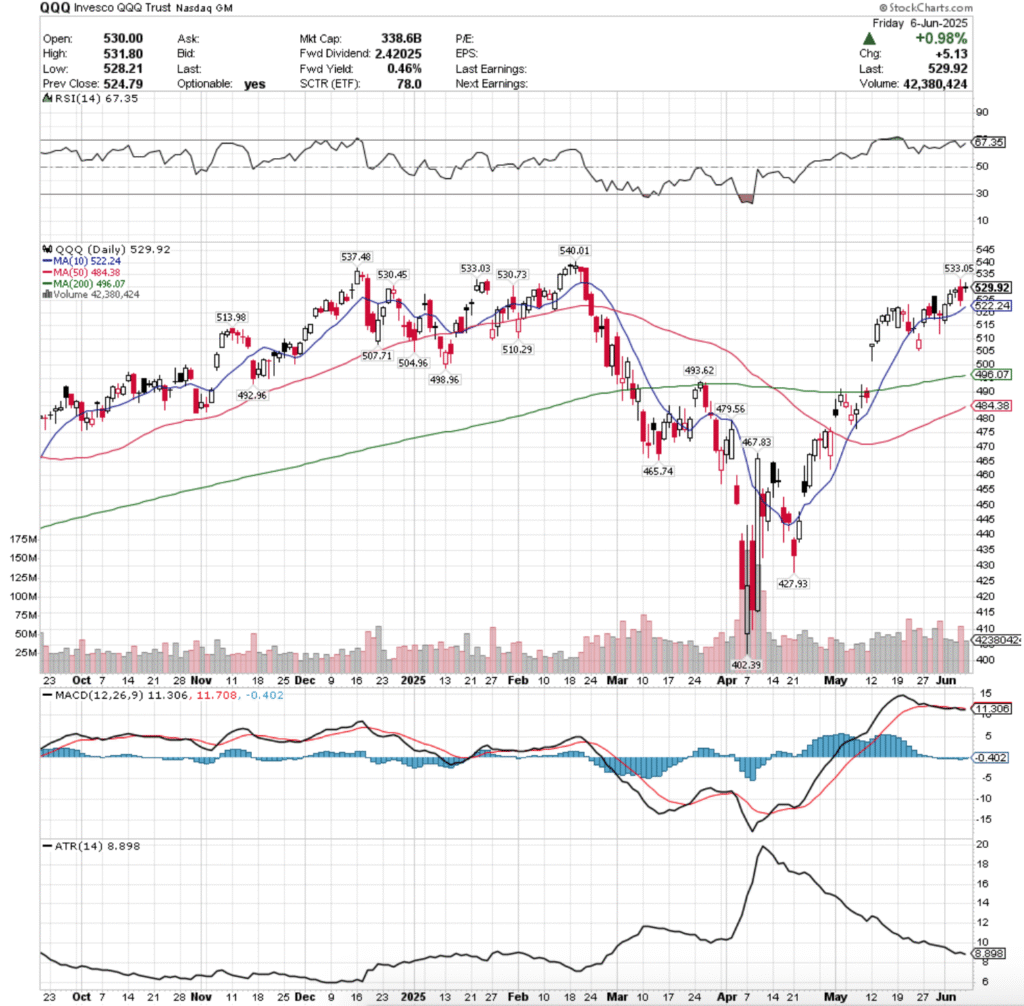
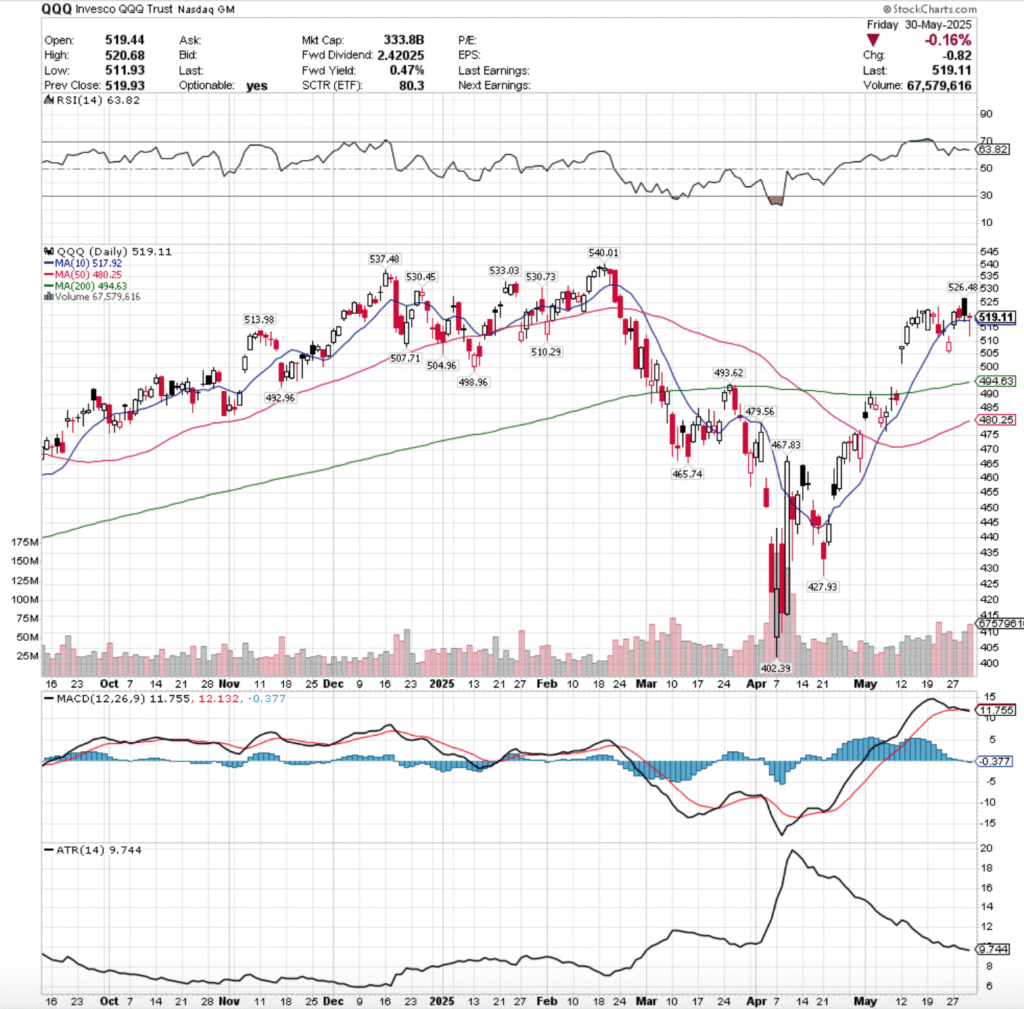
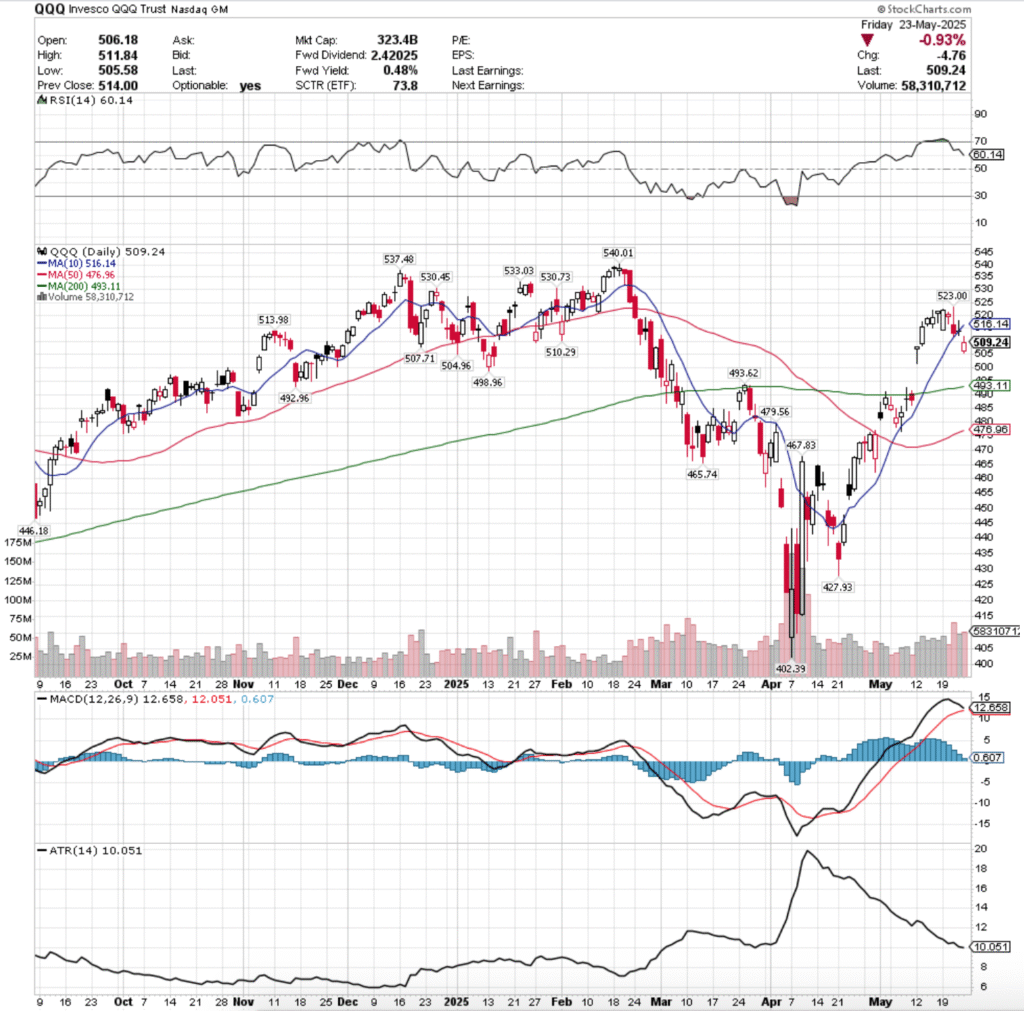
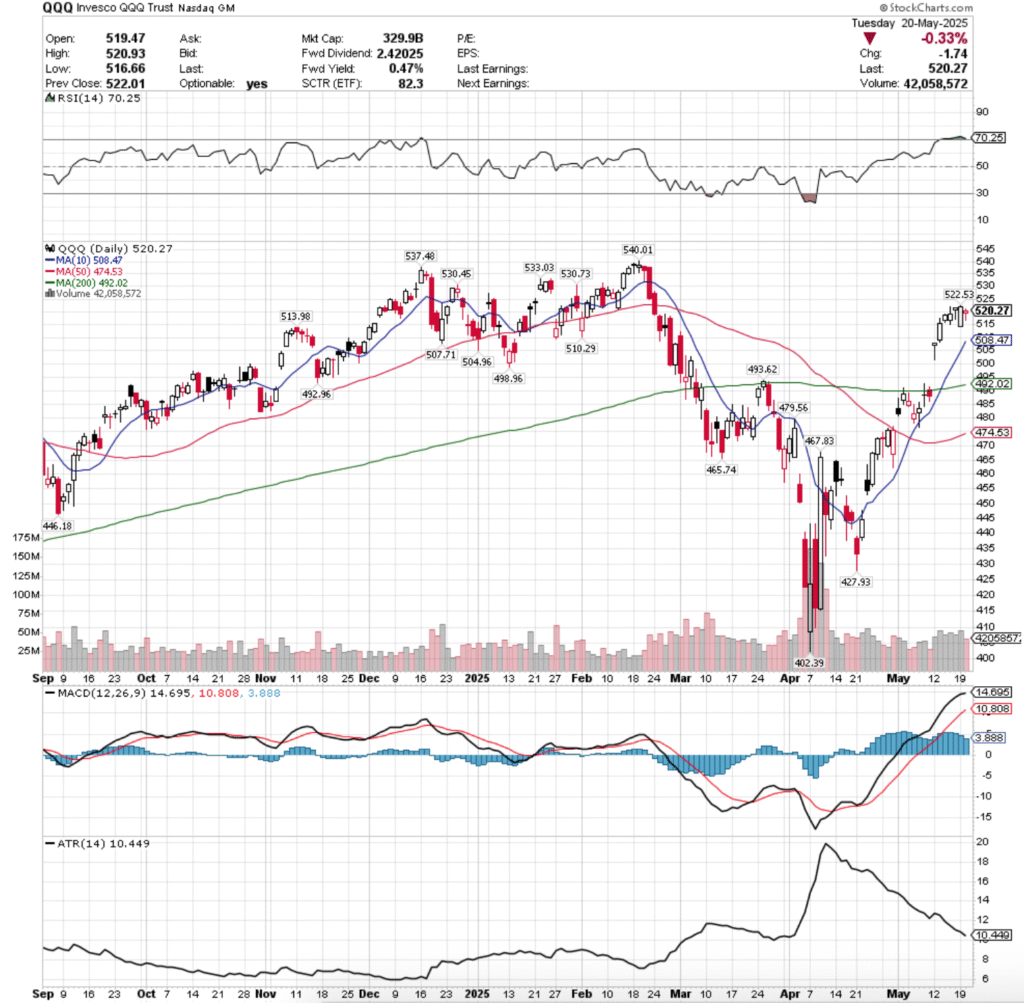
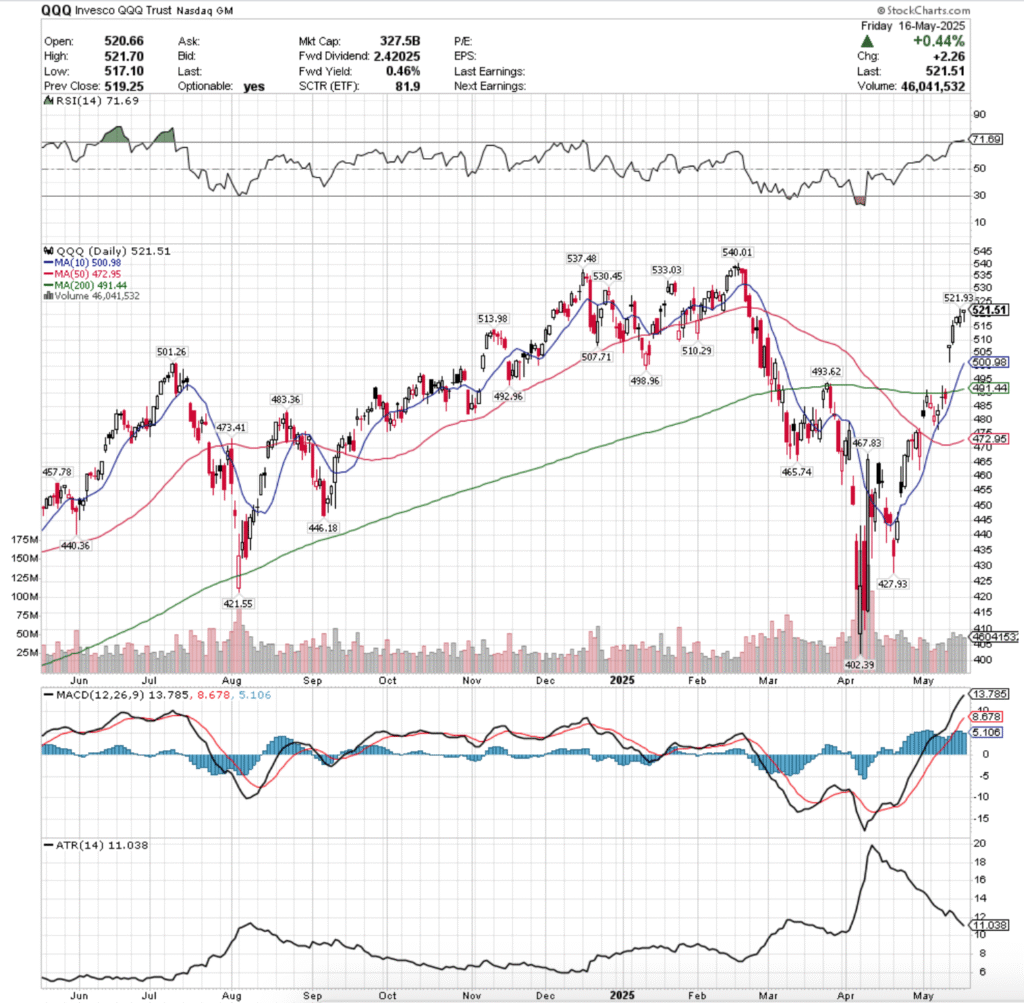
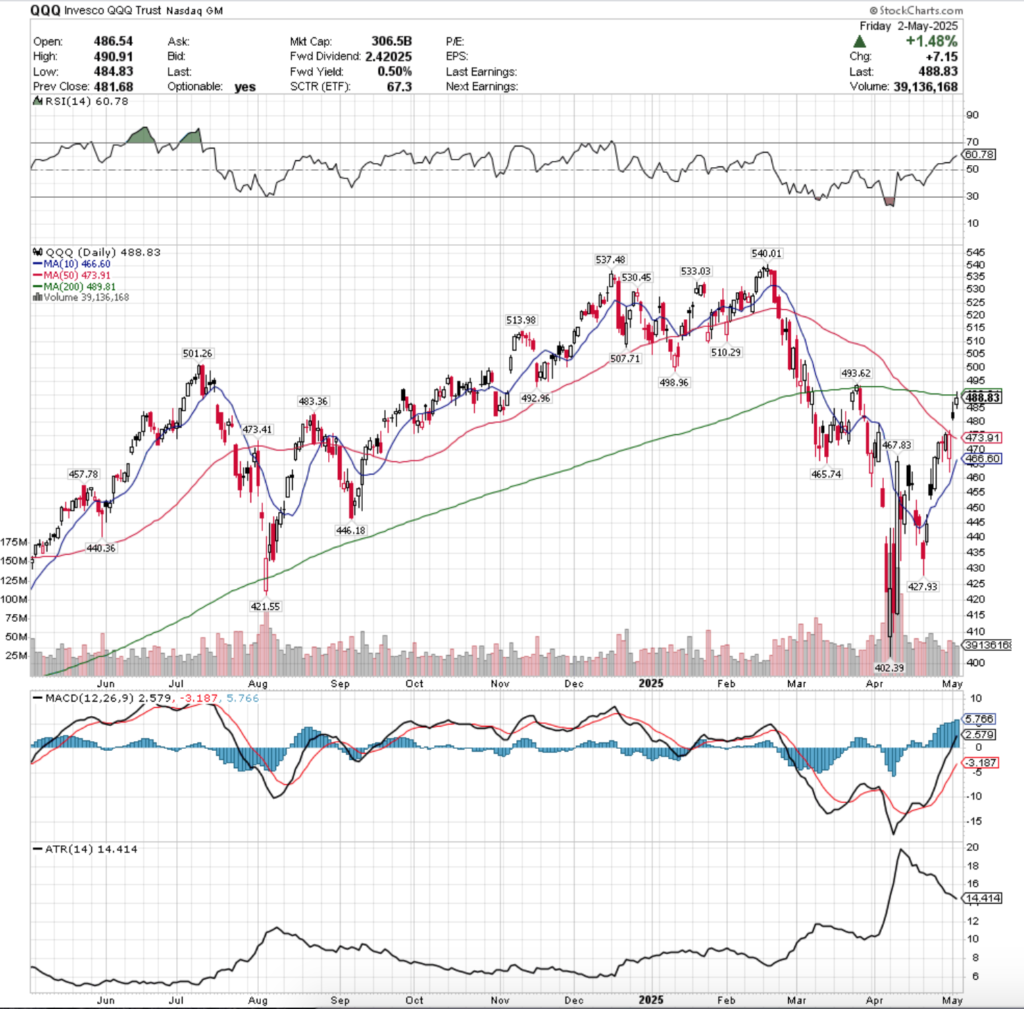
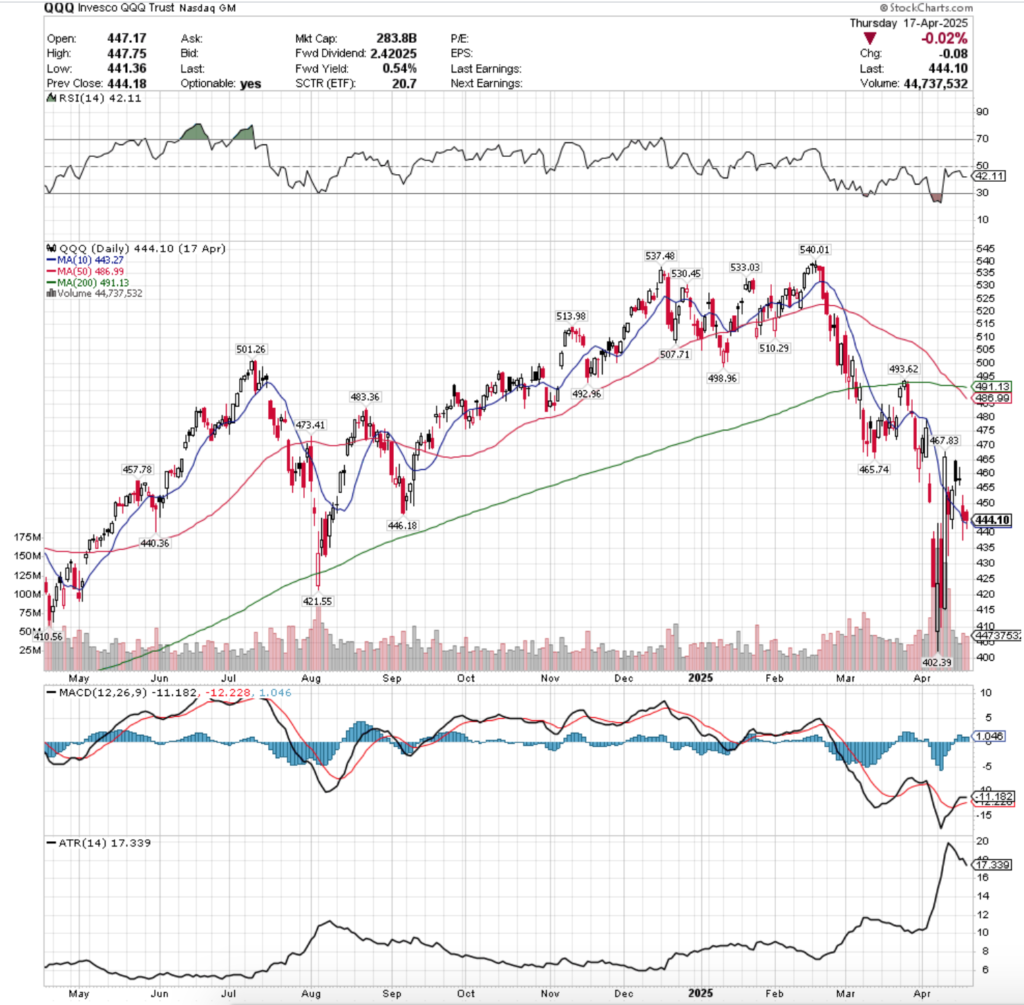
QQQ, the Invesco QQQ Trust ETF advanced +4.04%, as the tech-heavy index was the favorite resort of market participants for the week.
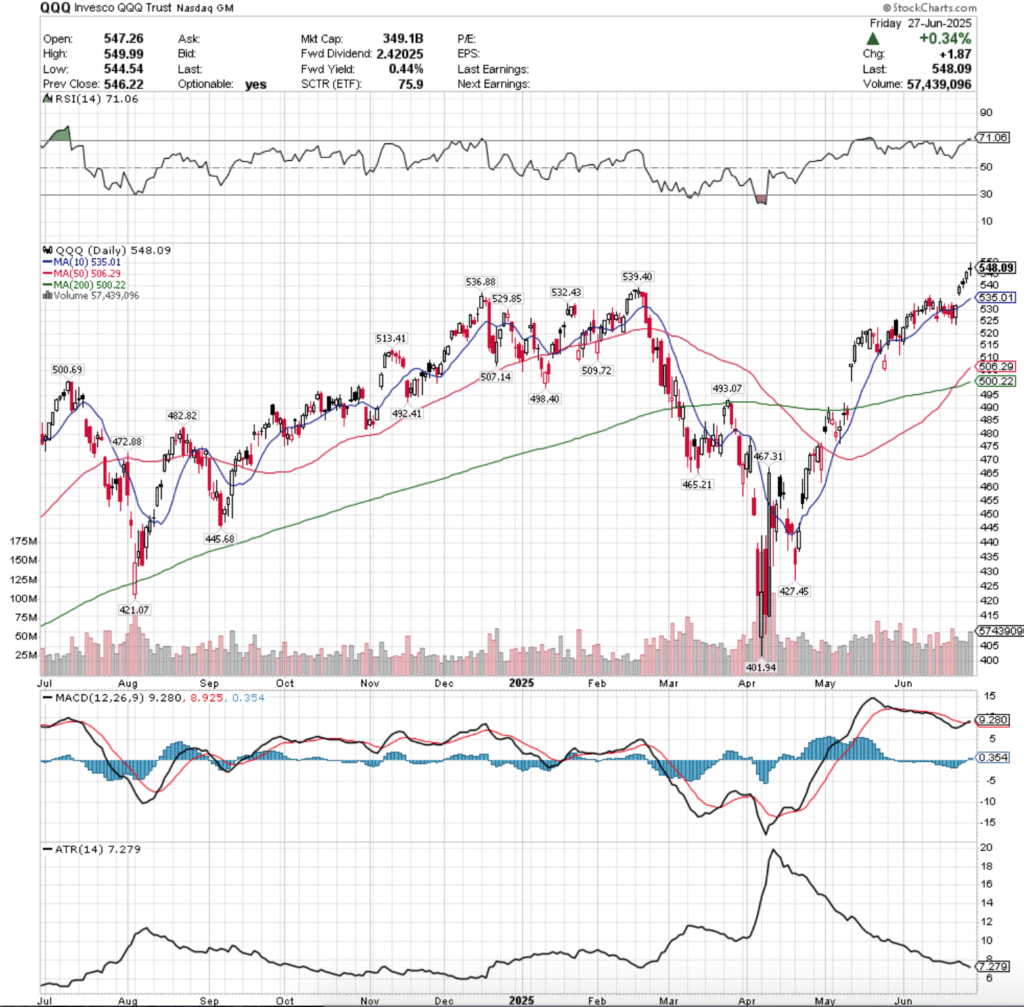
Their RSI is in overbought territory at 71.06, while their MACD crossed over bullishly at the end of the week following a golden cross & many gap up sessions.
Volumes were +22.86% higher than the previous year’s average (47,902,000 vs. 38,990,317.5), which will play an important role moving into the next couple of weeks.
QQQ’s week started off similarly to SPY’s, opening up & testing downward to break below the $525/share level briefly, before roaring back to break out & close above the resistance of the 10 day moving average.
Tuesday opened on a gap up, briefly breaking above the $540/share price level indicating that there was some more upside appetite & setting a new all-time high.
Wednesday too opened on a gap up, and like SPY began to show signs of weakness & caution entering the arena.
While the day did test higher, it also tested much further on its lower than upper shadow & closed below its opening price, signaling that there was some profits taking & perhaps some jitters among market participants, which is peculiar as it occurred on the second lowest volume session of the week.
Thursday featured the week’s lowest volume, but was able to open on another gap up, re-test down to near Wednesday’s close, but ultimately charge higher & closed near the session’s high.
Friday the week closed on an interesting note, as another gap up open yielded the week’s highest volume session for a new all-time high that occured on a high wave doji.
Given the day’s low was $544.55 & the day’s high was $549.91 there was very clearly a feeling of uncertainty & some profits being taken down from the table, setting an interesting scene for the coming couple of weeks.
Like SPY, the upside story for QQQ hinges upon forcing new all-time highs, which will require some type of catalyst, as well as sustained advancing volume to establish a proper uptrend.
They share a similar consolidation case as well, as any consolidation is likely to lead into declines due to the gappy advances of last week.
To the downside, if they fill all of the windows created last week the 10 day moving average becomes the support level of interest as it sits midway between Monday & Tuesday’s window.
If that doesn’t hold up then the potential for a head & shoulders pattern emerges that began in mid-May.
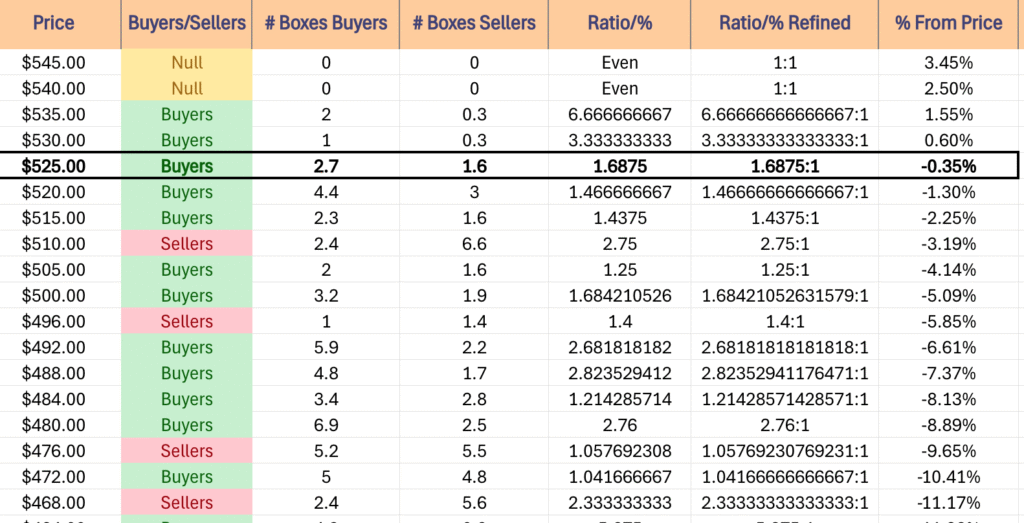
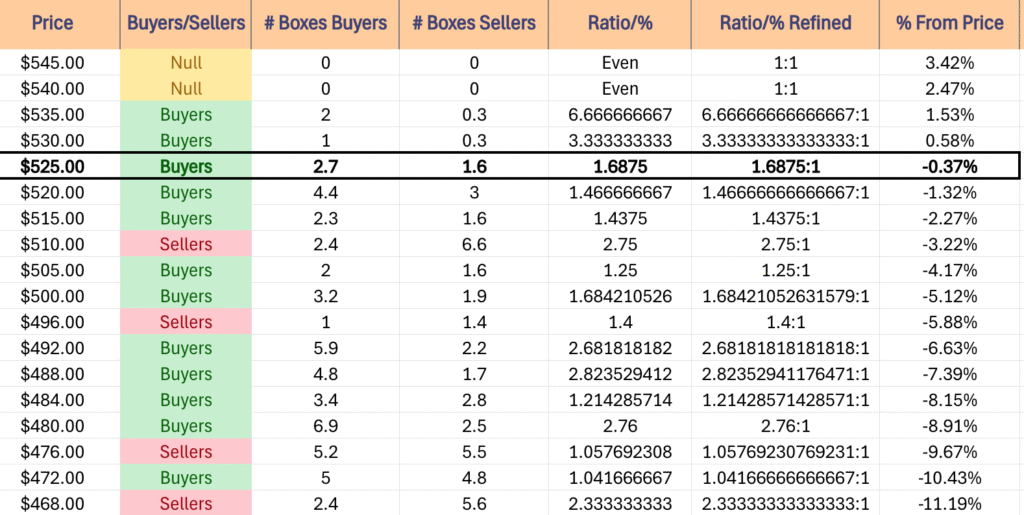
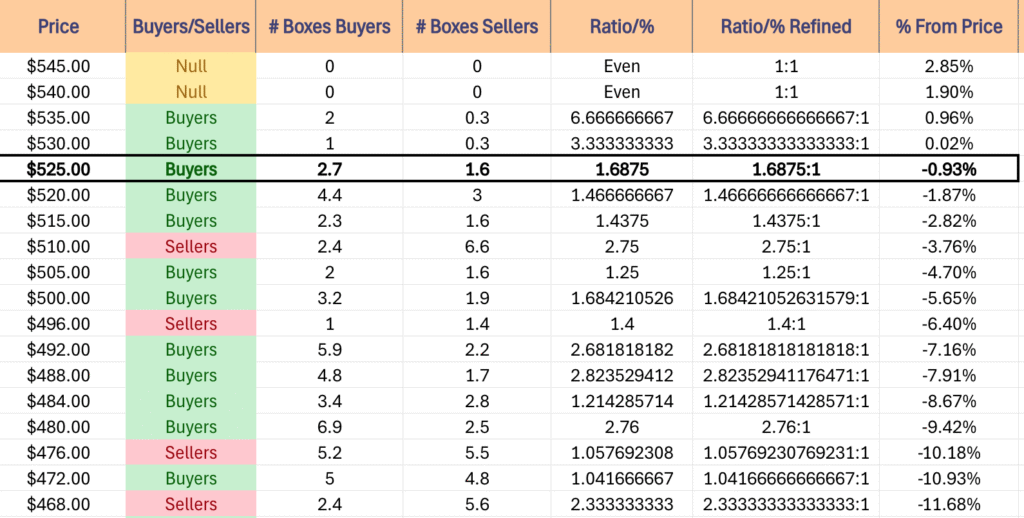
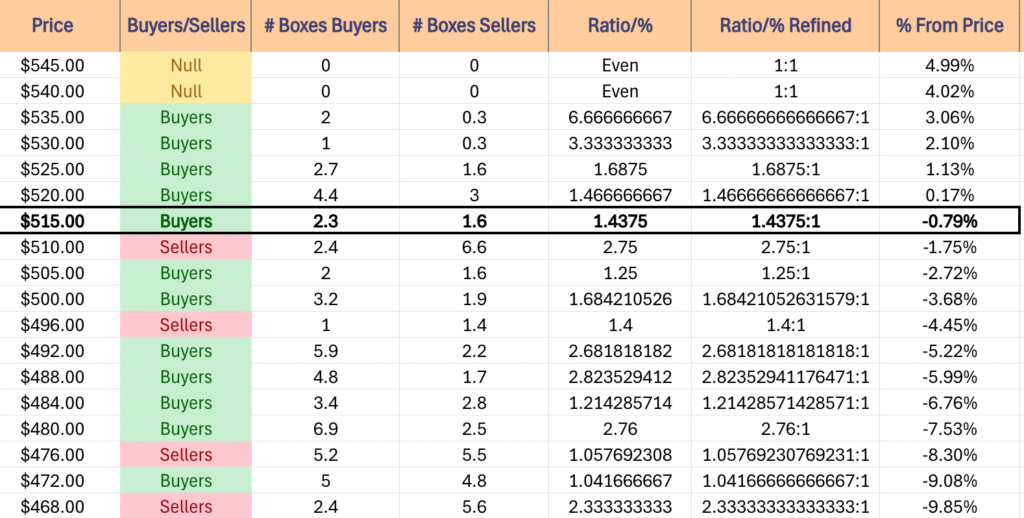
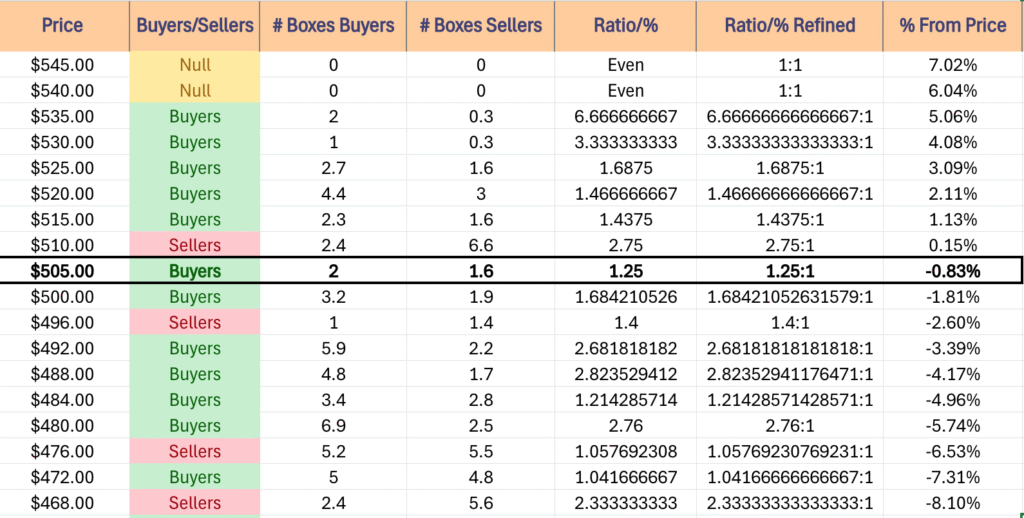
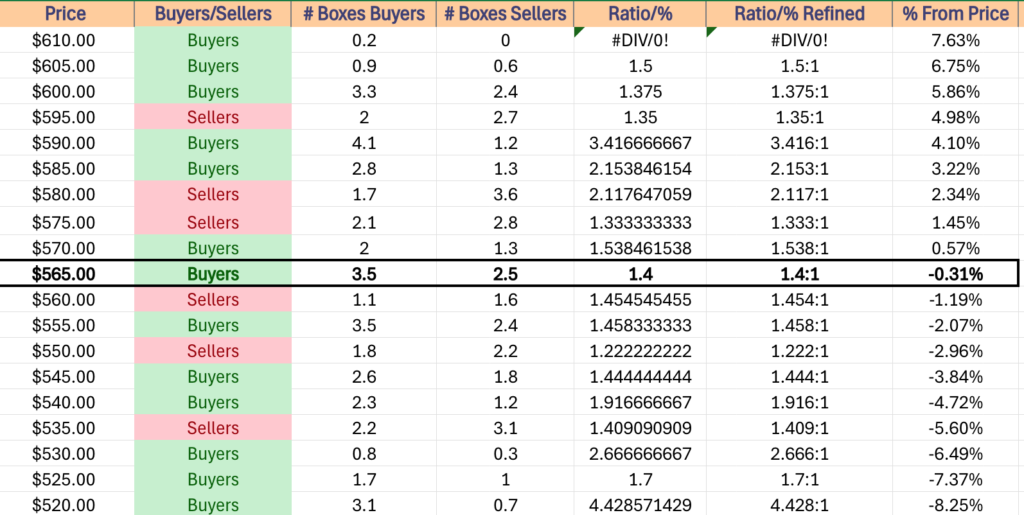
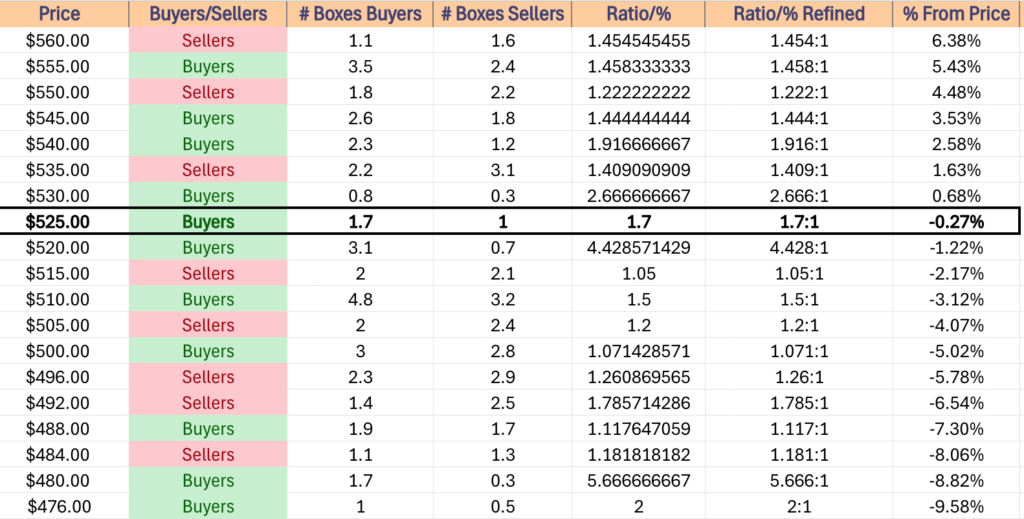
While there are other support levels nearby, they are overly skewed towards Buyer dominated sentiment due to the fact that they were all all-time highs at one point or another in the past 52-weeks, so we don’t have much of a read on selling pressure.
That does offer the potential for their ratios to be diluted in the near-future.
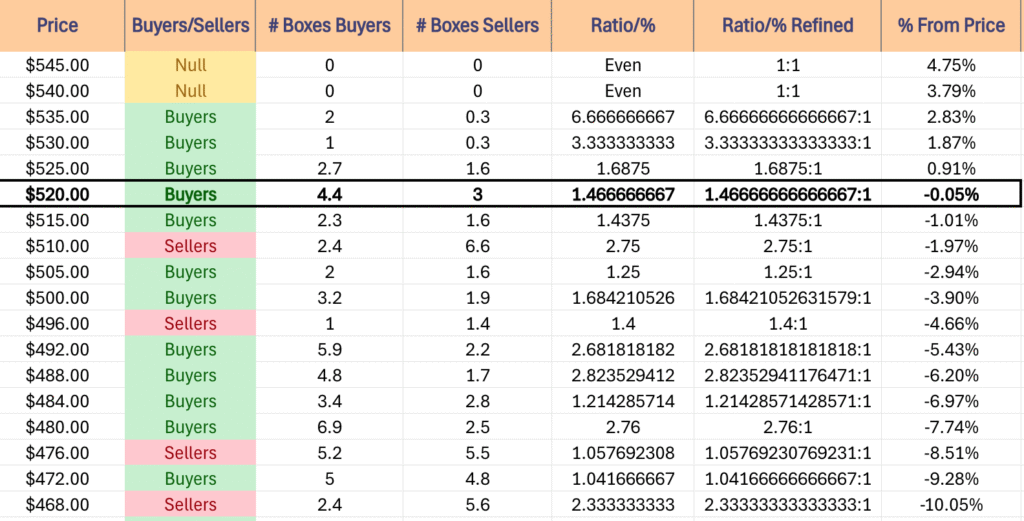
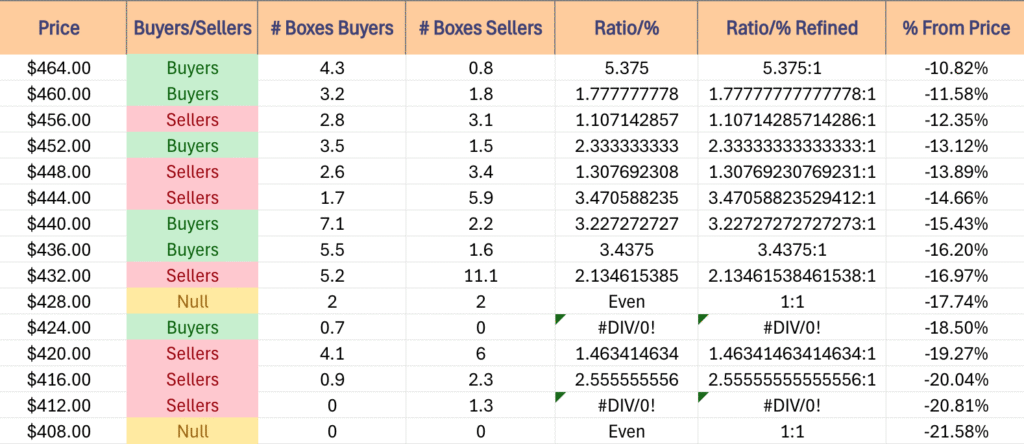
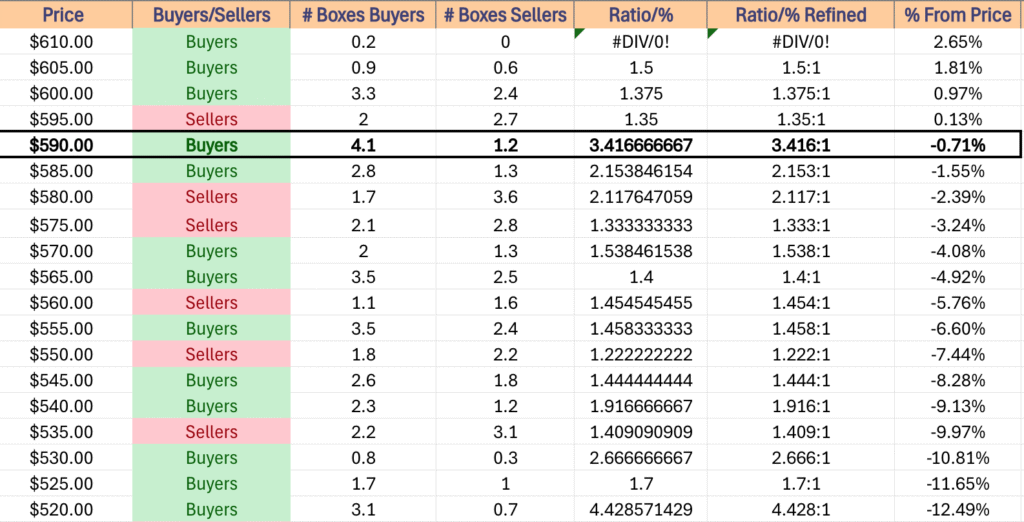
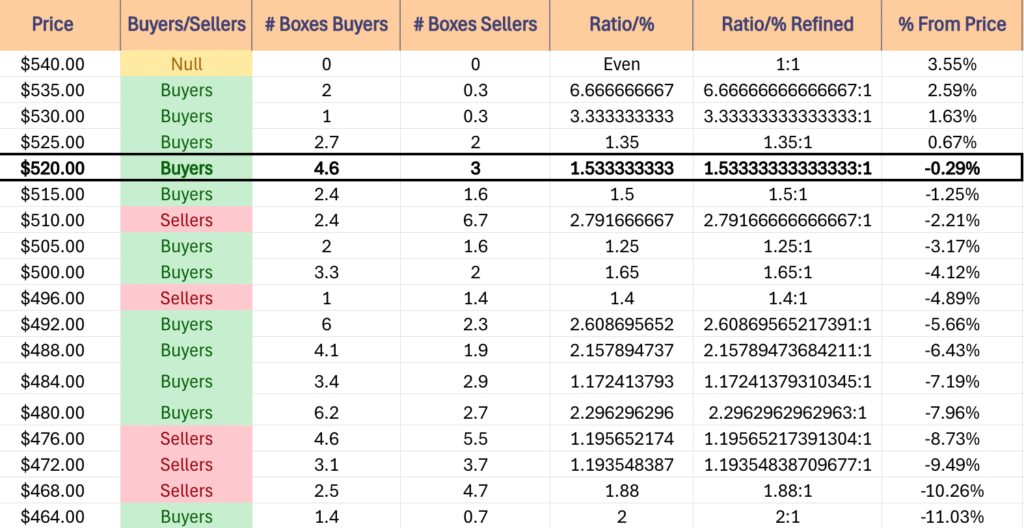
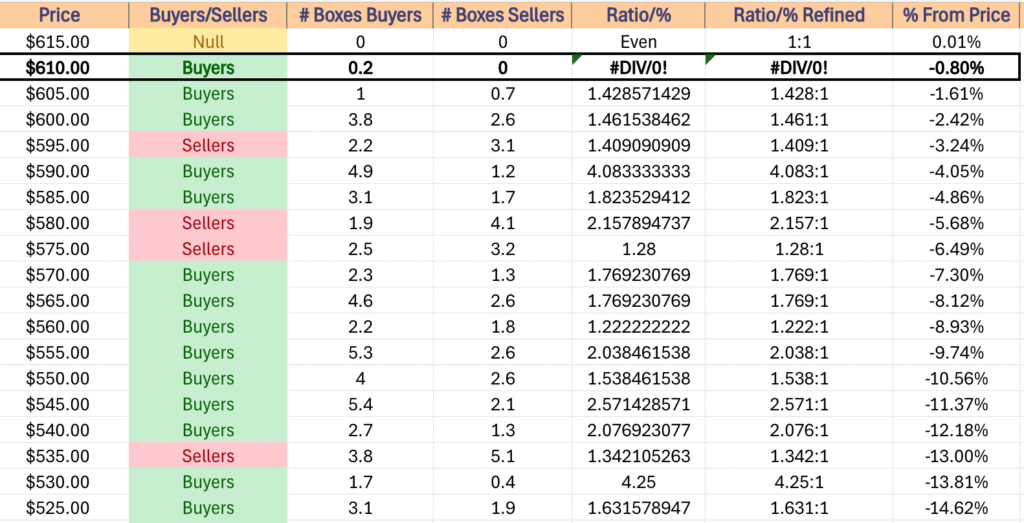
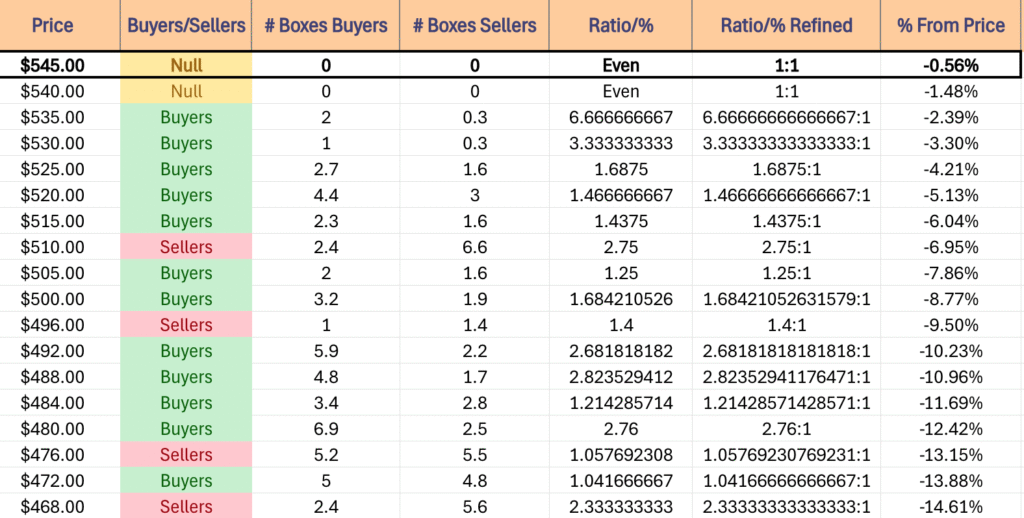
QQQ has support at the $539.40 (Volume Sentiment: Buyers, 6.67:1), $536.88 (Volume Sentiment: Buyers, 6.67:1), $535.01 (10 Day Moving Average, Volume Sentiment: Buyers, 6.67:1) & $532.43/share (Volume Sentiment: Buyers, 3.33:1) price levels, with resistance at the $549.99/share (All-Time High, Volume Sentiment: NULL, 0:0*) price levels.
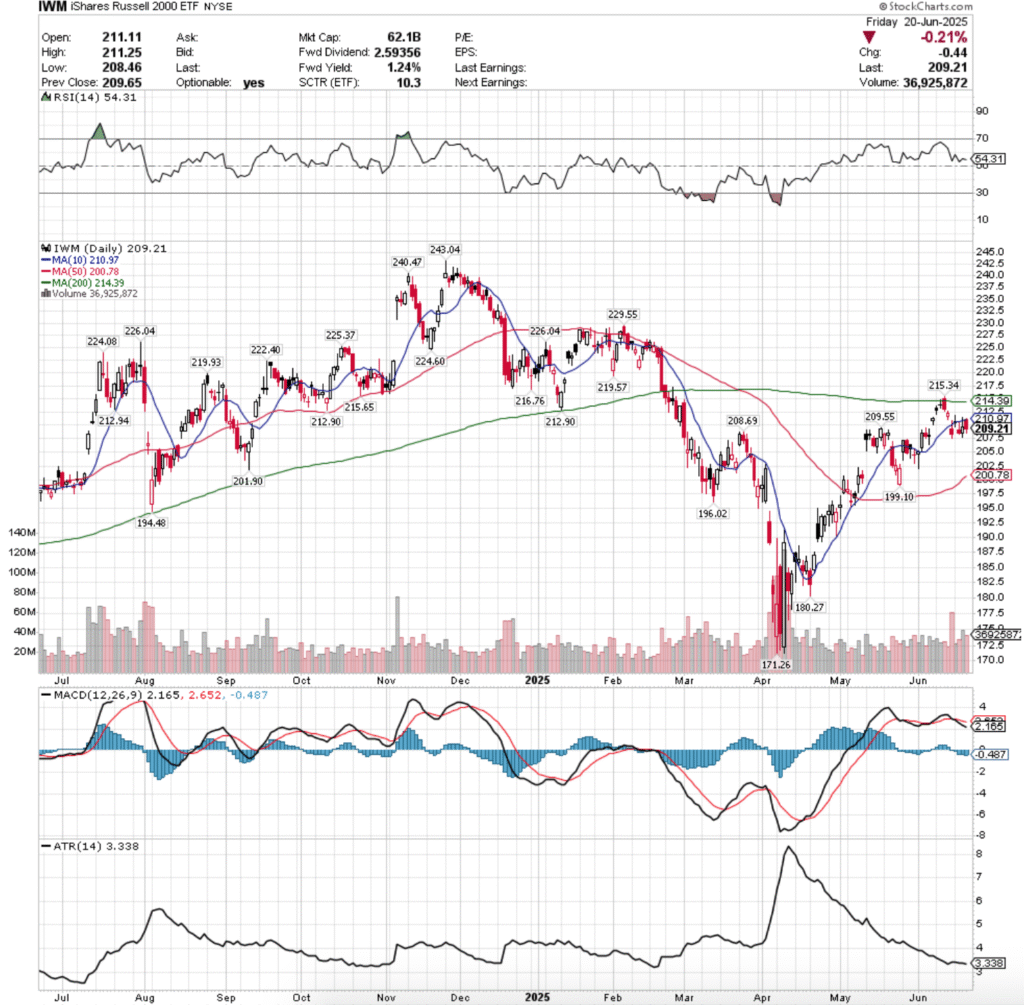
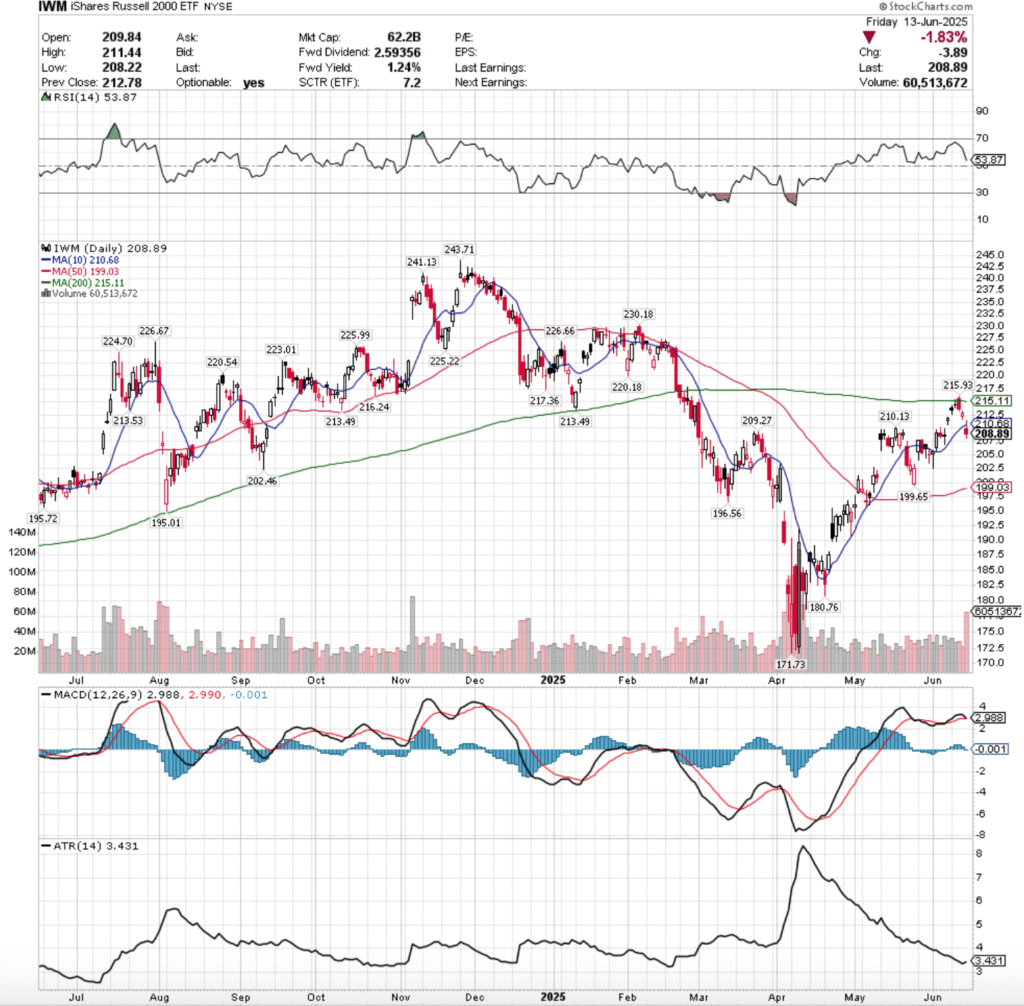
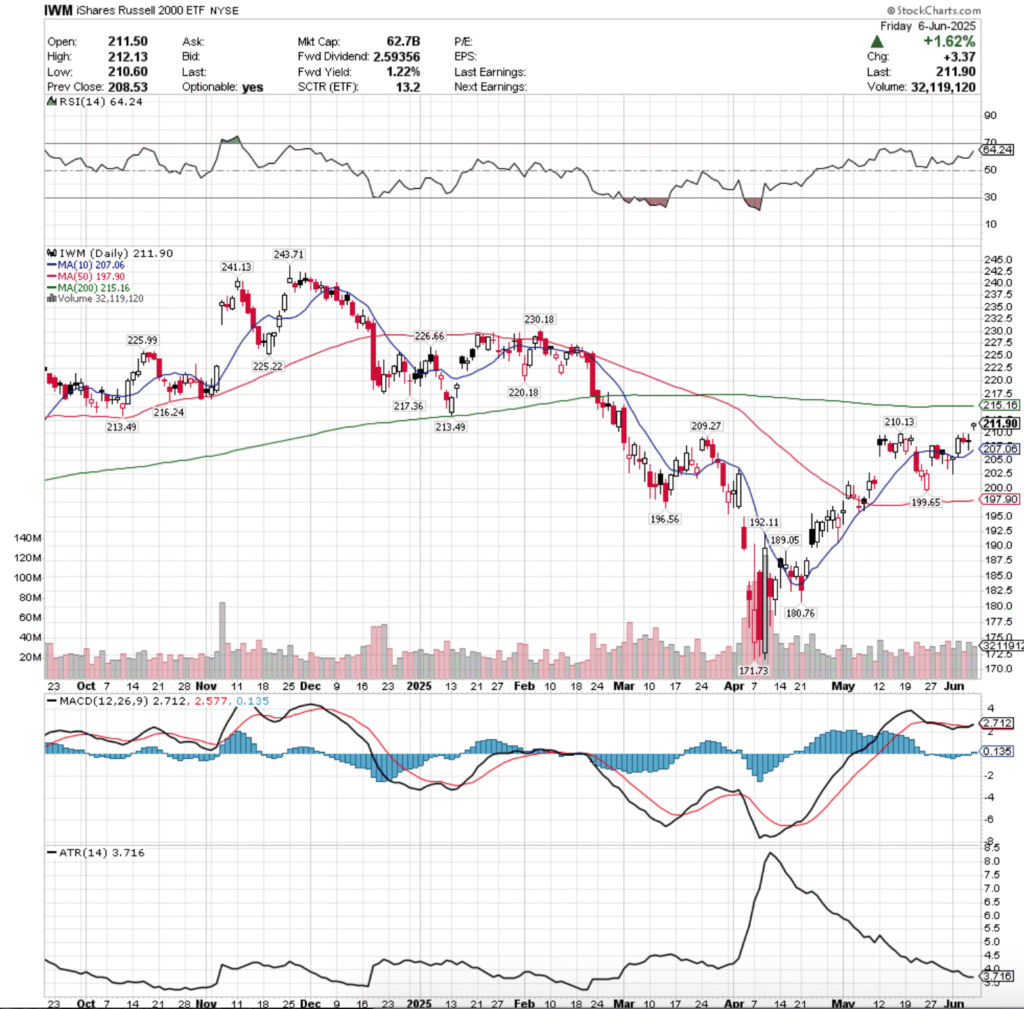
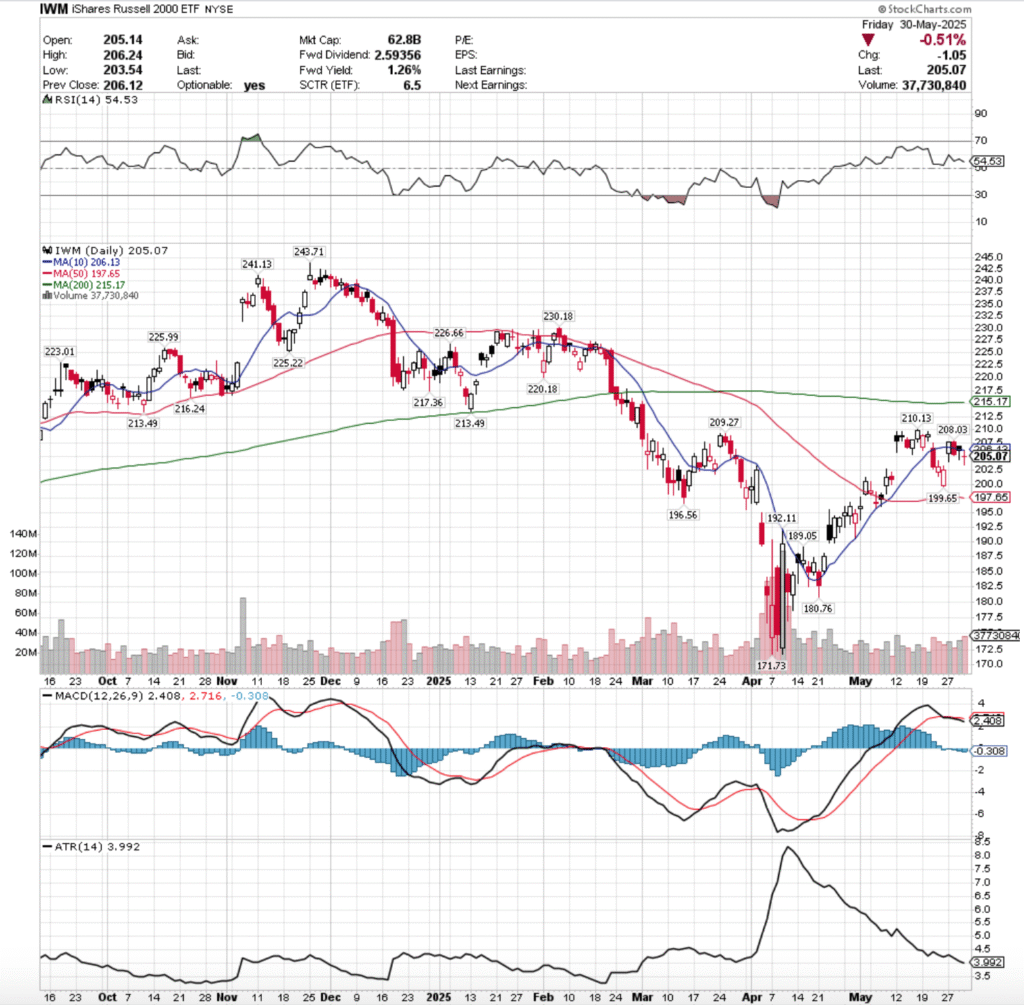
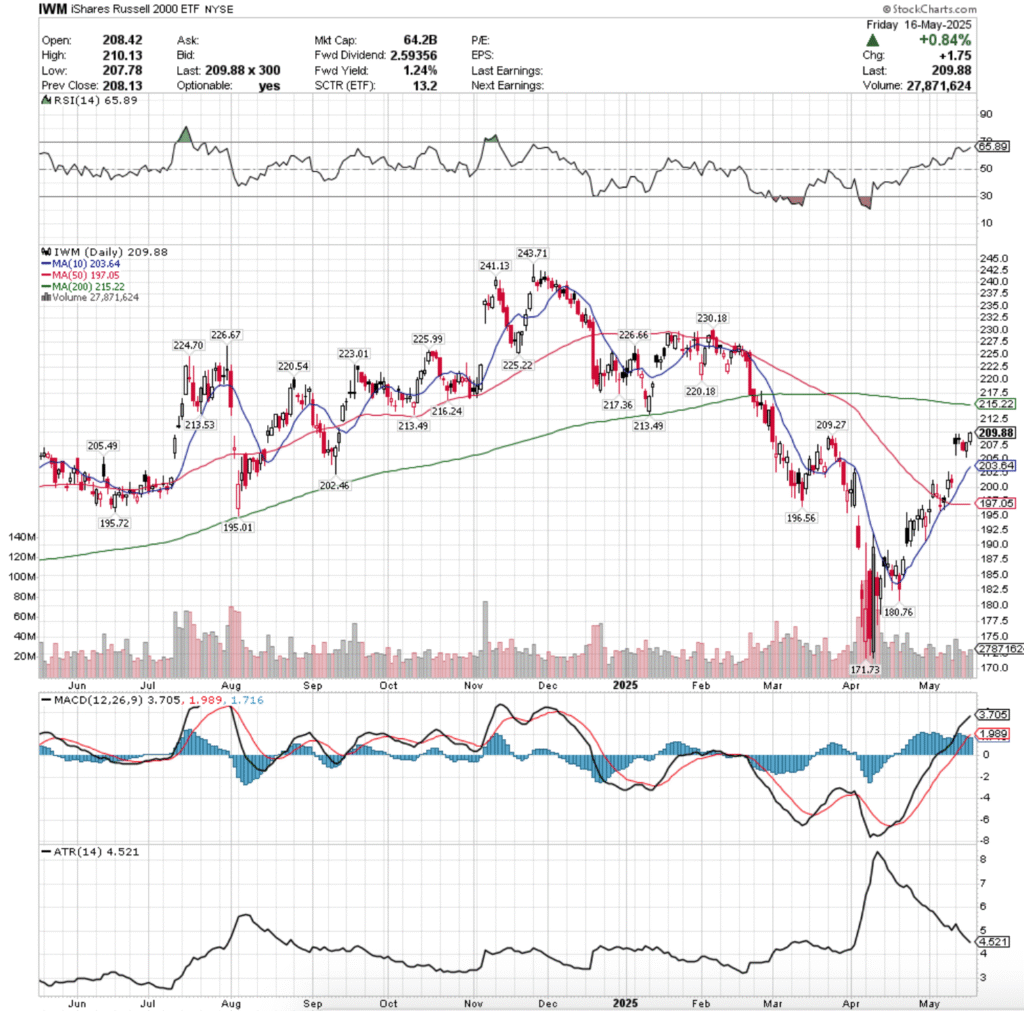
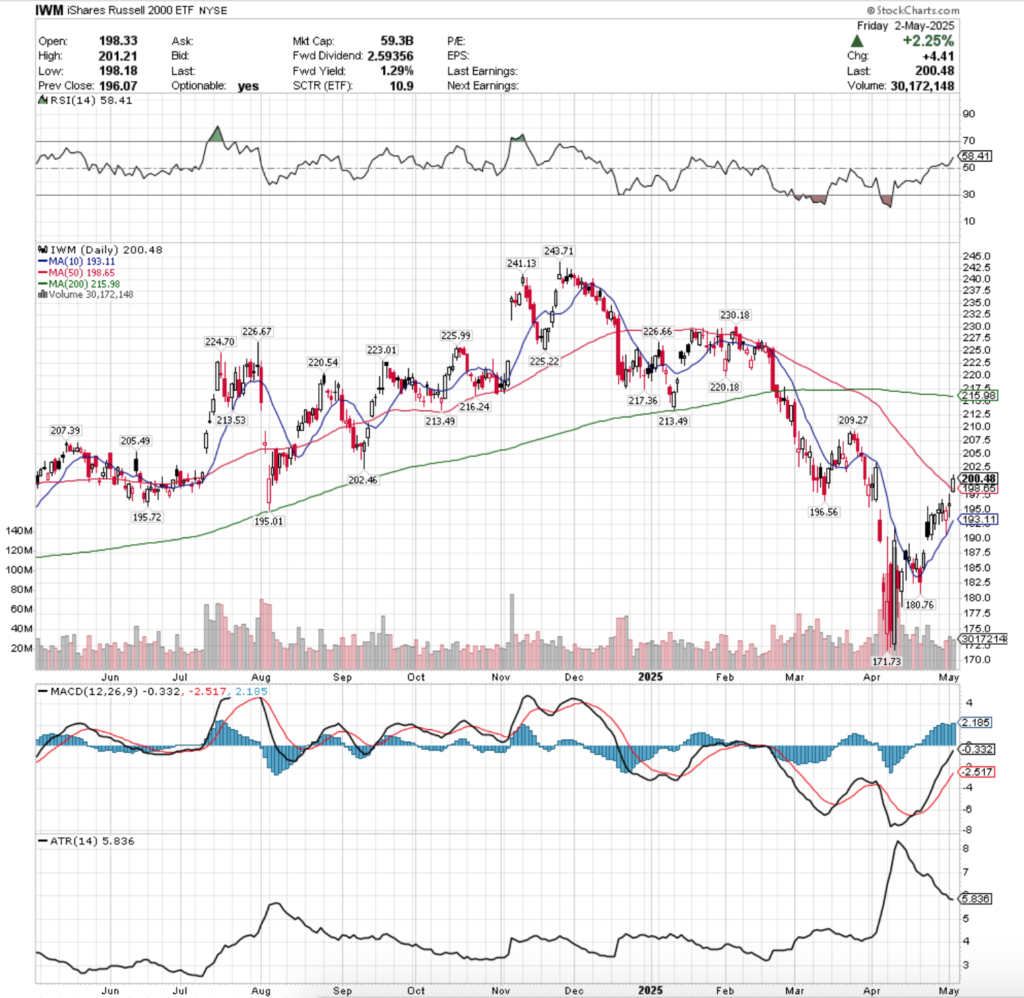
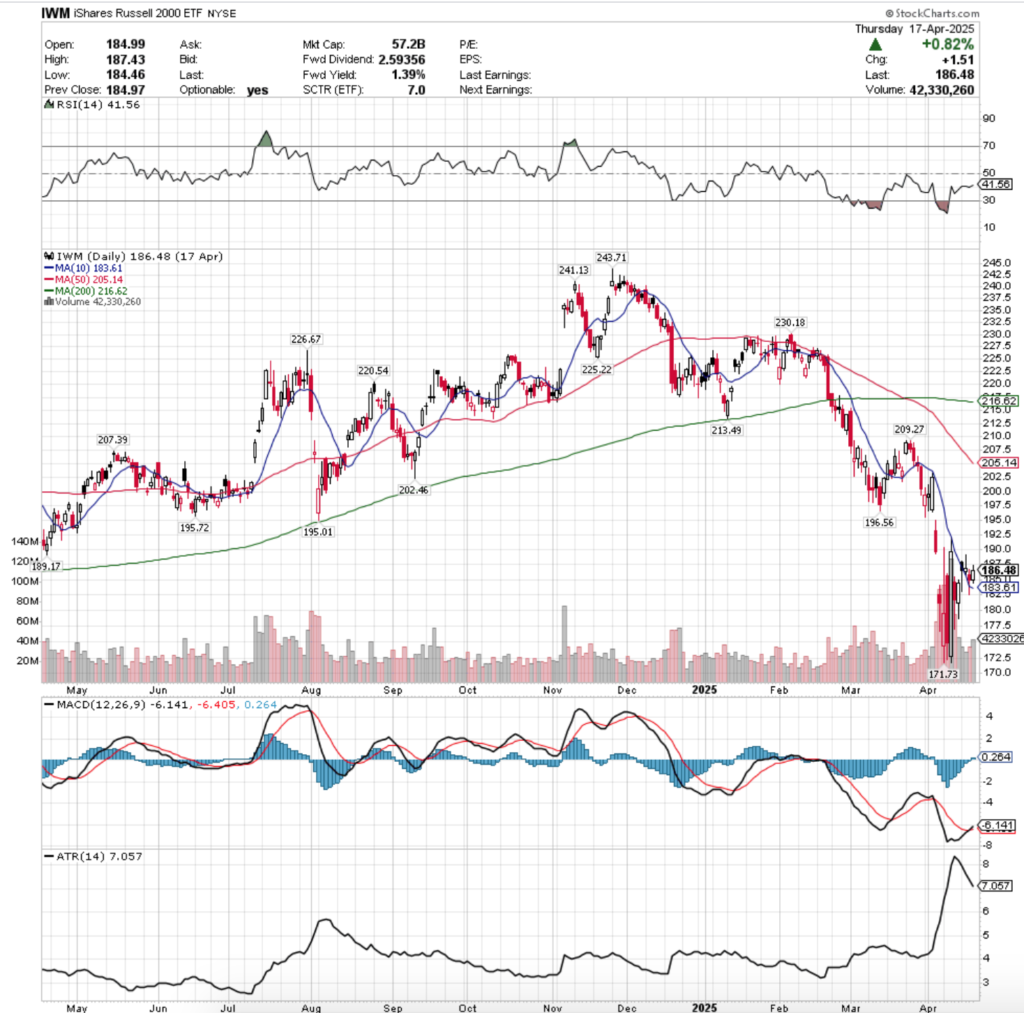
IWM, the iShares Russell 2000 ETF had the worst week of the four majors, gaining just +2.96%.
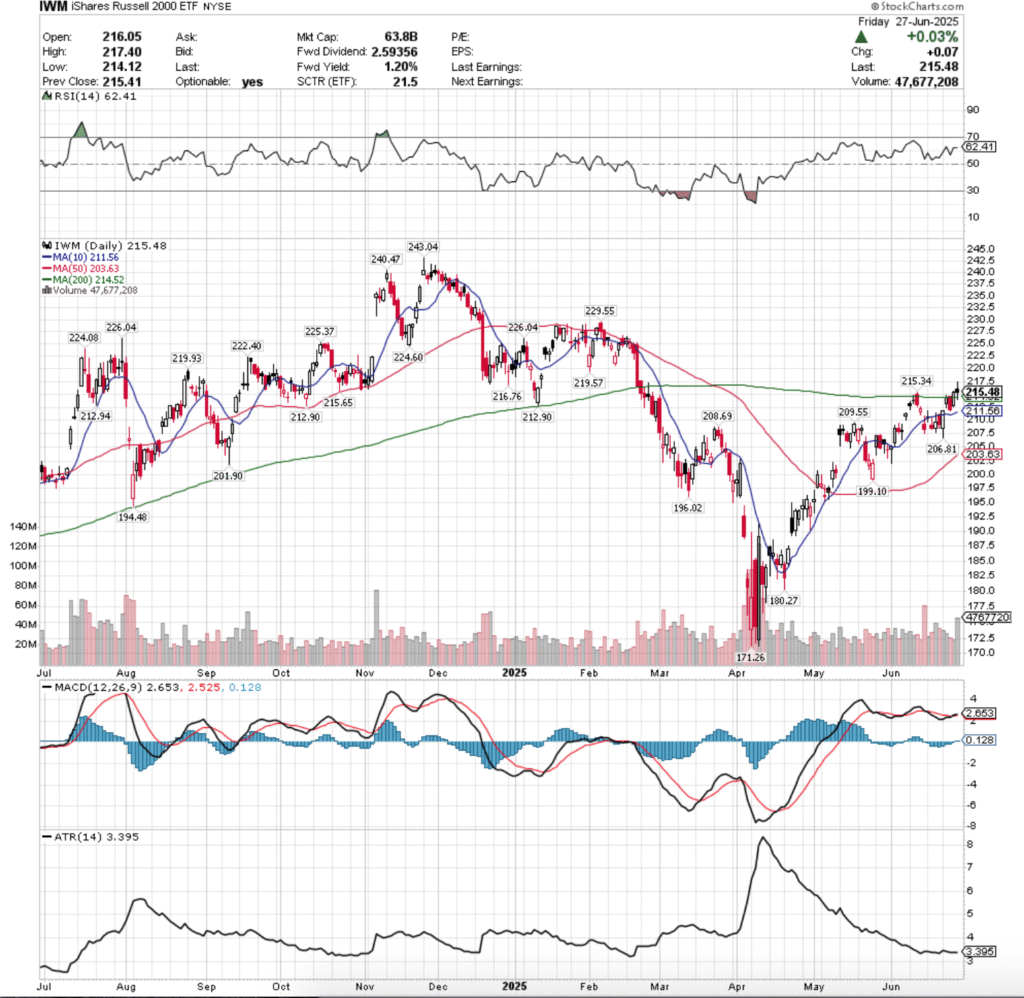
Their RSI has flattened out at 62.41, while their MACD crossed over bullishly on Thursday, but is not indicating much strength as it too lies flat.
Volumes were -1.02% lower than the prior year’s average (30,320,000 vs. 30,631,155), as market participants stayed the course with the small cap index.
IWM’s week opened lower than the prior Friday’s close, tested all the way down to $206.81/share, before rebounding back up to test & break out above the 10 day moving average’s resistance, ending the day near its high.
This occurred on the second highest volume of the week, showing that it took force to break above the short-term trendline.
Tuesday featured a similar gap as SPY & QQQ’s, which tested back down to the $212.36/share before powering higher to temporarily break above the 200 day moving average’s resistance & closing in-line with the long-term trendline.
Wednesday managed to open just above the 200 DMA, but quickly saw profits taken down from the table & IWM declined to end the day below the 200 DMA at $211.97, forming a bearish engulfing pattern with Tuesday’s candle & signaling that there was bearish sentiment creeping into the market.
Thursday managed to open higher & advance throughout the day, breaking above the 200 day moving average’s resistance & closing above it, but on the week’s weakest volume.
This signaled continued hesitancy & that there was still quite a bit of uncertainty lingering around the small cap index & its ability to remain above the long-term trendline.
Friday confirmed this with a gap up open that went as high as $217.41/share before tumbling to break down below the 200 day moving average’s support temporarily, and while it was able to recover back to above it, the session closed lower than it opened.
Friday also cast doubts about IWM’s near-term performance, due to the high waves of the day’s candles, as it showed there was a wide range of valuations market participants valued it at & that there was a bit of profit taking going on.
Looking to this week & next, IWM needs to form more of a base & get some stronger support above the 200 day moving average if it wants to continue climbing higher, which will also require an upside catalyst of some type.
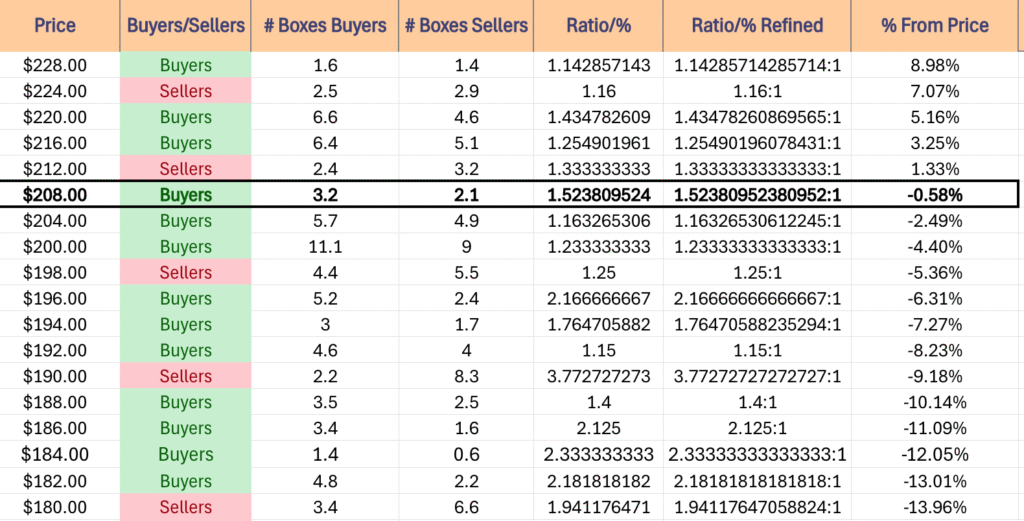
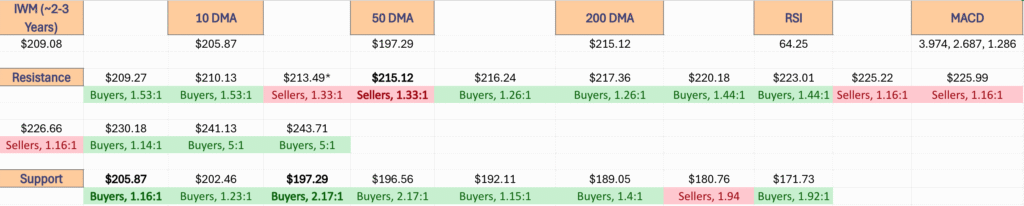
Should it make a run at it, the $216.76 & $219.57-219.93 levels will come into play as levels of importance on the resistance side.
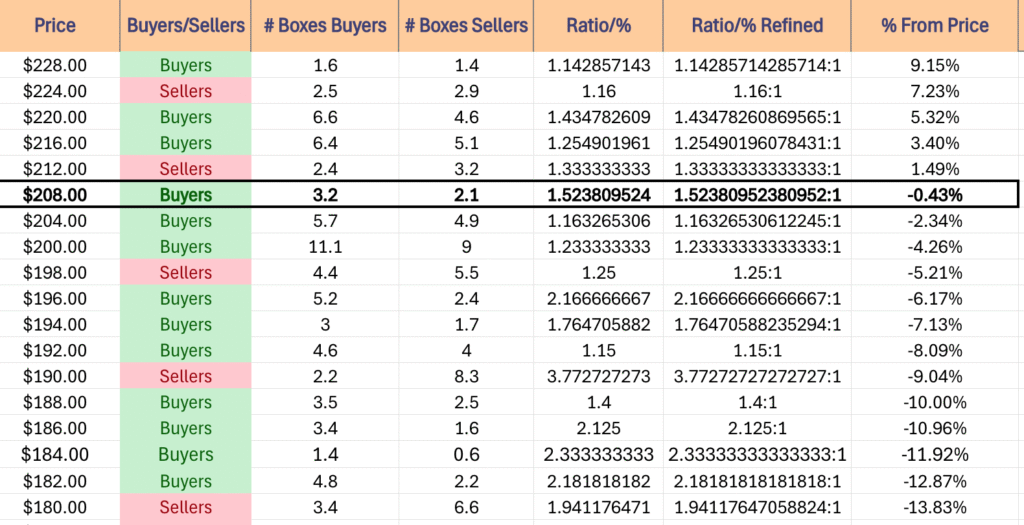
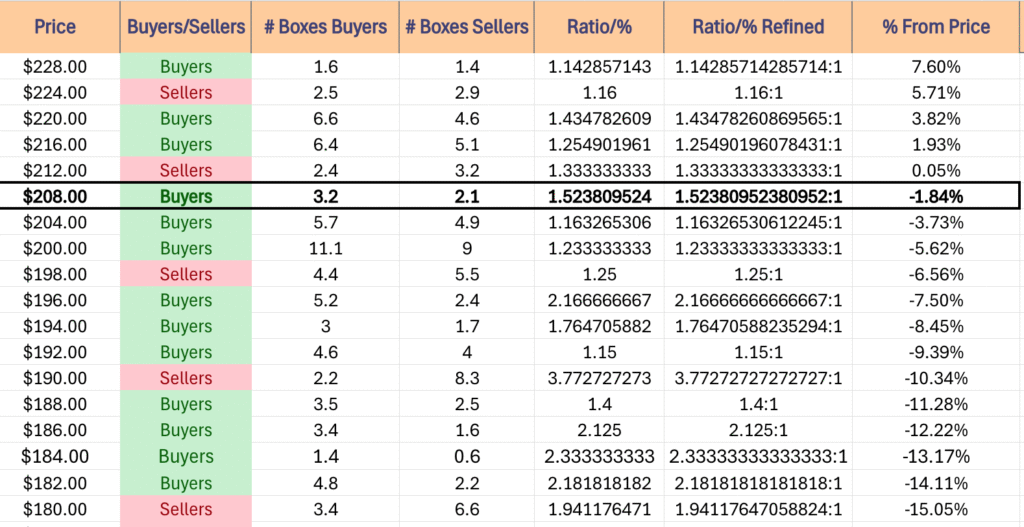
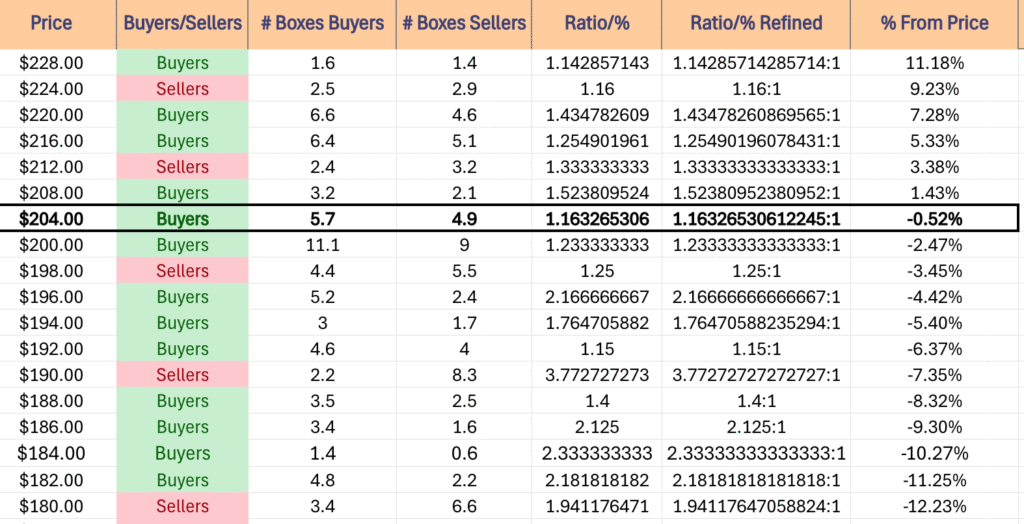
While there’s plenty of historic buyer sentiment at these levels, IWM needs to first break cleanly out of the price zone it’s been in ($212-215.99/share) which is a Seller dominated zone.
The consolidation case revolves around IWM oscillating around the 200 & 10 day moving averages awaiting an upside or downside catalyst, watching as the 50 day moving average moves closer.
To the downside, if the long-term trendline doesn’t hold up as support the next four support levels are all historically Seller oriented prices, which would force a test of the 10 day moving average’s support.
THis also puts into play the potential for a bearish head & shoulders pattern with mid-May’s gap up session serving as the left shoulder.
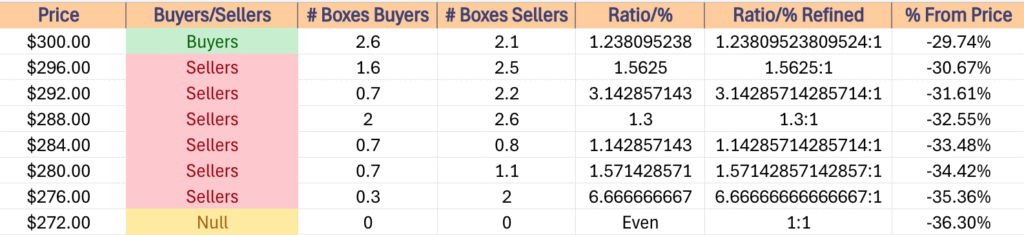
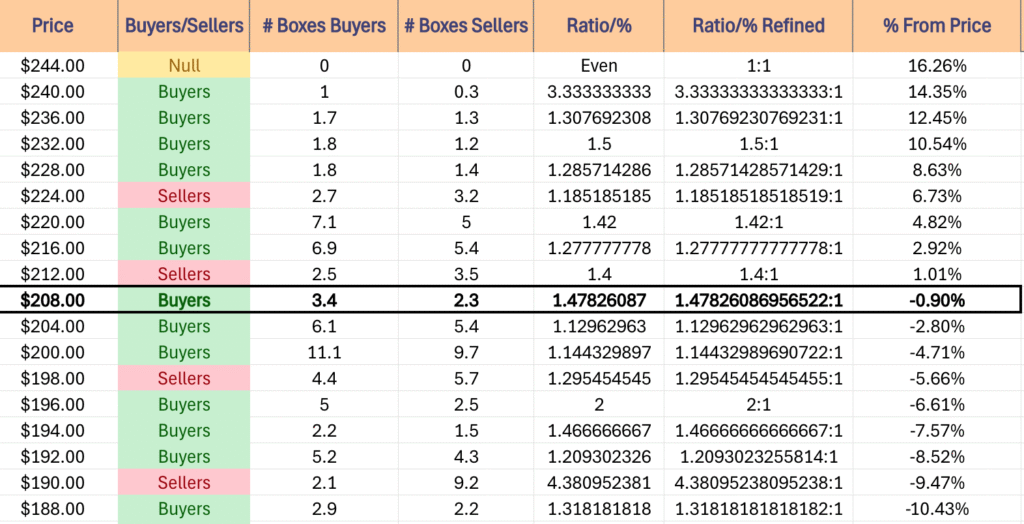
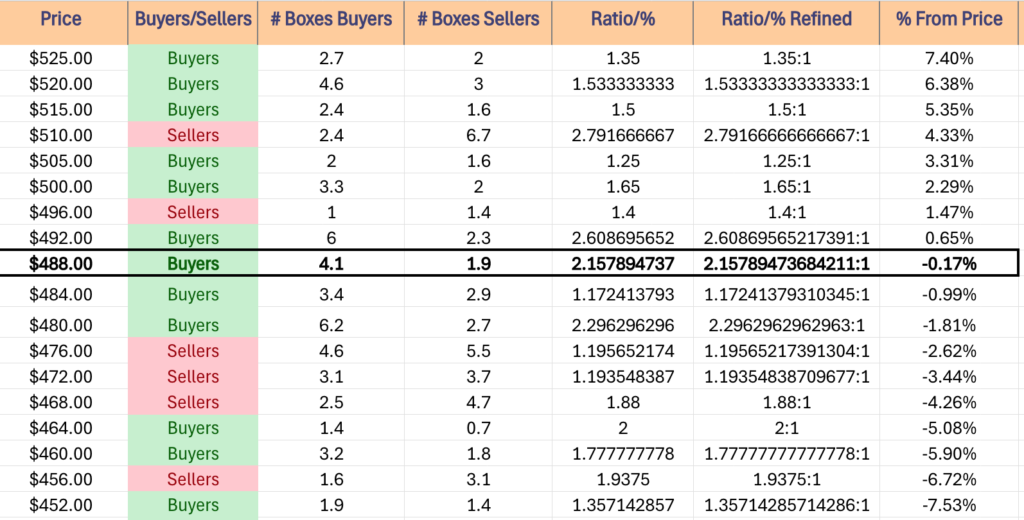
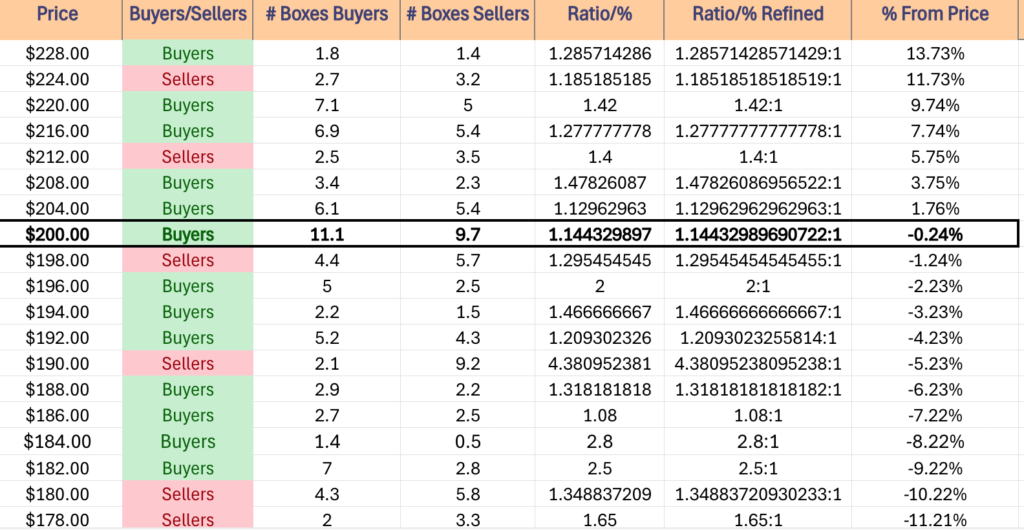
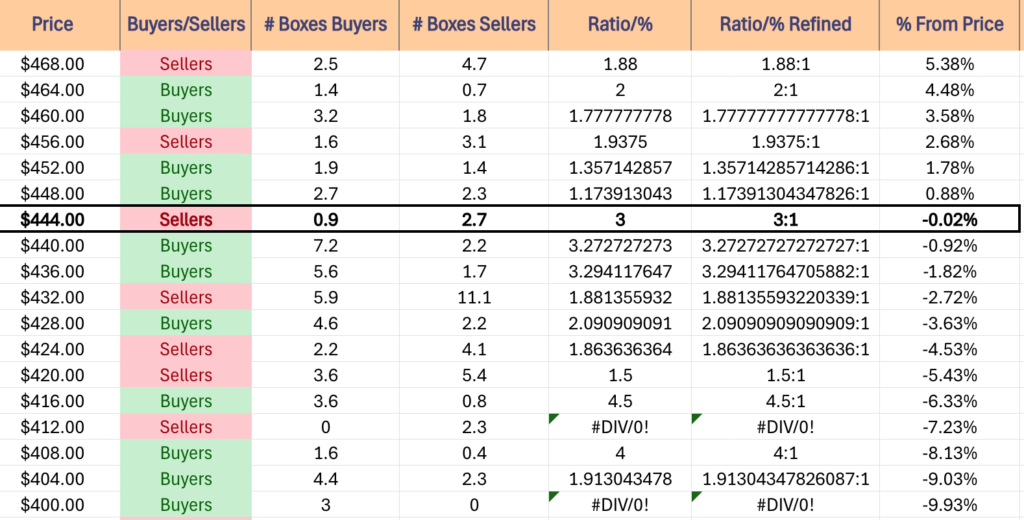
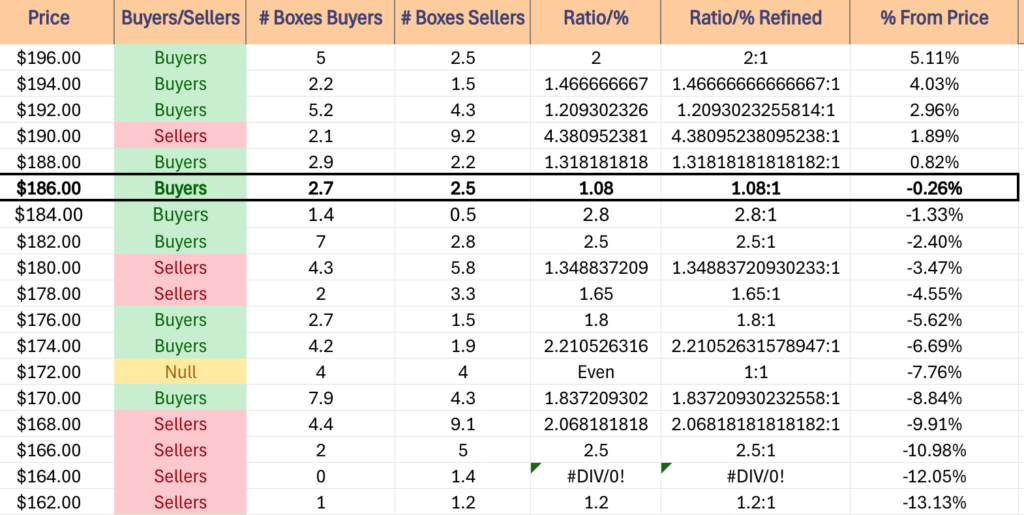
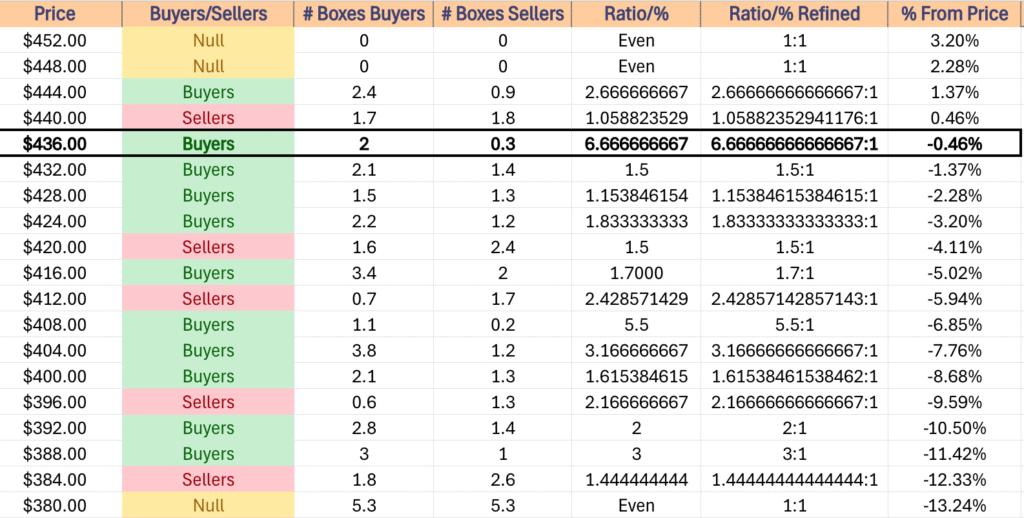
IWM has support at the $215.34 (Volume Sentiment: Sellers, 1.33:1), $214.52 (200 Day Moving Average, Volume Sentiment: Sellers, 1.33:1), $212.94 (Volume Sentiment: Sellers, 1.33:1) & $212.90/share (2 Touch-Points*, Volume Sentiment: Sellers, 1.33:1) price levels, with resistance at the $215.65 (Volume Sentiment: Sellers, 1.33:1), $216.76 (Volume Sentiment: Buyers, 1.26:1), $219.57 (Volume Sentiment: Buyers, 1.26:1) & $219.93/share (Volume Sentiment: Buyers, 1.26:1) price levels.

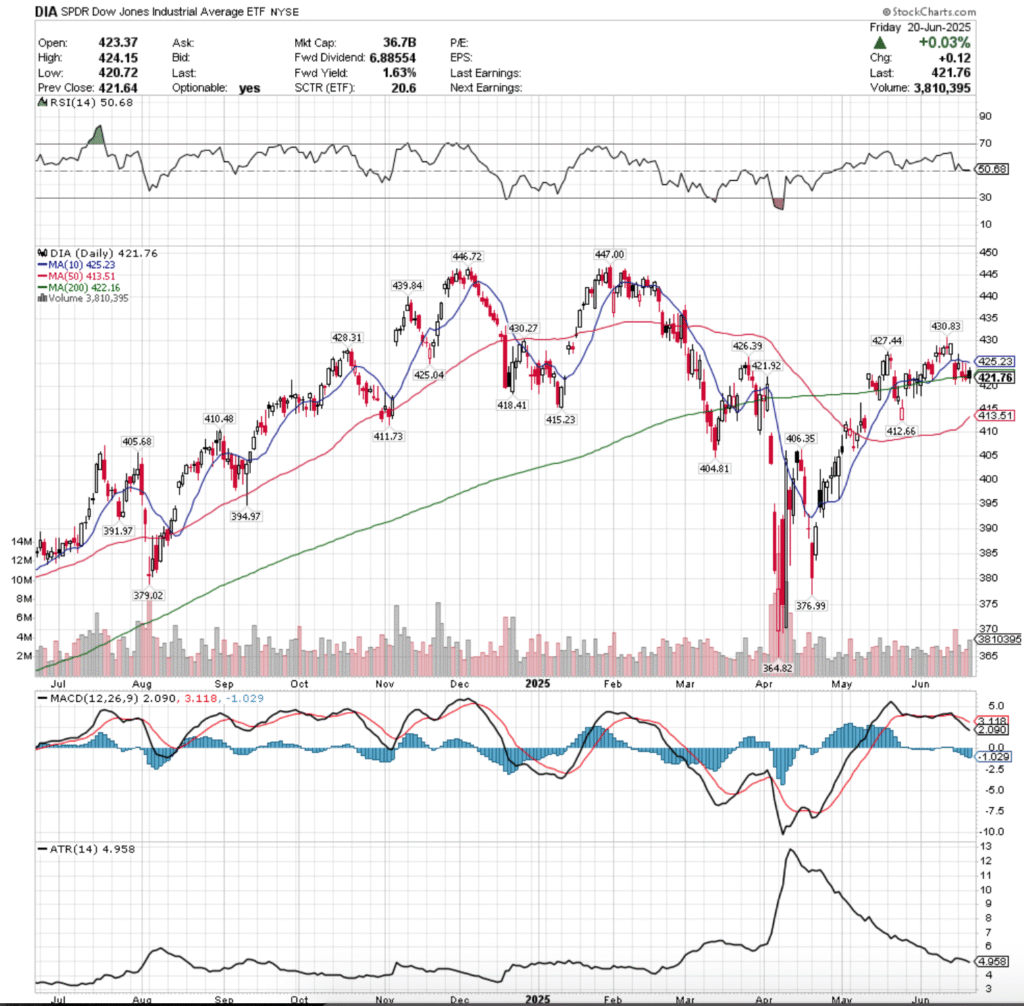
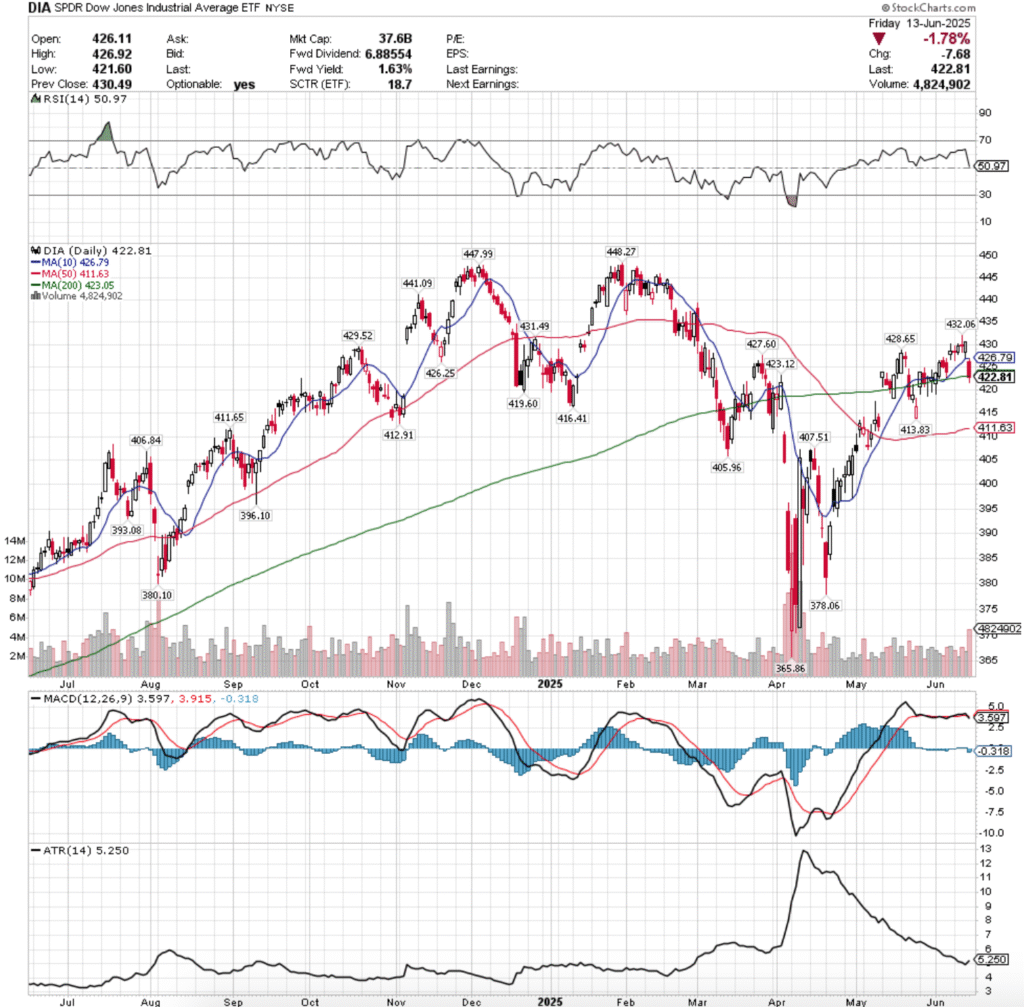
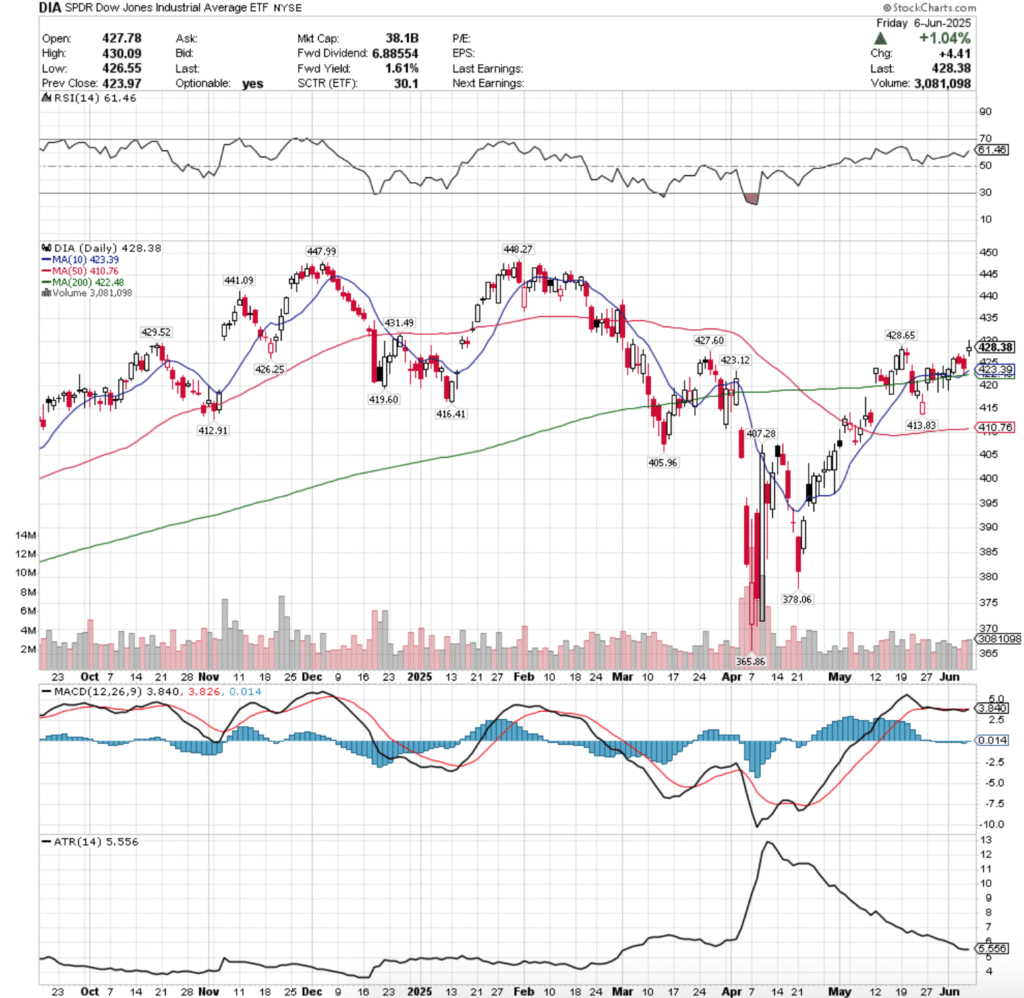
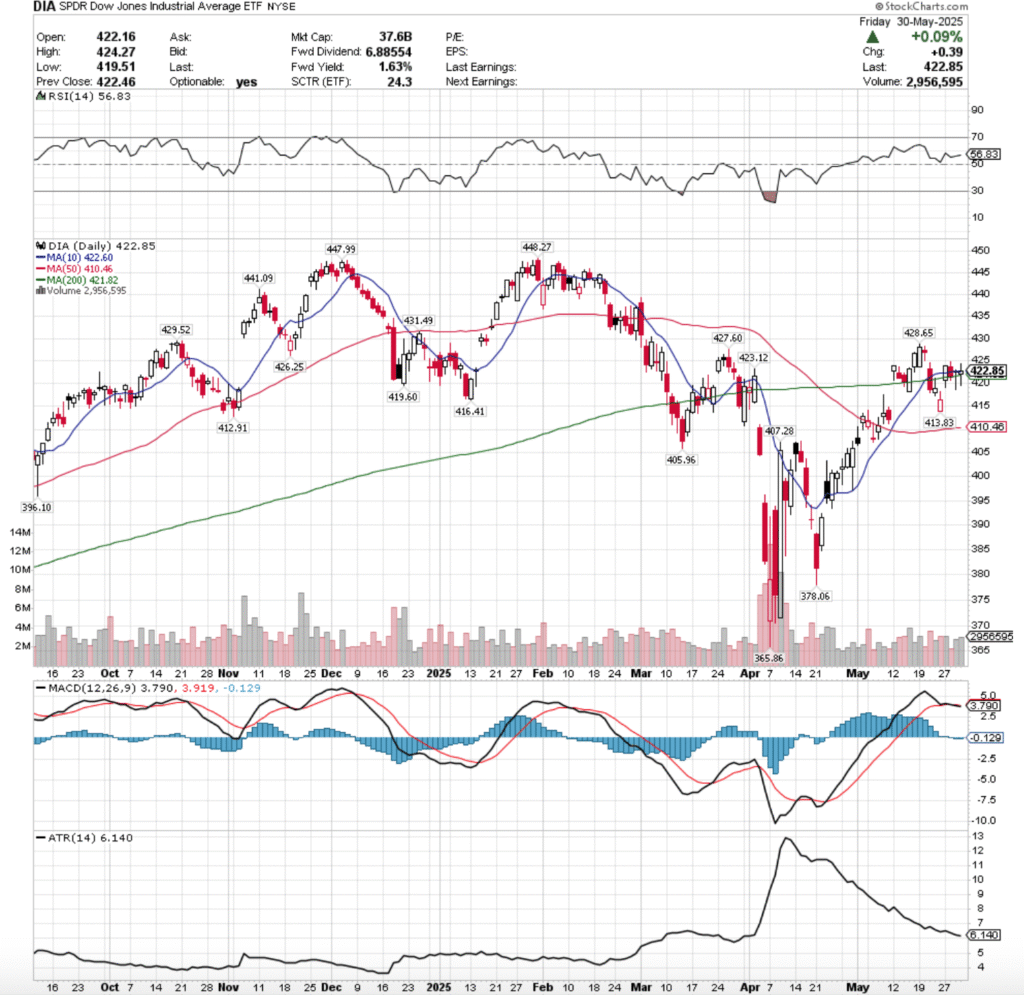
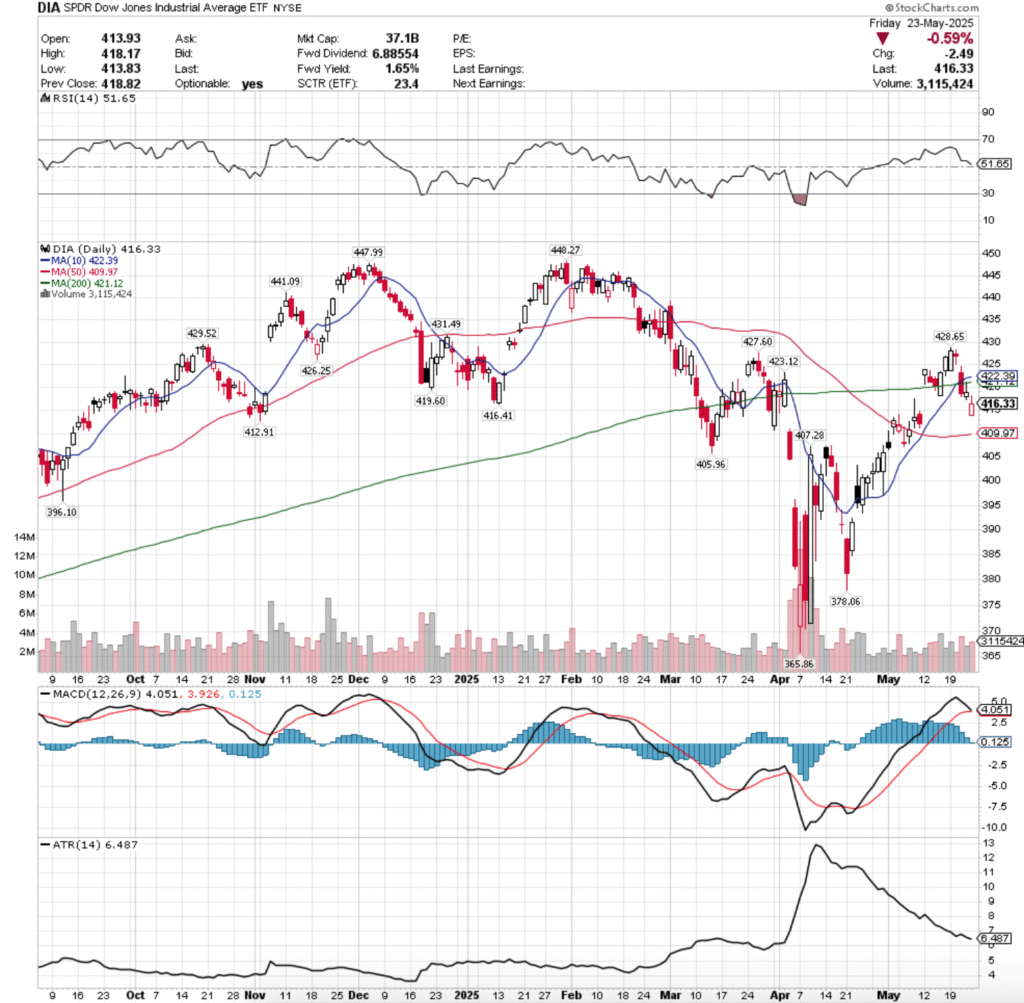
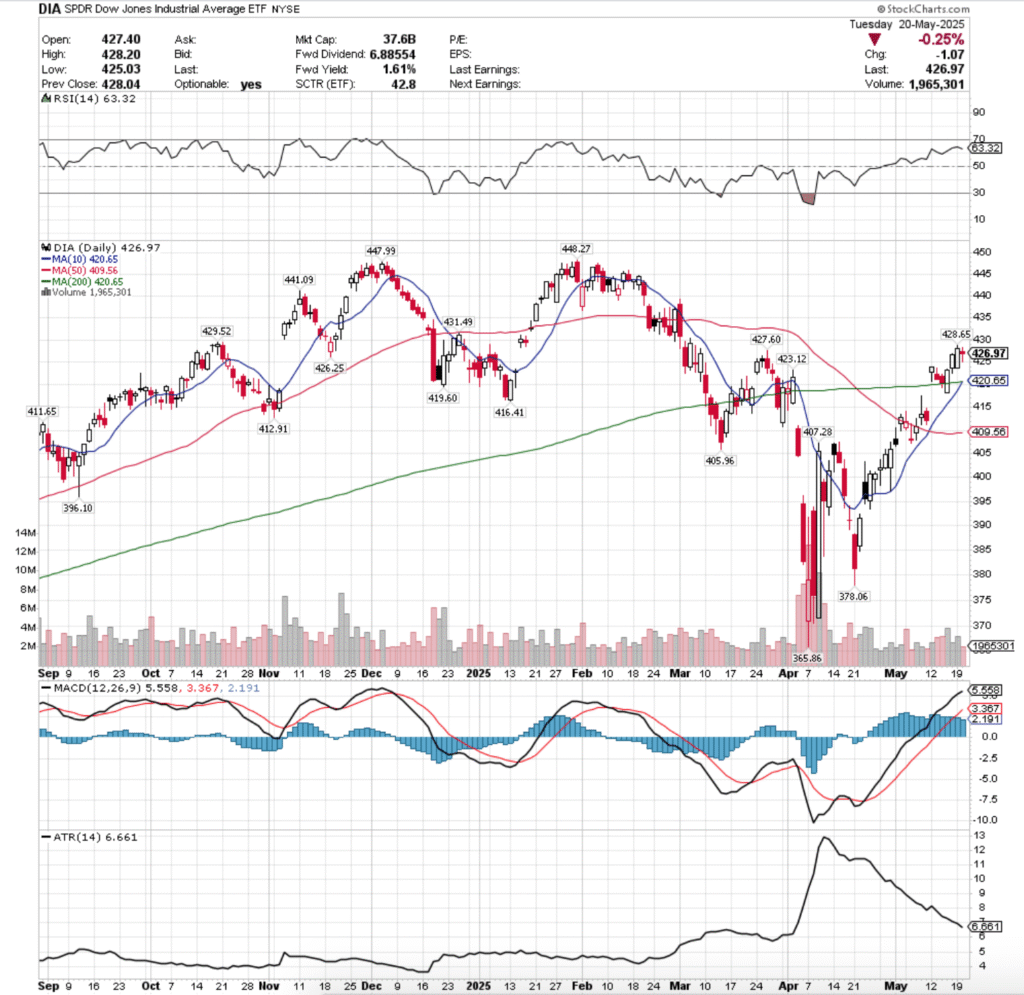
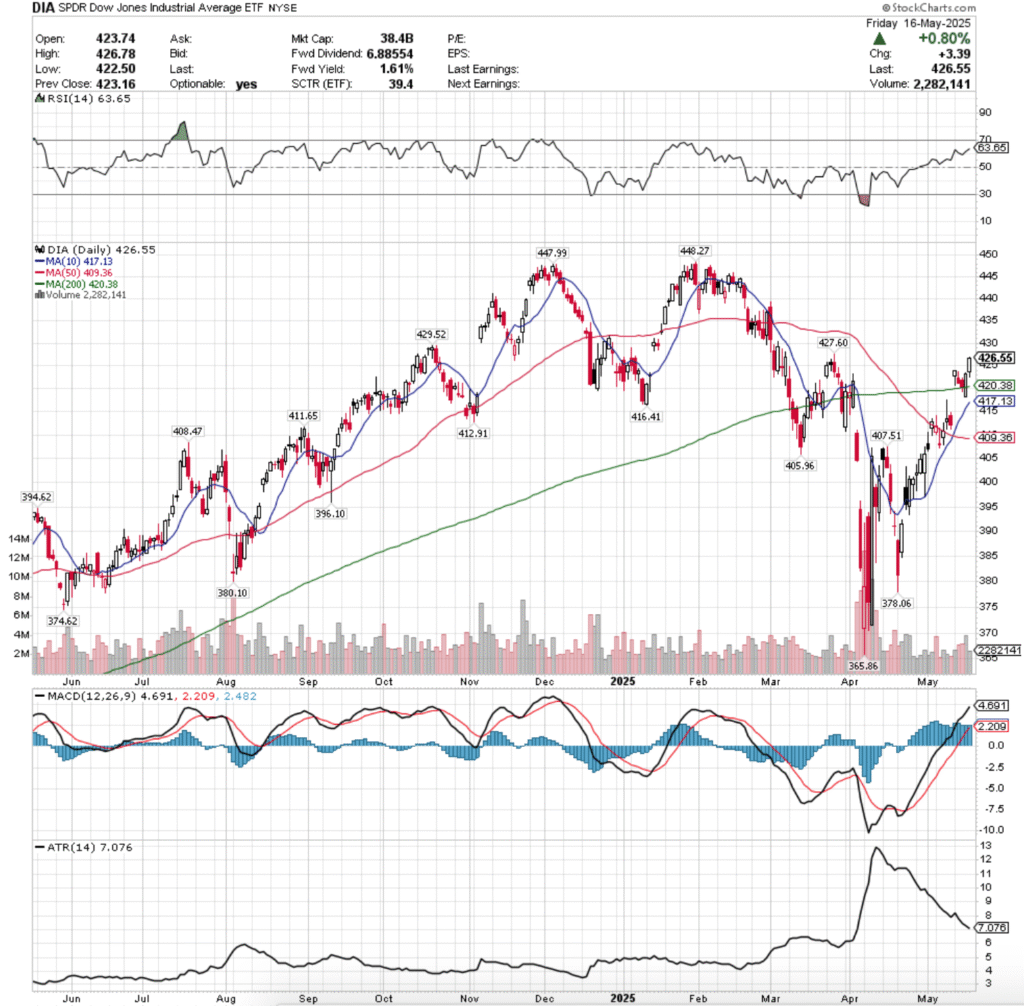
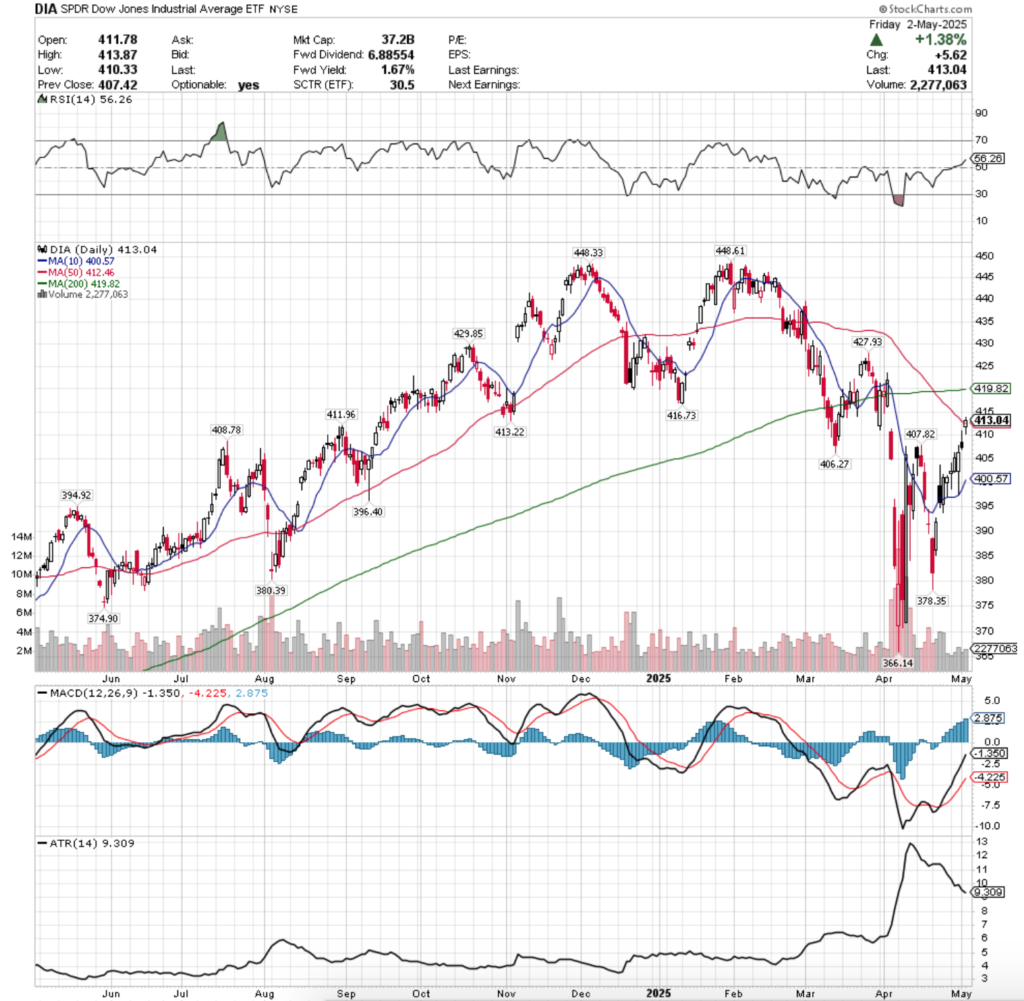
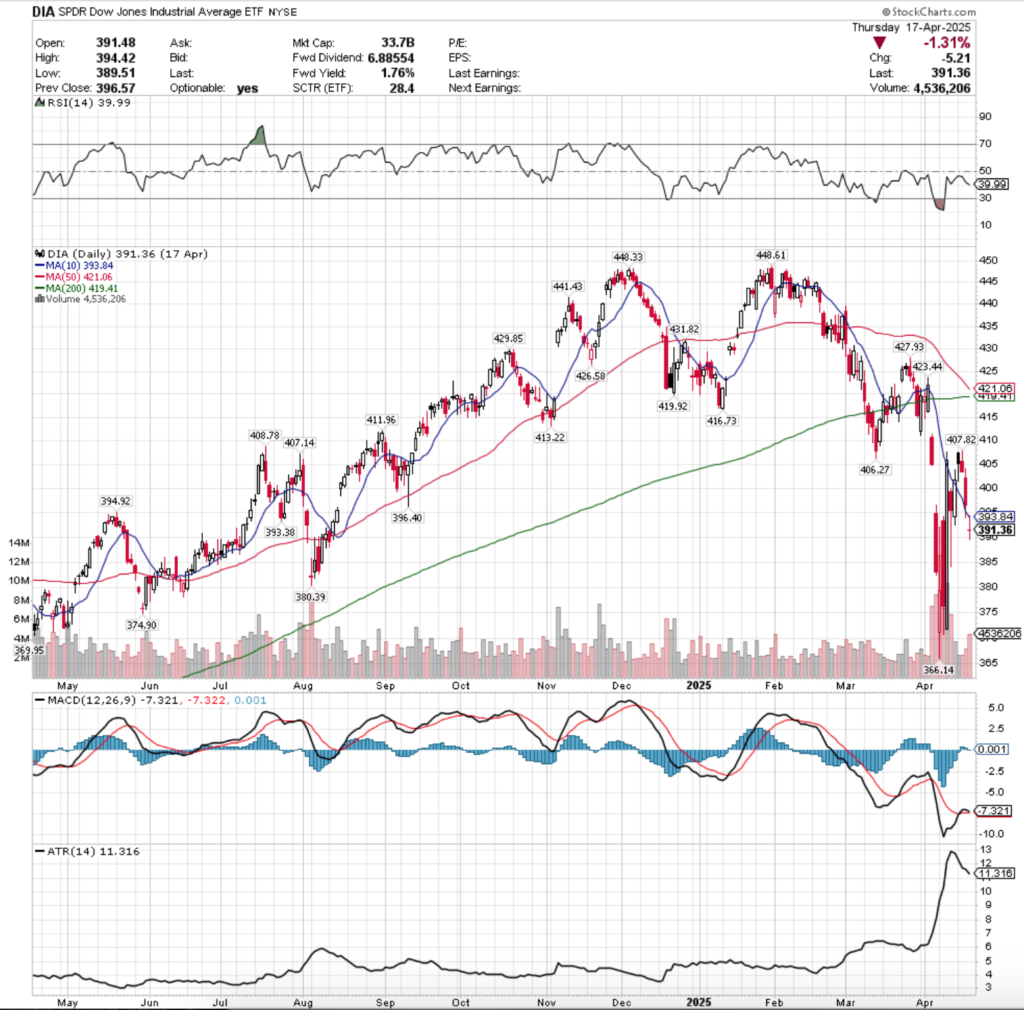
DIA, the SPDR Dow Jones Industrial Average ETF climbed +3.85% last week, as the blue chip index remained in favor of market participants, but it too showed similar weakness to SPY, QQQ & IWM.

Their RSI is approaching the overbought level of 70 & is currently at 68.26, while their MACD crossed over bullishly on Thursday & will be an area of interest this week after a gap filled week.
Volumes were +15.19% higher than the prior year’s average (3,688,000 vs. 3,201,785.7), mostly due to the first two sessions of the week, which paints a dim picture.
Monday the week opened in-line with the 200 day moving average, dropped below it briefly down to $419.62/share before climbing higher to break out above the 200 & 10 day moving averages, closing above both.
Tuesday featured a gap up open & the week’s highest volume session resulted in a close above $430/share.
Wednesday saw some profits taken in a declining session that formed a bearish harami pattern with Tuesday’s & began to show signs of weakness among the blue-chip index.
Thursday featured another gap up open and the day produced an advancing session +0.95%, but it occurred on the lowest volume of the week, showing that there was beginning to be doubts about DIA’s near-term future.
Friday confirmed this when another gap up open pushed higher to reach a high of $439.56/share, but was forced lower to close at $438/share as profits were taken & a risk-off into the weekend sentiment crept into view.
It should be noted that Friday’s session had the second lowest volume of the week, which when paired with the size of the day’s upper shadow does not paint a strong picture for the session’s advance.
The upside case for DIA is interesting, as it has three resistance levels above it that includes its all-time high & lots of Buyer sentiment as it is near price extremes.
Like the aforementioned three index ETFs, for any upside breakout to have stability & legs beneath it you’ll need to see sustained advancing volume.
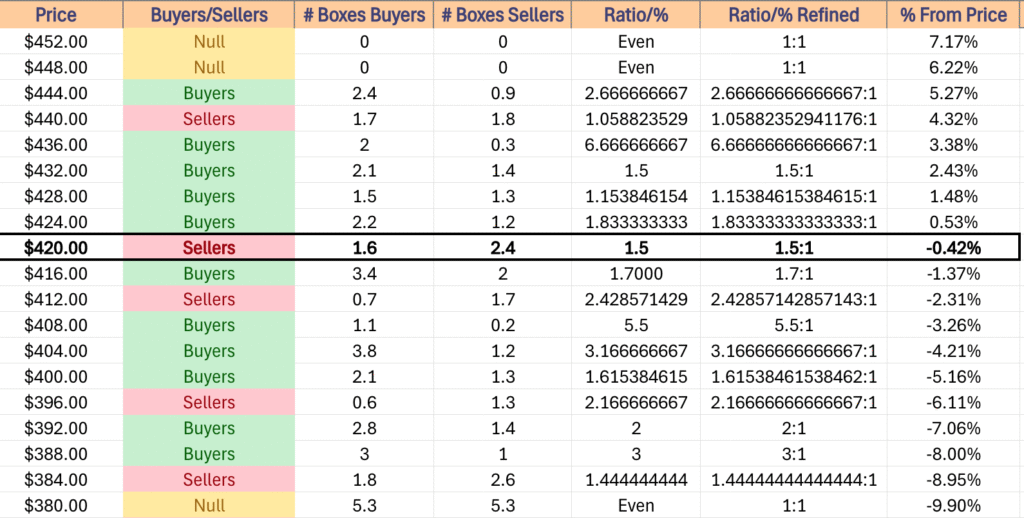
The consolidation case here is iffy, as there are enough gaps that it could see prices drop to as low as $427.68, which would lead into closing the Monday-Tuesday gap up window.
The downside case that should be monitored here is how strong the support of the 10 & 200 day moving averages hold up.
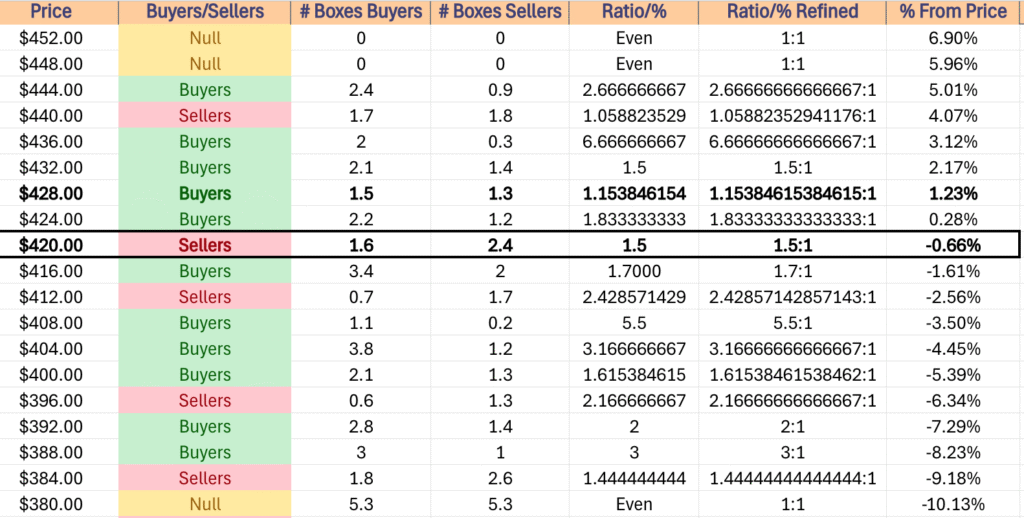
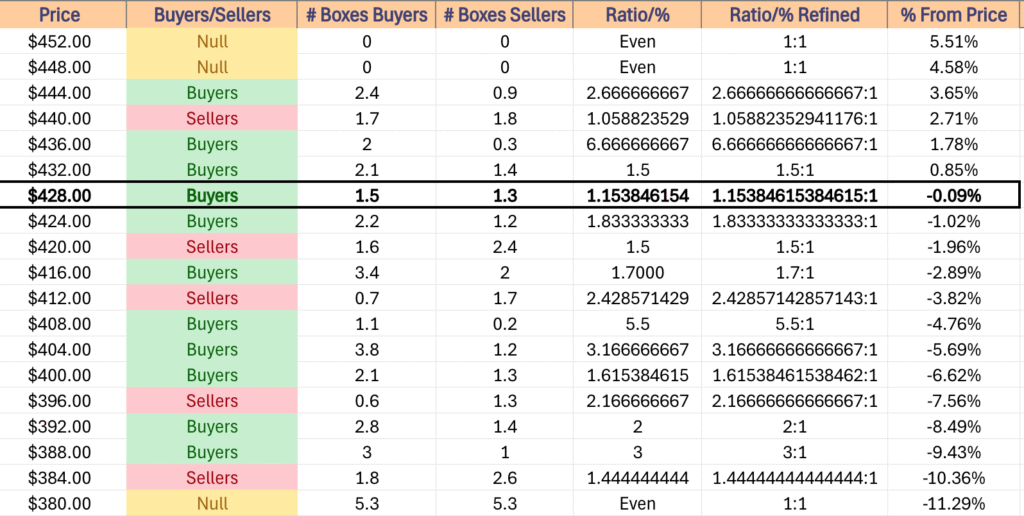
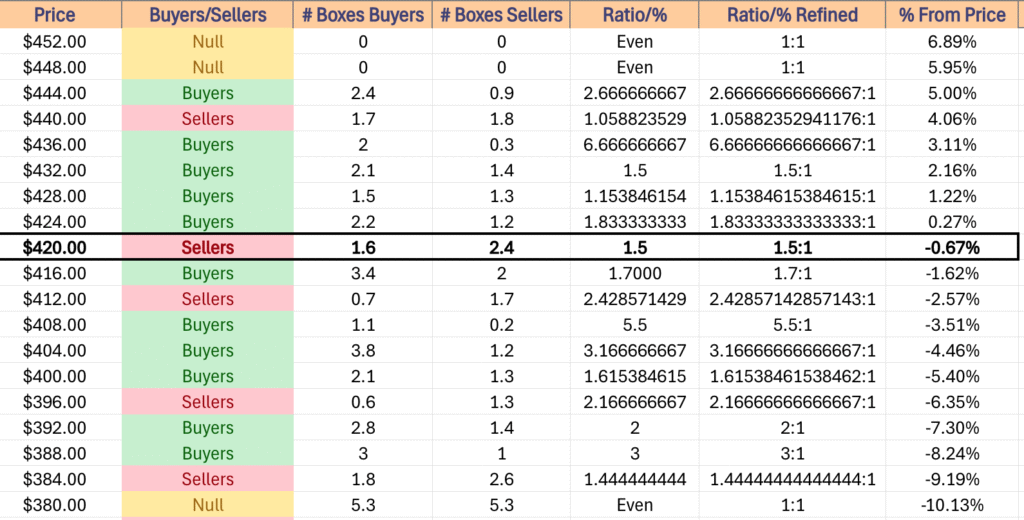
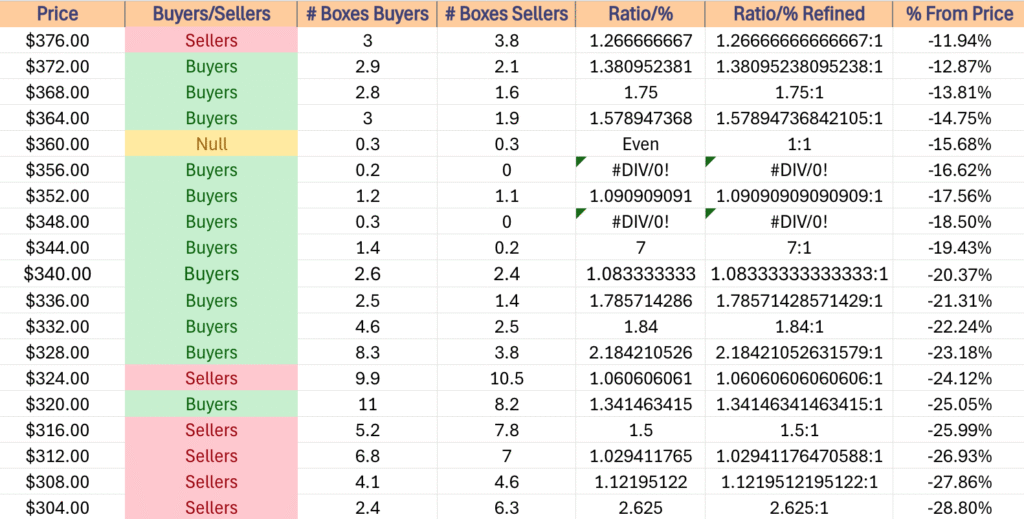
Should the long or short term trend lines break down, expect to see more downside movement by DIA, especially given that $420-423.99/share is a Seller zone historically, which could force a test of the support of the 50 day moving average.
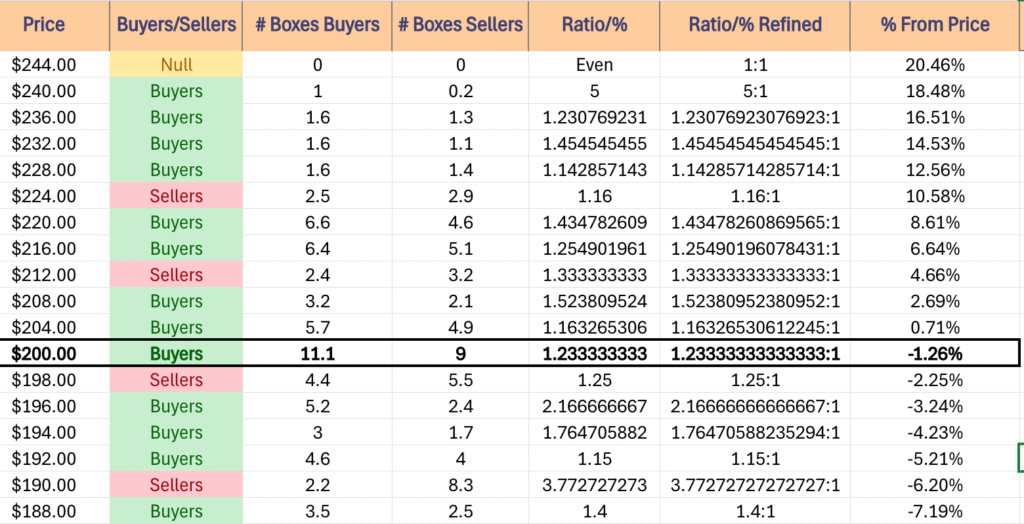
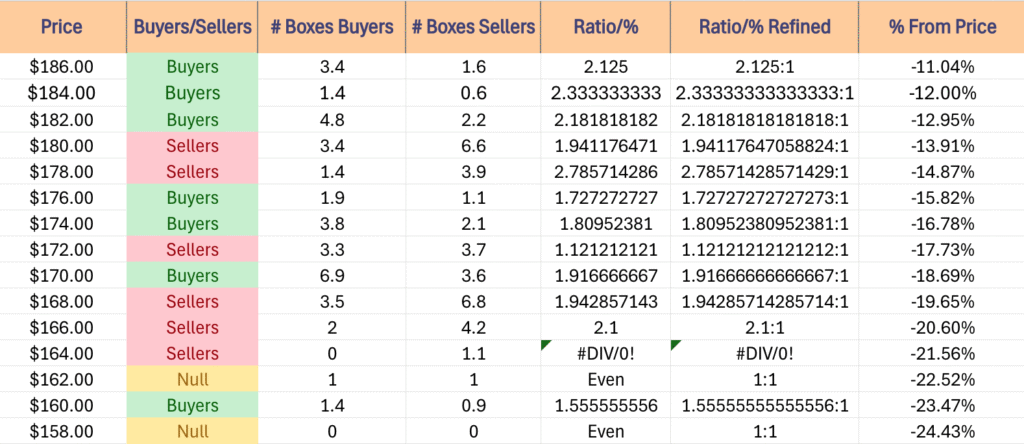
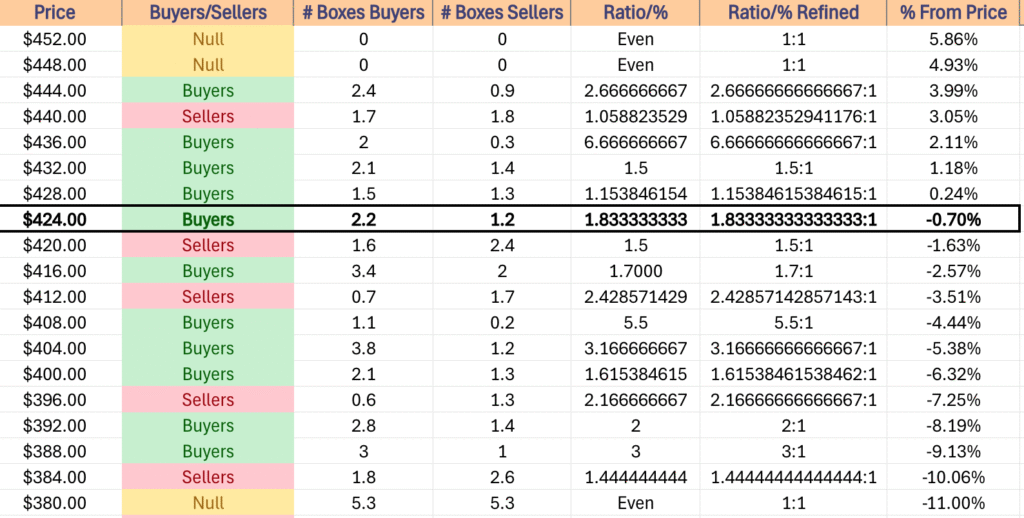
DIA has support at the $430.27 (Volume Sentiment: Buyers, 1.15:1), $428.31 (Volume Sentiment: Buyers, 1.15:1), $427.44 (Volume Sentiment: Buyers, 1.83:1) & $427.03/share (10 Day Moving Average, Volume Sentiment: Buyers, 1.83:1) price levels, with resistance at the $439.84 (Volume Sentiment: Buyers, 6.67:1), $446.72 (Volume Sentiment: Buyers, 2.67:1) & $447/share (All-Time High, Volume Sentiment: Buyers, 2.67:1) price levels.
The Week Ahead
Monday the week kicks off with Chicago Business Barometer (PMI) data at 9:45 am.
Progress Software reports earnings after Monday’s closing bell.
S&P Final U.S. Manufacturing PMI data comes out Tuesday at 9:45 am, before Construction Spending, Job Openings & ISM Manufacturing data at 10 am.
Tuesday morning MSC Industrial reported earnings before the opening bell, before Constellation Brands & Greenbrier are scheduled to report after the closing bell.
Wednesday features ADP Employment data at 8:15 am.
UniFirst reports earnings before Wednesday’s session opens.
Initial Jobless Claims, U.S. Employment Report, U.S. Unemployment Rate, U.S. Hourly Wages, Hourly Wages Year-over-Year & U.S. Trade Deficit data are all released Thursday morning at 8:30 am, followed by S&P Final U.S. Services PMI data at 9:45 am & Factory Orders and ISM Services data at 10 am.
There are no earnings reports scheduled for Thursday & the market closes at 1 pm, with the bond market closing at 2 pm.
Friday features no major earnings calls or economic data releases as it is the Fourth of July.
See you back here next week!
*** I DO NOT OWN SHARES OR OPTIONS CONTRACT POSITIONS IN SPY, QQQ, IWM OR DIA AT THE TIME OF PUBLISHING THIS ARTICLE ***