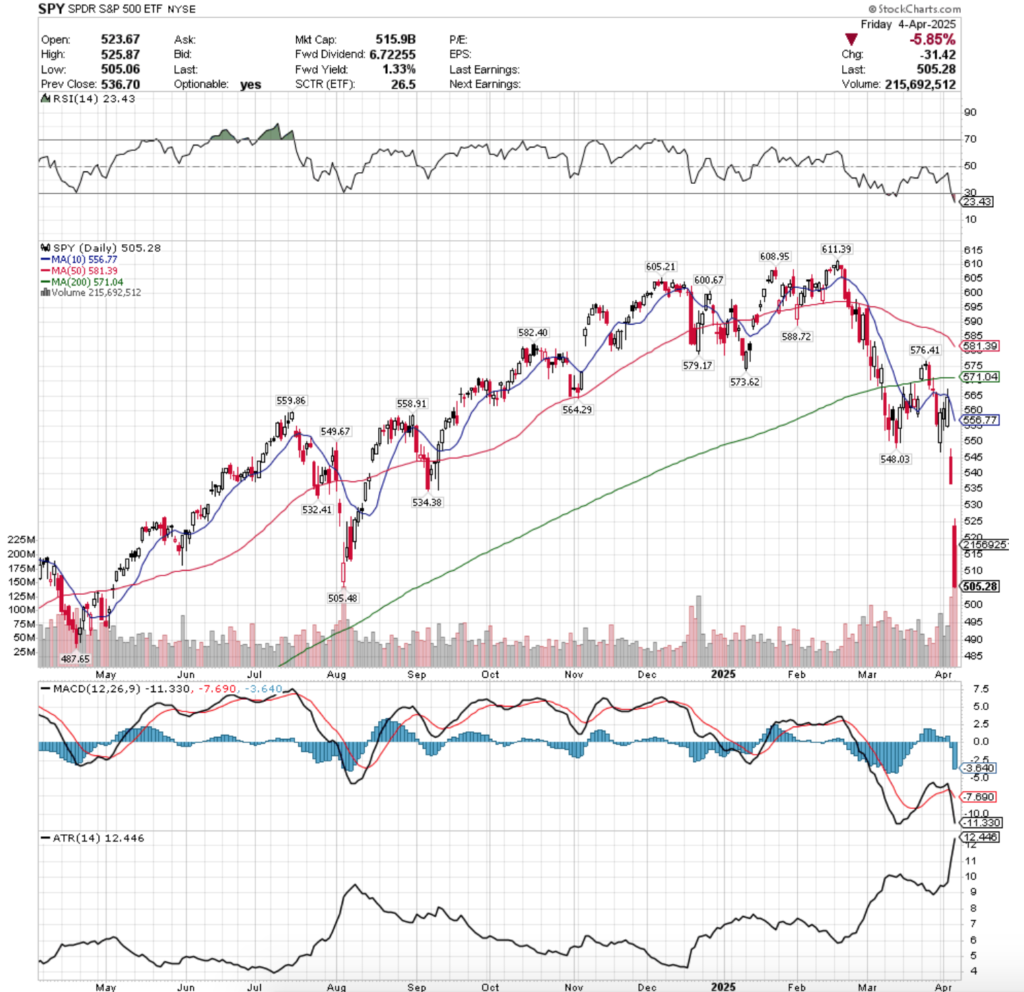
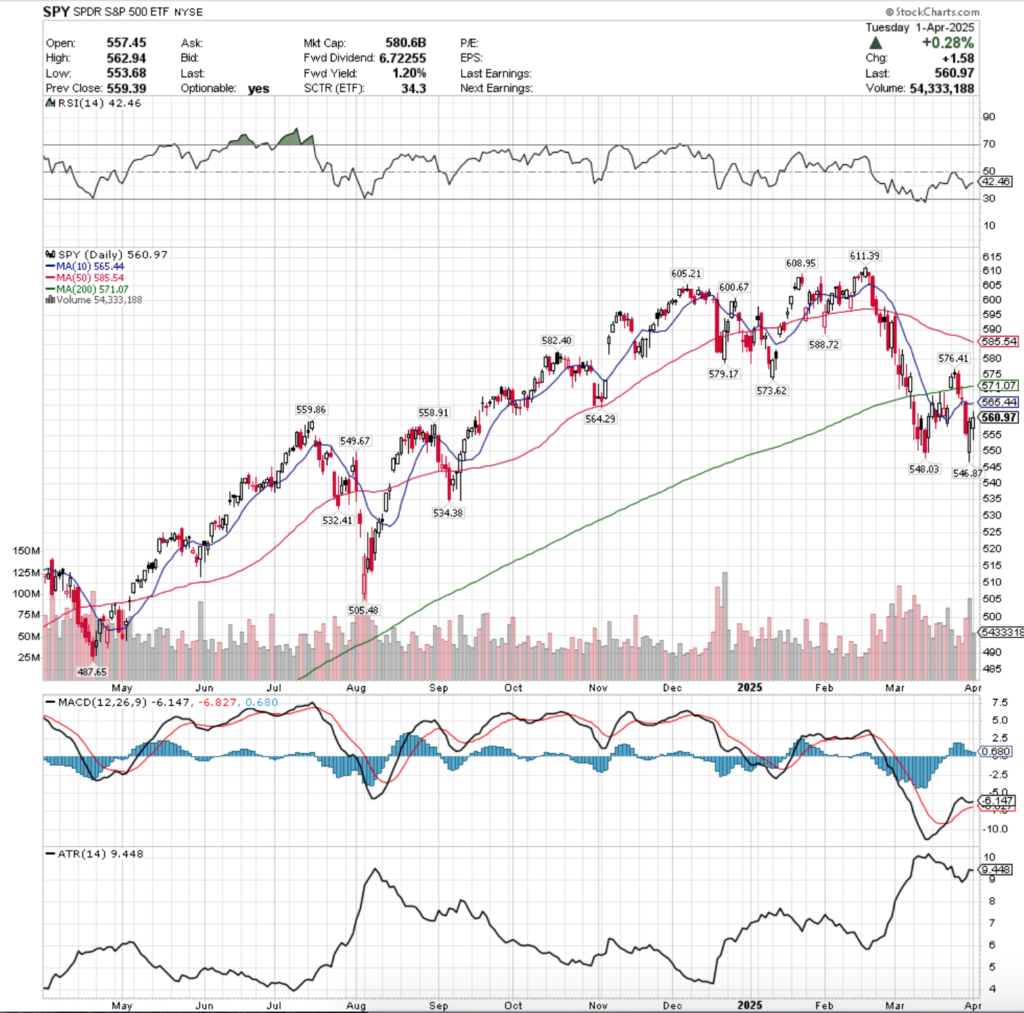
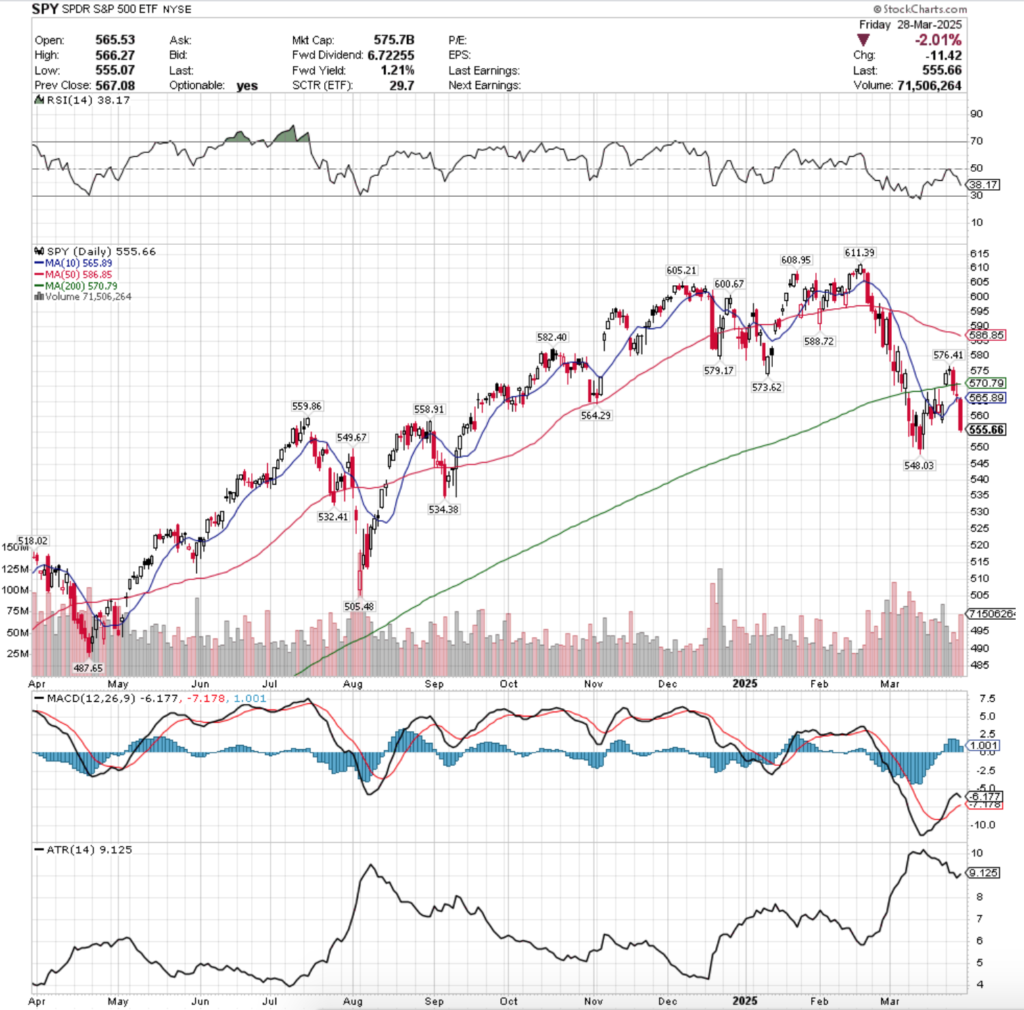
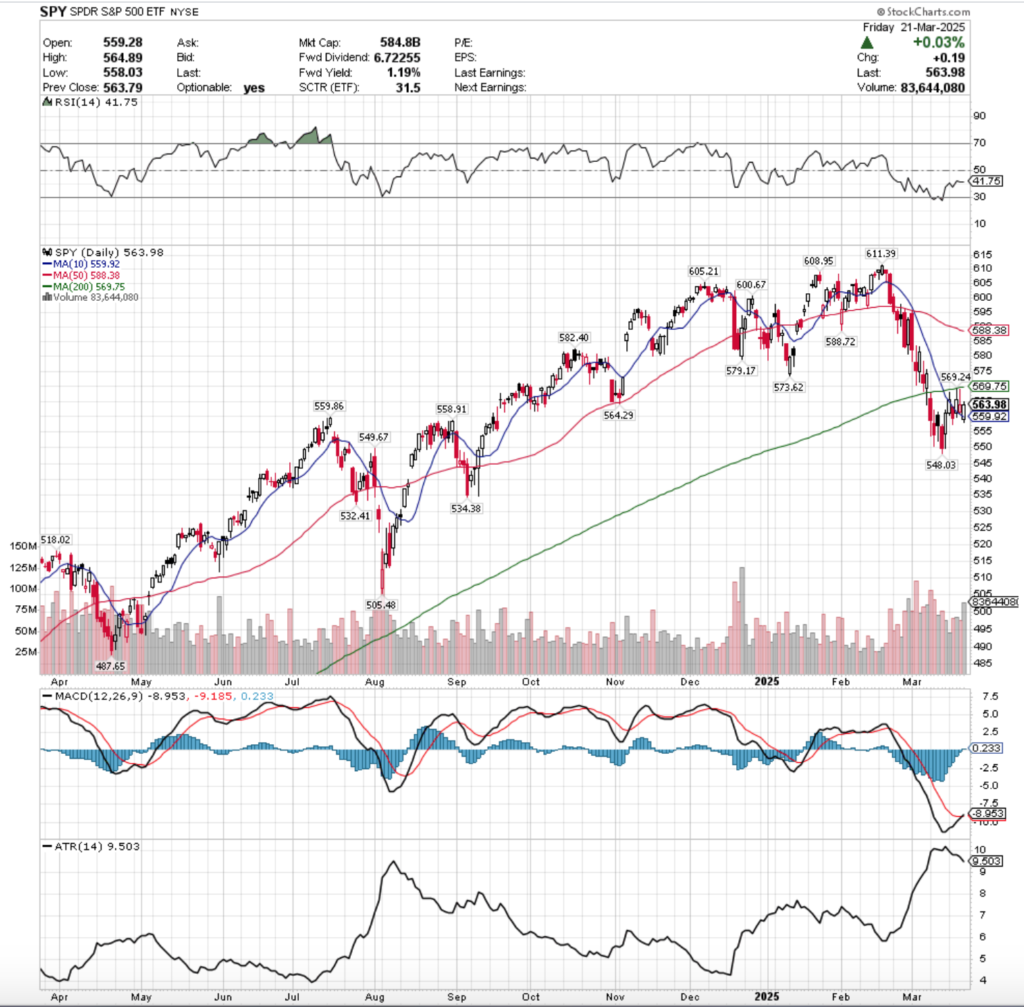
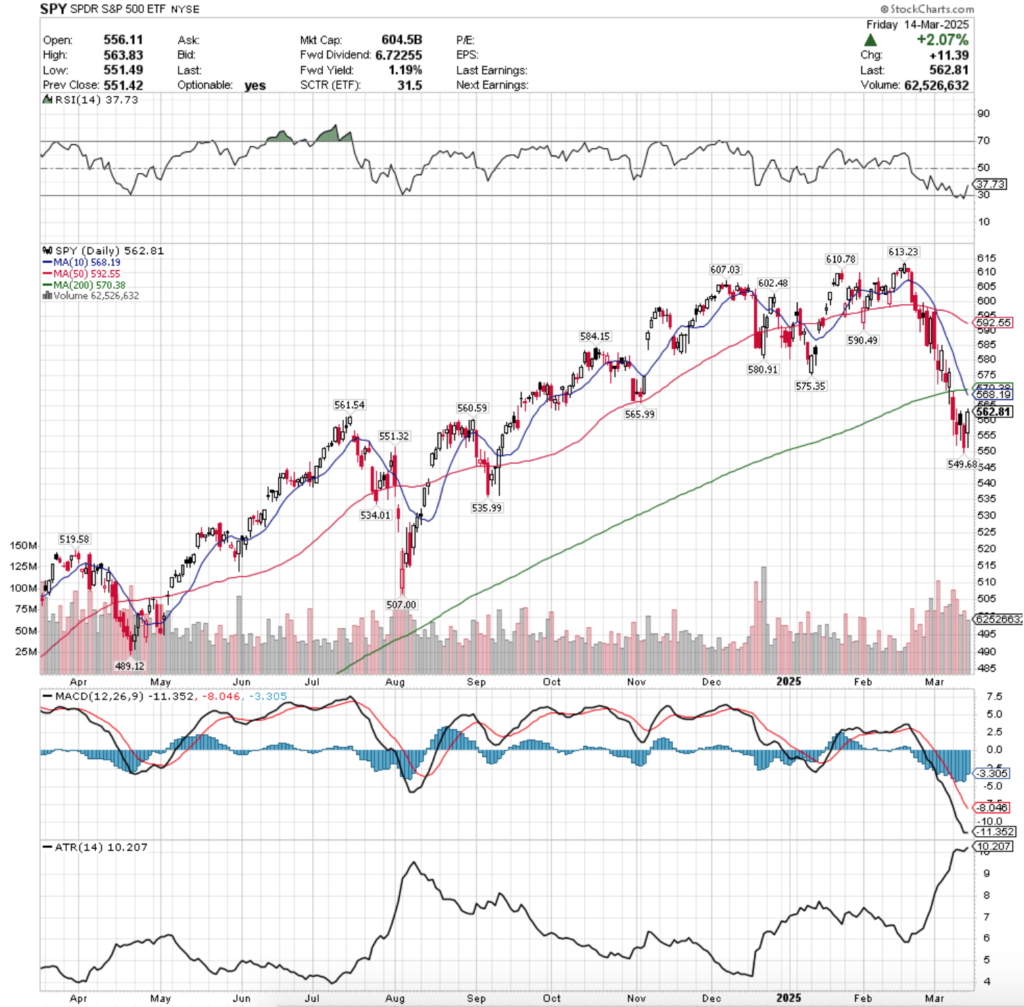
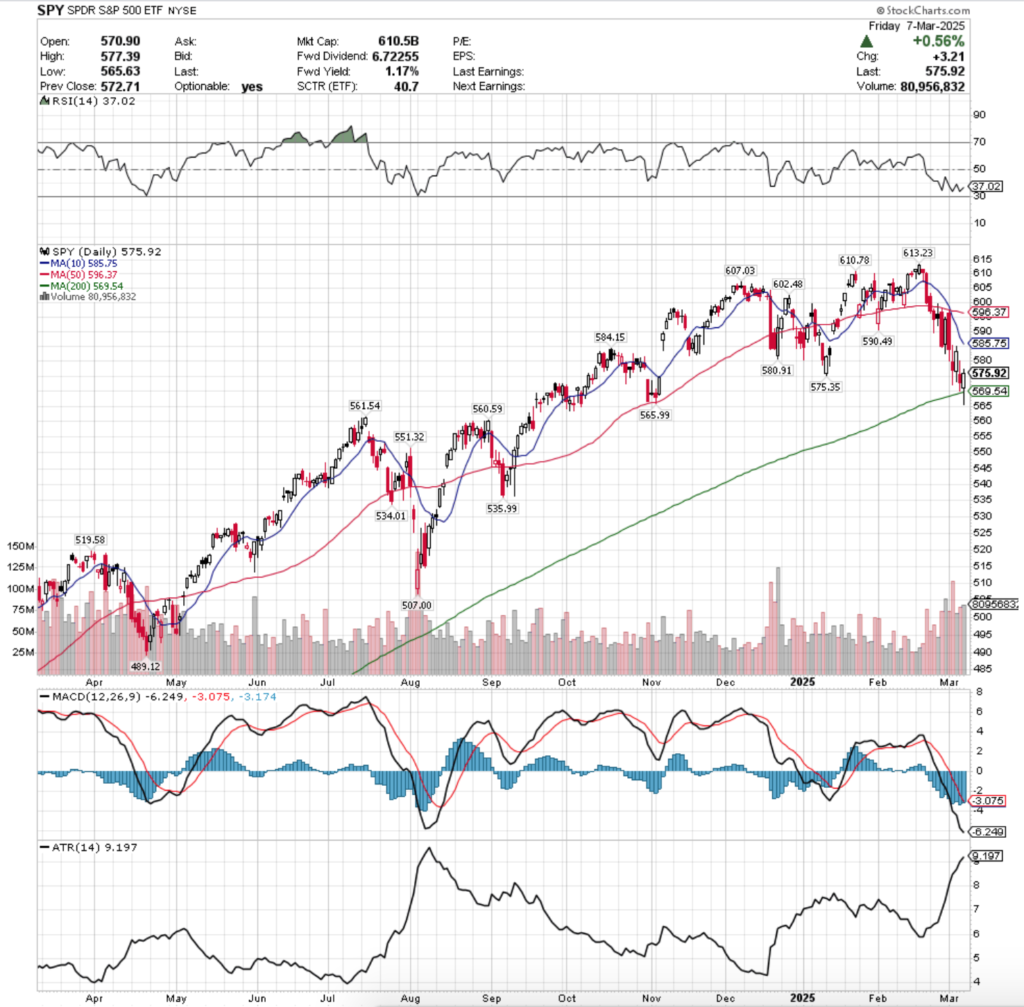
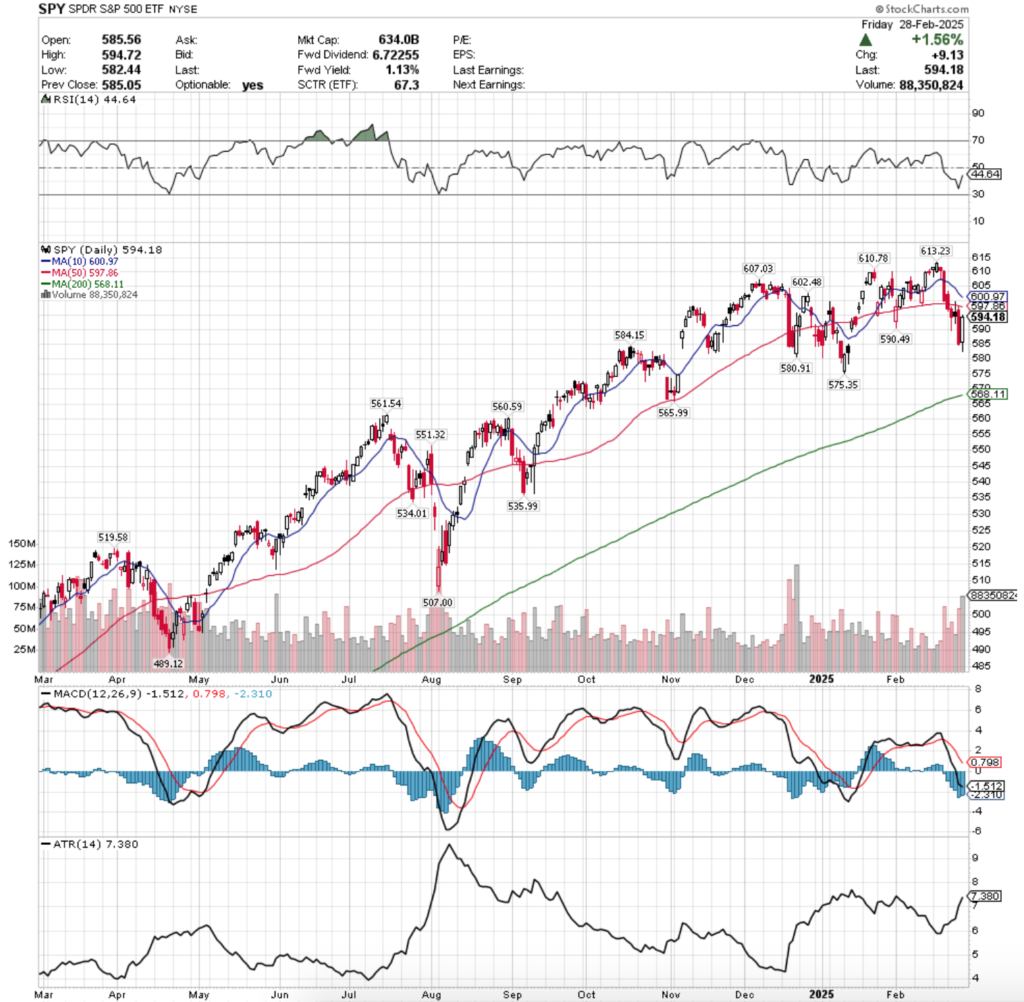
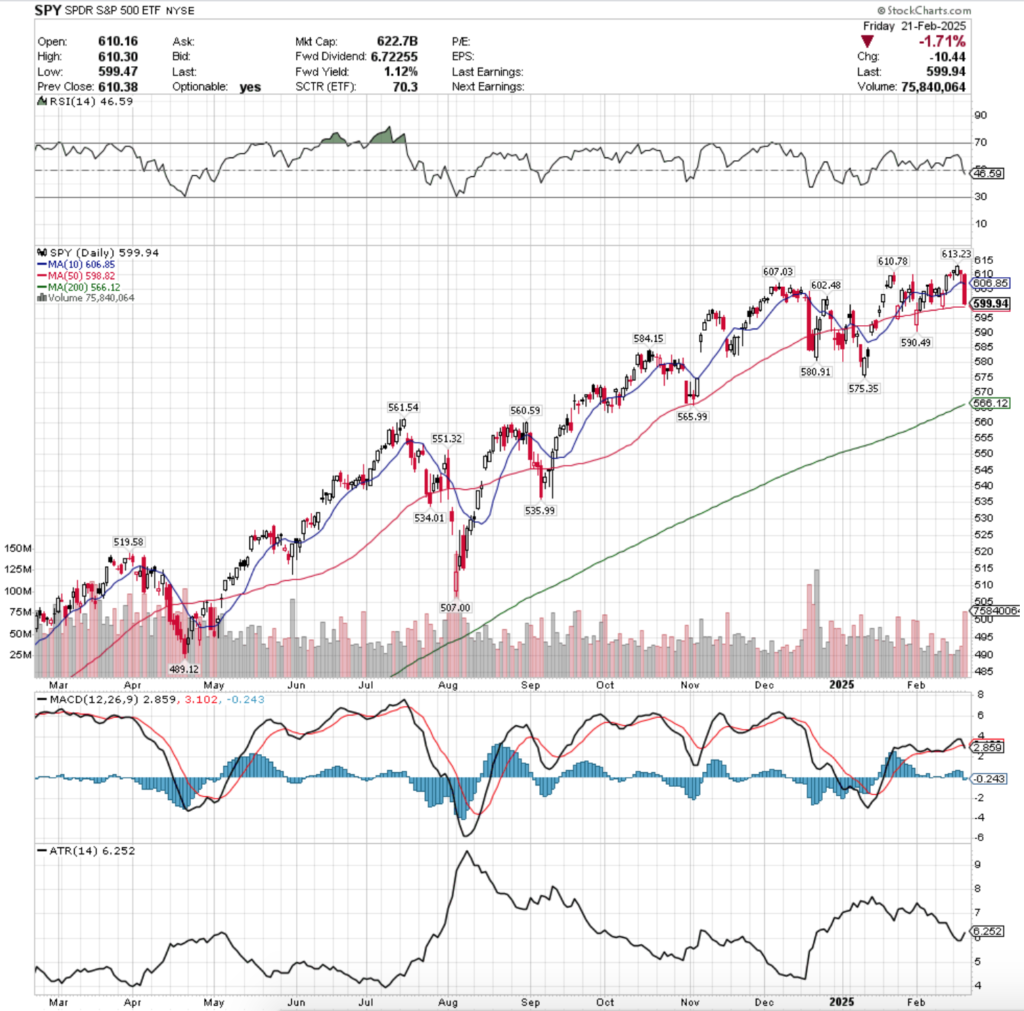
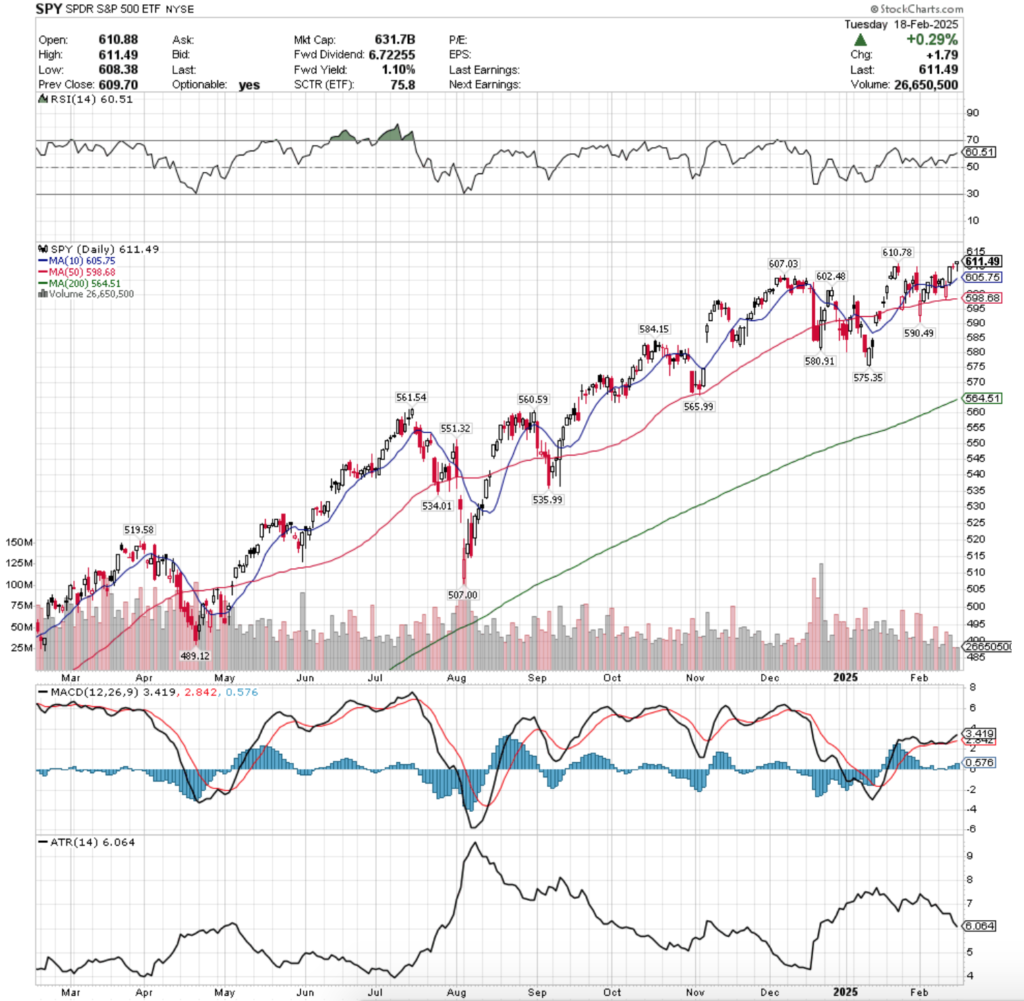
SPY, the SPDR S&P 500 ETF gained +5.67% last week, while the VIX closed the week out at 37.56, indicating an implied one day move of +/-2.37% & an implied one month move of +/-10.86%.
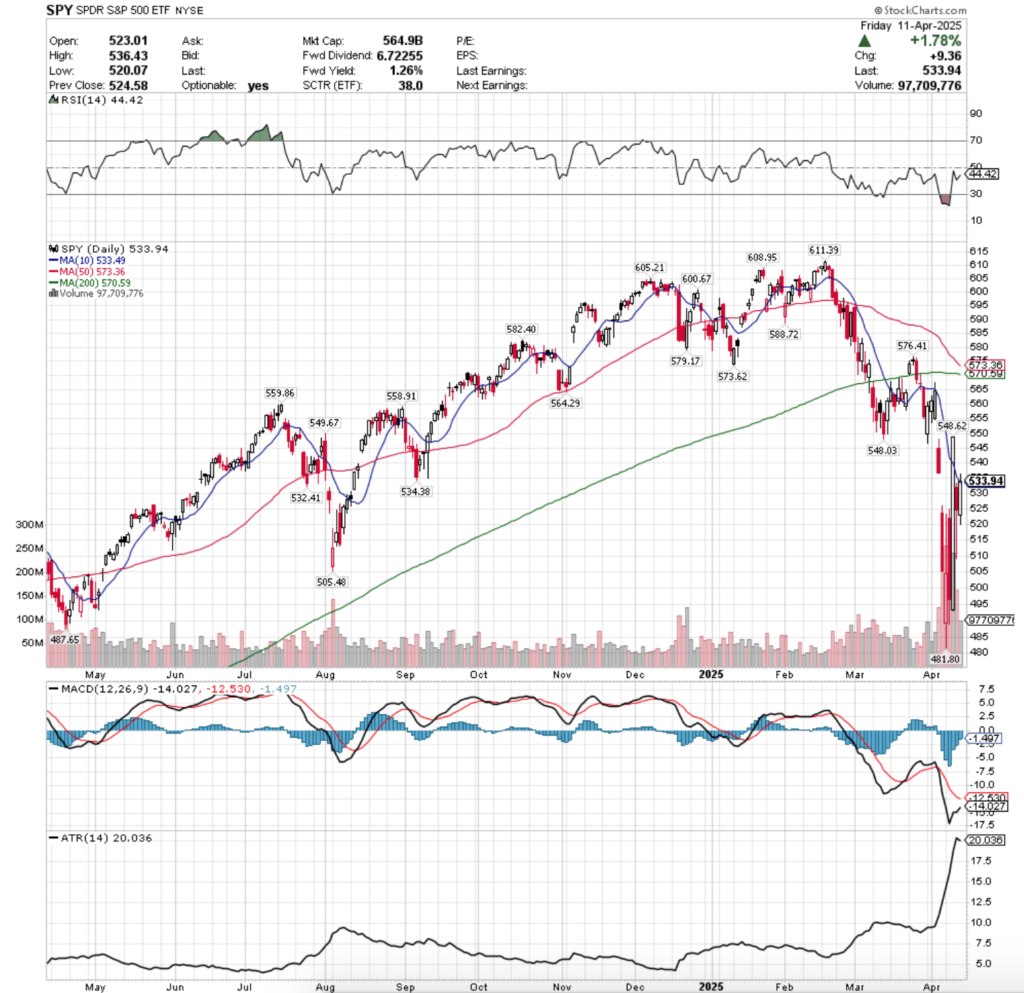
Their RSI is trending towards the neutral 50 level, sitting currently at 44.42, while their MACD is bearish, but approaching the signal line & the histogram is waning.
This isn’t indicative of a bullish crossover with strength on the horizon though, especially given that SPY’s 50 day moving average is poised to bearishly break through their 200 DMA forming a death cross by Wednesday.
Volumes were +230.5% higher than the previous year’s average (184,900,000 vs. 55,944,960), which is also cause for concern, as while Wednesday’s squeeze play resulted in a great deal of advancing volume, there’s still a significant amount of outflows for SPY & the other index ETFs.
Monday opened on a gap down & went as low as $481.80/share during the session, before rallying back to break above the $520/share level temporarily & close higher on the day at $504.38/share, which was higher than it opened.
Volumes that day were pronounced, which makes sense given the range that the day covered & the profit taking/pumping for later in the week that was taking place.
Tuesday SPY opened on a gap up & again made a run at the $525/share level, but was unable to find the footing & wound up closing for a decline on the session
Wednesday saw a major spike in both price & advancing volume for SPY, as a gap down open recovered to rally back +10.5% on the day, due to a whipsaw caused by tariff talk & the March FOMC minutes.
While the day’s volume was certainly high, it is not enough to constitute the consistent high volume SPY needs to form a base & while it can be enjoyed, it is not a signal that all has recovered & to be bullish.
The bullish engulfing candle did manage to break above & close above the 10 day moving average’s support, which hadn’t happened in weeks.
Along came a bearish harami pattern with Thursday’s session though, where elevated volumes led to a decline.
Thursday’s lower end of the day’s range is something to be concerned about, as it temporarily dipped below the $510/share level before recovering to close at $524.58/share, indicating that there is still a lot of bearish sentiment in the market.
Mixed signals continued into the weekend, as Friday’s session closed with a +1.78% gain, just a hair above the 10 day moving average’s support, but on less than half of the volume that Wednesday’s advancing session had, so there is no consistent elevated bullish volume sentiment, despite two bullish days.
Heading into this week the bullish case stays the same as it has over the past month now, without substantial, consistent higher advancing volumes there is unlikely to be a base formed where SPY can take off from to rally higher.
Should we see higher levels of consistent participation in the market on advancing days then we can begin to look at resistance levels being tested & broken, but for now we’re not set up for that yet.
What is more likely to happen is there will be some consolidation & oscillation around the 10 DMA, until the death cross of the 50 & 200 DMAs takes place, at which point we see some support levels tested.
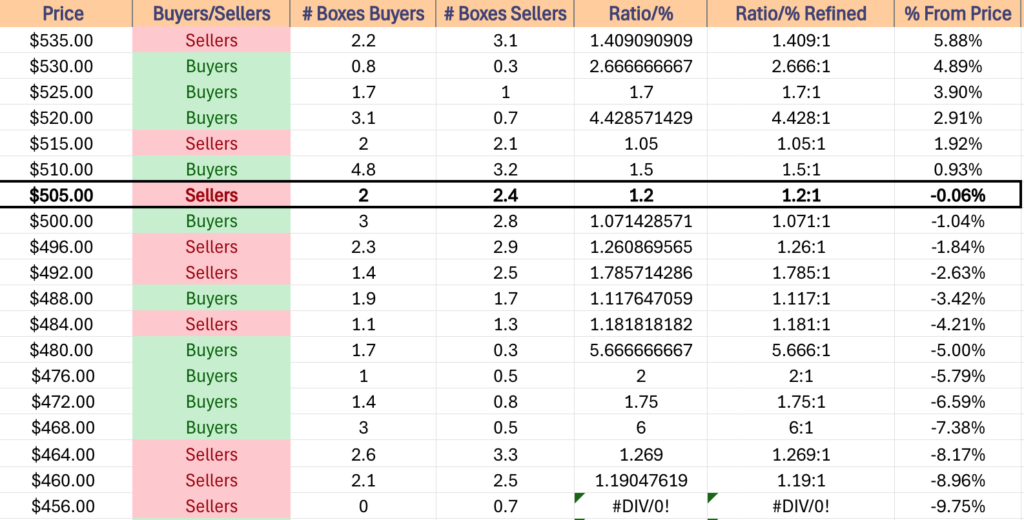
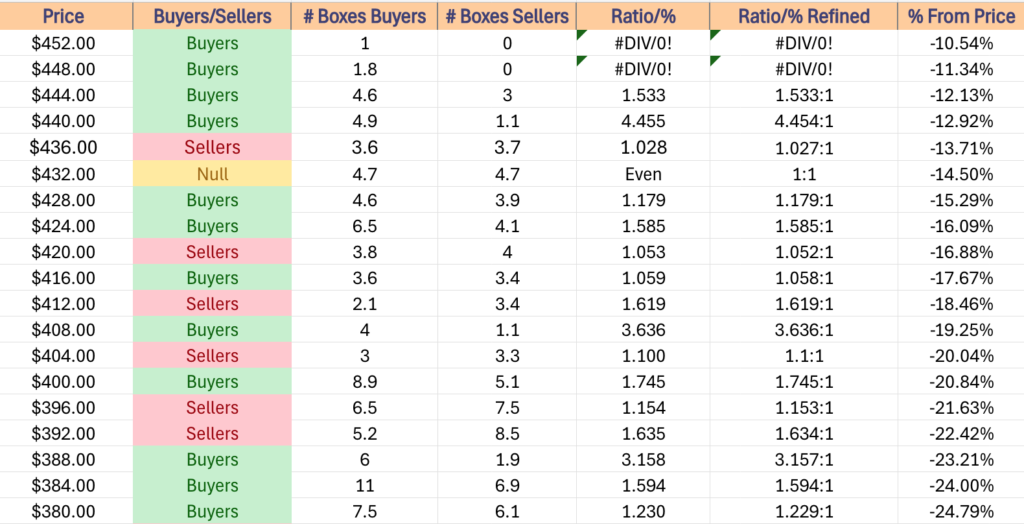
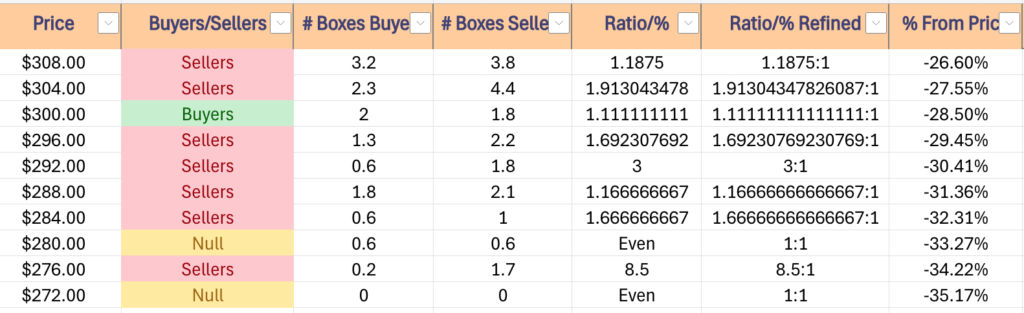
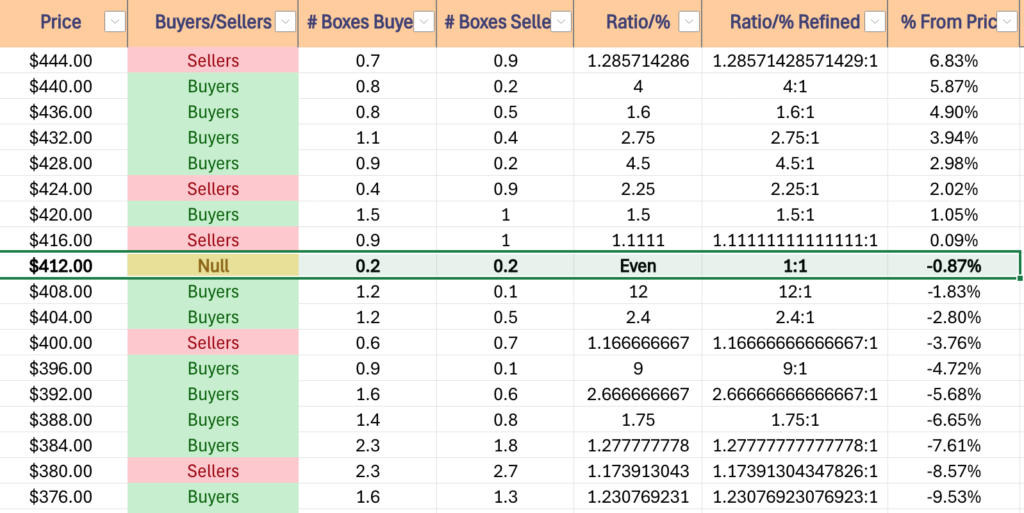
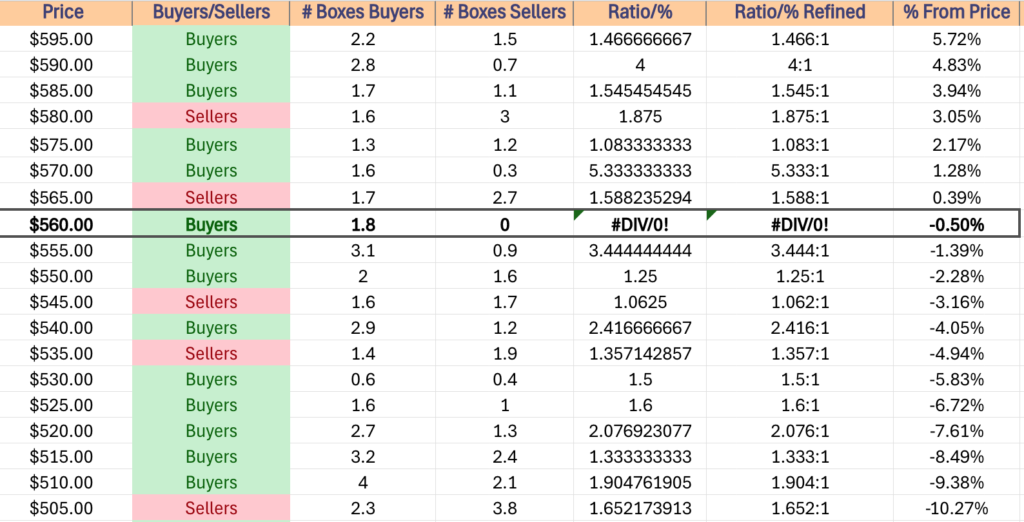
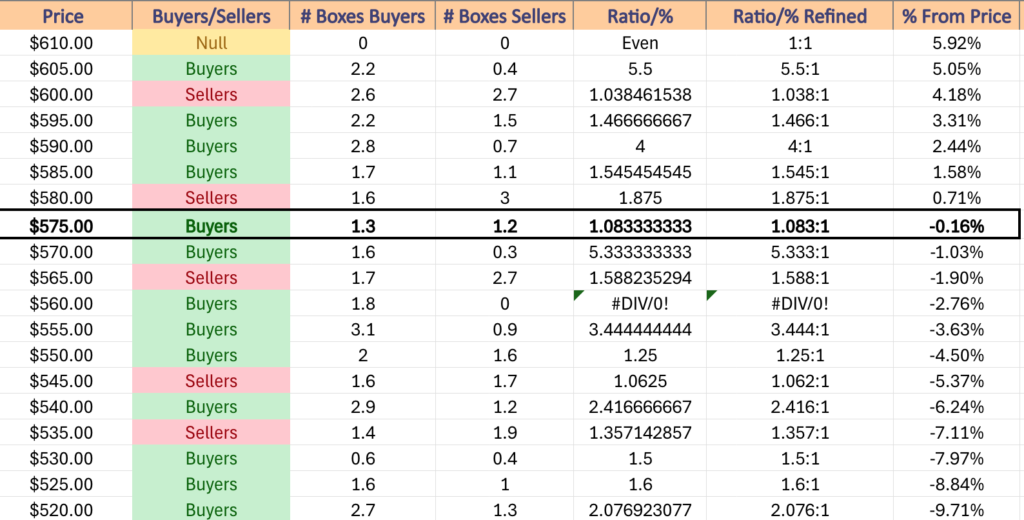
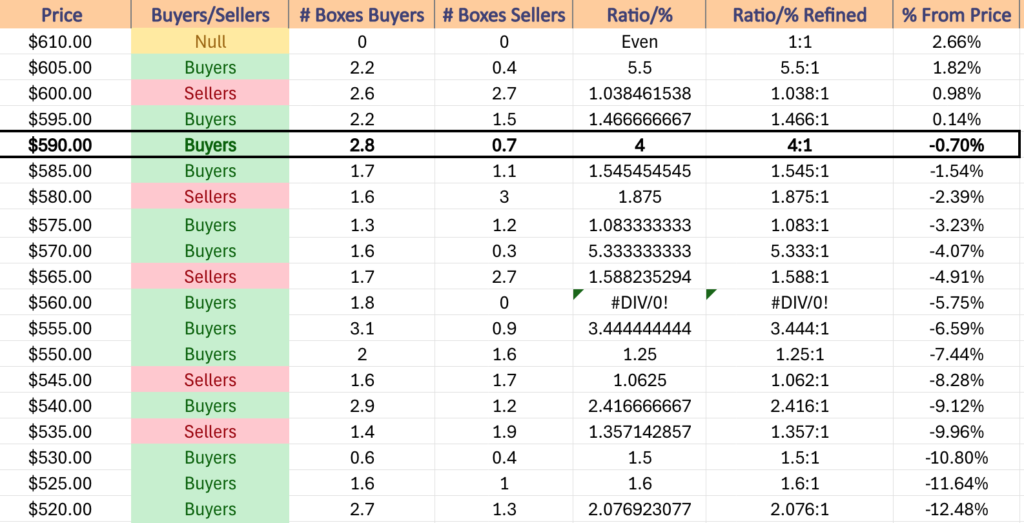
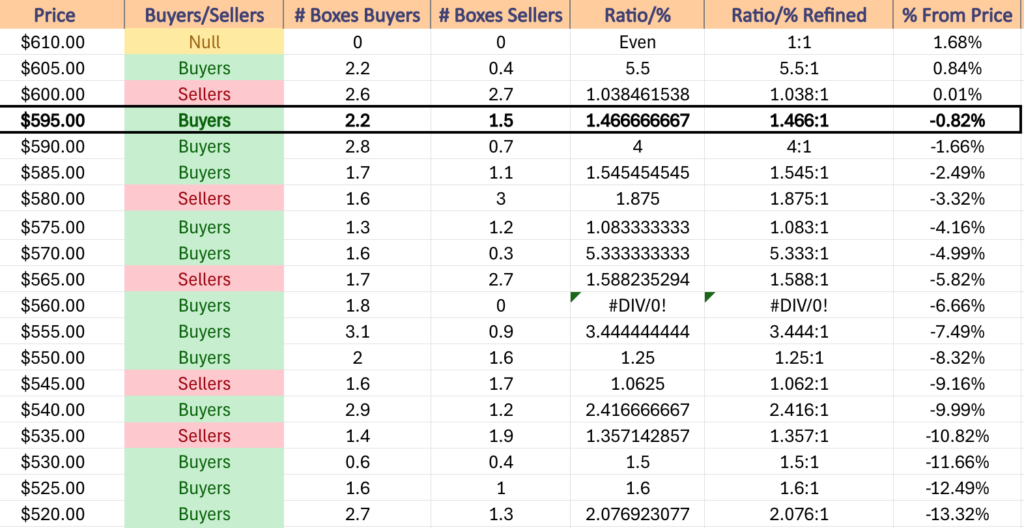
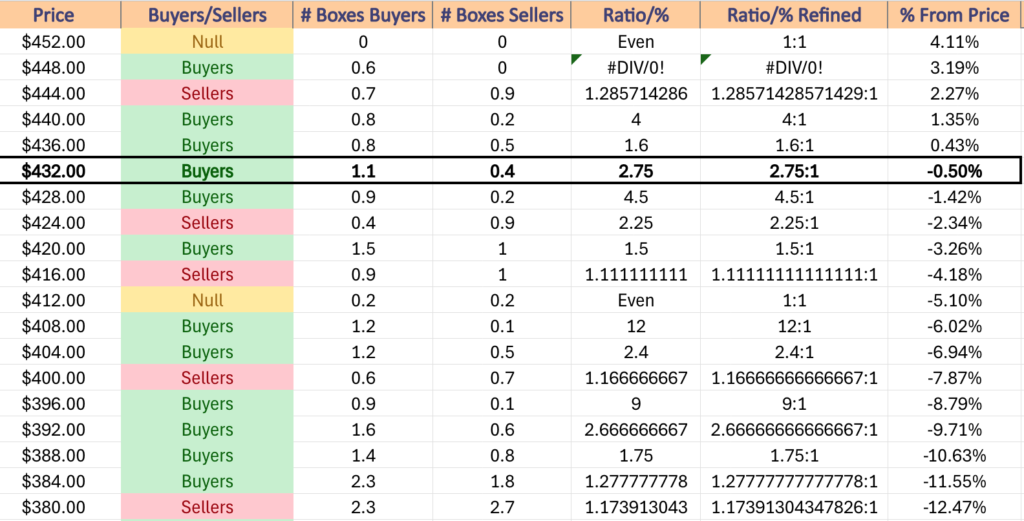
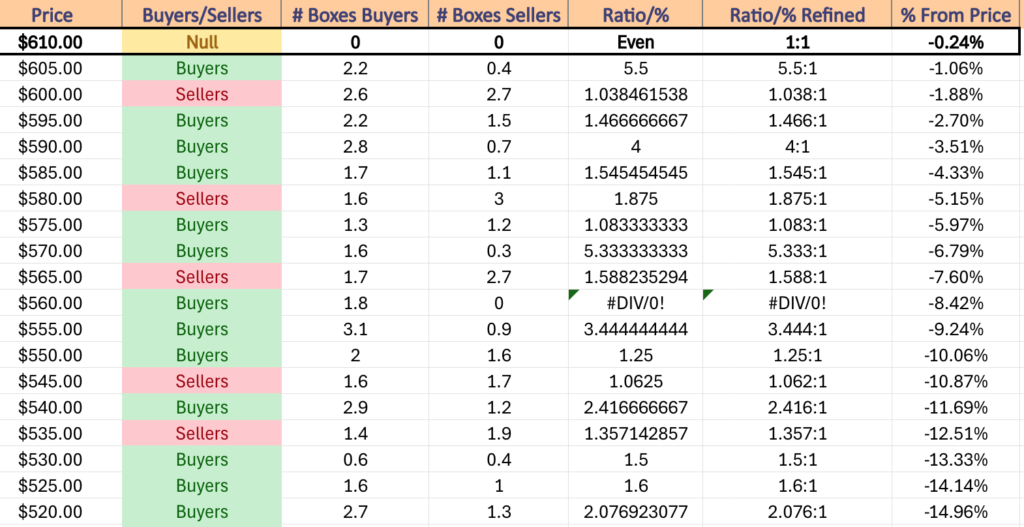
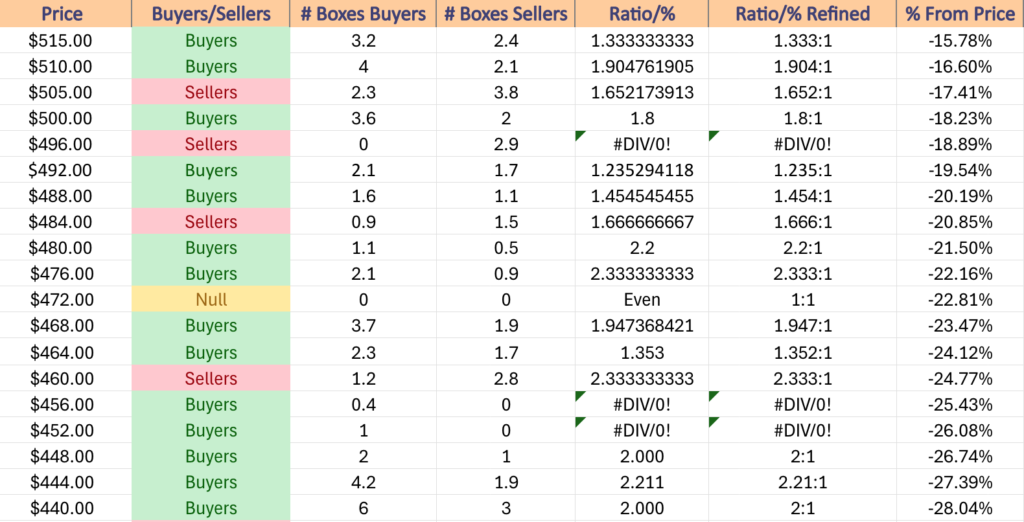
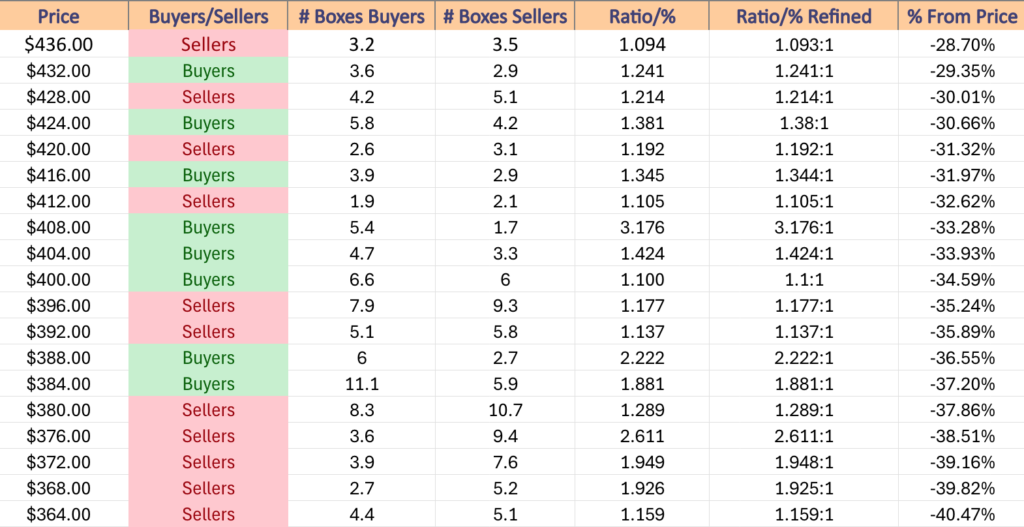
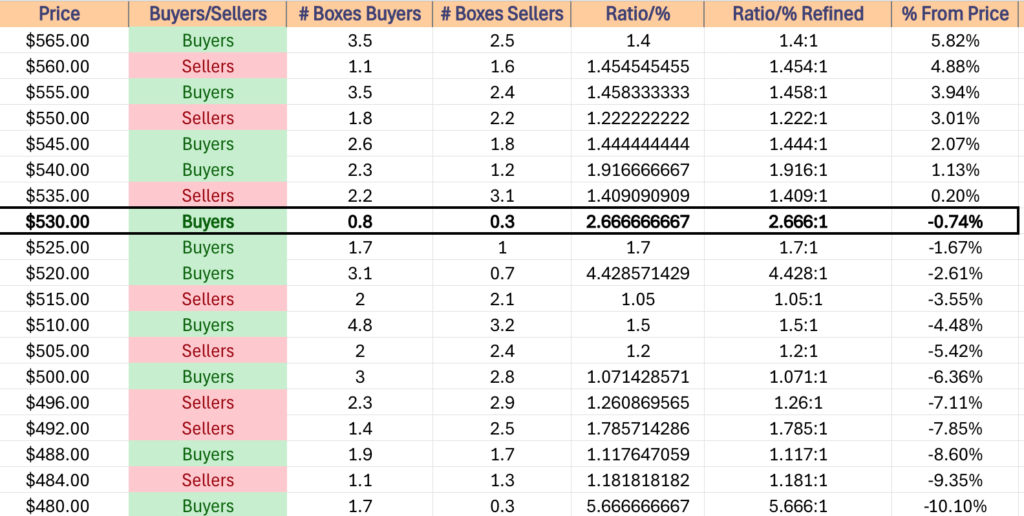
The consolidation would likely remain within the wide range of Wednesday’s candle (10.5% is a lot of wiggle room, granted), while any downside moves will be interesting, as Buyers have historically liked the price level that SPY is in now & its next two support levels, but if we break down through those we enter Seller territory again, as shown below.
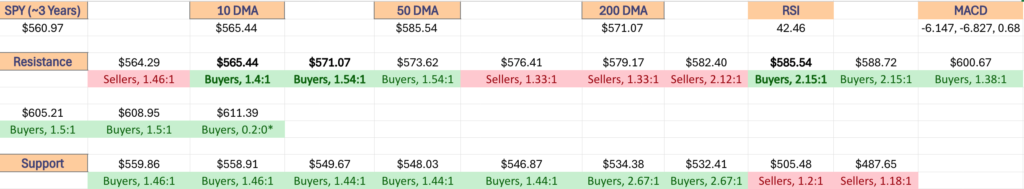
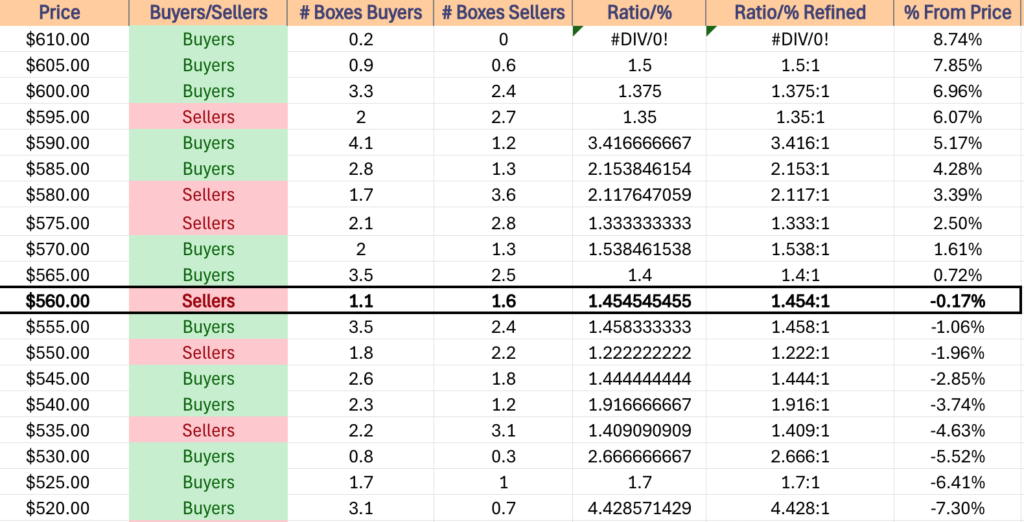
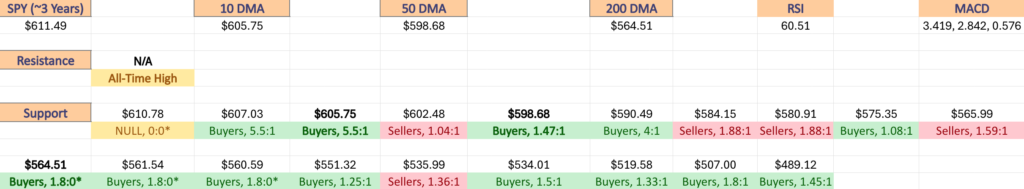
SPY has support at the $533.49 ( 10 Day Moving Average, Volume Sentiment: Buyers, 2.67:1), $532.41 (Volume Sentiment: Buyers, 2.67:1), $505.48 (Volume Sentiment: Sellers, 1.2:1) & $487.56/share (Volume Sentiment: Sellers, 1.1:1) price levels, with resistance at the $534.38 (Volume Sentiment: Buyers, 2.67:1), $548.03 (Volume Sentiment: Buyers, 1.44:1), $548.62 (Volume Sentiment: Buyers, 1.44:1) & $549.67/share (Volume Sentiment: Buyers, 1.44:1) price levels.
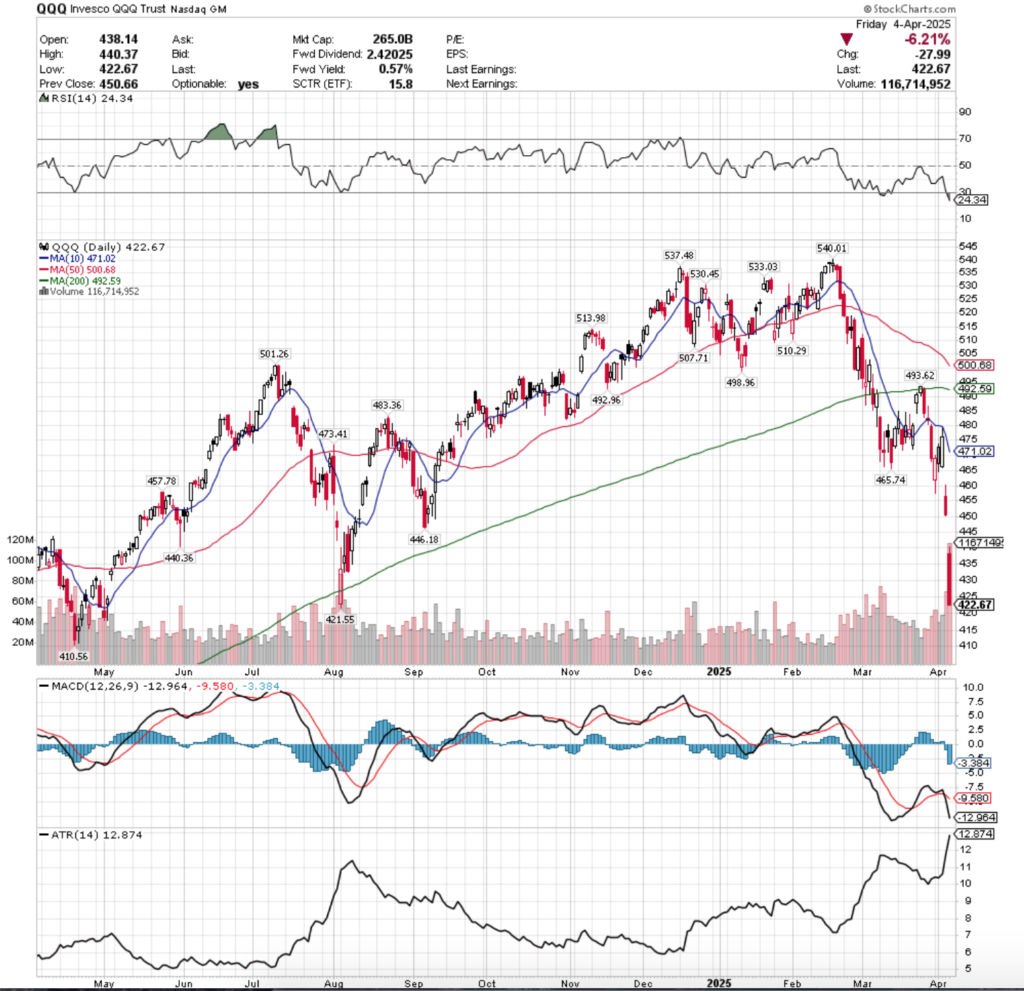
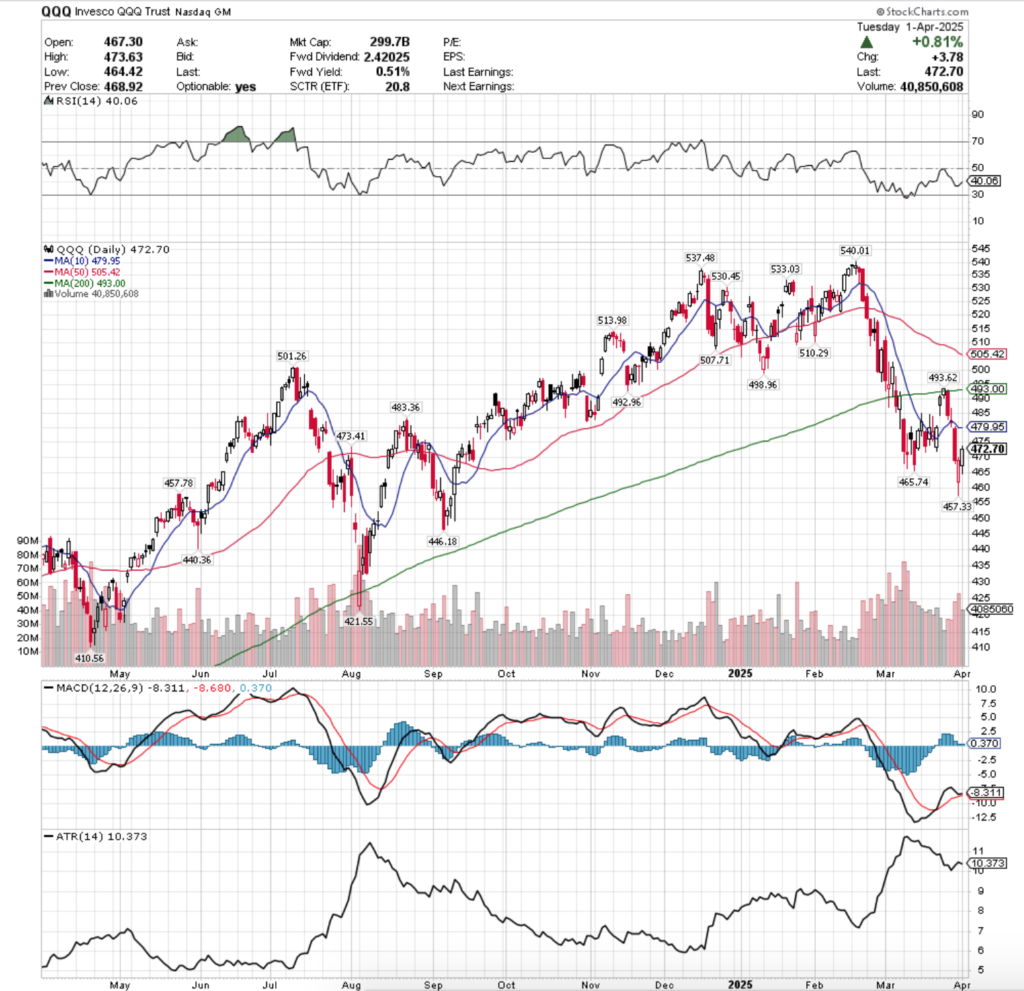
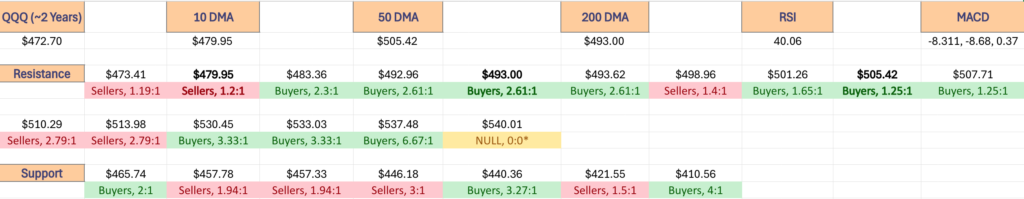
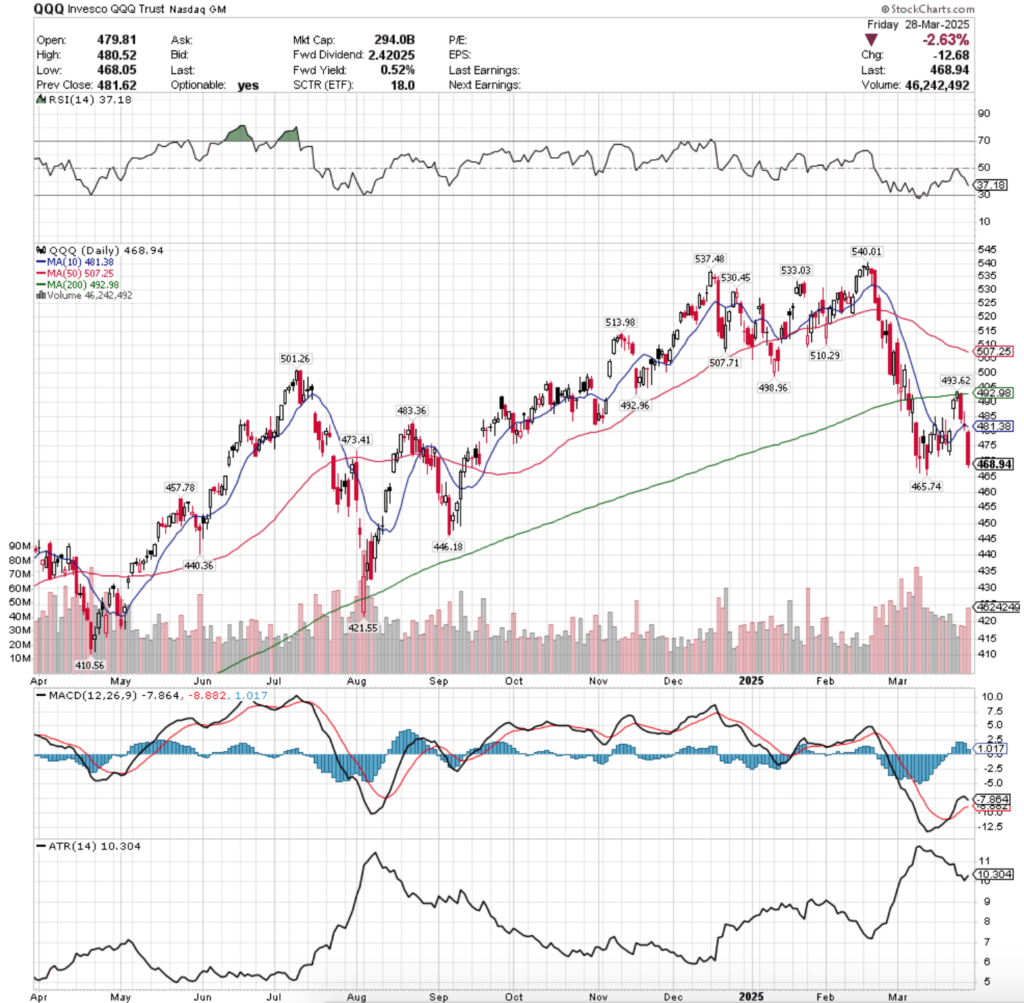
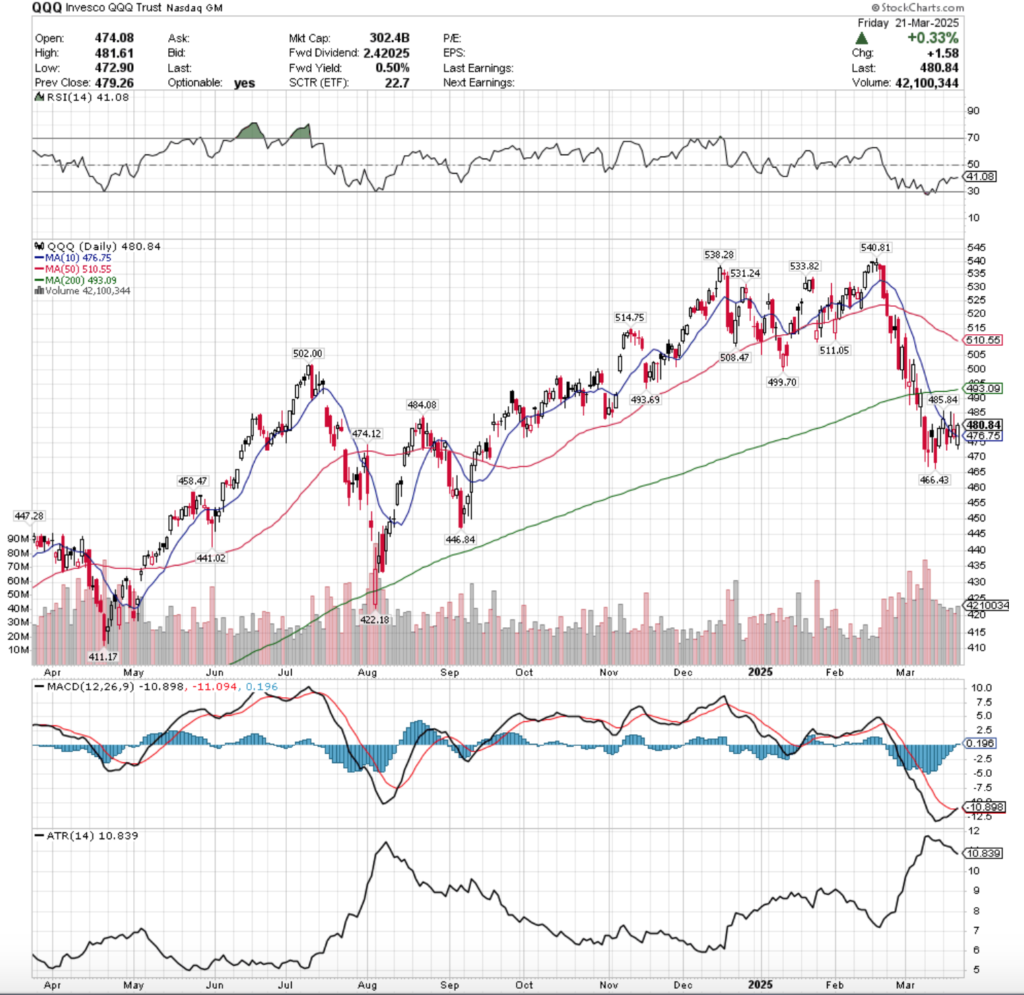
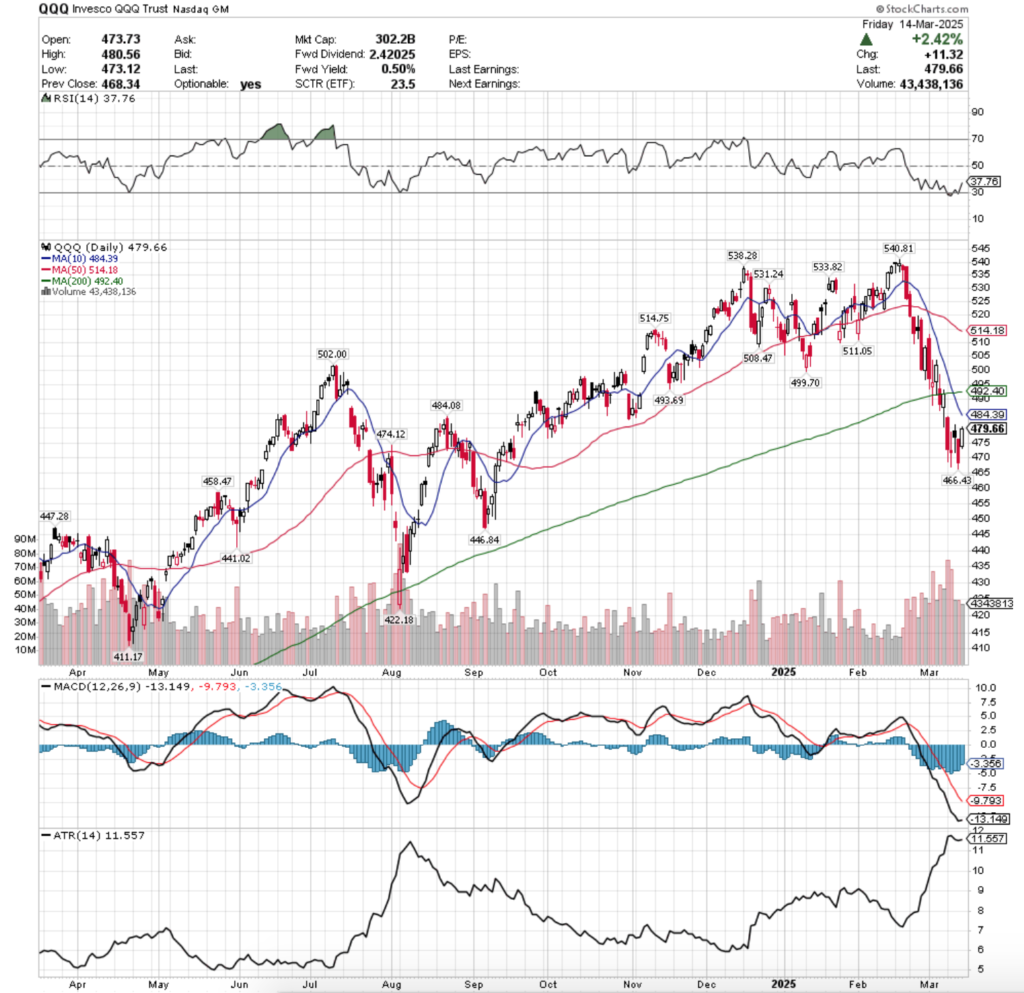
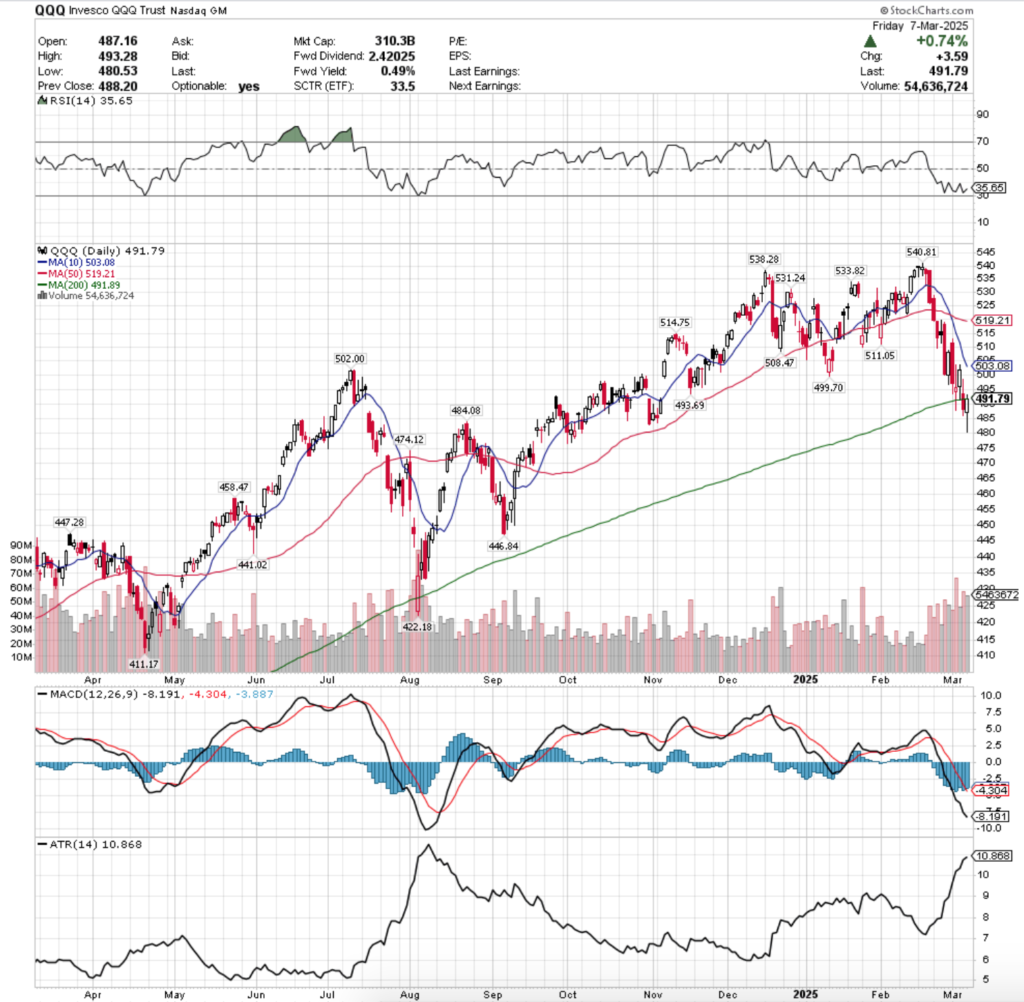
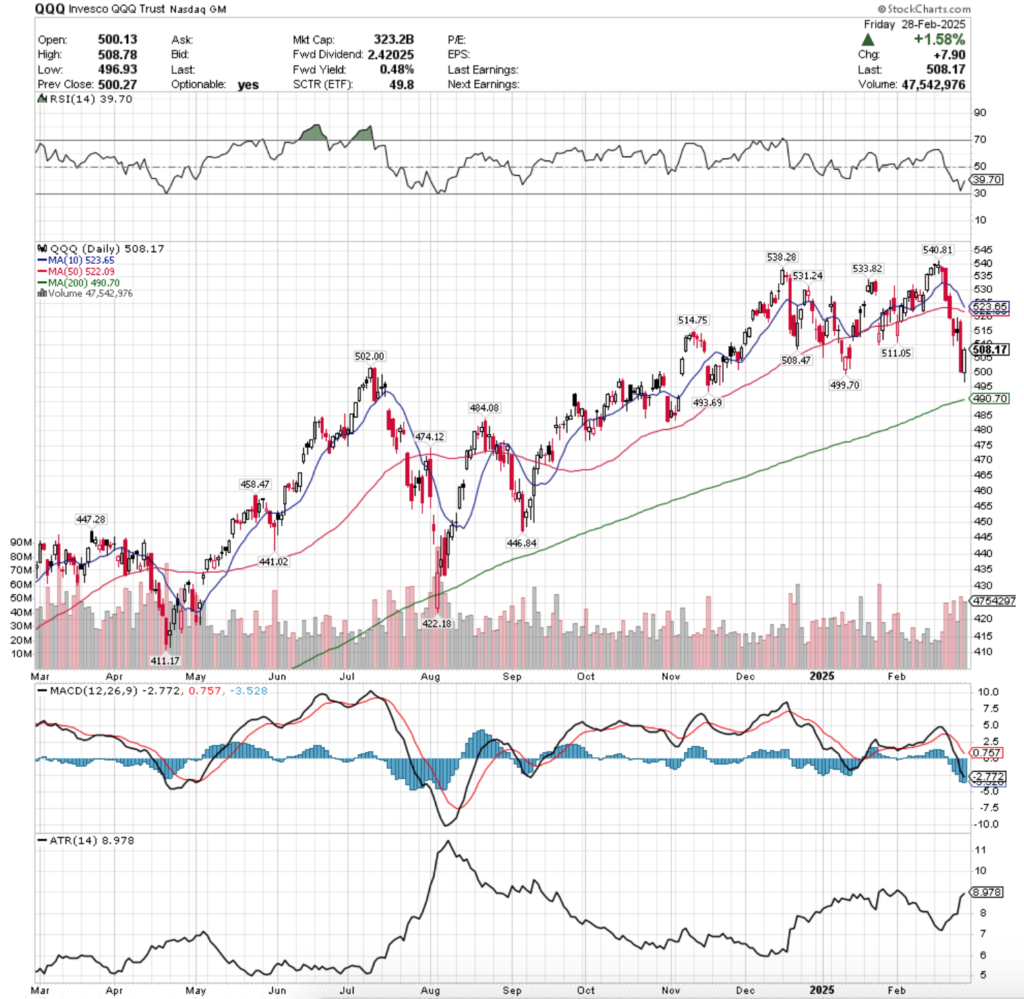
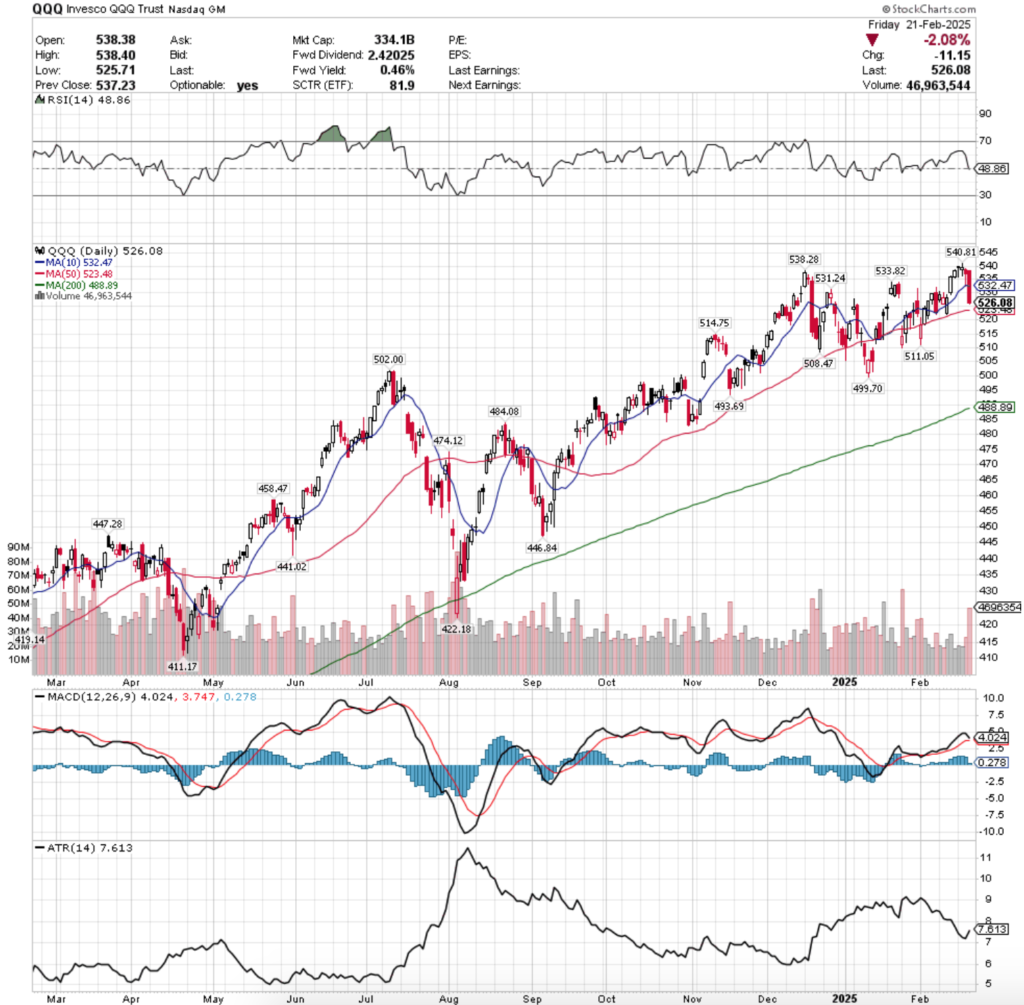
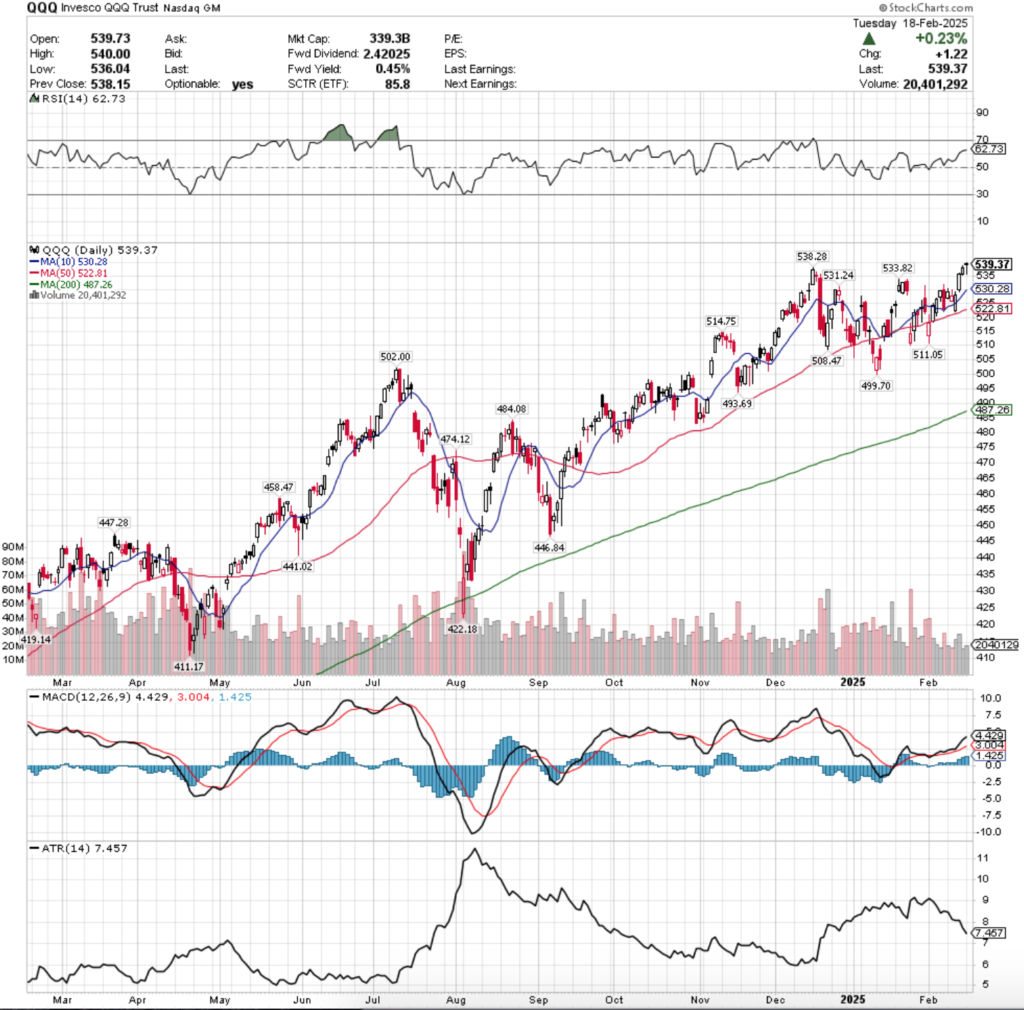
QQQ, the Invesco QQQ Trust ETF advanced +7.51%, as the tech-heavy index was the favorite among the major four for the week.
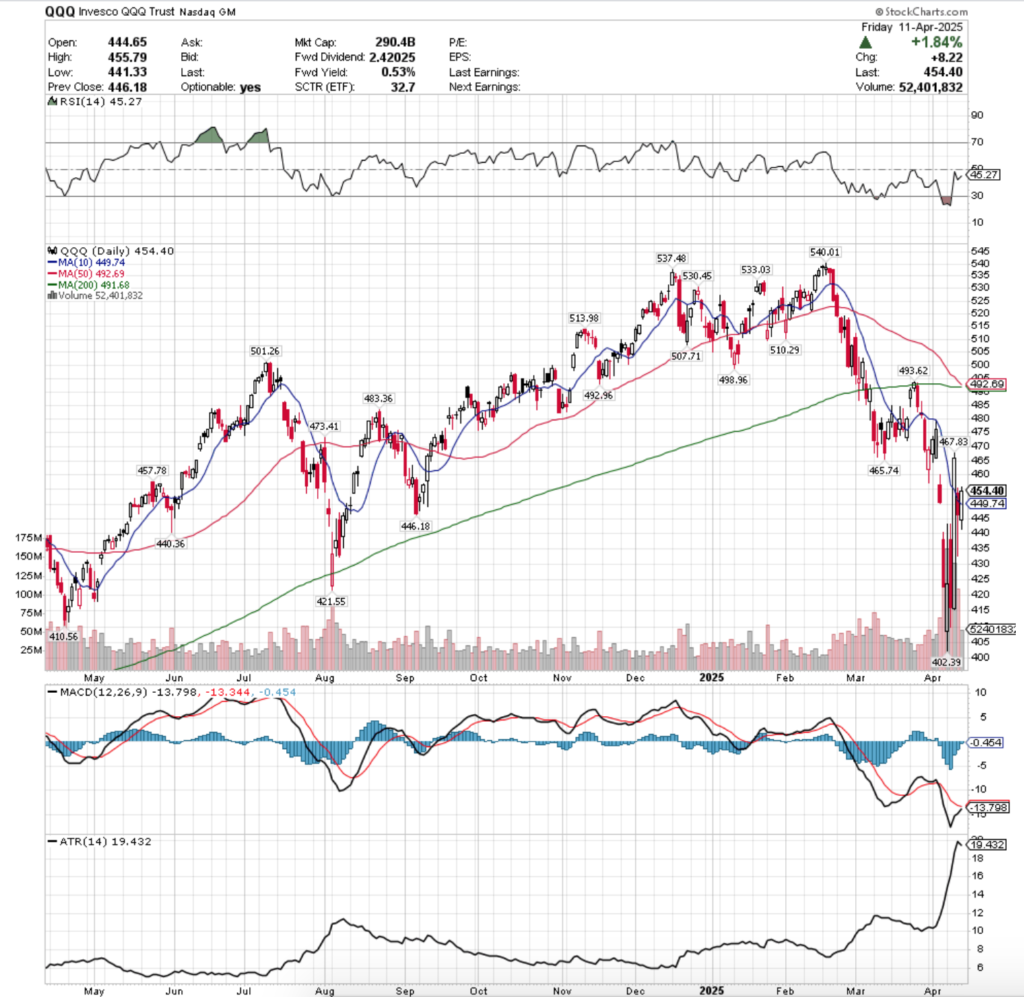
Their RSI is climbing towards the neutral 50 mark, while the MACD looks primed to cross the signal line bullishly by Tuesday, but given their volume situation it may be more of a temporary dolphin jump for air than an actual bullish move.
Volumes were +305.92% above the prior year’s average level (113,310,000 vs. 37,039,286), which like SPY’s has a lot of questions to be asked about it, particularly as they both have seen similar performance, but with different volume trends.
QQQ’s past week also closely resembled SPY’s across the board, leading off on Monday with a gap down that tested as low as $402.39/share where it found support to bounce from & test higher to above the $440/share level & to close higher than it opened on the day at $423.69/share.
This occurred on the week’s highest volume, which is important as the day covered a wide range of prices, so it shows market participants were highly engaged & that the day wasn’t just fluff tape.
Tuesday opened on a gap up, tested higher to about Monday’s high & it all went south from there, quickly, leading to declines on the week’s second lowest volume, but still still ~2x the prior year’s average, indicating that there was a lot of risk-off sentiment to bag up Monday’s gains.
Wednesday mirrored SPY’s performance to a degree, where the second highest volume session of the week broke above the short-term trend line to close above $465/share.
What’s troubling about it though is that Thursday’s session produced a bearish harami pattern with a long lower shadow as well that showed support really wasn’t until the $432.63/share level & that the short-term trend line will likely not hold up.
Friday brought along a bullish engulfing candle, but on volume so weak that it was hardly a drop in the bucket compared to the previous four days (it was ~50% of the second lowest session’s volume).
Like SPY, QQQ’s upside story lies solely in what happens when they get some sustainable higher volume, which doesn’t look like it’s going to happen anytime soon still, particularly with their 50 & 200 DMA’s set to death cross by Tuesday.
While some might say Monday was a major volume spike that could signal a reversal, there is not yet enough confirmation, and the rest of their chart & data don’t suggest that confirmations coming just yet.
Their death cross-over is coming between today & tomorrow, which will apply downward pressure on QQQ, along with potential bad news coming from earnings reports (Tuesday features a handful of names that while not in the NASDAQ, may cause problems wider-spread).
It’s likely we see QQQ consolidate within the confines of Wednesday’s candle’s range while oscillating around the 10 DMA, like we’ve been expecting most weeks over the past month+.
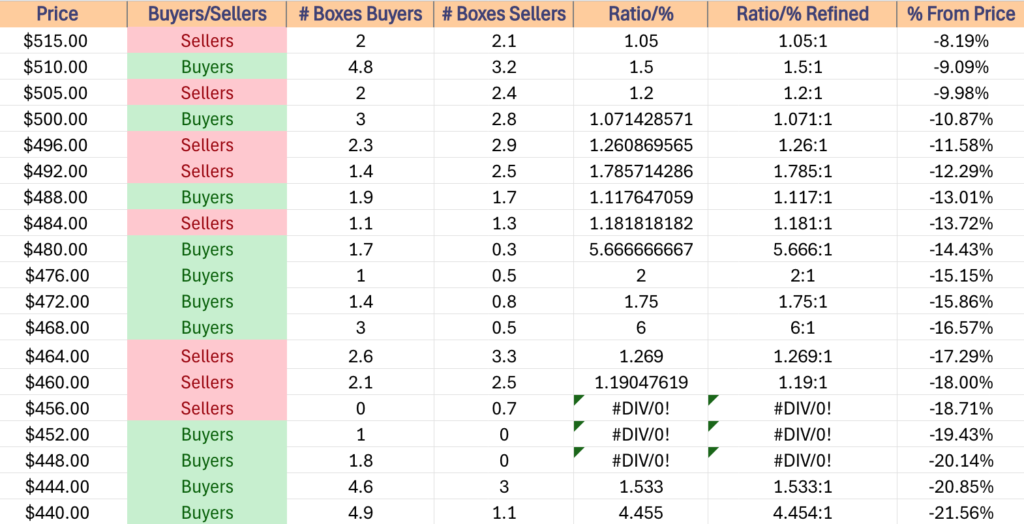
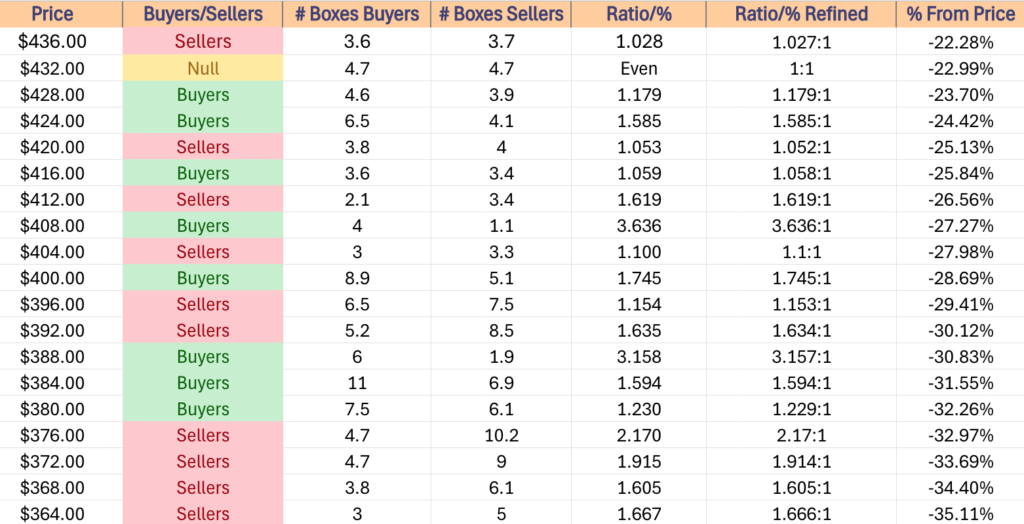
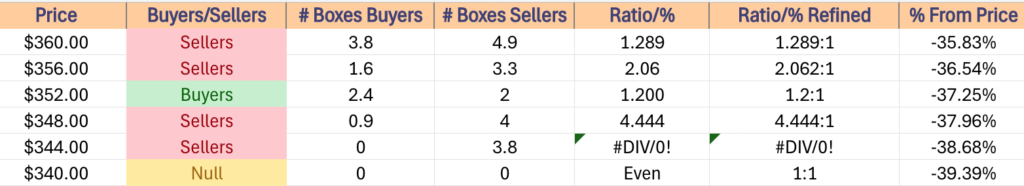
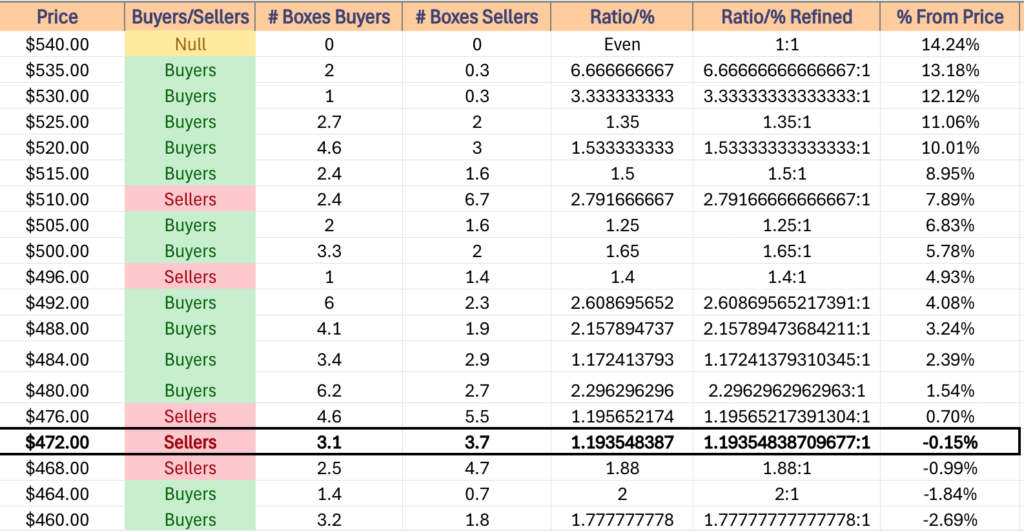
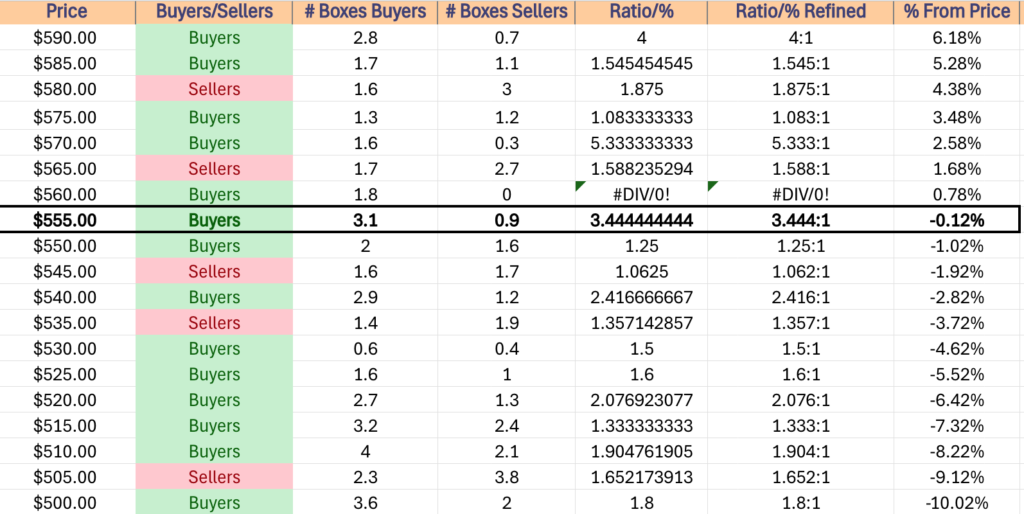
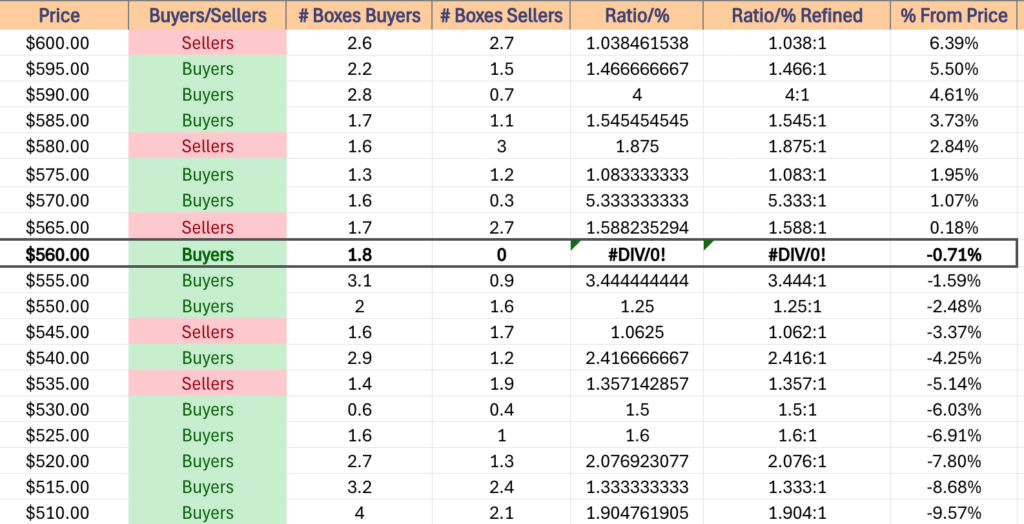
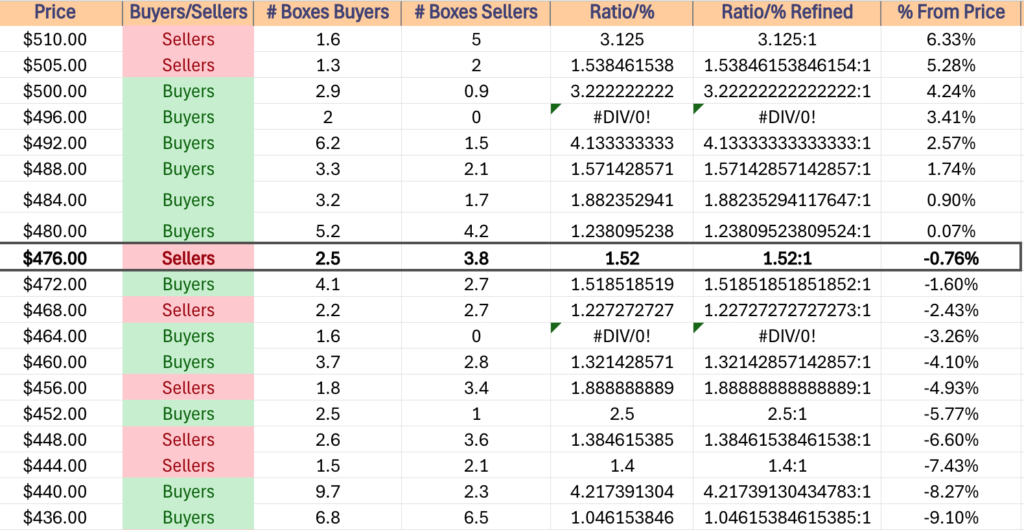
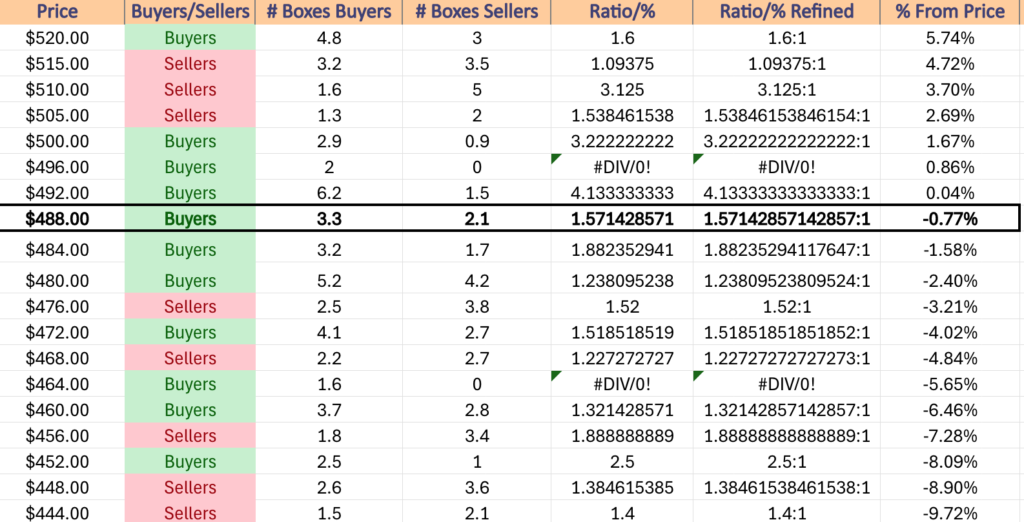
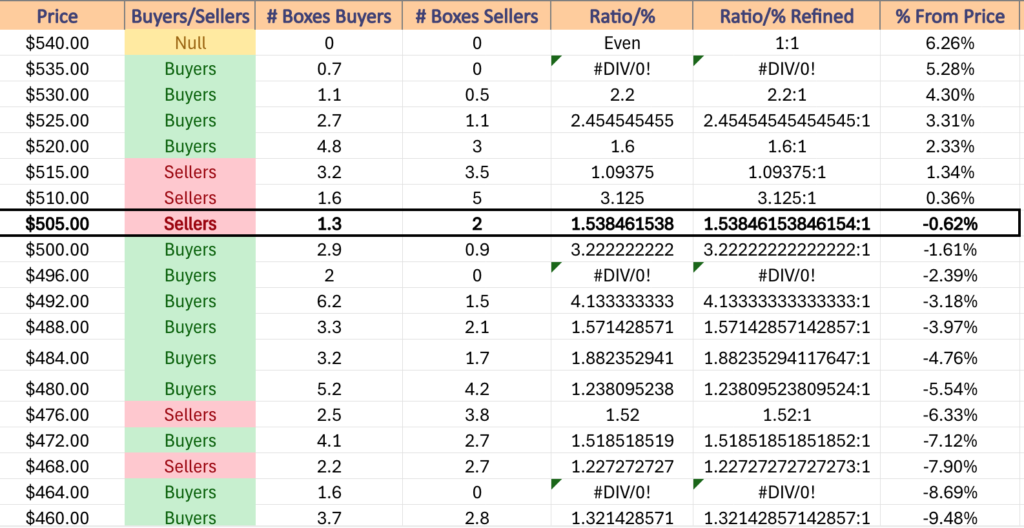
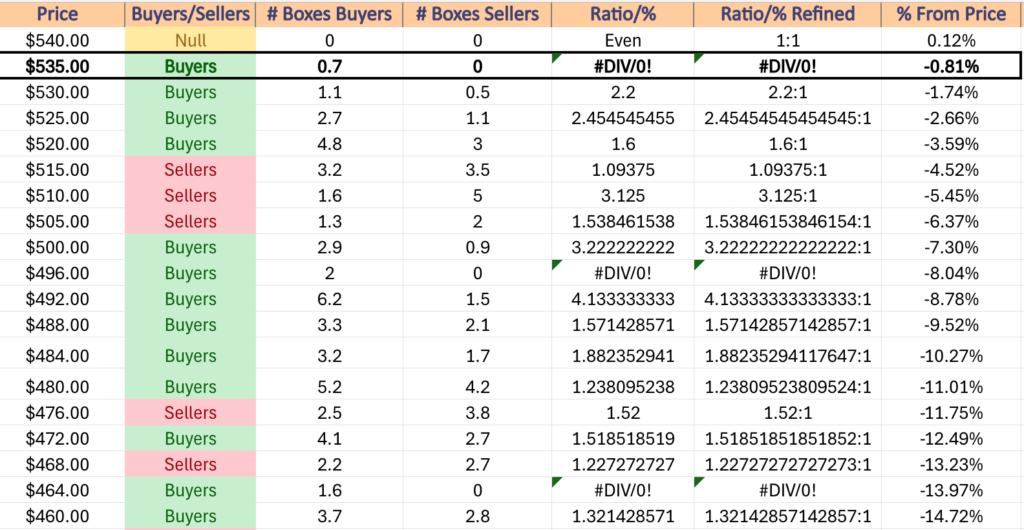
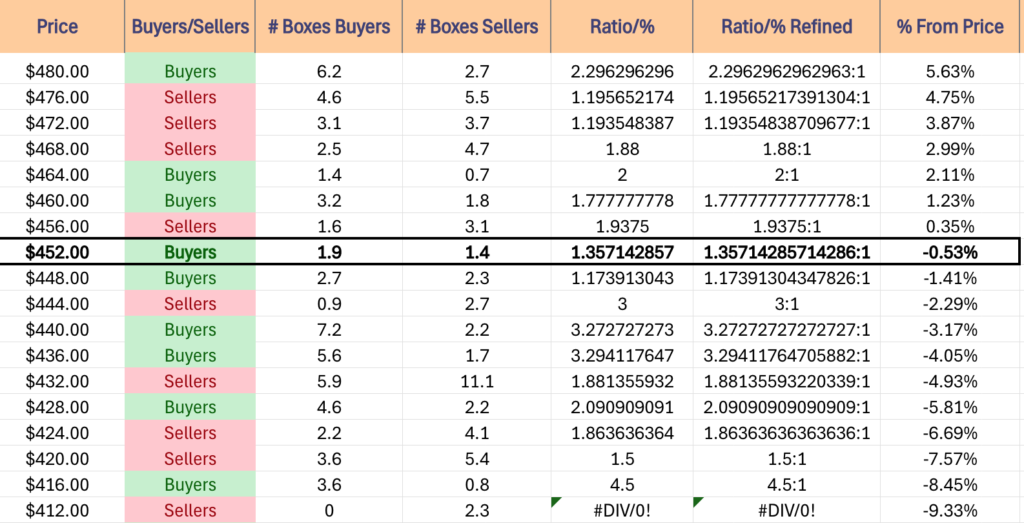
Downside breakdowns will get interesting, particularly when you reference the support level Buyer:Seller sentiment in the table & paragraph below.
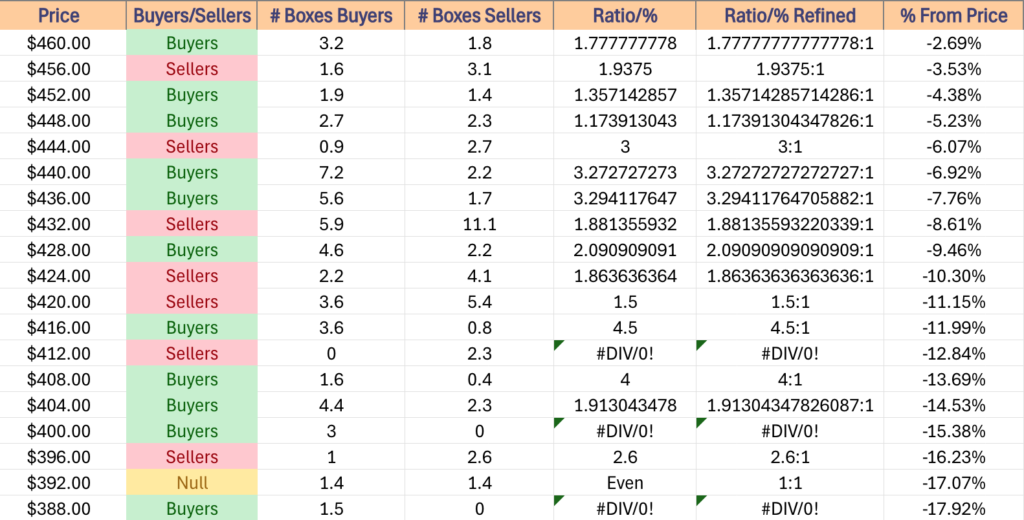
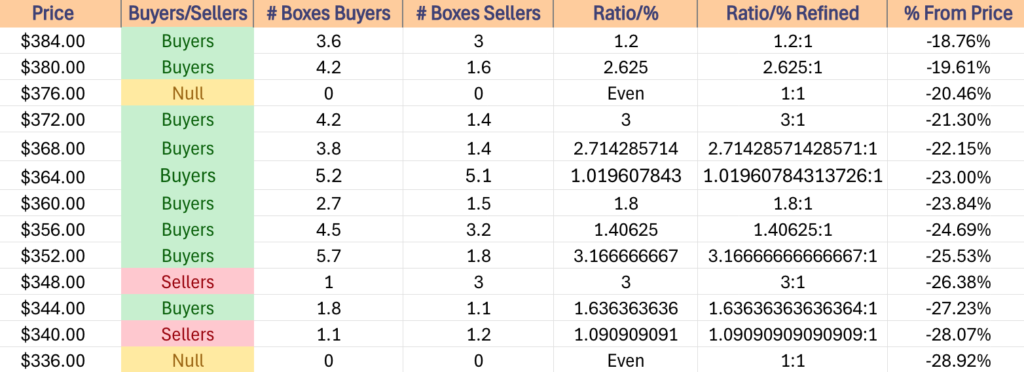
This doesn’t look like we’re near out of the woods just yet, and the $402.39/share level has now become a new area of focus should it be tested, as its the lowest 1 year support level, a freshly established level & volume has really turned up since it was tested, indicating that there’s fish biting around there.
Whether we actually sink that far is still TBD, but again, when the fish are biting that aggressively, its usually a sign that that’s going to be a place to keep your eyes on.
It’s also worth referencing the Volume Sentiment table for QQQ, as well as SPY, IWM & DIA when looking at these volume levels for historical context.
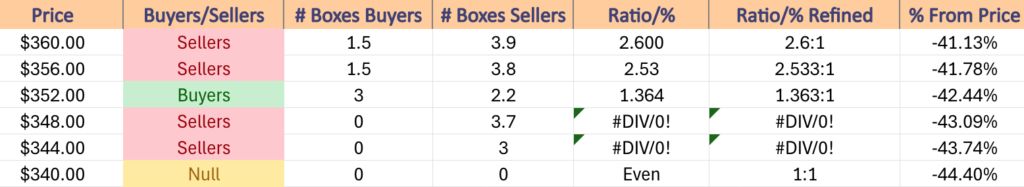
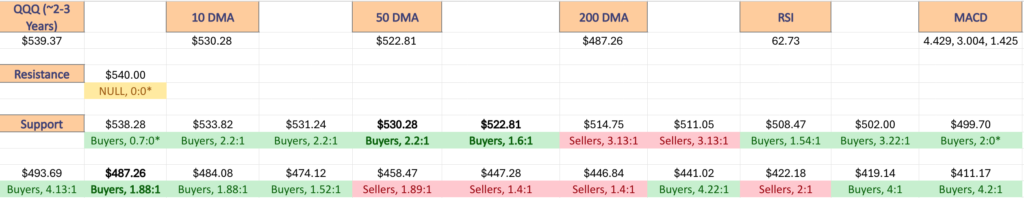
QQQ has support at the $449.74 (10 Day Moving Average, Volume Sentiment: Buyers, 1.17:1), $446.18 (Volume Sentiment: Sellers, 3:1), $440.36 (Volume Sentiment: Buyers, 3.27:1) & $421.55/share (Volume Sentiment: Sellers, 1.5:1) price levels, with resistance at the $457.78 (Volume Sentiment: Sellers, 1.94:1), $465.74 (Volume Sentiment: Buyers, 2:1), $467.83 (Volume Sentiment: Buyers, 2:1) & $473.41/share (Volume Sentiment: Sellers, 1.19:1) price levels.
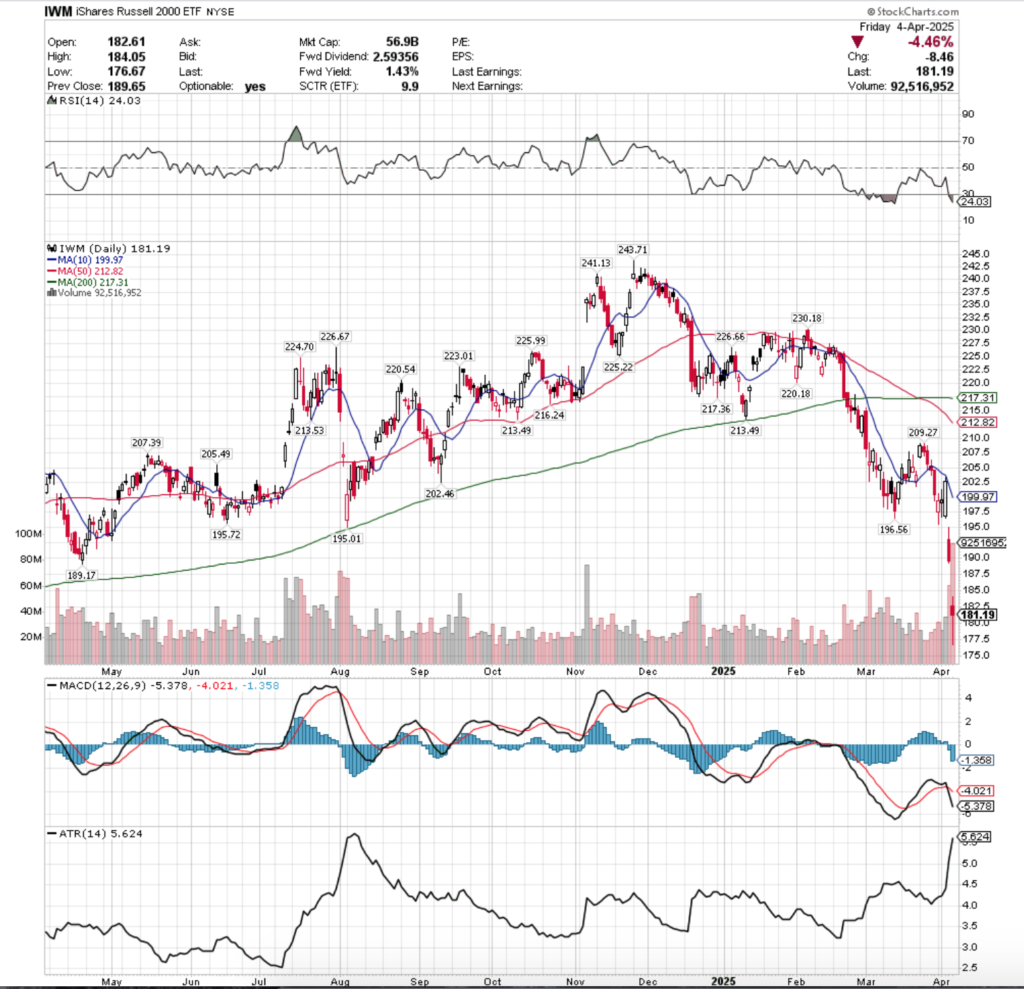
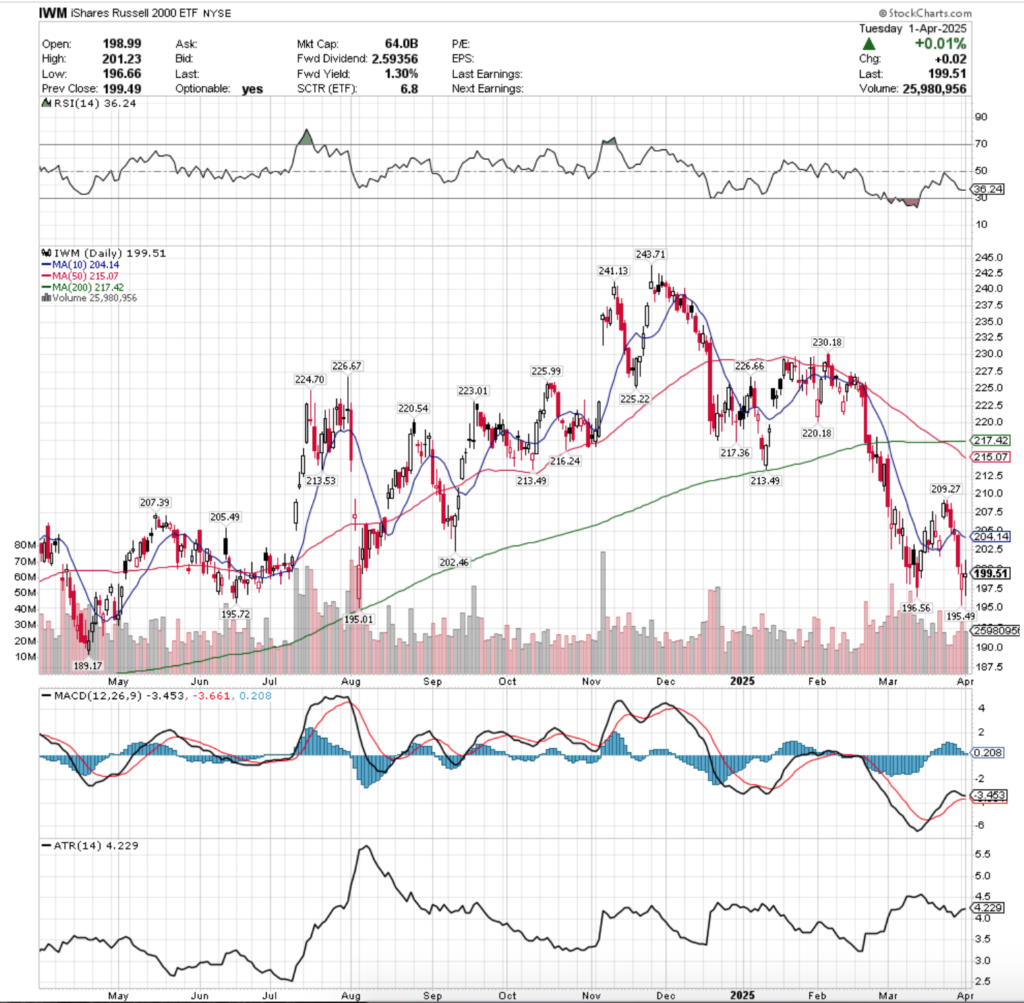
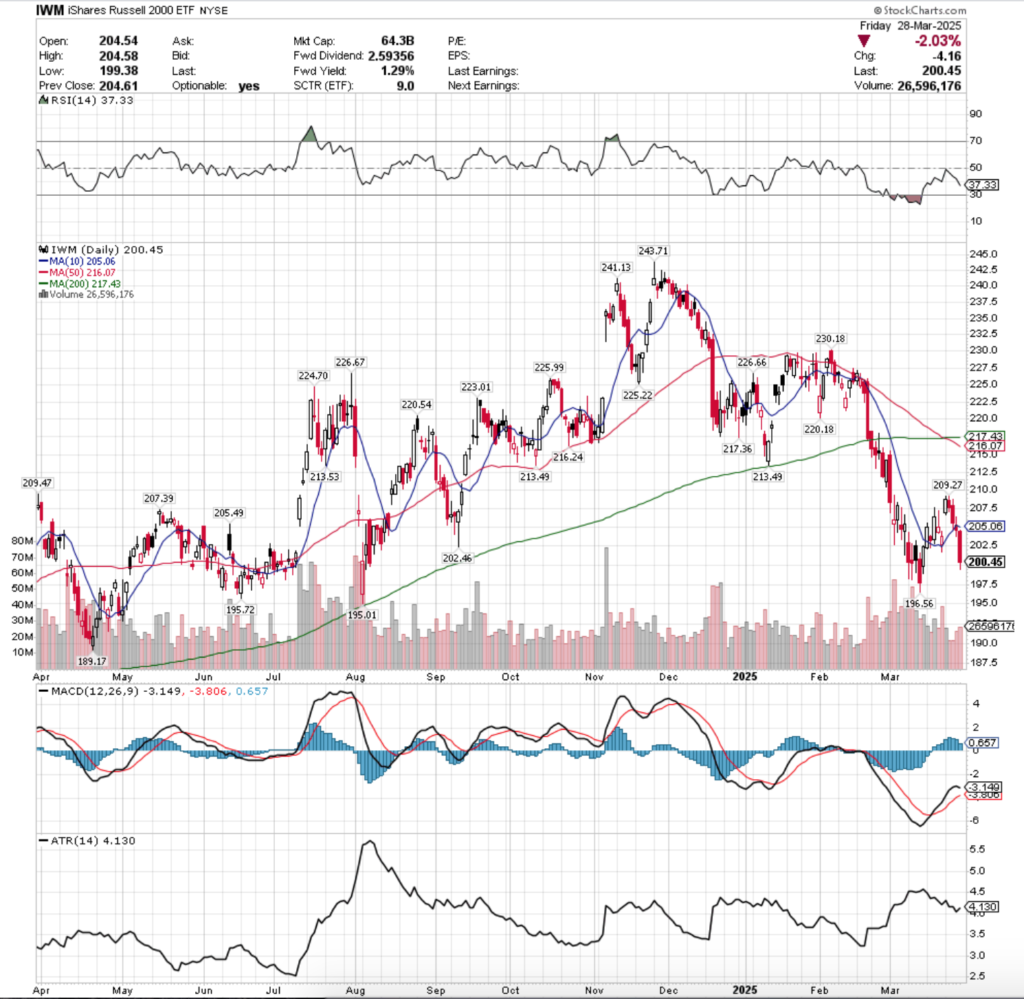
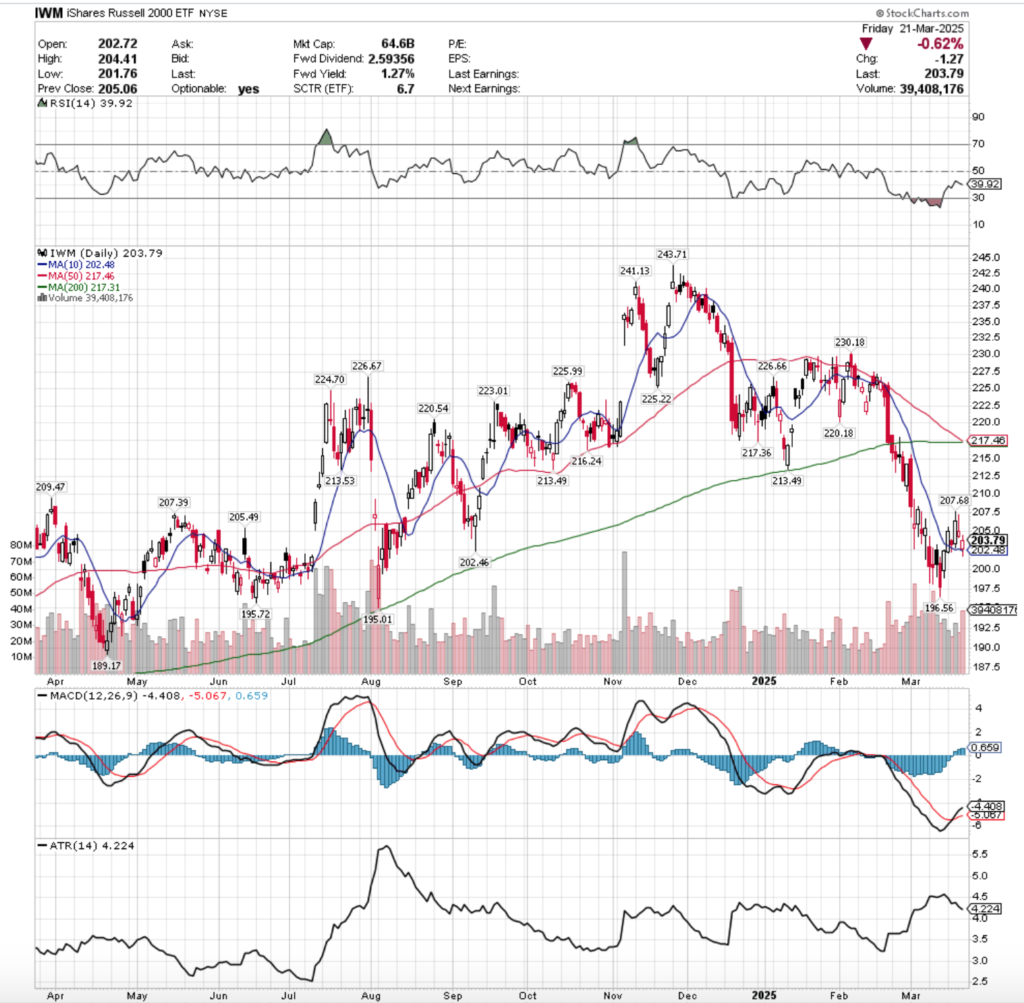
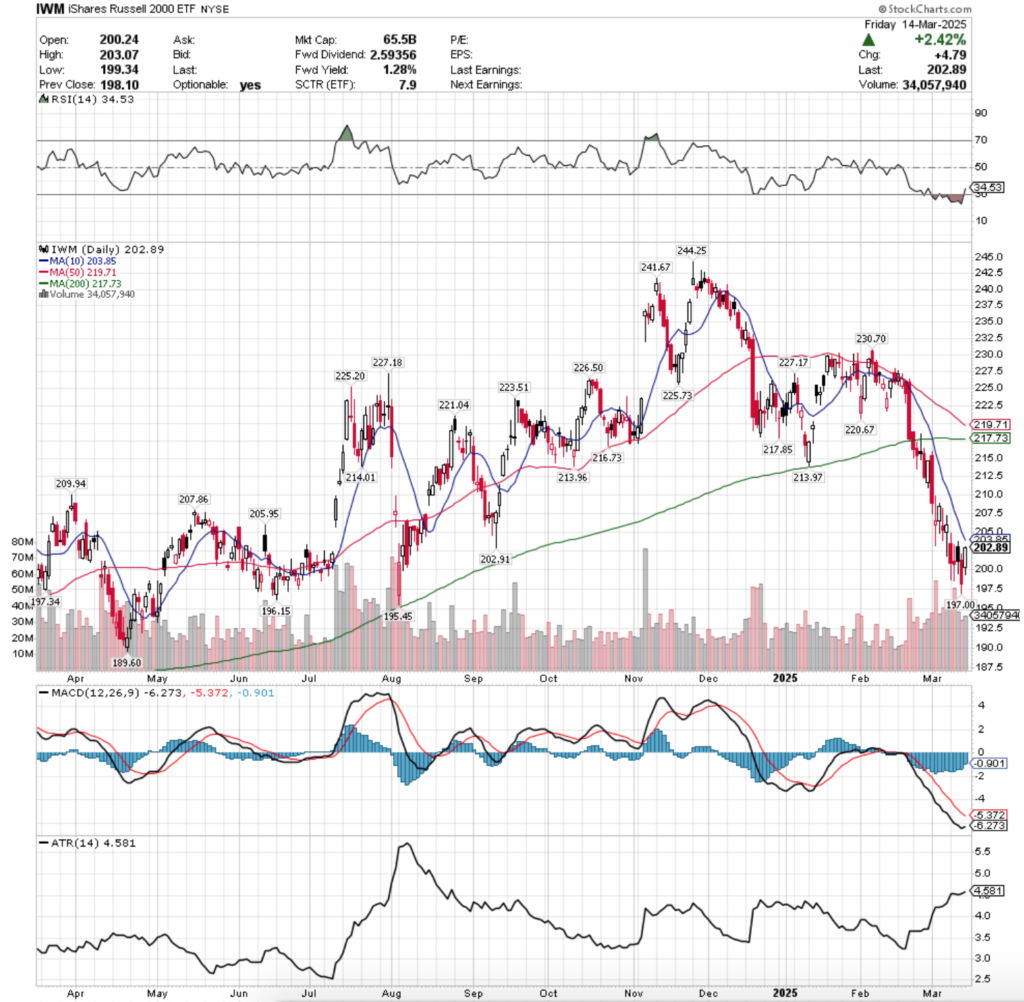
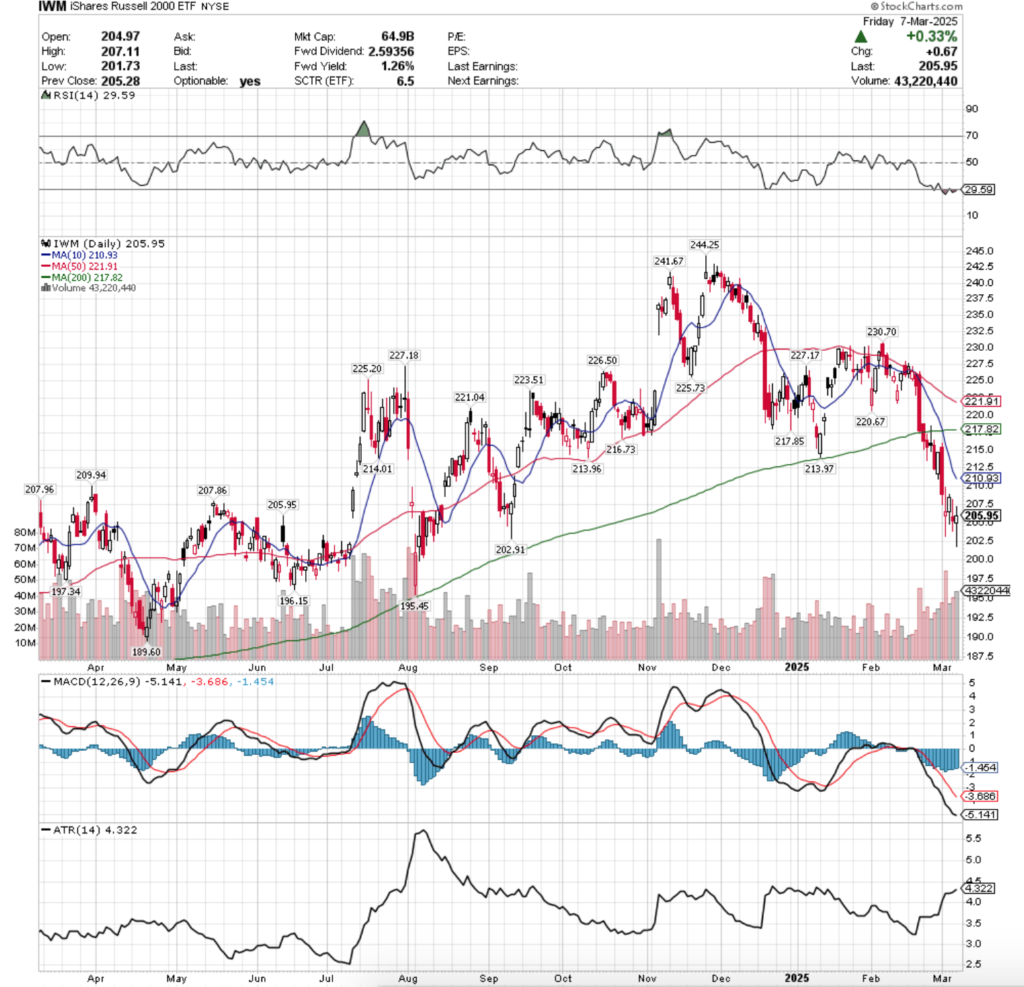
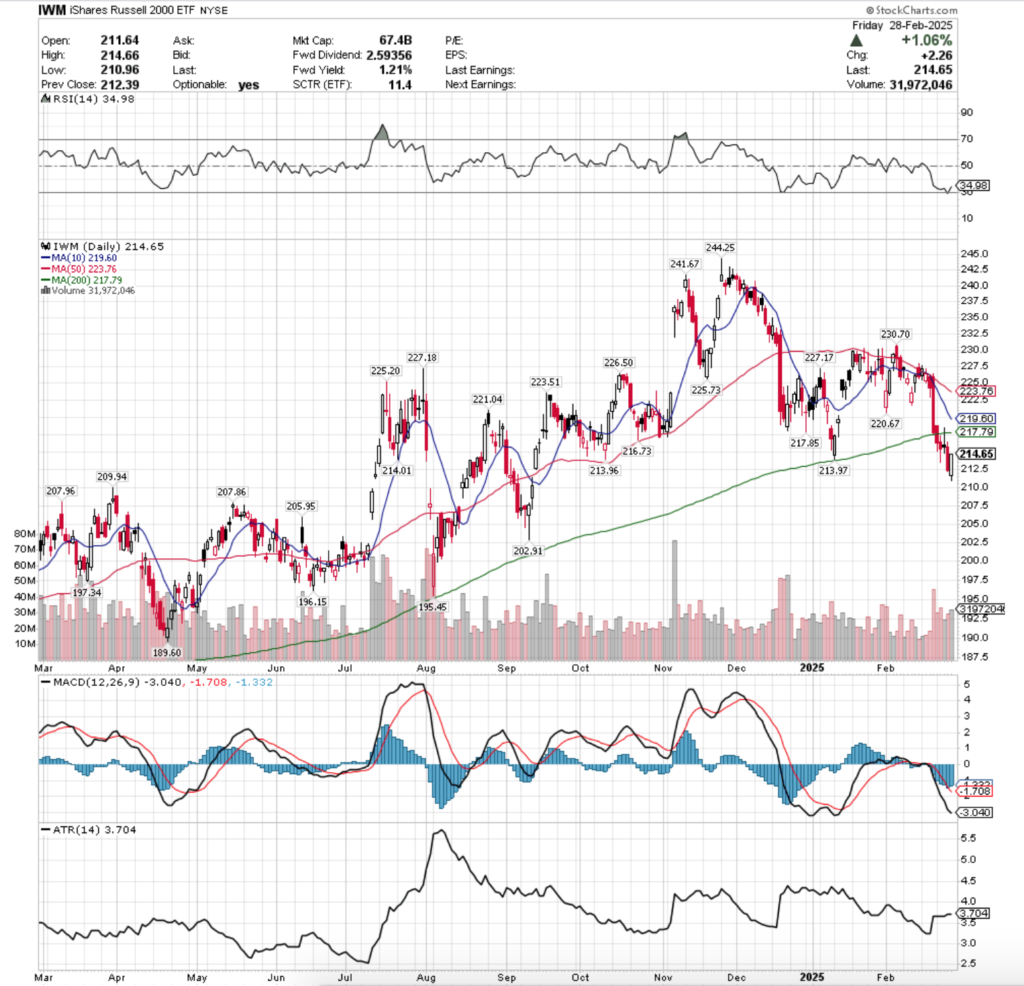
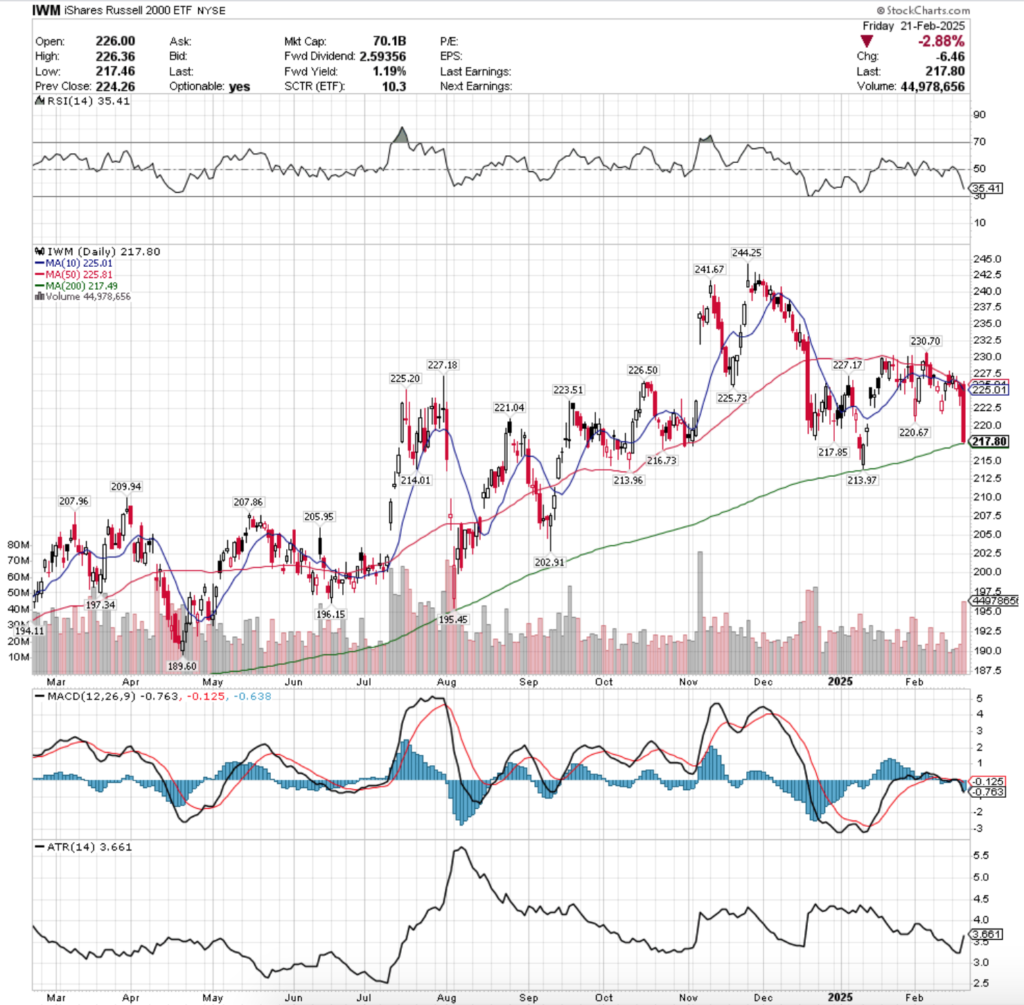
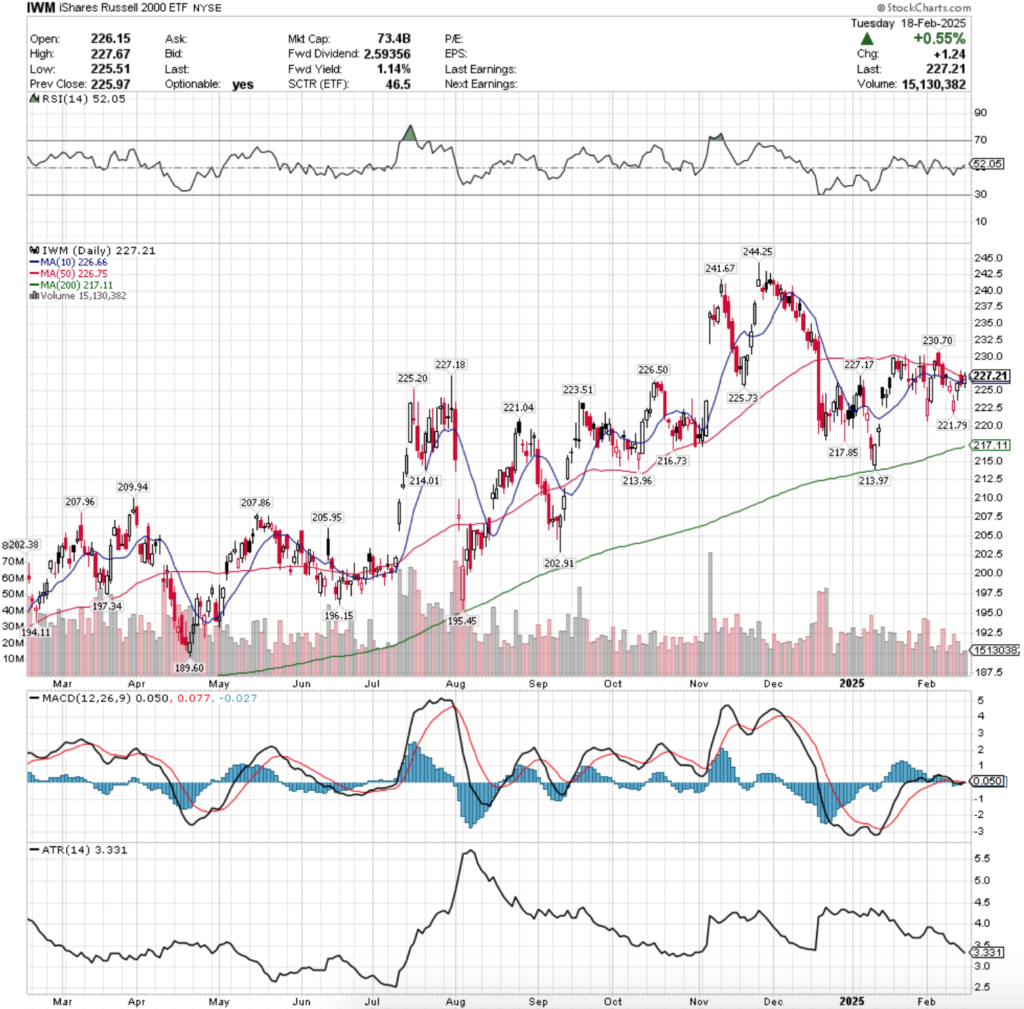
IWM, the iShares Russell 2000 ETF climbed +1.75%, as market participants squeezed into the small cap index heavily on Wednesday, setting the stage for weekly gains.
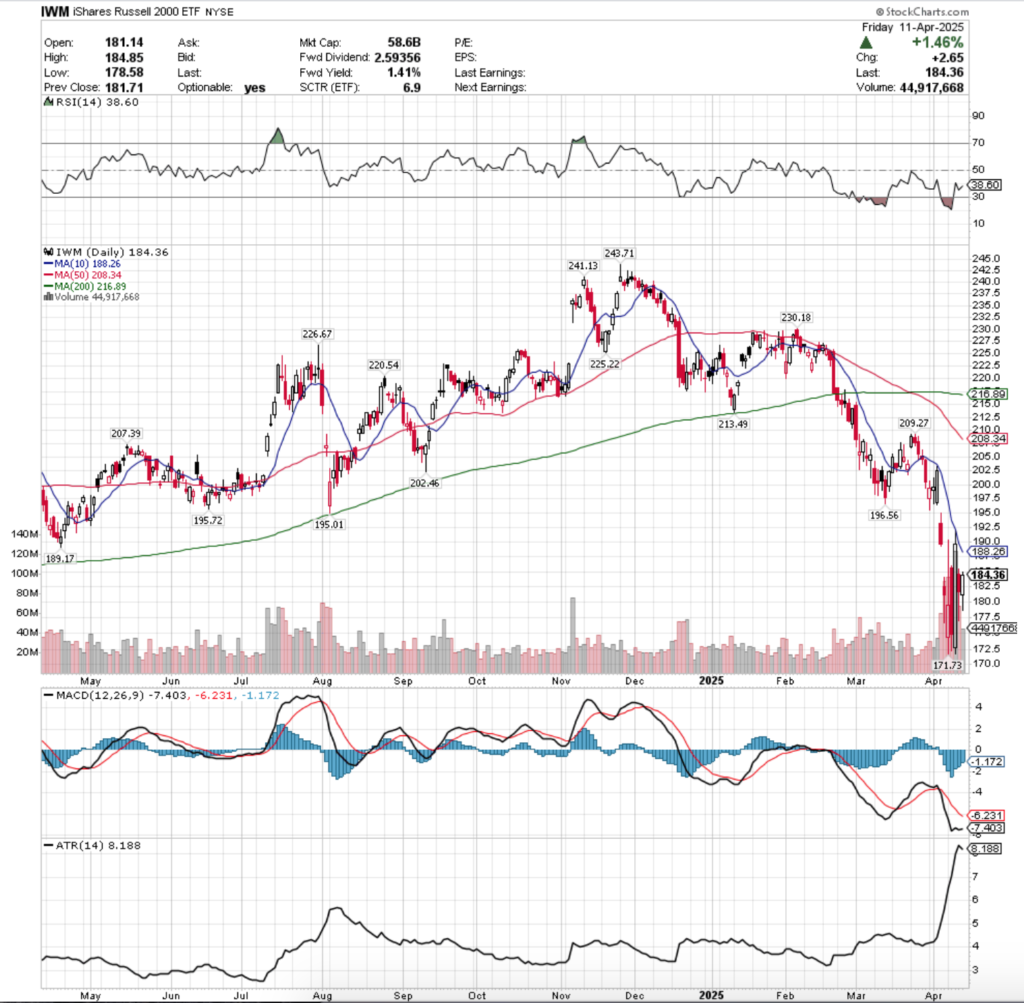
Their RSI is chopping back towards the neutral 50 mark, sitting currently at 38.6, while their MACD is flat.
While their MACd histogram is waning, they’ve got a lot of trouble under the hood given the nature of how small cap names will move in relation to their larger peers & the volume trends noted above.
Volumes were +162.43% above the prior year’s level (78,654,000 vs. 29,971,786), which is an interesting thing to note as IWM & DIA have relatively moved decoupled from SPY & QQQ who move in similar fashions to one another, but the lack of an idea as to where the market is going right now seems to have impacted everyone from the small caps to the blue chips.
Monday the week began on uncertain, but negative terms, as a gap down open was able to muster up a higher close, but the upper shadow of the day’s candle broke above the $190/share level on the second highest volume of the week.
Tuesday opened on a gap higher, but quickly showed that there was a bit our sour sentiment out & prices declined rapidly to show appetite below the $172.50/share level, but closed above it.
Wednesday followed SPY & QQQ’s lead, seeing a major influx of volume that accounted for the week’s highest level, but IWM was rejected by their 10 DMA’s resistance & closed below it, a major bearish signal.
Thursday’s menu included bearish harami candles with long lower shadows indicating that there was still a bit of downside appetite that needed to be examined.
Friday continued this with a gap down open that retraced most of Thursday’s lower range, but ultimately there was a small rally into the weekend hat resulted in a +1.46% advance for the day.
It should be noted though that this came on very weak volume, indicating that there was more of a pump/head-fake going into the weekend vs. some actual bullish sentiment.
IWM suffers from the same bullish case as the two aforementioned index ETFs, there’s no volume for a base case to be built upon & there’s a lot of sentiment troubles they’ll be faced with in the near-term as well.
In the meantime expect a similar consolidation as to what’s described above as we see what guidance changes from earnings calls change broader market sentiment.
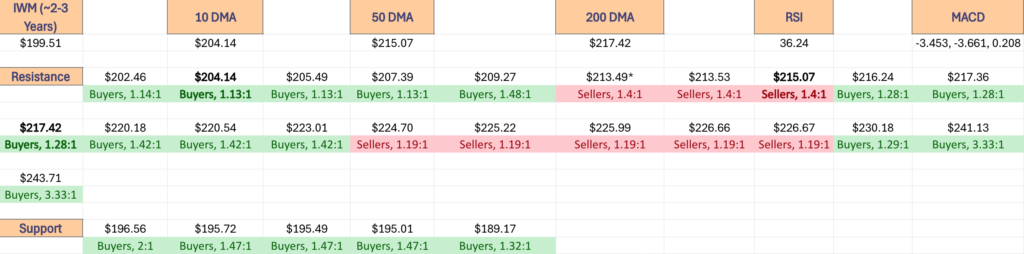
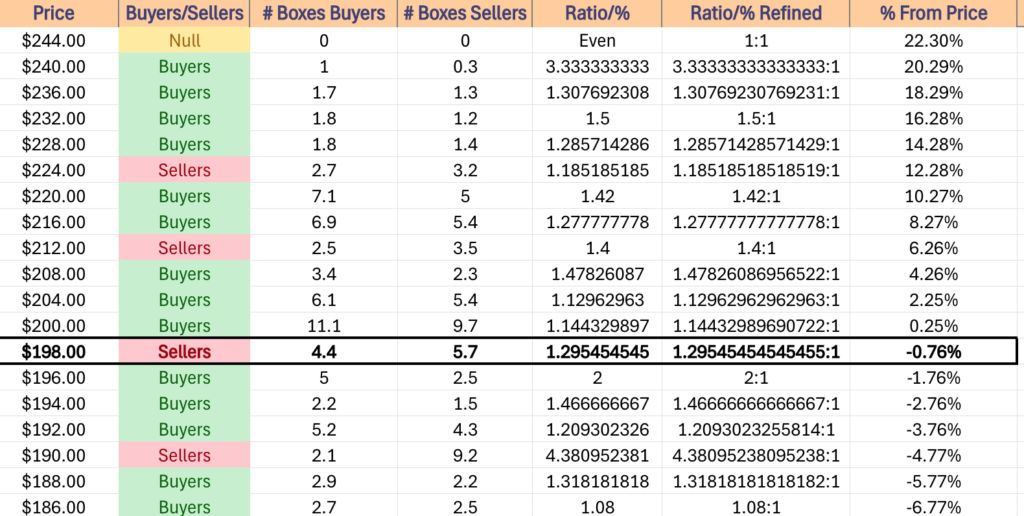
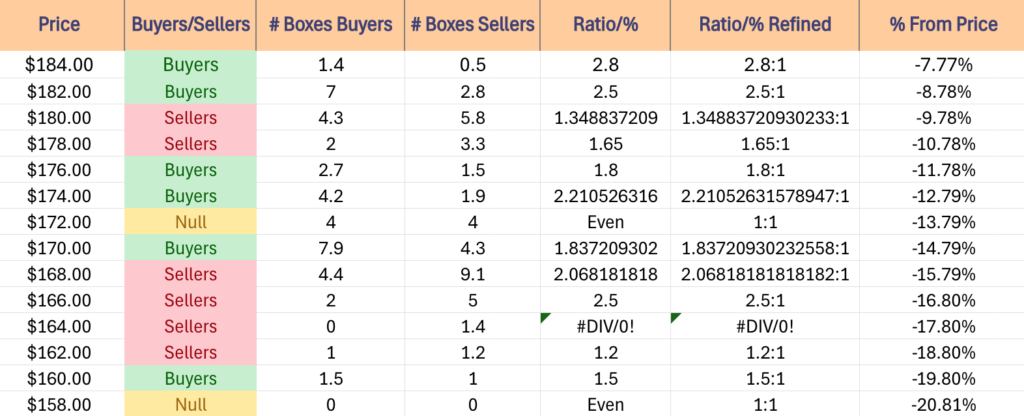
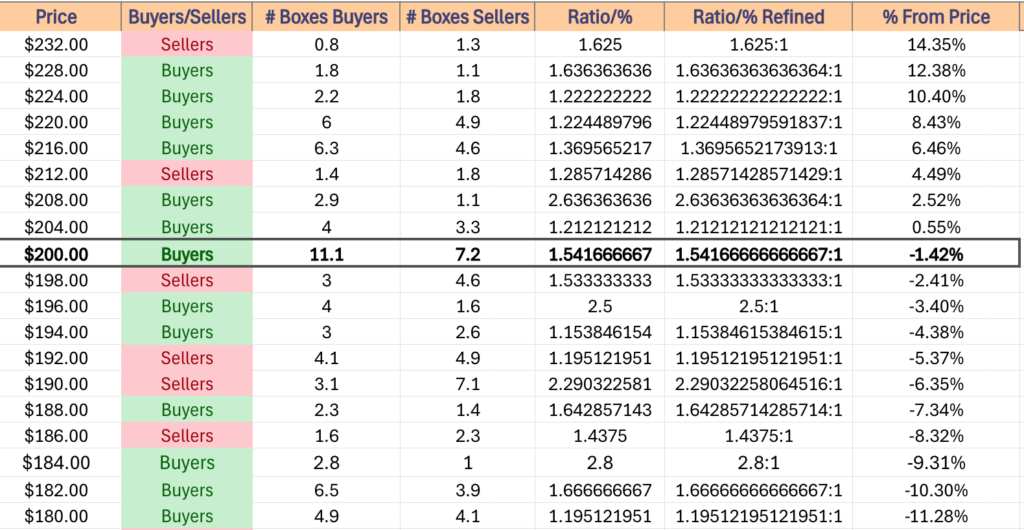
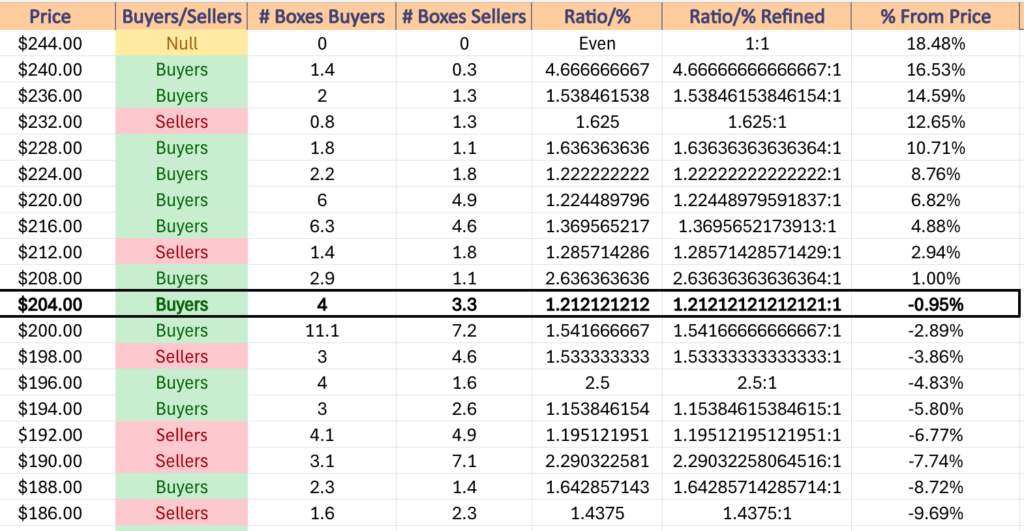
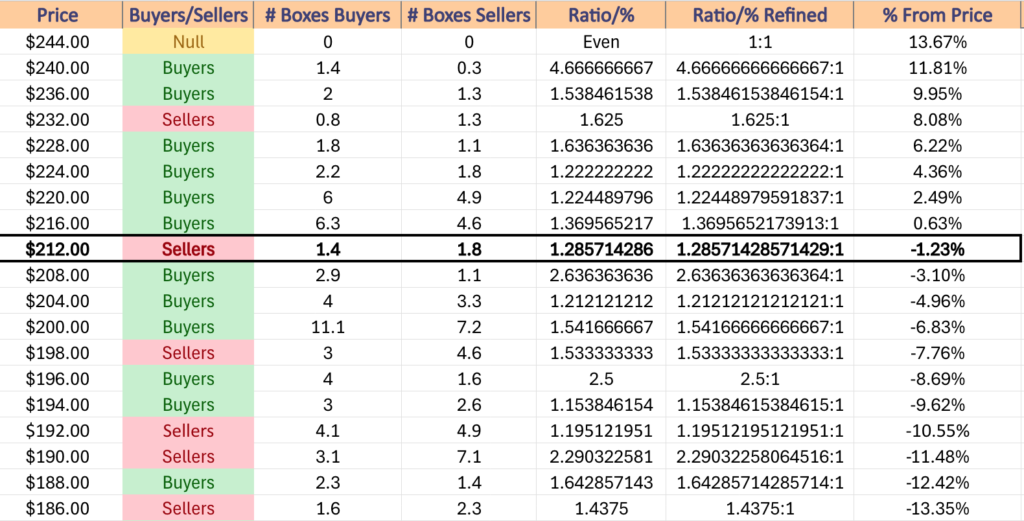
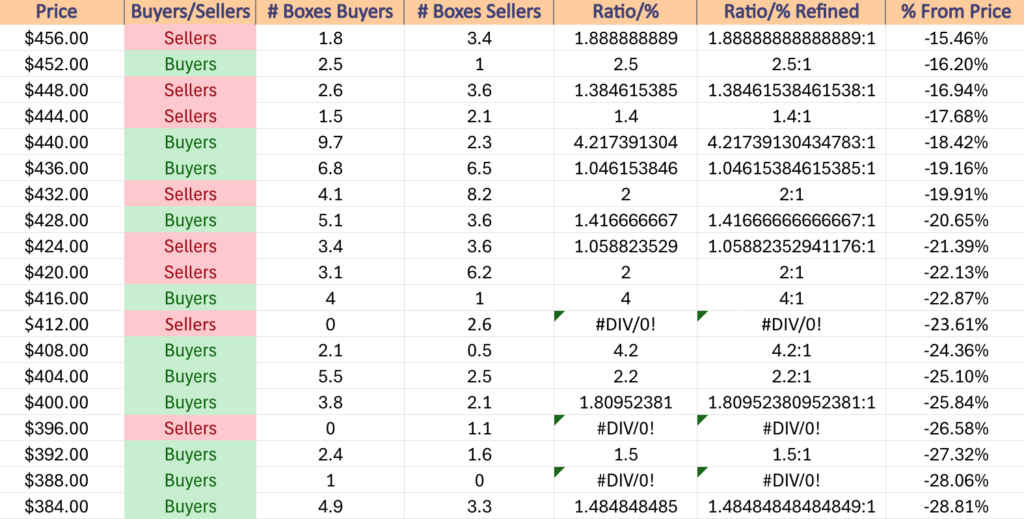
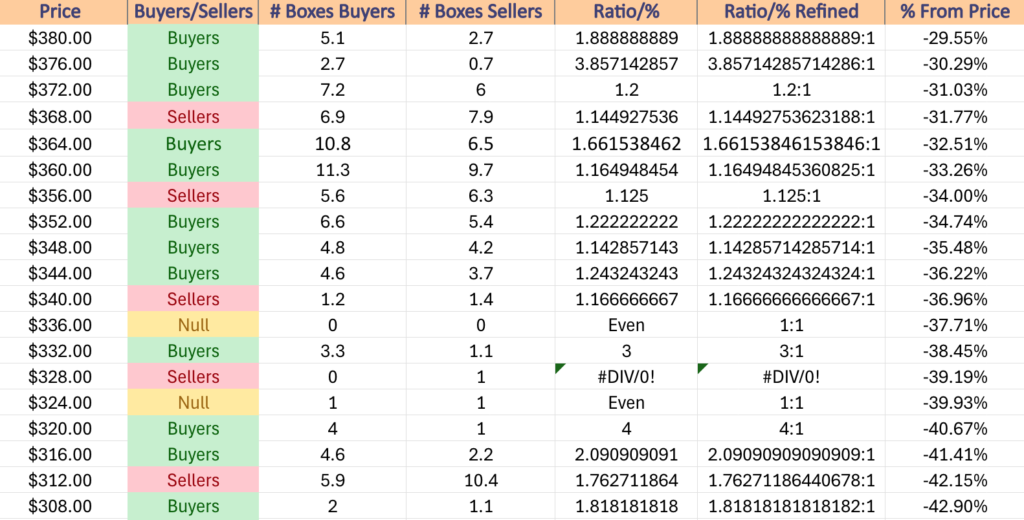
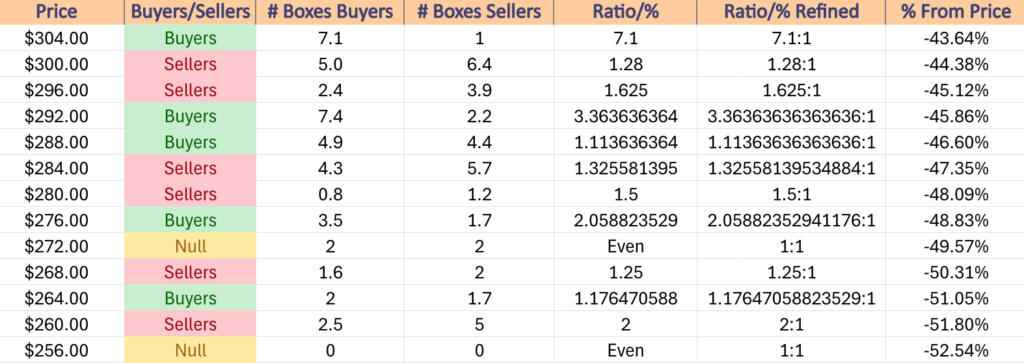
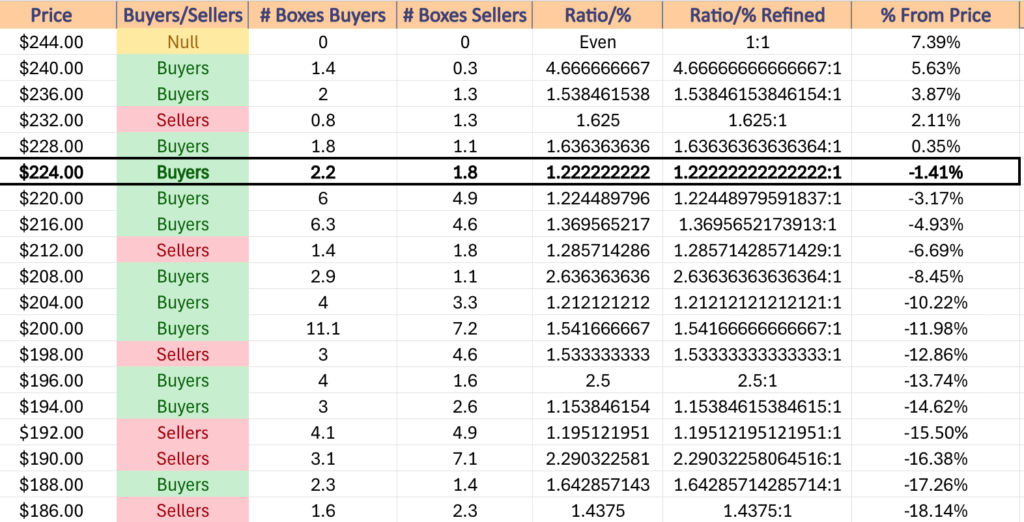
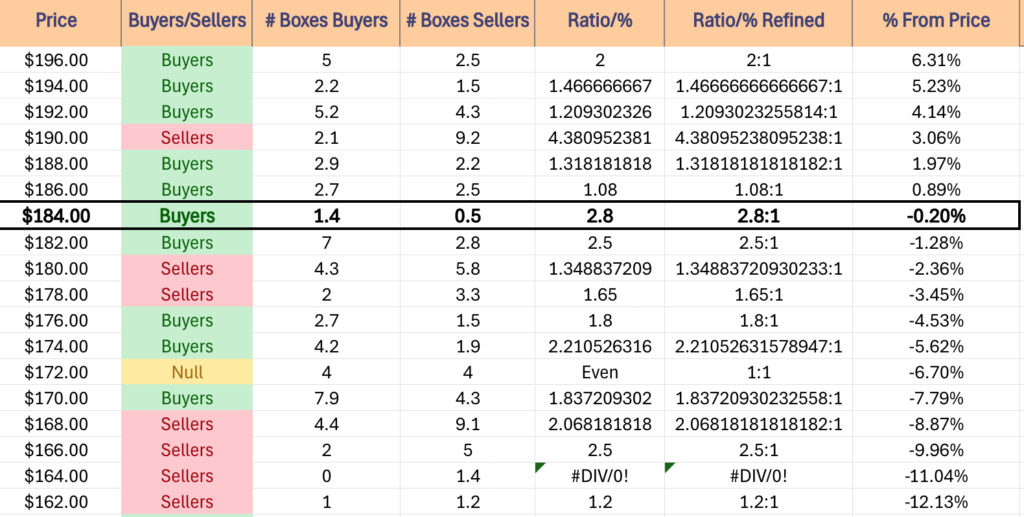
One area of caution with IWM; there is only one support price level from their one year chart & the other 3 of the top 4 are from the two year chart.
While that isn’t a big deal given the data on sentiment below covers all of these areas, it is something to consider in the near-term, as many of these levels could have fallen out of favor over time & it should be approached with caution heading into the next few weeks.
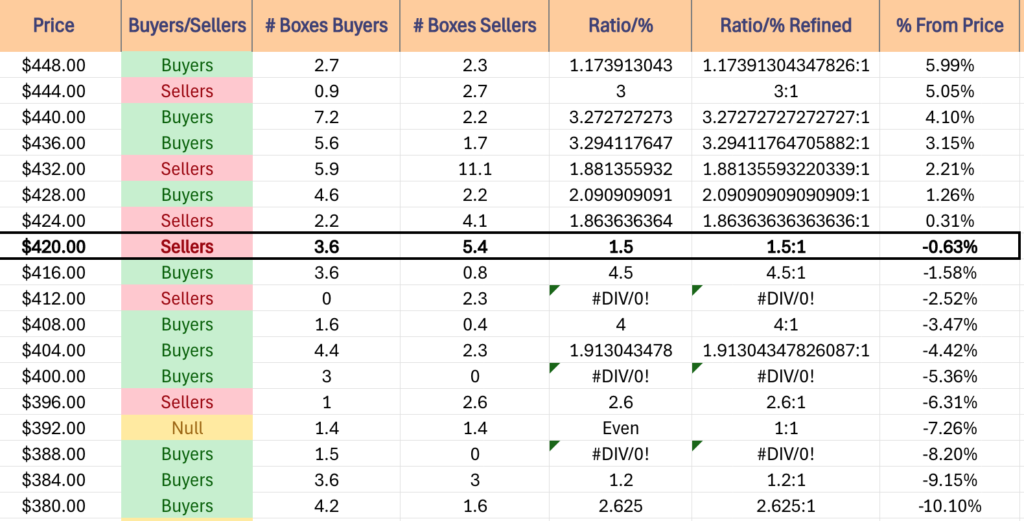
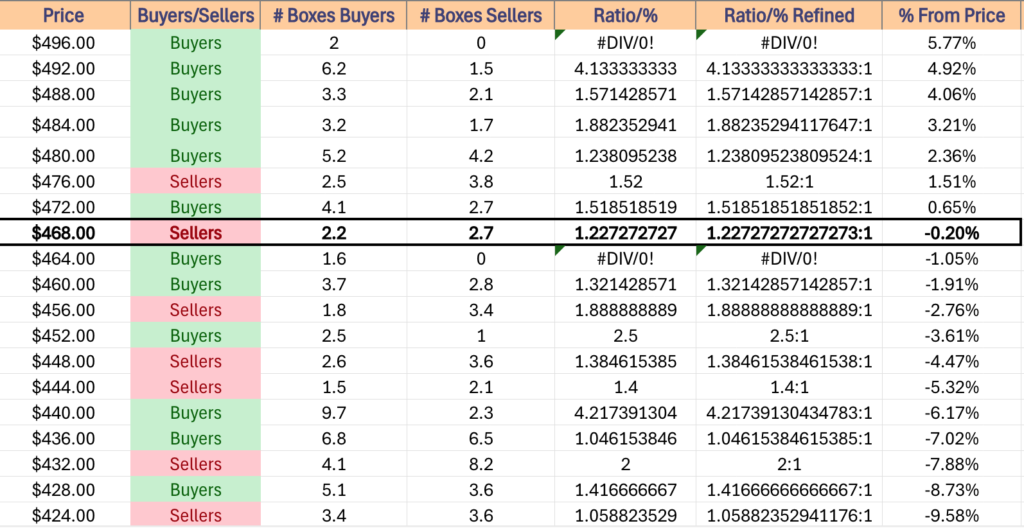
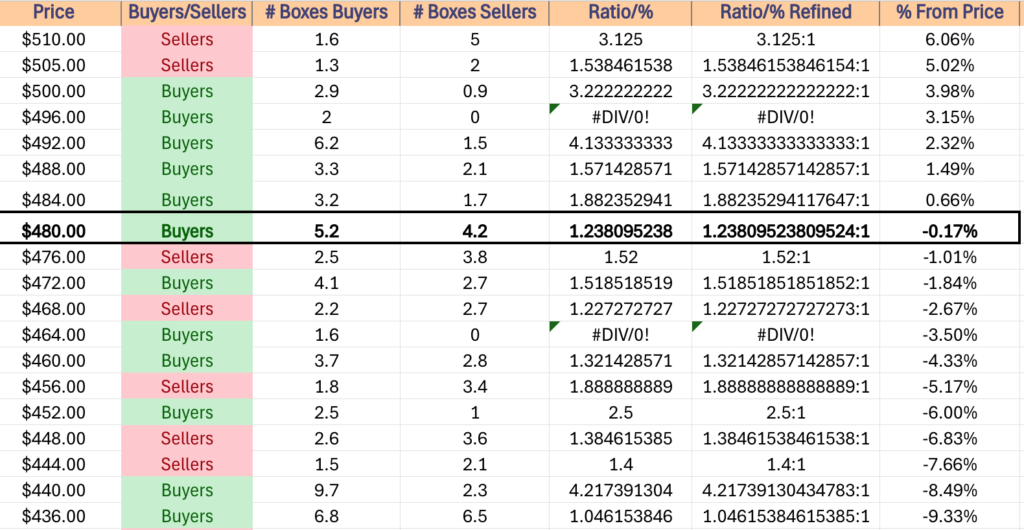
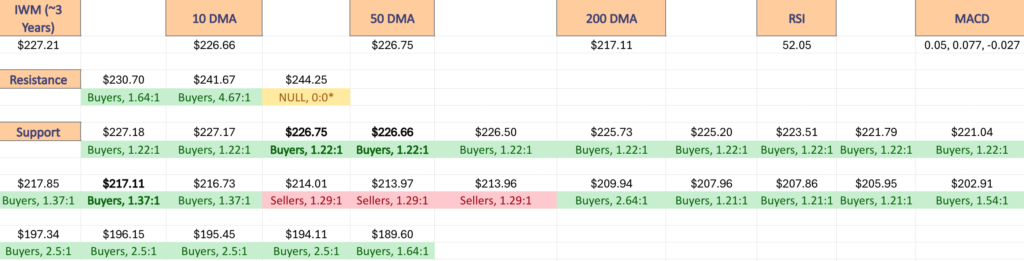
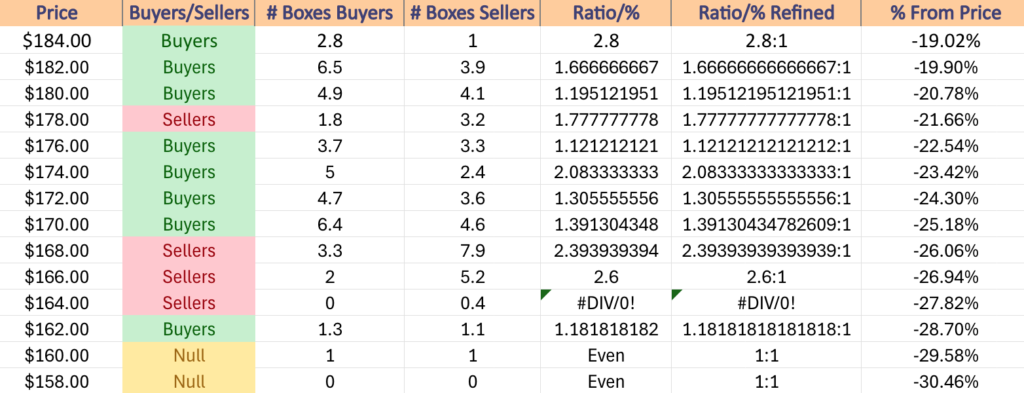
IWM has support at the $177.61 (2 Year Chart, Volume Sentiment: Buyers, 1.8:1), $171.73 (Volume Sentiment: Buyers, 1.84:1), $164.61 (2 Year Chart, Volume Sentiment: Sellers, 1.4:0*) & $158.85/share (2 Year Chart, Volume Sentiment: NULL, 0:0*) price levels, with resistance at the $188.26 (10 Day Moving Average, Volume Sentiment: Buyers, 1.32:1), $189.17 (Volume Sentiment: Buyers, 1.32:1), $195.01 (Volume Sentiment: Buyers, 1.47:1) & $195.56/share (Volume Sentiment: Buyers, 1.47:1) price levels.
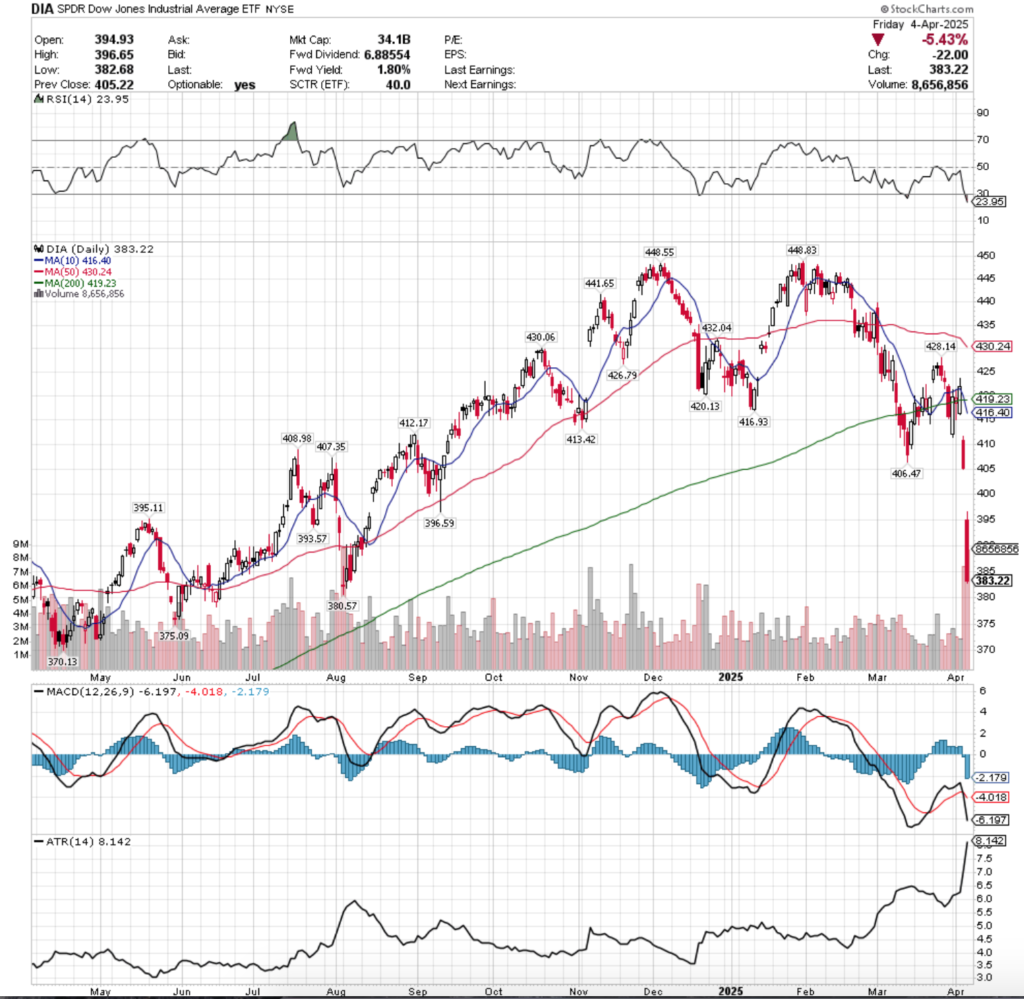
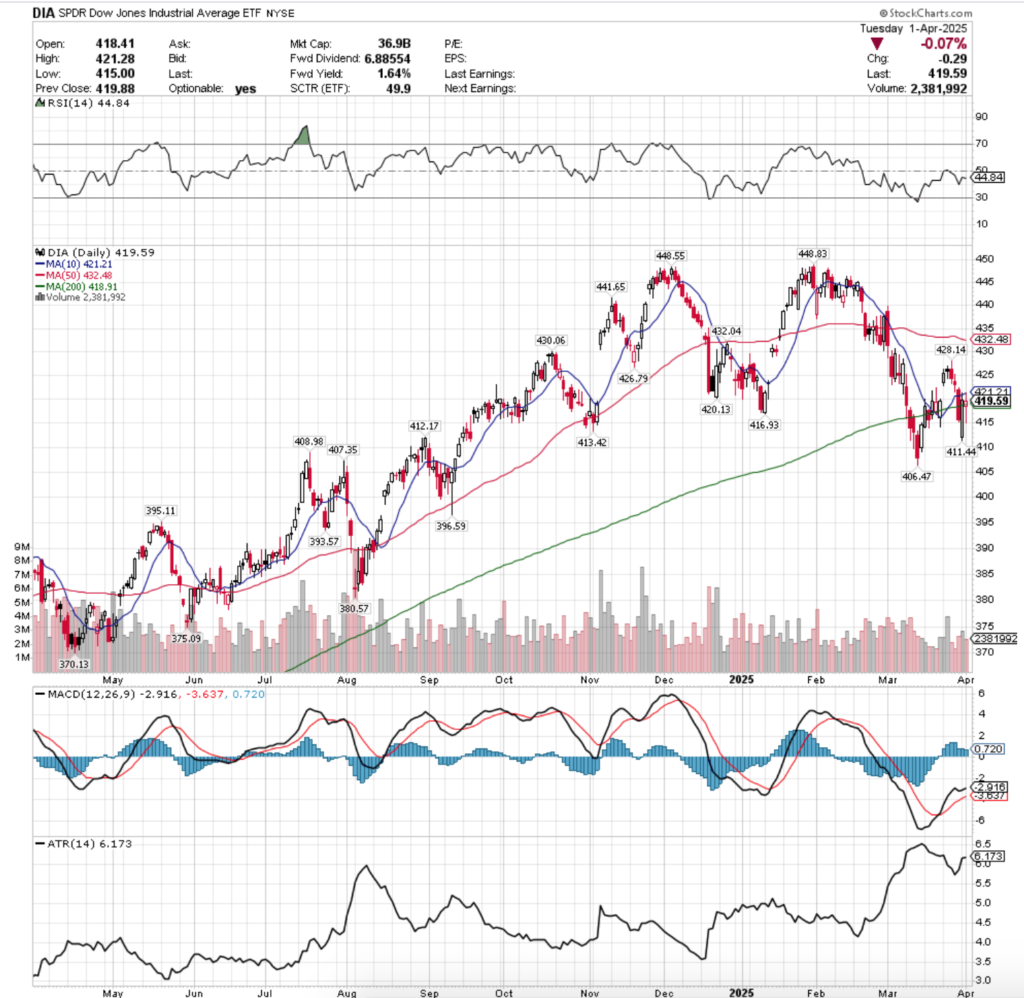
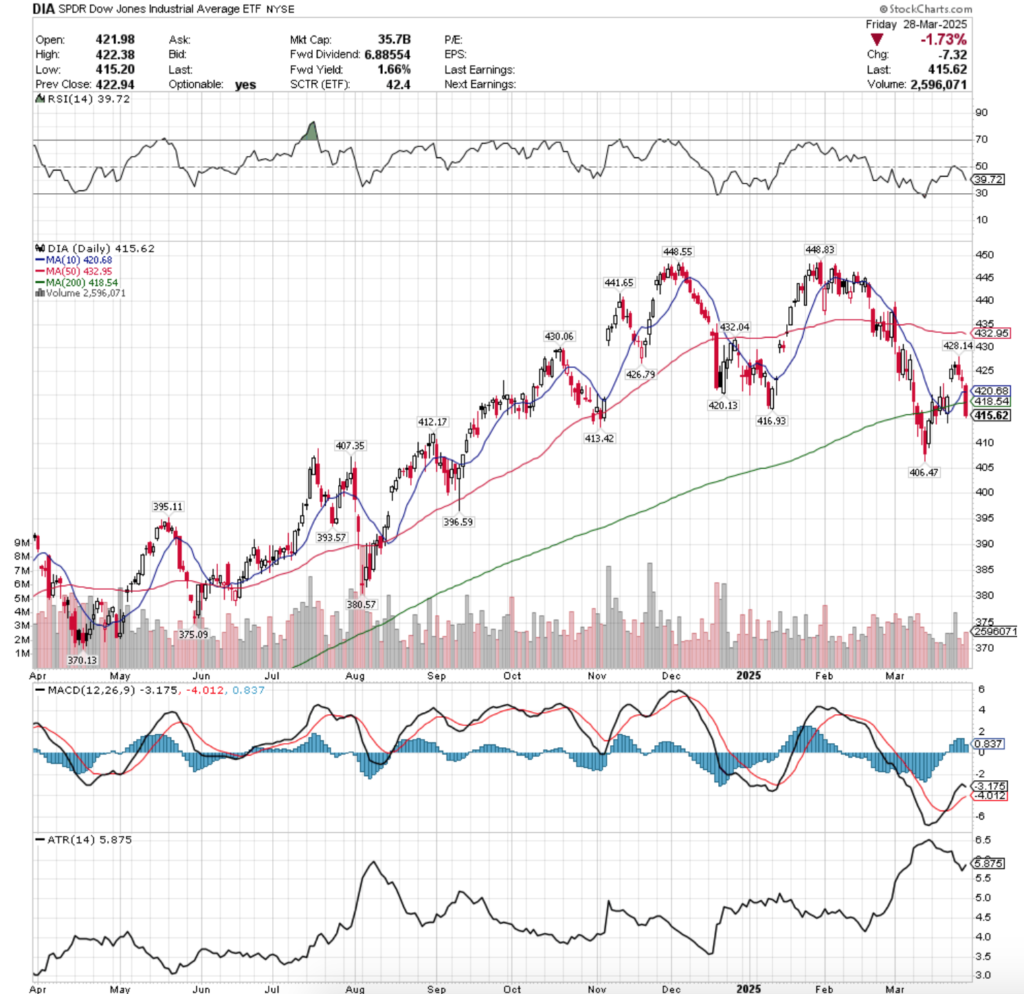
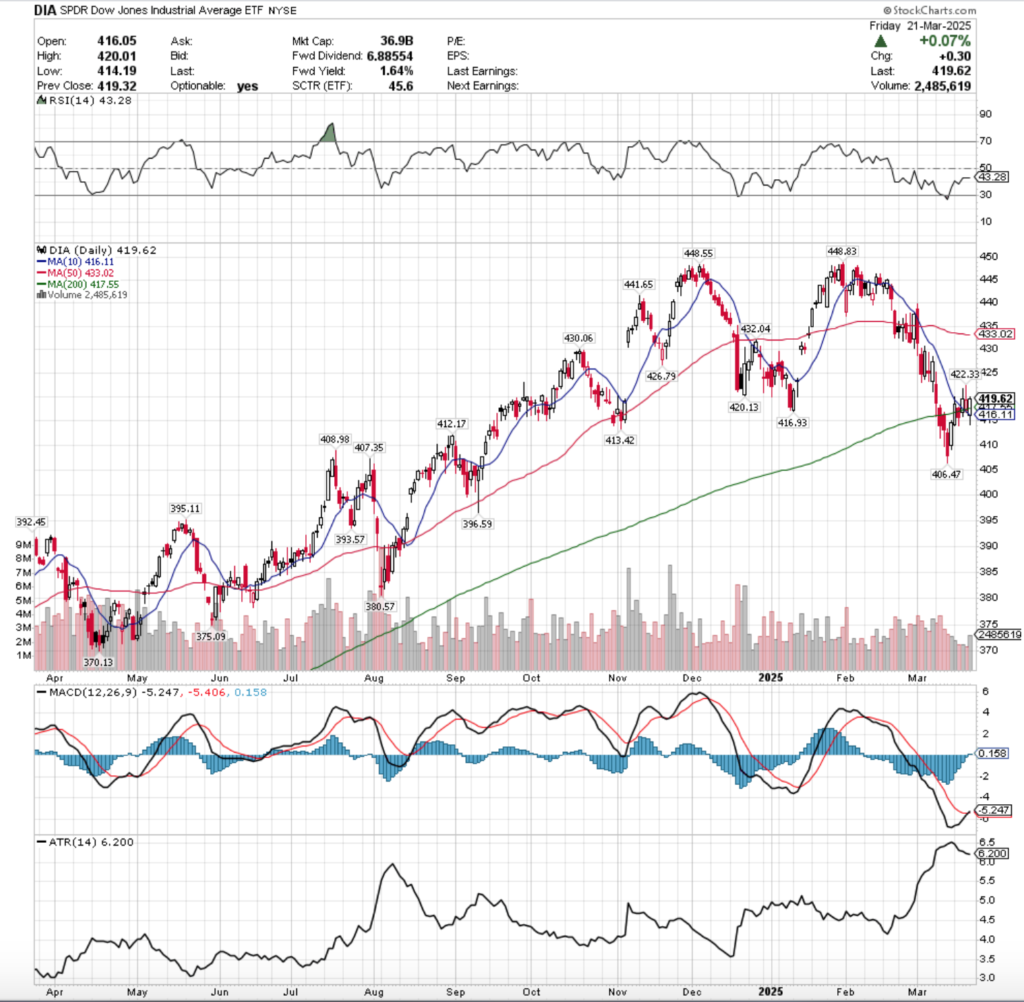
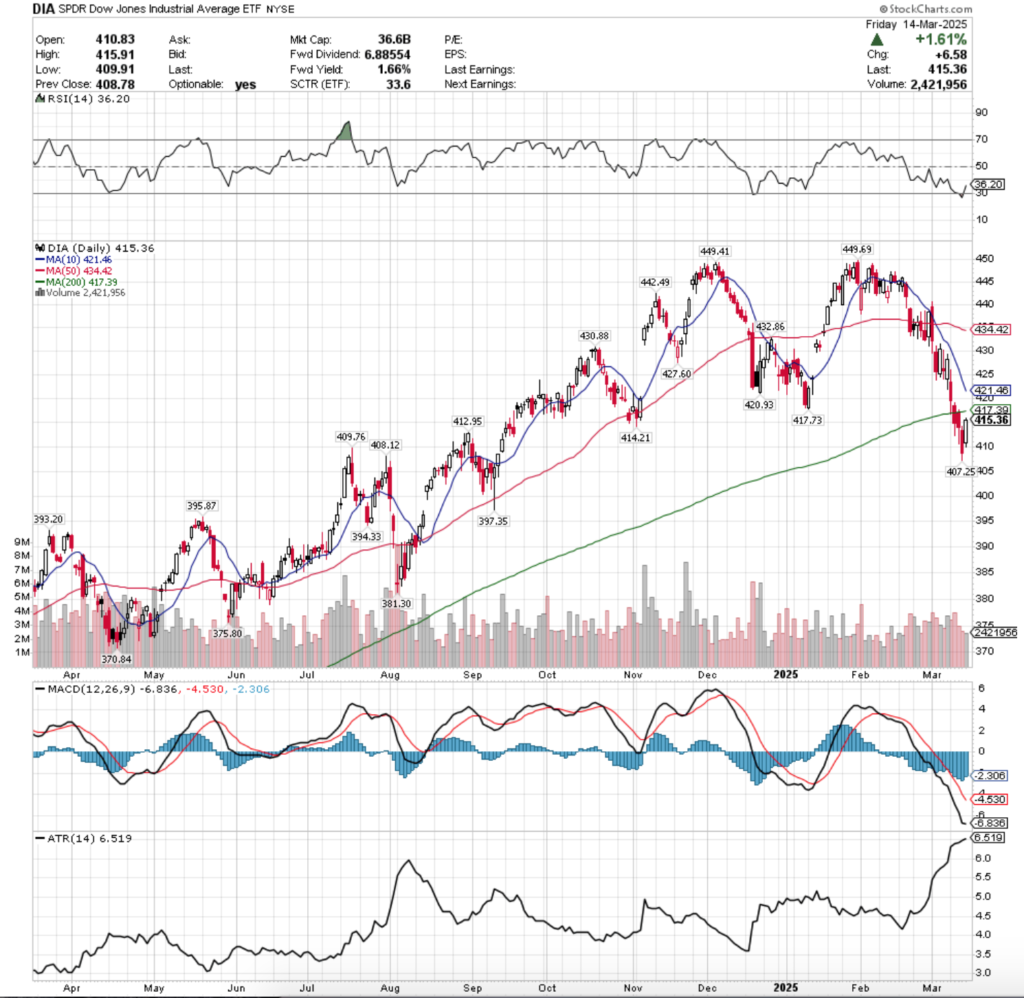
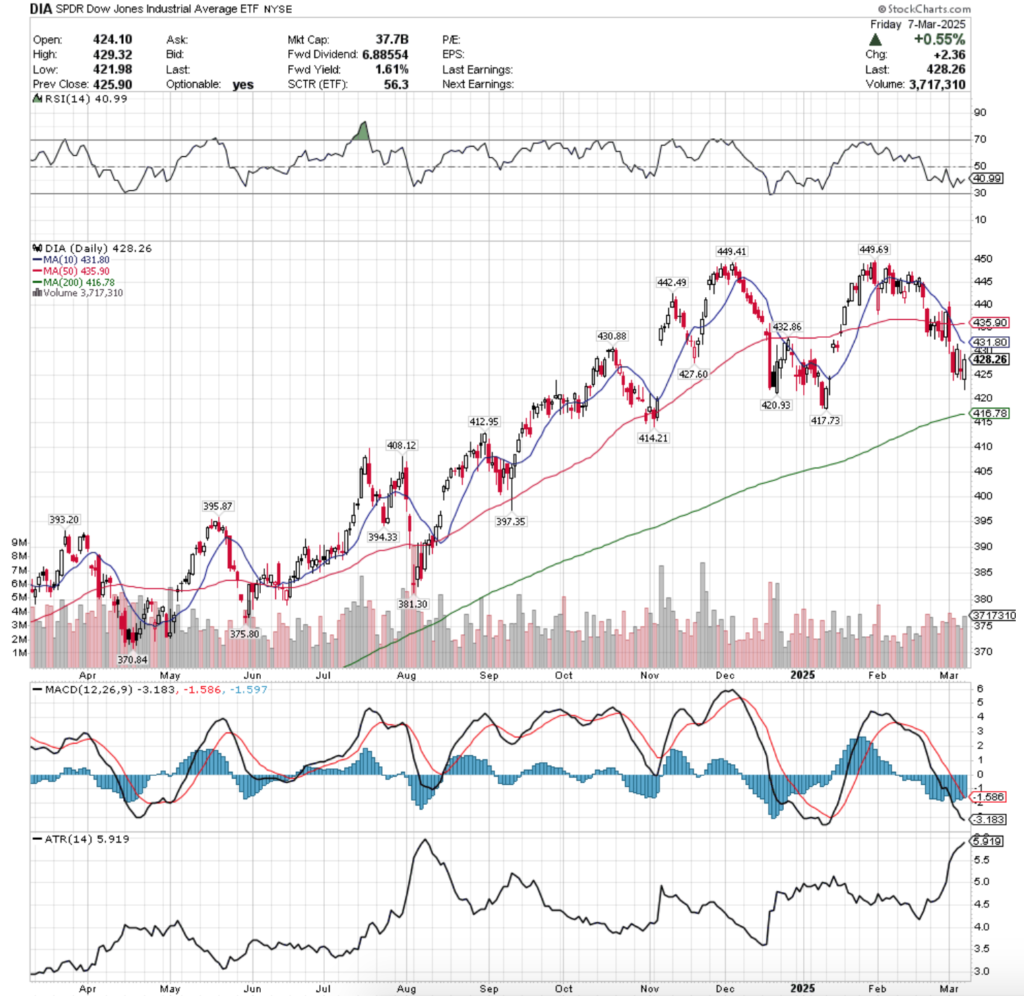
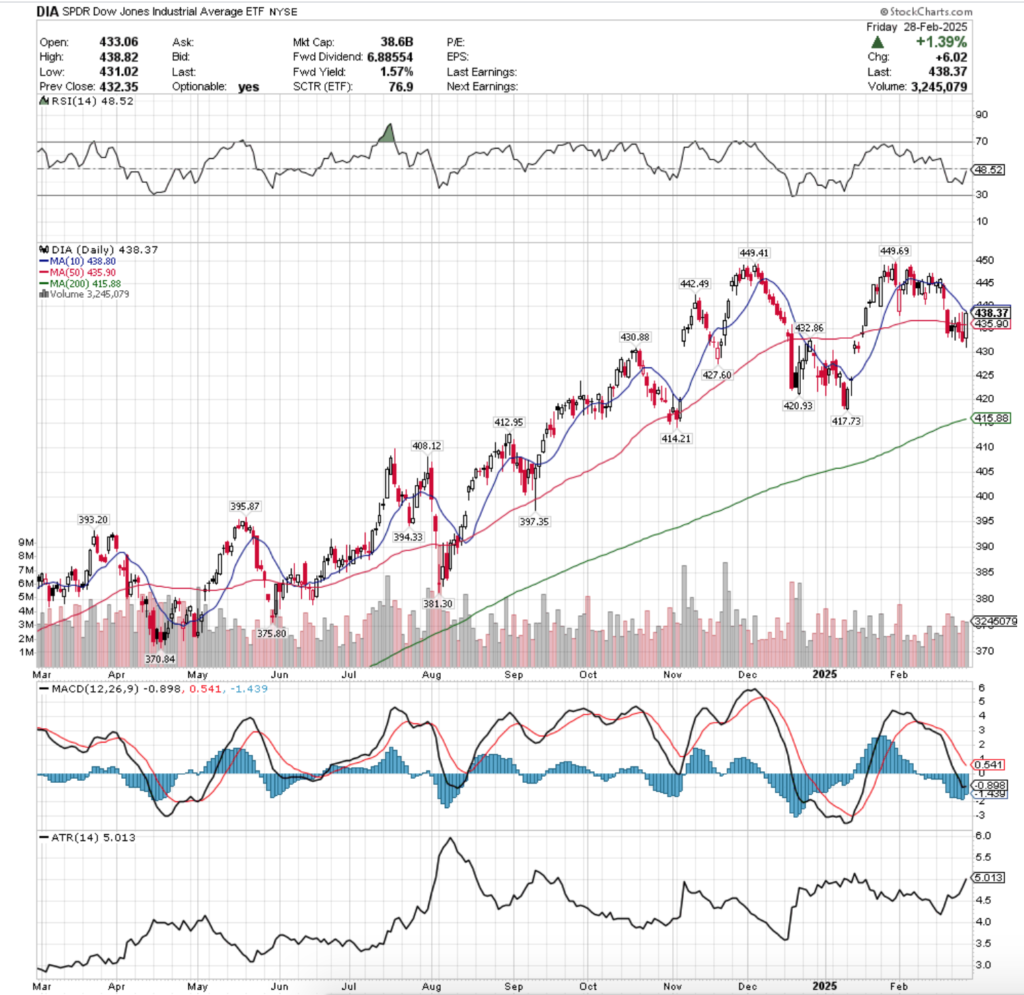
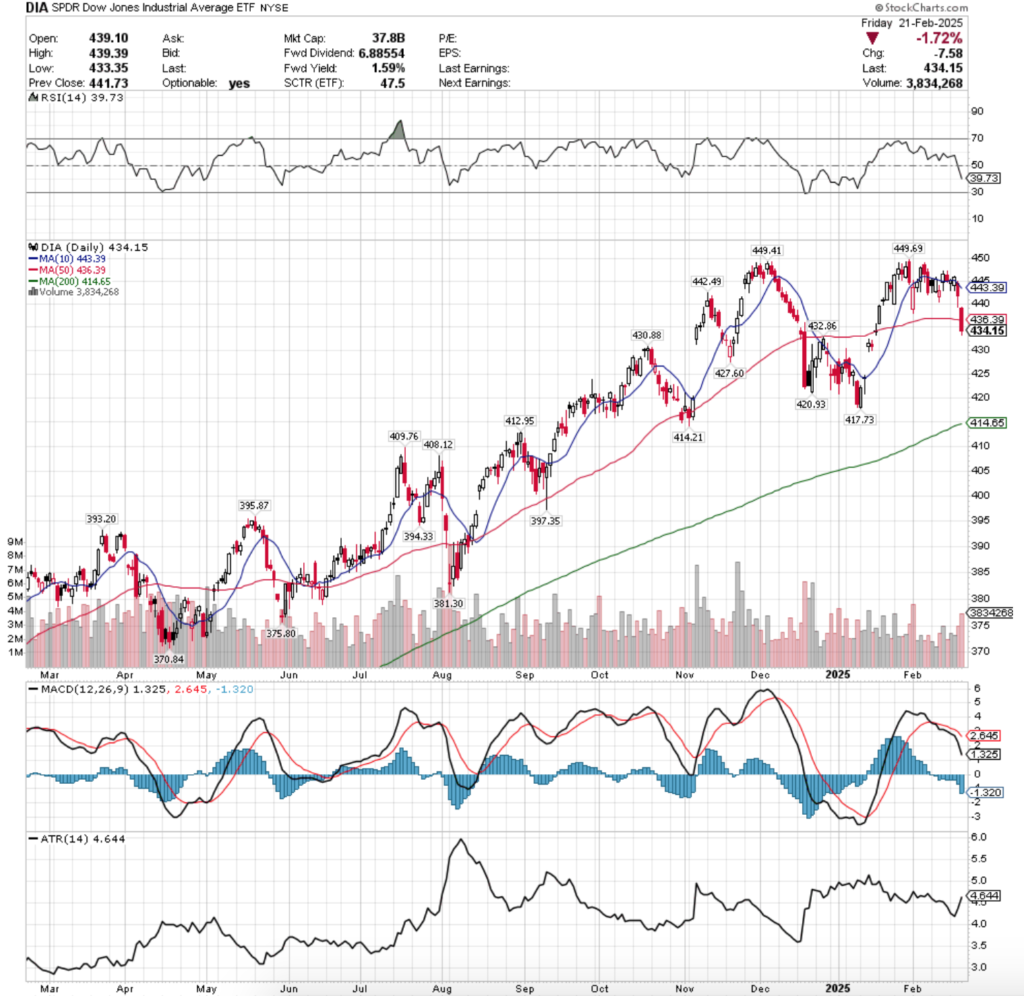
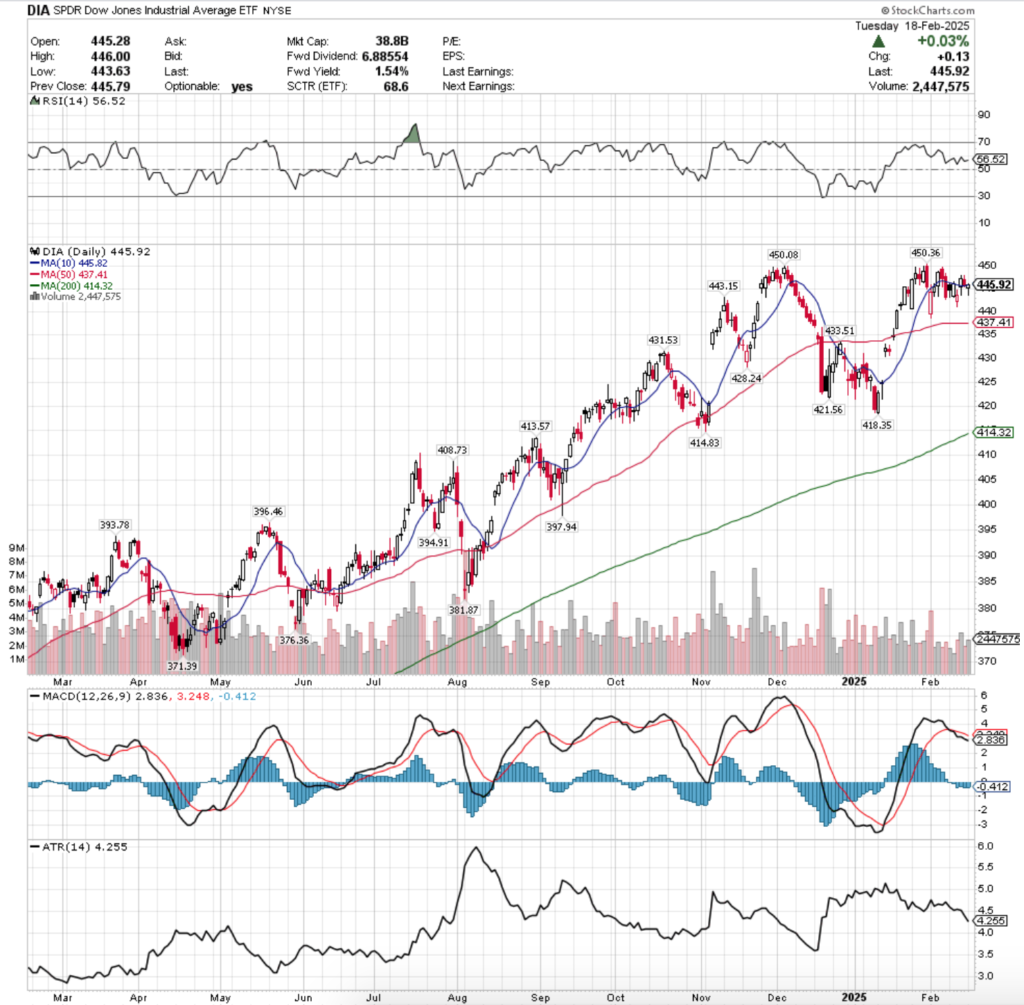
DIA, the SPDR Dow Jones Industrial Average ETF added only +4.88% last week, as the blue chip index was the second least favored of the major four index ETFs.
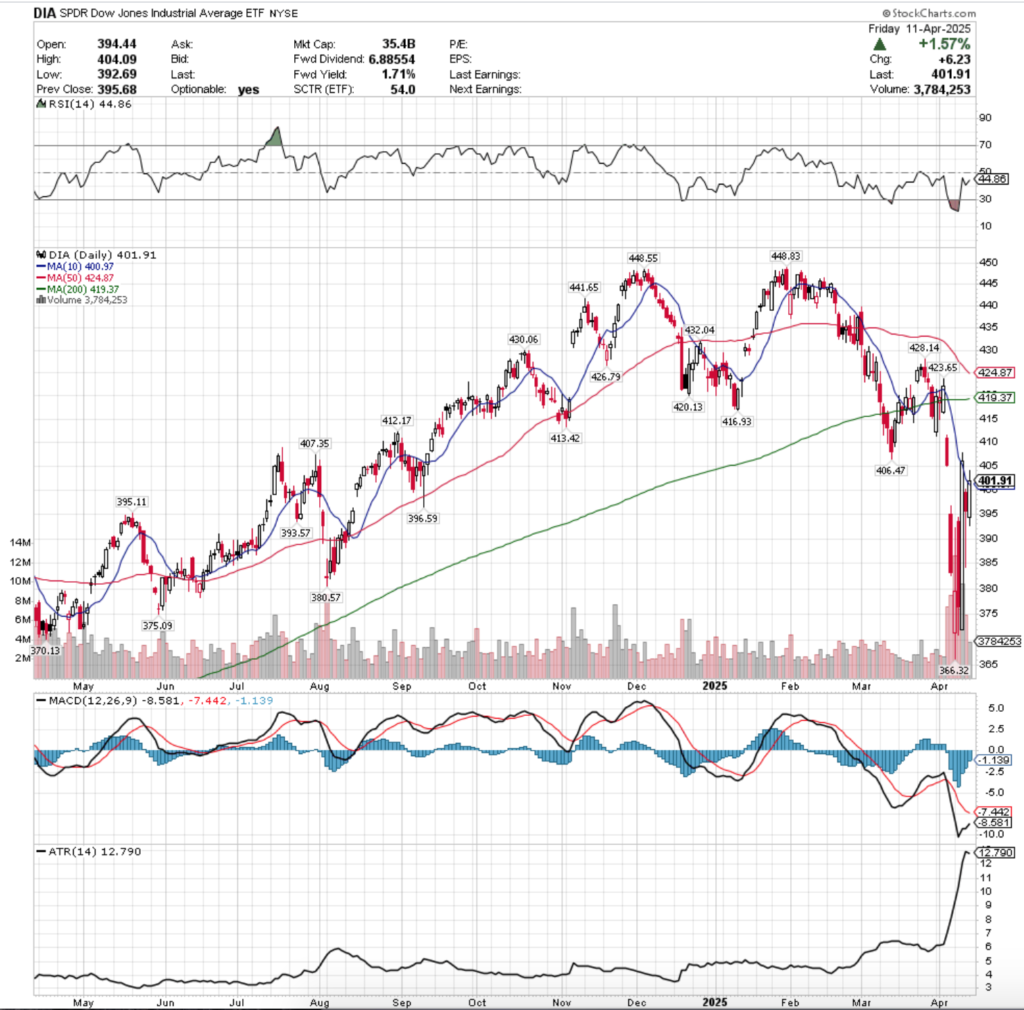
Their RSI is at 44.86 trending higher towards the neutral 50 mark, while their MACD is trending towards the signal line with its histogram waning,
Volumes were +144.91% above the prior year’s average level (8,054,000 vs. 3,288,492), which like the aforementioned examples isn’t exactly a vote of confidence.
DIA’s week was highly similar to the three above examples & as a result it’s really not worth diving into deeply, given the blue chip index has been the most resilient of the bunch over the past few years.
The same issue apply, we can’t form a base to spring upward from without an increase in advancing volume, and last week was still most declining volume.
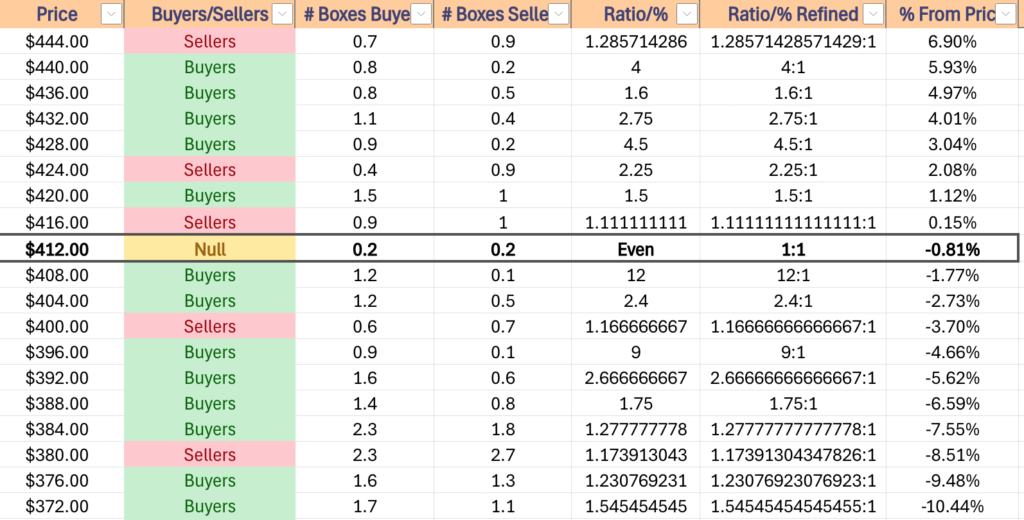
DIA has the safest chart from a support perspective, but when all’s breaking down it’s not necessarily something to be bragging about…
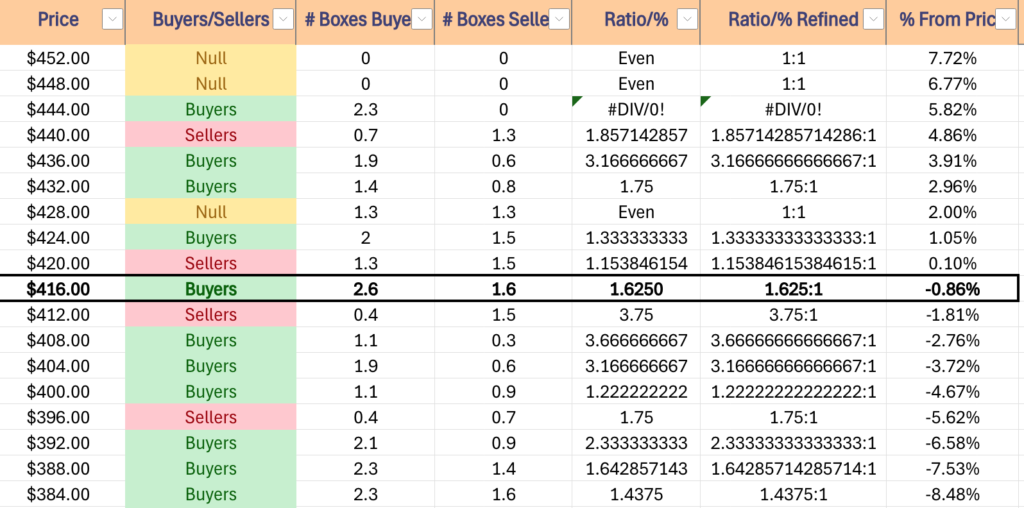
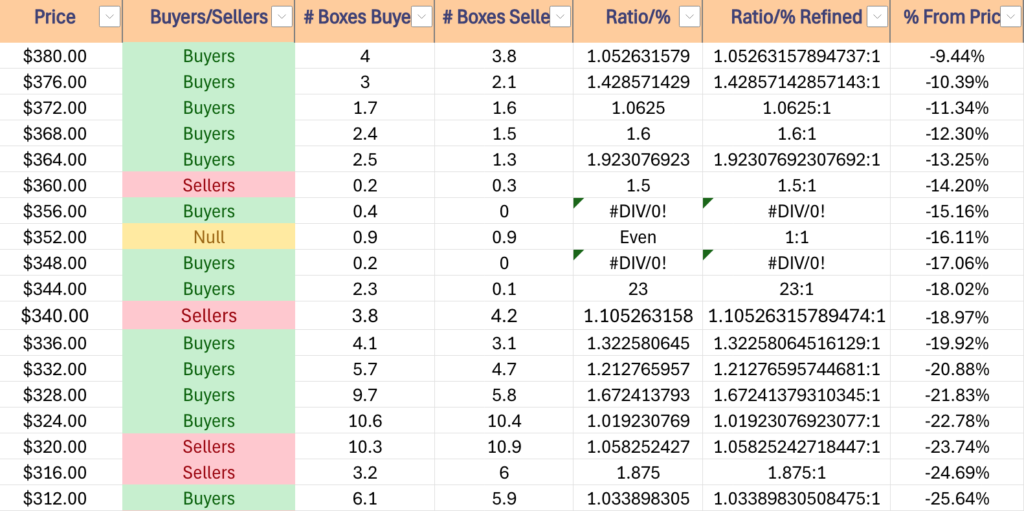
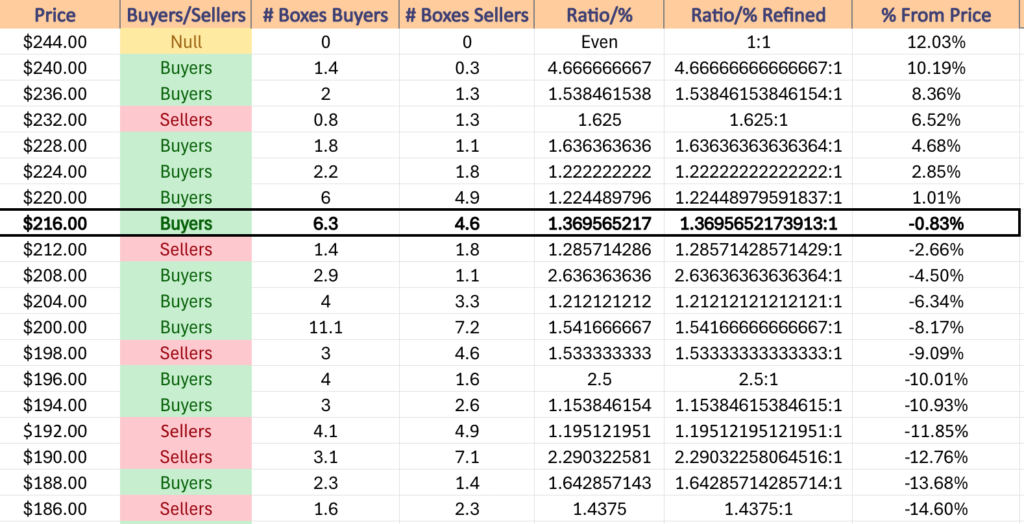
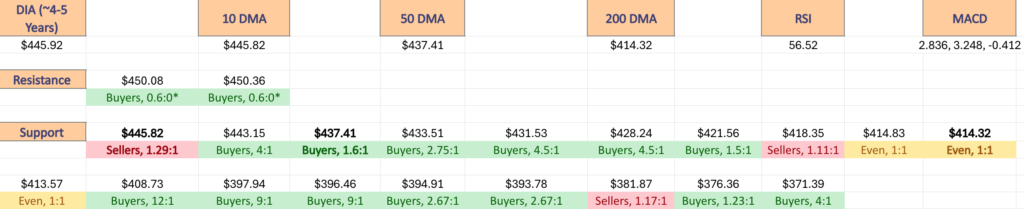
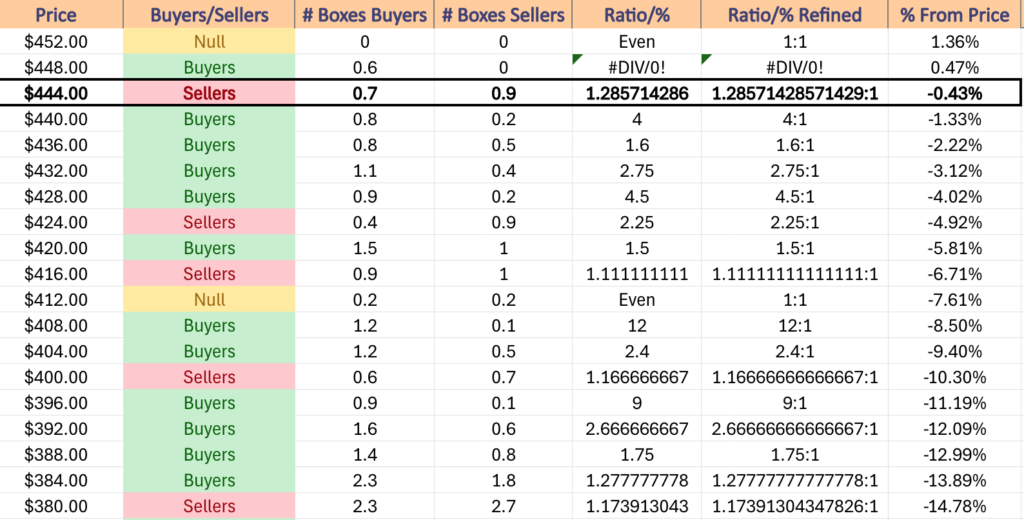
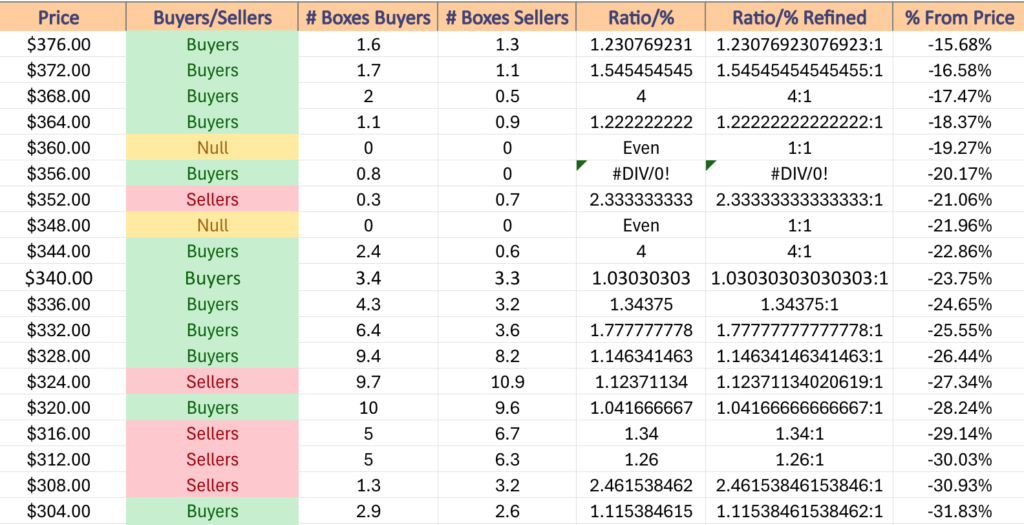
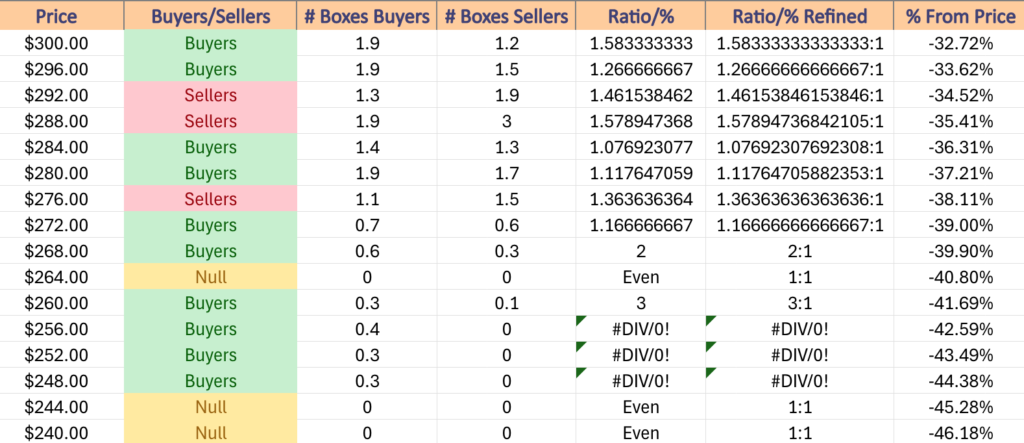
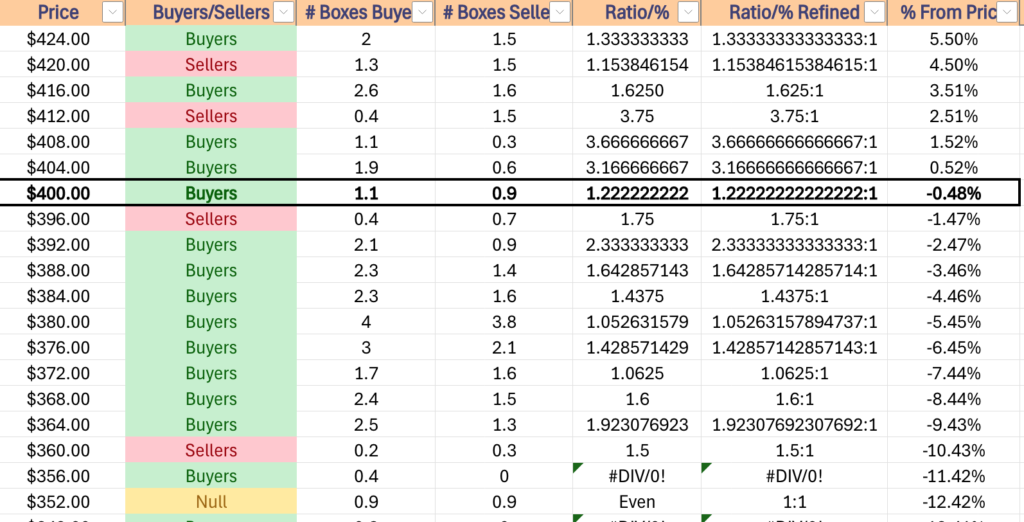
My eyes are peeled for the $366.32 support level, it’s where over the past ~4-5 years Buyers have stepped in strongly, but it’s the most recent support level & coincidentally the lowest on their one year chart… not inspiring in the least & as such it’s worth watching this week for a test & a potential breakdown, as if it breaks down it’s going to be a harbinger of more big issues to come.
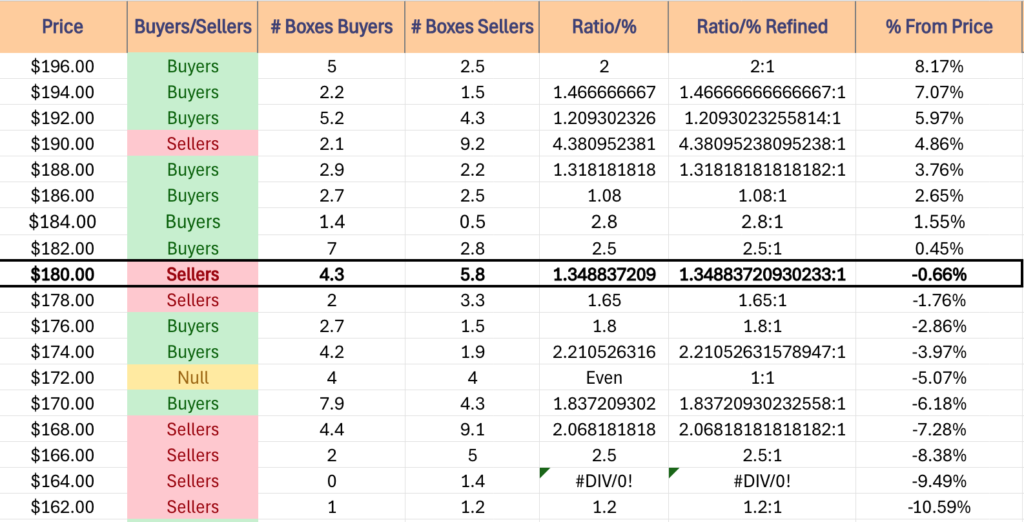
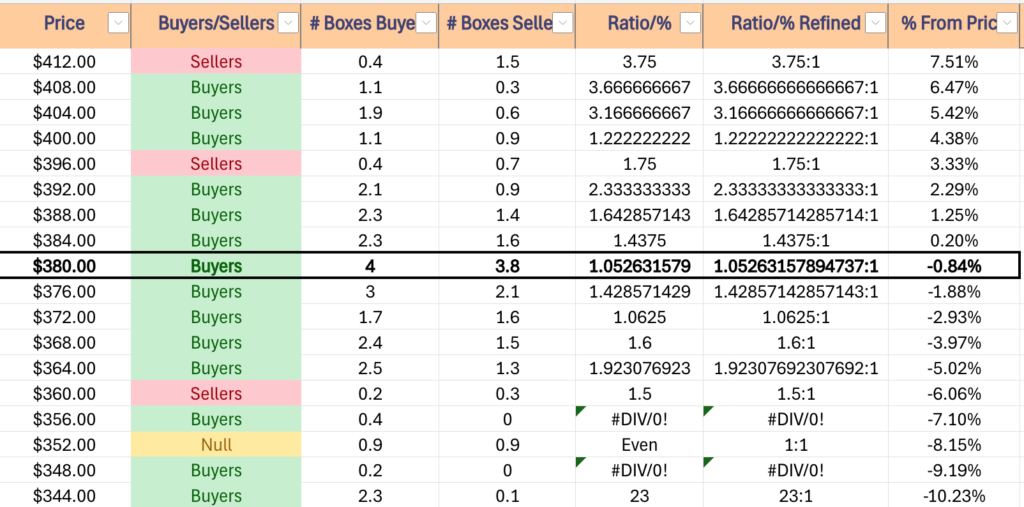
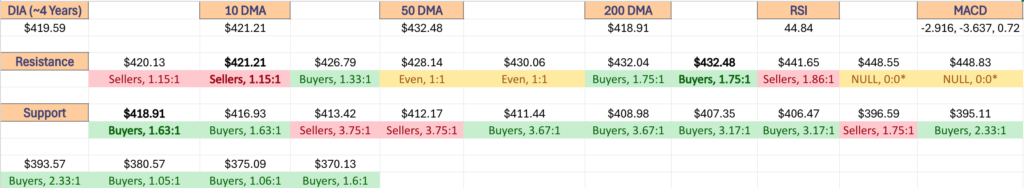
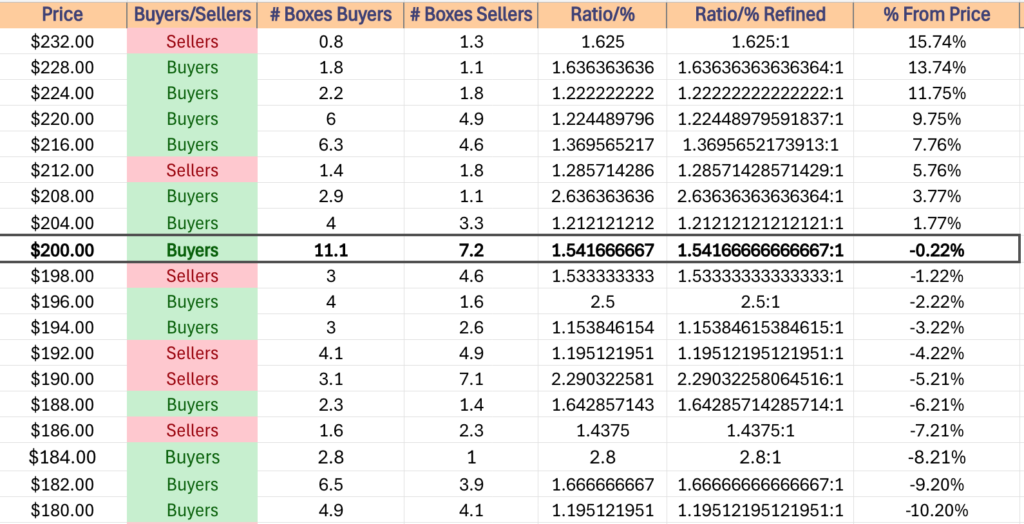
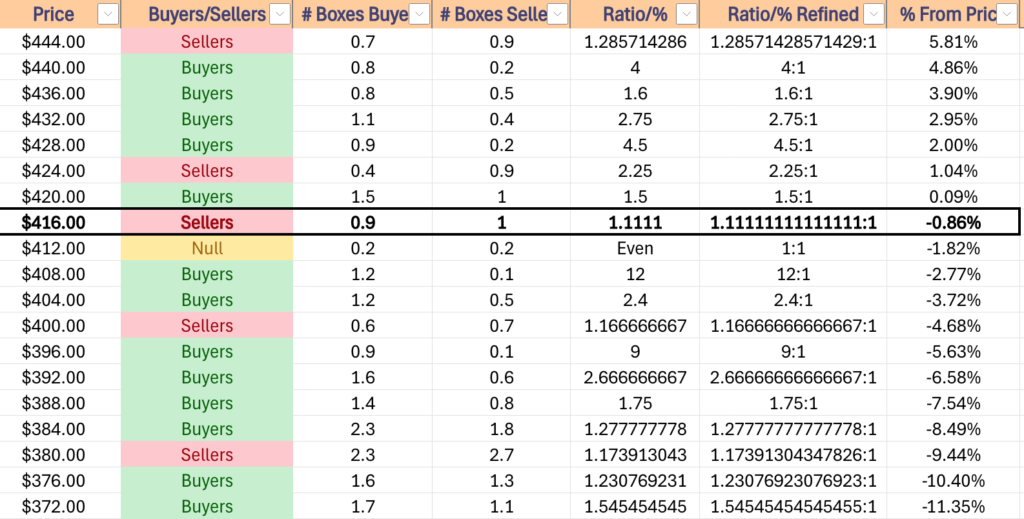
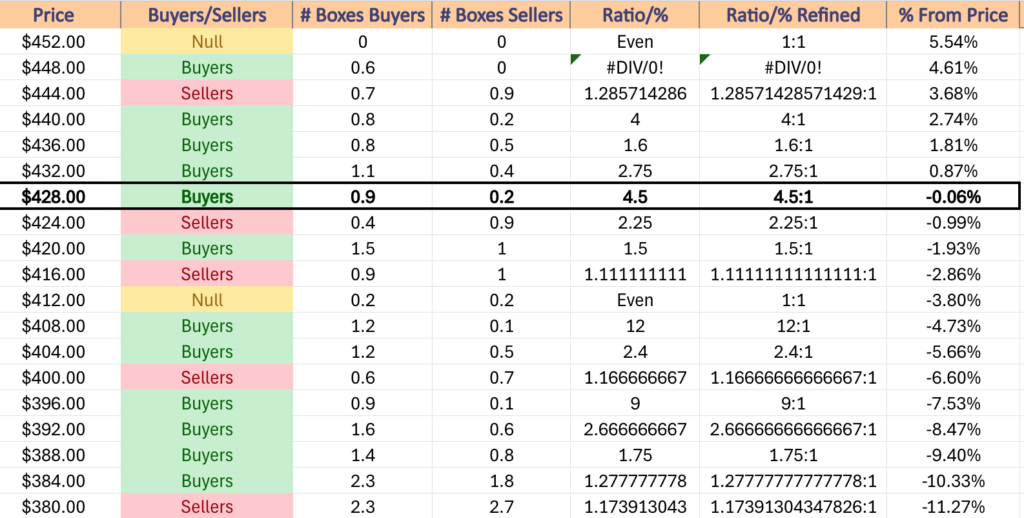
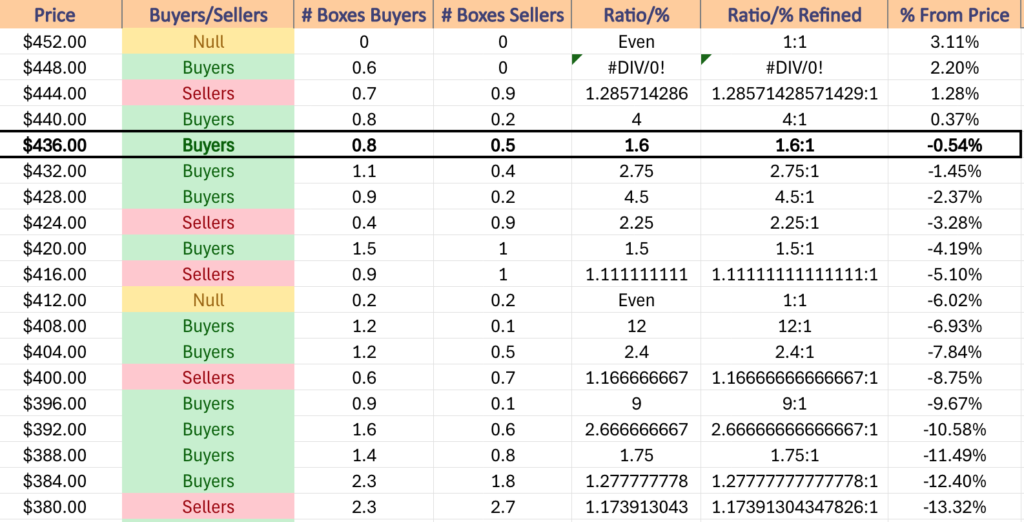
DIA has support at the $400.97 (10 Day Moving Average, Volume Sentiment: Buyers, 1.22:1), $396.59 (Volume Sentiment: Sellers, 1.75:1), $395.11 (Volume Sentiment: Buyers, 2.33:1) & $393.57/share (Volume Sentiment: Buyers, 2.33:1) price levels, with resistance at the $406.47 (Volume Sentiment: Buyers, 3.17:1), $407.35 (Volume Sentiment: Buyers, 3.17:1), $413.42 (Volume Sentiment: Sellers, 3.75:1) & $416.93/share (Volume Sentiment: Buyers, 1.63:1) price levels.
The Week Ahead
Monday the week kicks off with Fed President Harker speaking at 6 on & Fed President Bostic speaking at 7:40 pm.
Goldman Sachs & M&T Bank report earnings on Monday morning before the session opens, followed by Applied Digital, FB Financial & Pinnacle Financial after the closing bell.
Import Price Index, Import Price minus Fuel & Empire State Manufacturing Survey data are all due for release on Tuesday morning at 8:30 am.
Tuesday morning’s earnings calls feature Johnson & Johnson, Albertson’s, Bank of America, Citigroup, Ericsson & PNC, before Fulton Financial, Hancock Whitney, Interactive Brokers, J.B. Hunt Transport & United Airlines after the session’s close.
Wednesday begins with U.S. Retail Sales & Retail Sales minus Autos at 8:30 am, followed by Industrial Production & Capacity Utilization data at 9:15 am, Business Inventories & Home Builder Confidence Index data at 10 am & Fed President Hammack speaking at 12 pm.
Abbott Labs, ASML, Autoliv, Citizens Financial Group, First Horizon, Prologis, Travelers & U.S. Bancorp all report earnings before Wednesday morning’s session, before Alcoa, Bank OZK, CSX, F.N.B., First Industrial Realty, Home Bancshares, Liberty Energy, Rexford Industrial Realty, Simmons First National, SL Green Realty, Synovus & Triumph Financial report after the closing bell.
Initial Jobless Claims, Housing Starts, Building Permits & Philadelphia Fed Manufacturing Survey data are all released Thursday at 8:30 am.
Thursday morning’s earnings calls kick off with UnitedHealth Group, Ally Financial, American Express, Badger Meter, Charles Schwab, D.R. Horton, Fifth Third, Huntington Banc, Insteel Industries, KeyCorp, Manpower, Regions Financial, Snap-On, State Street, Texas Capital & Truist.
Friday begins with Fed President Daly speaking at 8 am & there are no noteworthy earnings reports scheduled.
See you back here next week!
*** I DO NOT OWN SHARES OR OPTIONS CONTRACT POSITIONS IN SPY, QQQ, IWM OR DIA AT THE TIME OF PUBLISHING THIS ARTICLE ***