Since our last Volume Sentiment Analysis SPY, QQQ, IWM & DIA have continued to reach new all-time highs, but things have become to look less & less stable & sustainable, making it a great time to check in on historic volume sentiments.
Last night the VIX closed at 15.35, indicating an implied one day move range of +/-0.97% & an implied one month move range of +/-4.44% & it seems more likely it’ll heat up than cool down in the near-to-mid-term.
Volumes have been questionable-to-unstable at best (see this week’s market review note) & AI/related-tech has clearly become the long-shot bet that has not proven itself & is not fully prepared to scale at the rates forecasters are projecting (pending a lot of other changes in other sectors & infrastructure), yet is fueling the mania.
This makes it worth checking in on historic volume sentiments in the event of near-term re-tests to assess the strength/weakness of support/resistance levels for the major index ETFs.
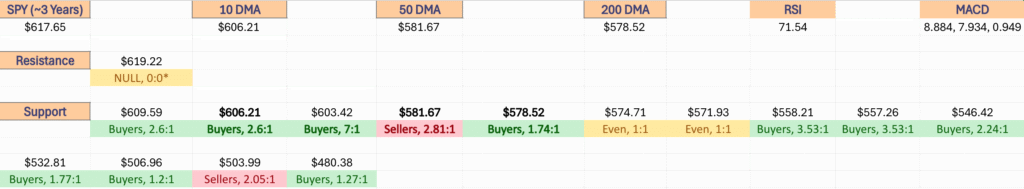
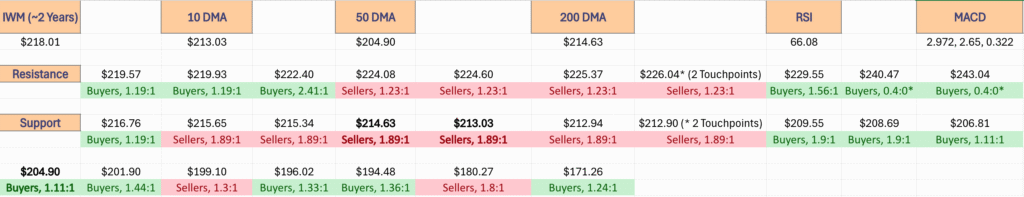
Each section below contains a view of each index ETF’s chart (for a technical breakdown of each’s chart, see the link above for last week’s note), as well as a list of their current one year support & resistance levels with the volume sentiment noted beneath it on the table.
There is an additional table beneath this table with each price level’s sentiment, as well as a typed text version below that is able to be copied & pasted.
Note that “NULL, 0:0*” values denote areas that each name has traded at but with limited volume data to work with from a comparison standpoint in terms of creating a ratio of buyers:sellers (or vice versa) or is the outlier above the highest/lowest level with price data.
Also, prices that do have a ratio of Buyers:Sellers (Sellers:Buyers) where the denominator is 0 are denoted with an asterisk “*” as well.
In the written lists of the price levels & volume sentiments the price levels that contain support & resistance levels are marked in BOLD.
Recall that at price extremes such as the highs that we have recently hit there will tend to be skewed data due to the small sample size & factor that into how you interpret each price level’s reported sentiment.
This is intended to serve as an additional tool, similar to a barometer to use during your due diligence process & is not meant to replace doing your own research & is not financial advice.
Price Level:Volume Sentiment Analysis For SPY, the SPDR S&P 500 ETF

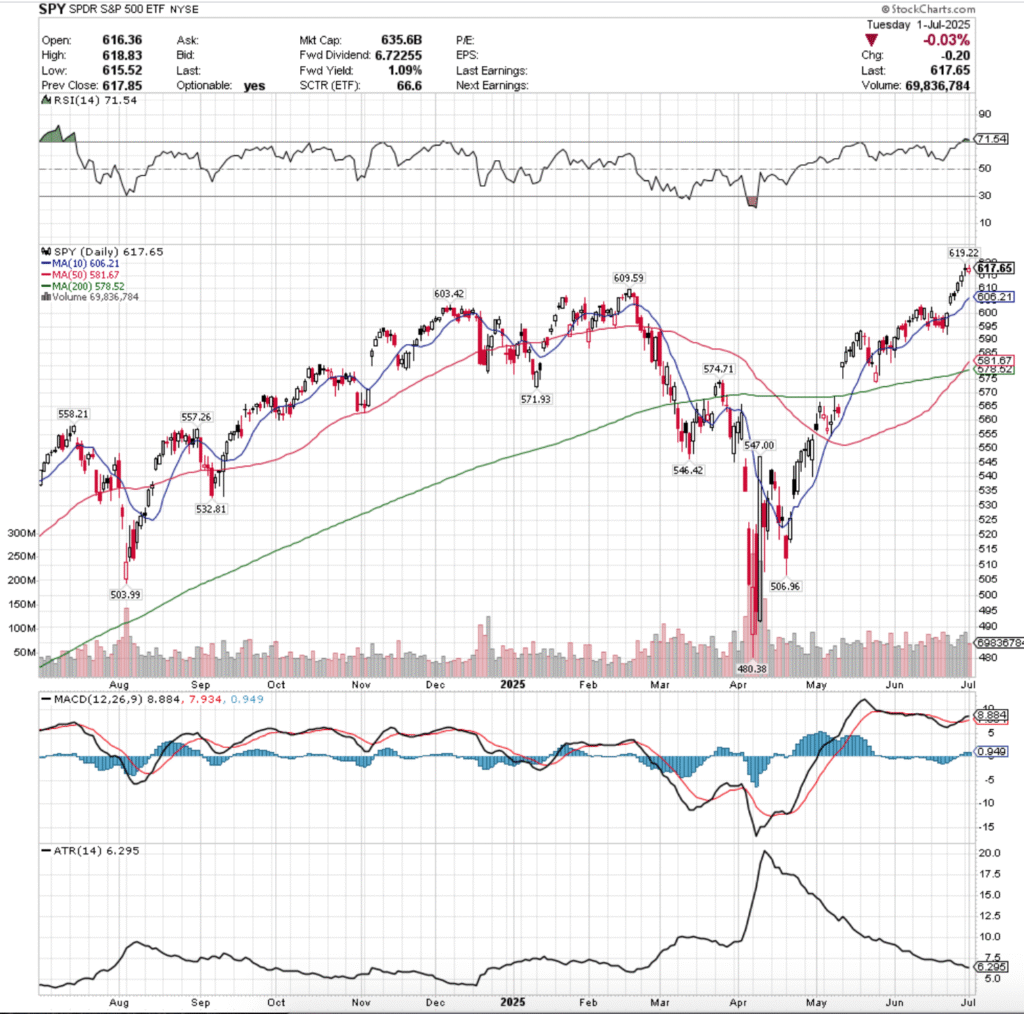
SPY, the SPDR S&P 500 ETF is still hovering around it’s upper Bollinger band intraday, but is beginning to show signs of overextension, particularly due to the volume/participation rate.
For a deeper dive into SPY’s technicals, see the link to the market review note above.


$655 – NULL – 0:0*, +0.00% From Current Price Level – Current Price Level*
$650 – NULL – 0:0*, -0.76% From Current Price Level
$645 – NULL – 0:0*, -1.53% From Current Price Level – 10 Day Moving Average*
$640 – NULL – 0:0*, -2.29% From Current Price Level
$635 – Sellers – 1.24:1, -3.05% From Current Price Level – 50 Day Moving Average*
$630 – Buyers – 1.09:1, -3.82% From Current Price Level
$625 – Buyers – 2.46:1, -4.58% From Current Price Level
$620 – Sellers – 1.61:1, -5.34% From Current Price Level
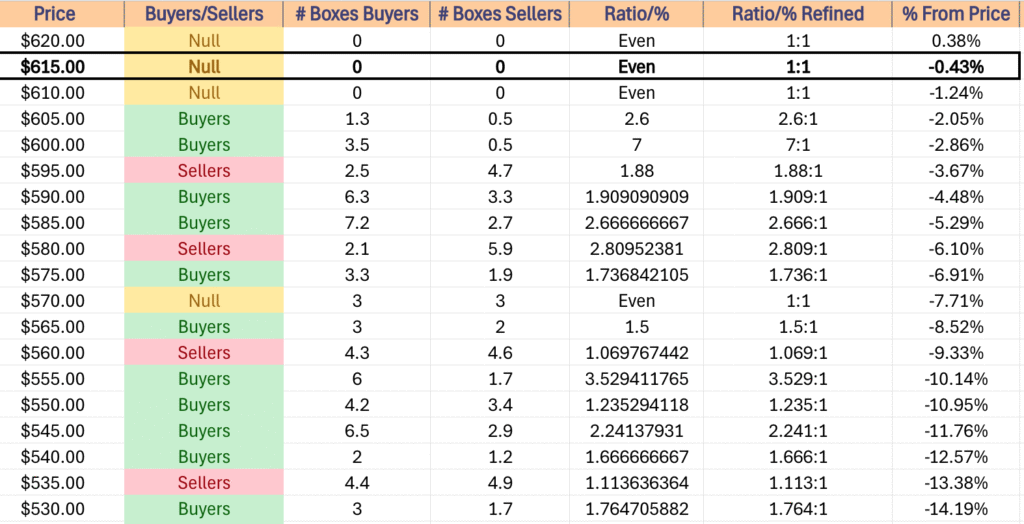
$615 – Buyers – 1.8:1, -6.11% From Current Price Level
$610 – Buyers – 1.5:0*, -6.87% From Current Price Level
$605 – Buyers – 3.83:1, -7.63% From Current Price Level
$600 – Buyers – 12.2:1, -8.4% From Current Price Level
$595 – Sellers – 2.08:1, -9.16% From Current Price Level
$590 – Buyers – 1.3:1, -9.93% From Current Price Level – 200 Day Moving Average*
$585 – Buyers – 2.67:1, -10.69% From Current Price Level
$580 – Sellers – 2.81:1, -11.45% From Current Price Level
$575 – Buyers – 1.74:1, -12.22% From Current Price Level
$570 – Even – 1:1, -12.98% From Current Price Level
$565 – Buyers – 1.5:1, -13.74% From Current Price Level
$560 – Sellers – 1.07:1, -14.51% From Current Price Level
$555 – Buyers – 3.53:1, -15.27% From Current Price Level
$550 – Buyers – 1.24:1, -16.03% From Current Price Level
$545 – Buyers – 2.24:1, -16.8% From Current Price Level
$540 – Buyers – 1.67:1, -17.56% From Current Price Level
$535 – Sellers – 1.11:1, -18.32% From Current Price Level
$530 – Buyers – 1.67:1, -19.09% From Current Price Level
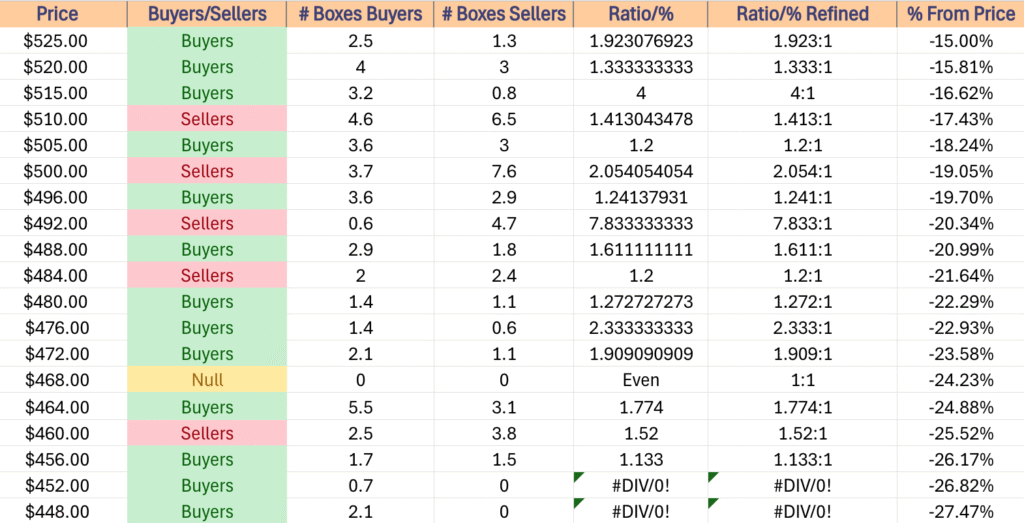
$525 – Buyers – 1.92:1, -19.85% From Current Price Level
$520 – Buyers – 1.33:1, -20.61% From Current Price Level
$515 – Buyers – 4:1, -21.38% From Current Price Level
$510 – Sellers – 1.41:1, -22.14% From Current Price Level
$505 – Buyers – 1.2:1, -22.9% From Current Price Level
$500 – Sellers – 2.05:1, -23.57% From Current Price Level
$496 – Buyers – 1.24:1, -24.28% From Current Price Level
$492 – Sellers – 7.83:1, -24.89% From Current Price Level
$488 – Buyers – 1.61:1, -25.5% From Current Price Level
$484 – Sellers – 1.2:1, -26.11% From Current Price Level
$480 – Buyers – 1.27:1, -26.72% From Current Price Level
$476 – Buyers – 2.33:1, -27.33% From Current Price Level
$472 – Buyers – 1.91:1, -27.94% From Current Price Level
$468 – NULL – 0:0*, -28.55% From Current Price Level
$464 – Buyers – 1.83:1, -29.16% From Current Price Level
$460 – Sellers – 1.52:1, -29.77% From Current Price Level
$456 – Buyers – 1.13:1, -30.38% From Current Price Level
$452 – Buyers – 0.7:0*, -30.99% From Current Price Level
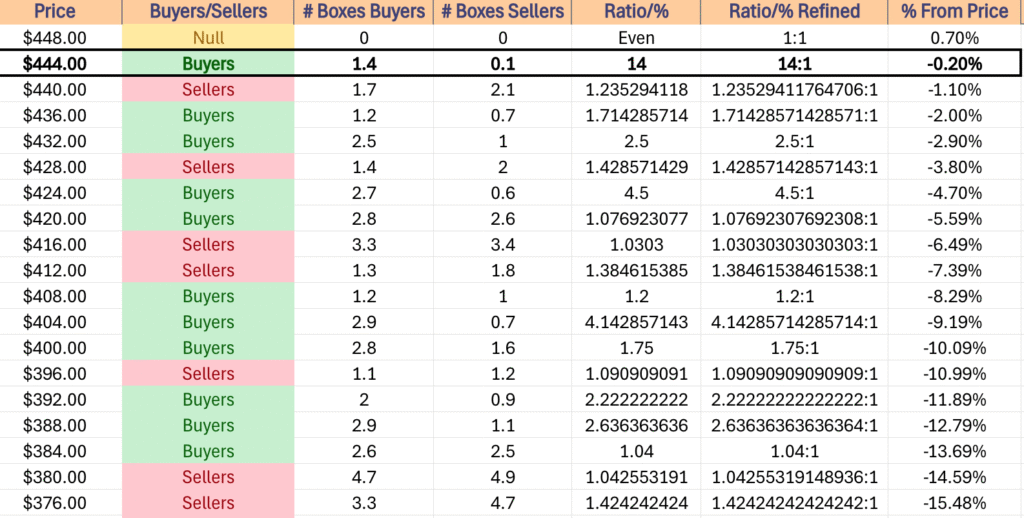
$448 – Buyers – 2:0*, -31.6% From Current Price Level
$444 – Buyers – 1.42:1, -32.21% From Current Price Level
$440 – Buyers – 2.78:1, -32.83% From Current Price Level
$436 – Buyers – 1.87:1, -33.44% From Current Price Level
$432 – Sellers – 1.58:1, -34.05% From Current Price Level
$428 – Buyers – 1.22:1, -34.66% From Current Price Level
$424 – Buyers – 1.92:1, -35.27% From Current Price Level
$420 – Sellers – 1.68:1, -35.88% From Current Price Level
$416 – Buyers – 1.08:1, -36.49% From Current Price Level
$412 – Buyers – 1.31:1, -37.1% From Current Price Level
$408 – Sellers – 1.63:1, -37.71% From Current Price Level
$404 – Buyers – 1.95:1, -38.32% From Current Price Level
$400 – Buyers – 2.51:1, -38.93% From Current Price Level
$396 – Sellers – 1.8:1, -39.54% From Current Price Level
$392 – Sellers – 1.97:1, -40.15% From Current Price Level
$388 – Buyers – 5:1, -40.76% From Current Price Level
$384 – Buyers – 1.67:1, -41.37% From Current Price Level
$380 – Buyers – 1.39:1, -41.99% From Current Price Level
$376 – Sellers – 2.47:1, -42.6% From Current Price Level
$372 – Sellers – 2.11:1, -43.21% From Current Price Level
$368 – Sellers – 2:1, -43.82% From Current Price Level
$364 – Sellers – 1.28:1, -44.43% From Current Price Level
$360 – Buyers – 1.11:1, -45.04% From Current Price Level
$356 – Buyers – 1.43:1, -45.65% From Current Price Level
$352 – Buyers – 1.67:1, -46.26% From Current Price Level
$348 – Sellers – 0.9:0*, -46.87% From Current Price Level
$344 – NULL – 0:0*, -47.48% From Current Price Level
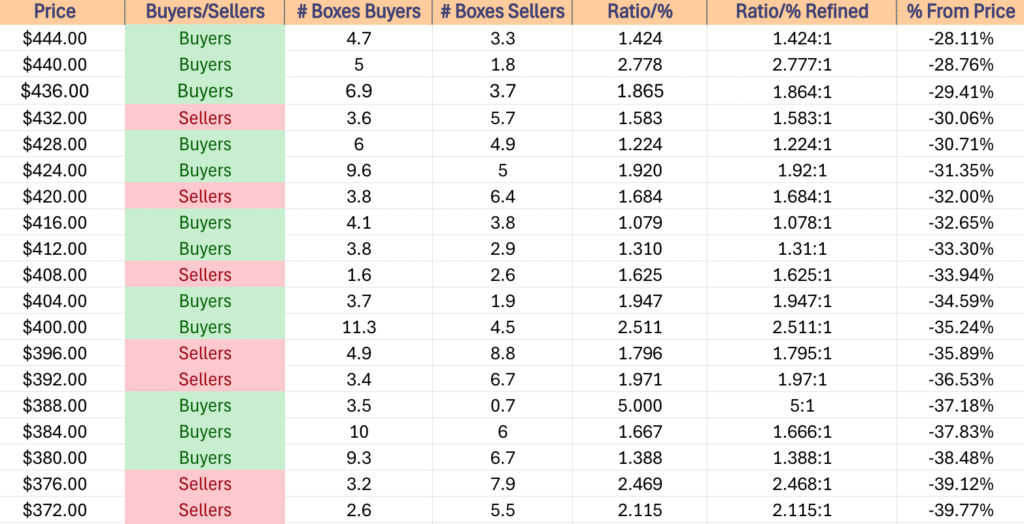
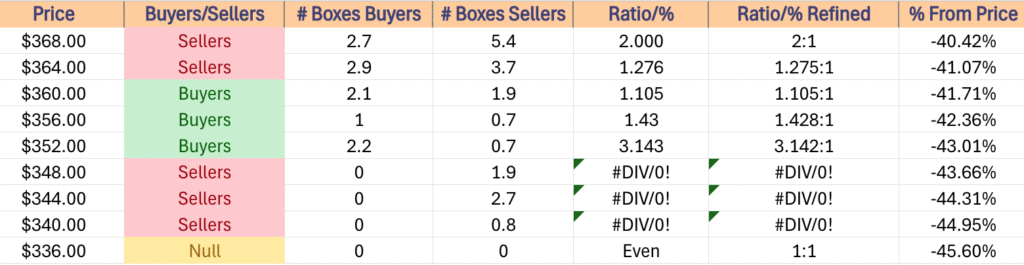
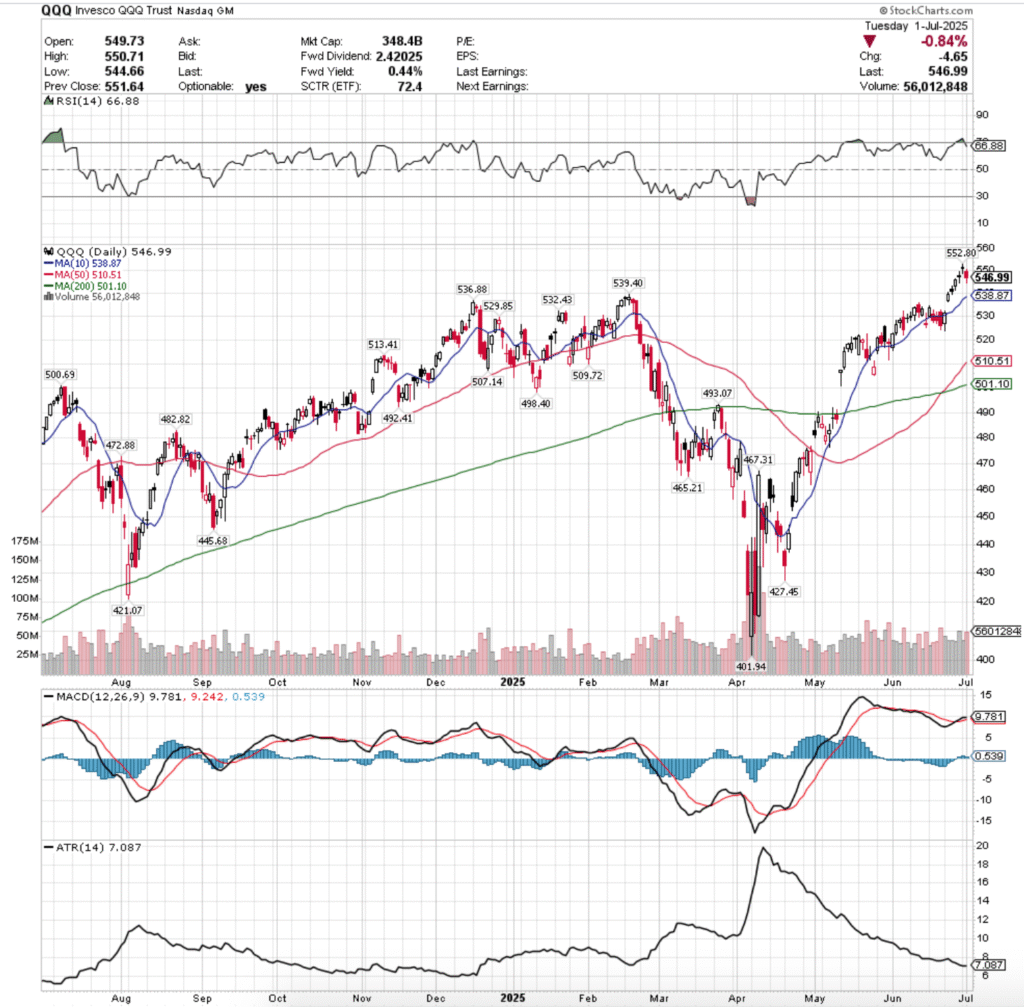
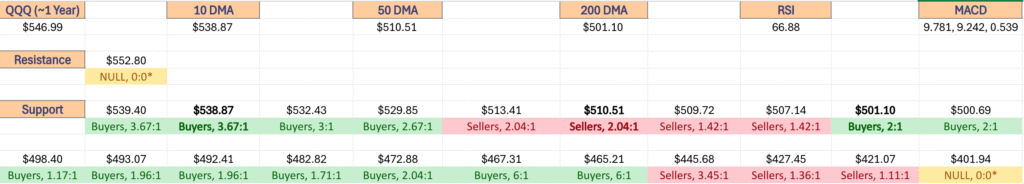
Price Level:Volume Sentiment Analysis For QQQ, The Invesco QQQ Trust ETF

QQQ, the Invesco QQQ Trust ETF has also benefitted from the AI/tech boom, but has shown a more conservative performance of recent vs. SPY.
Given the heights & gappy performance of recent from QQQ components the table below can serve as a barometer for how they may perform in coming re-tests for market participants.


$585 – NULL – 0:0*, +0.34% From Current Price Level
$580 – Buyers – 2:0*, -0.52% From Current Price Level – Current Price Level*
$575 – Sellers – 1.3:1, -1.38% From Current Price Level – 10 Day Moving Average*
$570 – Buyers – 1.79:1, -2.24% From Current Price Level
$565 – Sellers – 1.28:1, -3.09% From Current Price Level – 50 Day Moving Average*
$560 – Sellers – 1.18:1, -3.95% From Current Price Level
$555 – Buyers – 6.25:1, -4.81% From Current Price Level
$550 – Sellers – 1.28:1, -5.67% From Current Price Level
$545 – Buyers – 1.92:1, -6.52% From Current Price Level
$540 – Buyers – 1:0*, -7.38% From Current Price Level
$535 – Buyers – 5.5:1, -8.24% From Current Price Level
$530 – Buyers – 3.45:1, -9.1% From Current Price Level
$525 – Buyers – 1.11:1, -9.95% From Current Price Level
$520 – Buyers – 1.84:1, -10.81% From Current Price Level – 200 Day Moving Average*
$515 – Buyers – 1.1:1, -11.67% From Current Price Level
$510 – Sellers – 2.04:1, -12.53% From Current Price Level
$505 – Sellers – 1.42:1, -13.39% From Current Price Level
$500 – Buyers – 1.79:1, -14.24% From Current Price Level
$496 – Buyers – 1.17:1, -14.93% From Current Price Level
$492 – Buyers – 1.49:1, -15.61% From Current Price Level
$488 – Buyers – 2.58:1, -16.3% From Current Price Level
$484 – Buyers – 1.17:1, -16.99% From Current Price Level
$480 – Buyers – 1.35:1, -17.67% From Current Price Level
$476 – Sellers – 1.06:1, -18.36% From Current Price Level
$472 – Buyers – 1.69:1, -19.05% From Current Price Level
$468 – Sellers – 2.68:1, -19.73% From Current Price Level
$464 – Buyers – 5.46:1, -20.42% From Current Price Level
$460 – Buyers – 1.79:1, -21.1% From Current Price Level
$456 – Buyers – 1.48:1, -21.79% From Current Price Level
$452 – Buyers – 1.17:1, -22.48% From Current Price Level
$448 – Even – 1:1, -23.16% From Current Price Level
$444 – Sellers – 2.25:1, -23.85% From Current Price Level
$440 – Sellers – 1.31:1, -24.53% From Current Price Level
$436 – Buyers – 1.6:0*, -25.22% From Current Price Level
$432 – Sellers – 4.6:0*, -25.91% From Current Price Level
$428 – NULL – 0:0*, -26.59% From Current Price Level
$424 – NULL – 0:0*, -27.28% From Current Price Level
$420 – Buyers – 1.43:1, -27.96% From Current Price Level
$416 – NULL – 0:0*, -28.65% From Current Price Level
$412 – Sellers – 3.5:0*, -29.34% From Current Price Level
$408 – NULL – 0:0*, -30.02% From Current Price Level
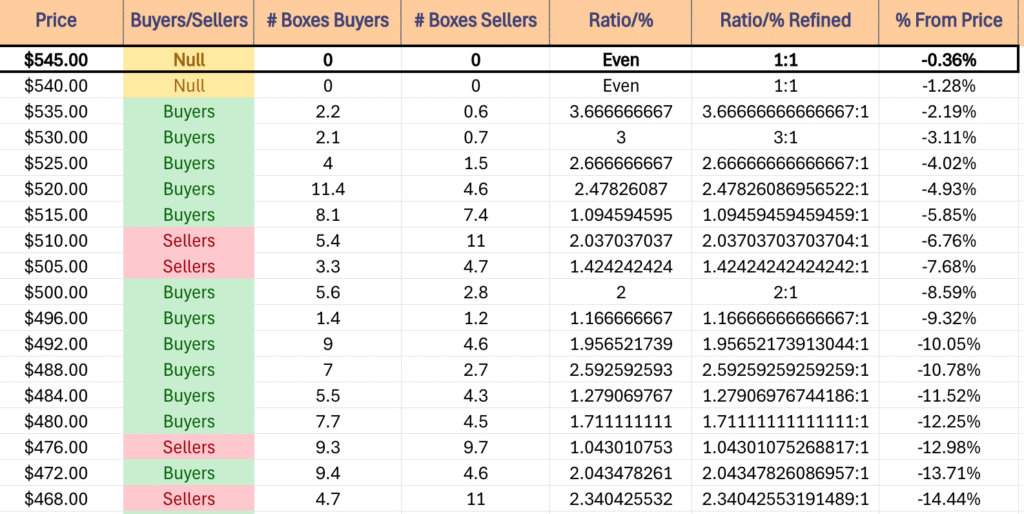
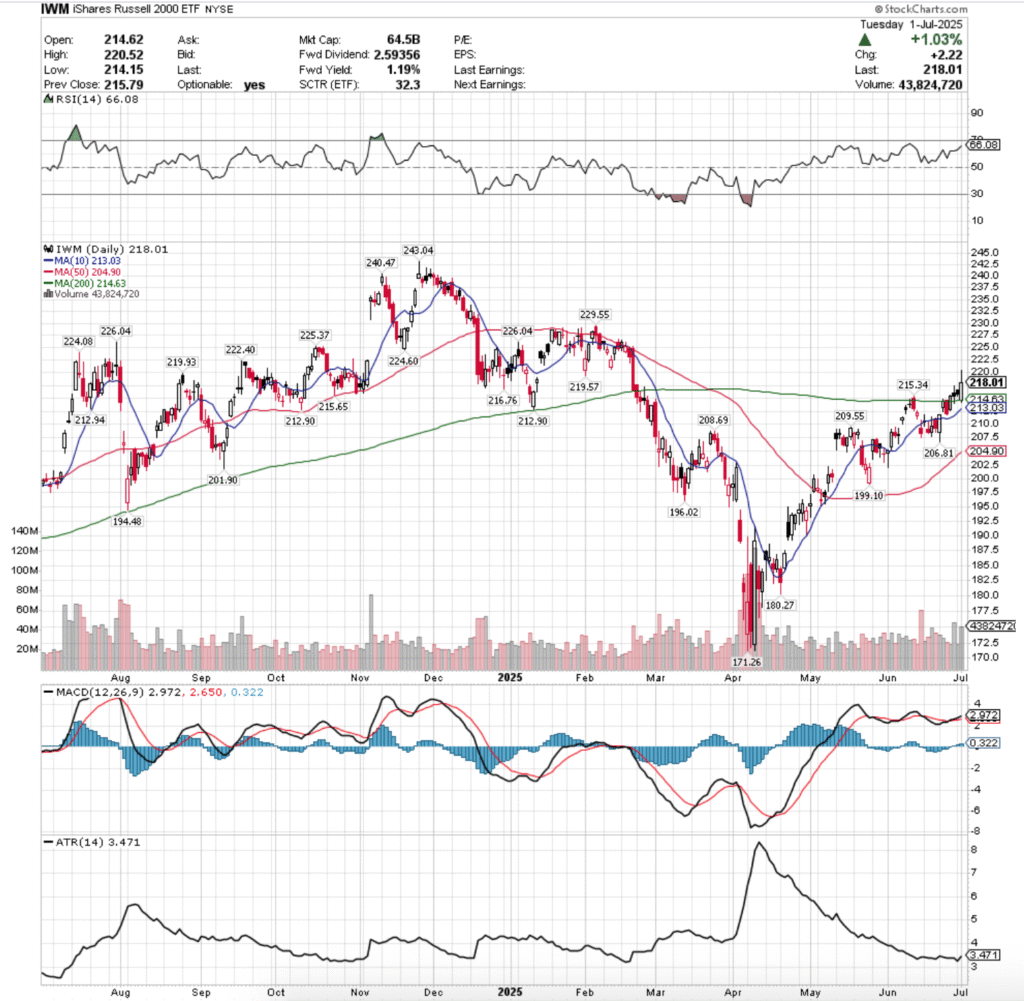
Price Level:Volume Sentiment Analysis For IWM, The iShares Russell 2000 ETF

IWM, the iShares Russell 2000 ETF has moved along at a slower pace than its larger part index ETFs, but its movements in the future will be dictated in part by theirs.
With that said, the table data below can help aid in assessing the strength/weakness of the small cap index’s support/resistance levels.


$244 – NULL – 0:0*, +3.12% From Current Price Level
$240 – Buyers – 0.4:0*, +1.43% From Current Price Level
$236 – Buyers – 2.1:1, -0.26% From Current Price Level – Current Price Level & 10 Day Moving Average**
$232 – Buyers – 1.03:1, -1.95% From Current Price Level
$228 – Buyers – 1.27:1, -3.64% From Current Price Level
$224 – Buyers – 1.09:1, -5.33% From Current Price Level – 50 Day Moving Average*
$220 – Buyers – 1.83:1, -7.02% From Current Price Level
$216 – Even – 1:1, -8.71% From Current Price Level
$212 – Sellers – 1.24:1, -10.4% From Current Price Level – 200 Day Moving Average*
$208 – Buyers – 1.55:1, -12.09% From Current Price Level
$204 – Buyers – 1.12:1, -13.78% From Current Price Level
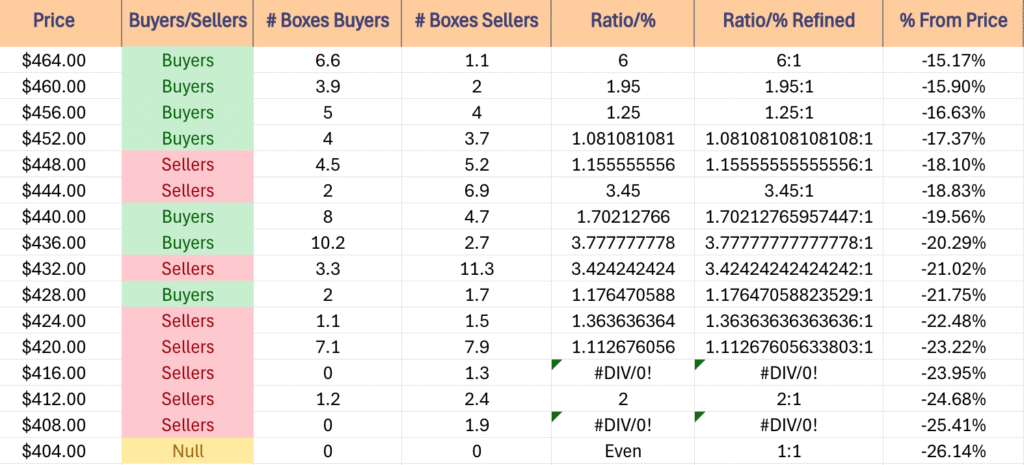
$200 – Buyers – 1.44:1, -15.47% From Current Price Level
$198 – Sellers – 1.35:1, -16.32% From Current Price Level
$196 – Buyers – 1.33:1, -17.16% From Current Price Level
$194 – Buyers – 1.36:1, -18.01% From Current Price Level
$192 – Buyers – 1.24:1, -18.85% From Current Price Level
$190 – Sellers – 2.7:1, -19.7% From Current Price Level
$188 – Buyers – 1.19:1, -20.54% From Current Price Level
$186 – Buyers – 1.42:1, -21.39% From Current Price Level
$184 – Buyers – 1.83:1, -22.23% From Current Price Level
$182 – Buyers – 3.38:1, -23.08% From Current Price Level
$180 – Sellers – 1.8:1, -23.93% From Current Price Level
$178 – Sellers – 2.2:1, -24.77% From Current Price Level
$176 – Buyers – 1.27:1, -25.62% From Current Price Level
$174 – Buyers – 1.68:1, -26.46% From Current Price Level
$172 – Buyers – 1.18:1, -27.31% From Current Price Level
$170 – Buyers – 1.24:1, -28.15% From Current Price Level
$168 – Sellers – 1.39:1, -29% From Current Price Level
$166 – Sellers – 1.27:1, -29.84% From Current Price Level
$164 – Sellers – 1.78:1, -30.69% From Current Price Level
$162 – Even – 1:1, -31.53% From Current Price Level
$160 – Sellers – 1.07:1, -32.38% From Current Price Level
$158 – NULL – 0:0*, -33.22% From Current Price Level
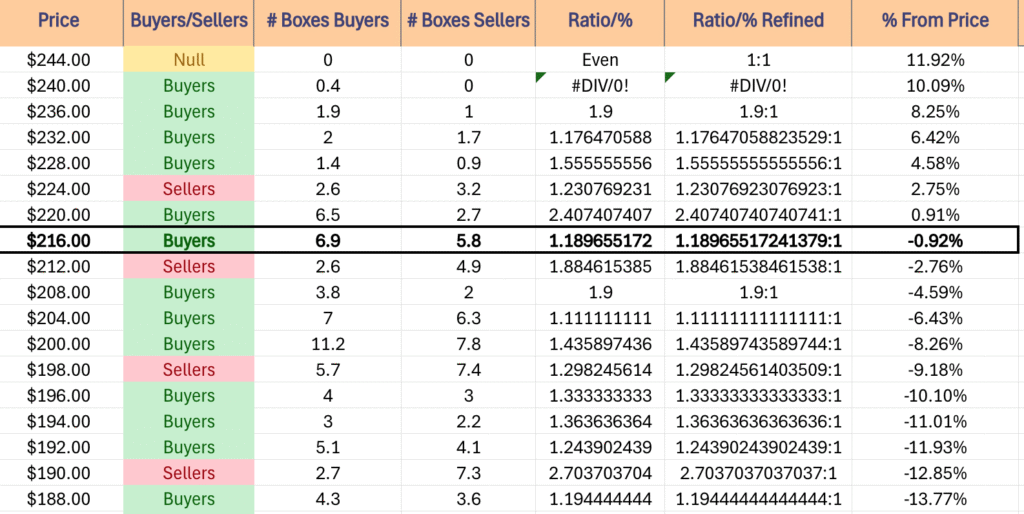
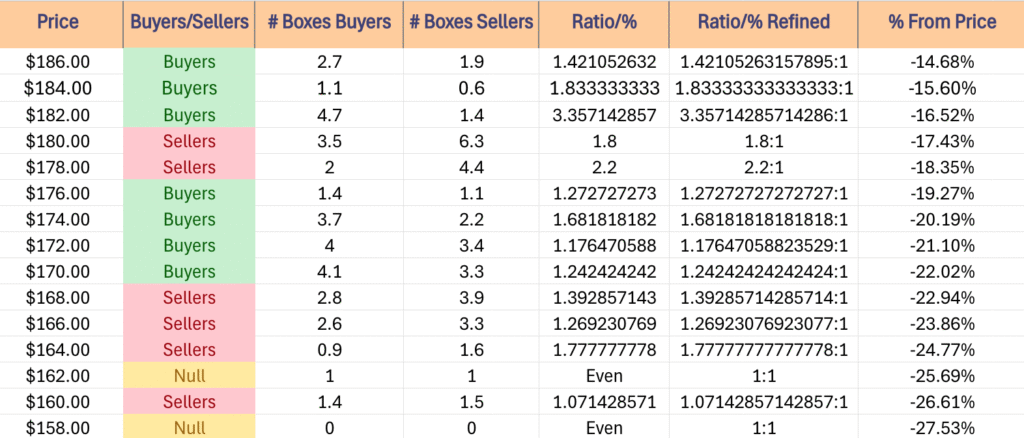
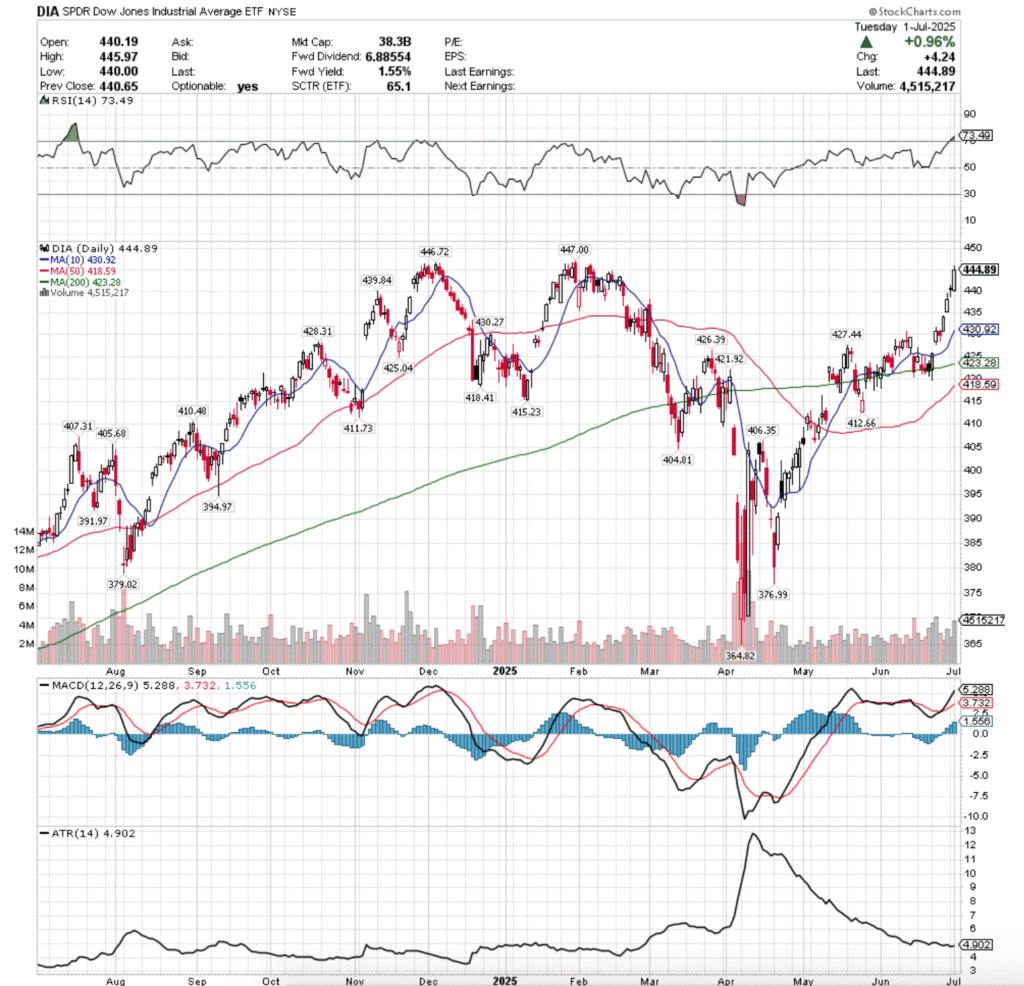
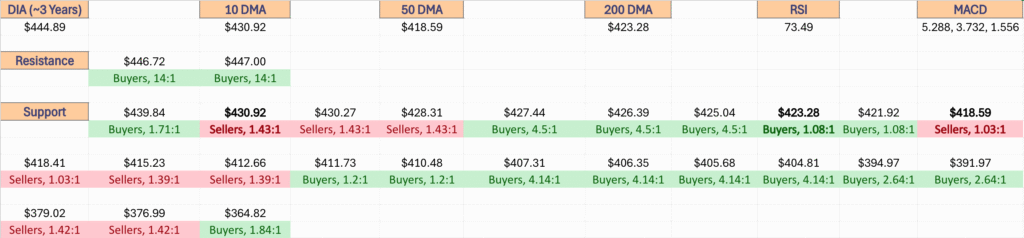
Price Level:Volume Sentiment Analysis For DIA, The SPDR Dow Jones Industrial Average ETF

DIA, the SPDR Dow Jones Industrial Average ETF has shown that investors have been shuffling money & taking profits, but “Buy & Hold” isn’t done yet for most.
When DIA begins to correct it may be felt harder than other indexes as it is a mainly buy & hold index, making the data below worth looking into as an added tool in your assessment of both the ETF & individual names within the index.


$460 – NULL – 0:0*, +0.4% From Current Price Level
$456 – NULL – 0:0*, -0.83% From Current Price Level – Current Price Level & 10 Day Moving Average**
$452 – NULL – 0:0*, -1.7% From Current Price Level
$448 – Buyers – 2.09:1, -2.57% From Current Price Level
$444 – Buyers – 2.24:1, -3.44% From Current Price Level – 50 Day Moving Average*
$440 – Sellers – 1.07:1, -4.31% From Current Price Level
$436 – Sellers – 1.28:1, -5.18% From Current Price Level
$432 – Buyers – 1.53:1, -6.05% From Current Price Level
$428 – Buyers – 1.25:1, -6.92% From Current Price Level – 200 Day Moving Average*
$424 – Buyers – 2.21:1, -7.79% From Current Price Level
$420 – Sellers – 1.11:1, -8.66% From Current Price Level
$416 – Buyers – 1.12:1, -9.53% From Current Price Level
$412 – Sellers – 1.41:1, -10.4% From Current Price Level
$408 – Buyers – 1.06:1, -11.27% From Current Price Level
$404 – Buyers – 7:1, -12.14% From Current Price Level
$400 – Buyers – 1.5:1, -13.01% From Current Price Level
$396 – Sellers – 1.06:1, -13.88% From Current Price Level
$392 – Buyers – 1.92:1, -14.75% From Current Price Level
$388 – Buyers – 2.4:1, -15.62% From Current Price Level
$384 – Sellers – 1.03:1, -16.49% From Current Price Level
$380 – Sellers – 1.02:1, -17.36% From Current Price Level
$376 – Sellers – 1.58:1, -18.23% From Current Price Level
$372 – Buyers – 1.38:1, -19.1% From Current Price Level
$368 – Buyers – 1.07:1, -19.97% From Current Price Level
$364 – Buyers – 1.87:1, -20.84% From Current Price Level
$360 – Buyers – 2.86:1, -21.71% From Current Price Level
$356 – Buyers – 0.3:0*, -22.58% From Current Price Level
$352 – Buyers – 3:1, -23.45% From Current Price Level
$348 – Sellers – 1.25:1, -24.32% From Current Price Level
$344 – Buyers – 1:0*, -25.19% From Current Price Level
$340 – Buyers – 1.63:1, -26.06% From Current Price Level
$336 – Buyers – 1.9:1, -26.93% From Current Price Level
$332 – Buyers – 1.25:1, -27.8% From Current Price Level
$328 – Buyers – 1.54:1, -28.67% From Current Price Level
$324 – Buyers – 1.2:1, -29.54% From Current Price Level
$320 – Buyers – 1.31:1, -30.41% From Current Price Level
$316 – Sellers – 1.09:1, -31.28% From Current Price Level
$312 – Sellers – 1.04:1, -32.15% From Current Price Level
$308 – Buyers – 1.13:1, -33.02% From Current Price Level
$304 – Sellers – 3.6:1, -33.89% From Current Price Level
$300 – Buyers – 1.77:1, -34.76% From Current Price Level
$296 – Sellers – 1.68:1, -35.63% From Current Price Level
$292 – Sellers – 1.57:1, -36.5% From Current Price Level
$288 – Sellers – 1.41:1, -37.37% From Current Price Level
$284 – Sellers – 1.55:1, -38.24% From Current Price Level
$280 – Sellers – 2.25:1, -39.11% From Current Price Level
$276 – Sellers – 8.33:1, 39.98% From Current Price Level
$272 – NULL – 0:0*, 40.85% From Current Price Level
*** I DO NOT OWN SHARES OR OPTIONS CONTRACT POSITIONS IN SPY, QQQ, IWM OR DIA AT THE TIME OF PUBLISHING THIS ARTICLE***